Embed Size (px)
Citation preview
FOCUS: FROM MOBILITIES TO PROTEOMES
B-DNA Helix Stabilityin a Solvent-Free Environment
Erin Shammel Baker and Michael T. BowersDepartment of Chemistry and Biochemistry, University of California, Santa Barbara, California, USA
B-DNA is the most common DNA helix conformation under physiological conditions. However,when the amount of water in a DNA solution is decreased, B-to-A helix transitions have beenobserved. To understand what type of helix conformations exist in a solvent-free environment, aseries of poly d(CG)n and mixed sequence DNA duplexes from 18 to 30 bp were examined withcircular dichroism (CD), ESI-MS, ion mobility, and molecular dynamics. From the CD spectra, itwas observed that all sequences had B-form helices in solution. However, the solvent-free resultswere more complex. For the poly d(CG)n series, the 18 bp duplex had an A-form helixconformation, both A- and B-helices were present for the 22 bp duplex, and only B-helices wereobserved for the 26 and 30 bp duplexes. Since these sequences were all present as B-DNA insolution, the observed solvent-free structures illustrate that smaller helices with fewer base pairsconvert to A-DNA more easily than larger helices in the absence of solvent. A similar trend wasobserved for the mixed sequence duplexes where both an A- and B-helix were present for the 18bp duplex, while only B-helices occur for the larger 22, 26, and 30 bp duplexes. Since thesolvent-free B-helices appear at smaller sizes for the mixed sequences than for the pure d(CG)nduplexes, the pure d(CG)n duplexes have a greater A-philicity. (J Am Soc Mass Spectrom 2007,18, 1188–1195) © 2007 American Society for Mass Spectrometry
The crucial role DNA plays in encoding geneticinformation and in transporting it from one cellto another makes evaluating its structure and
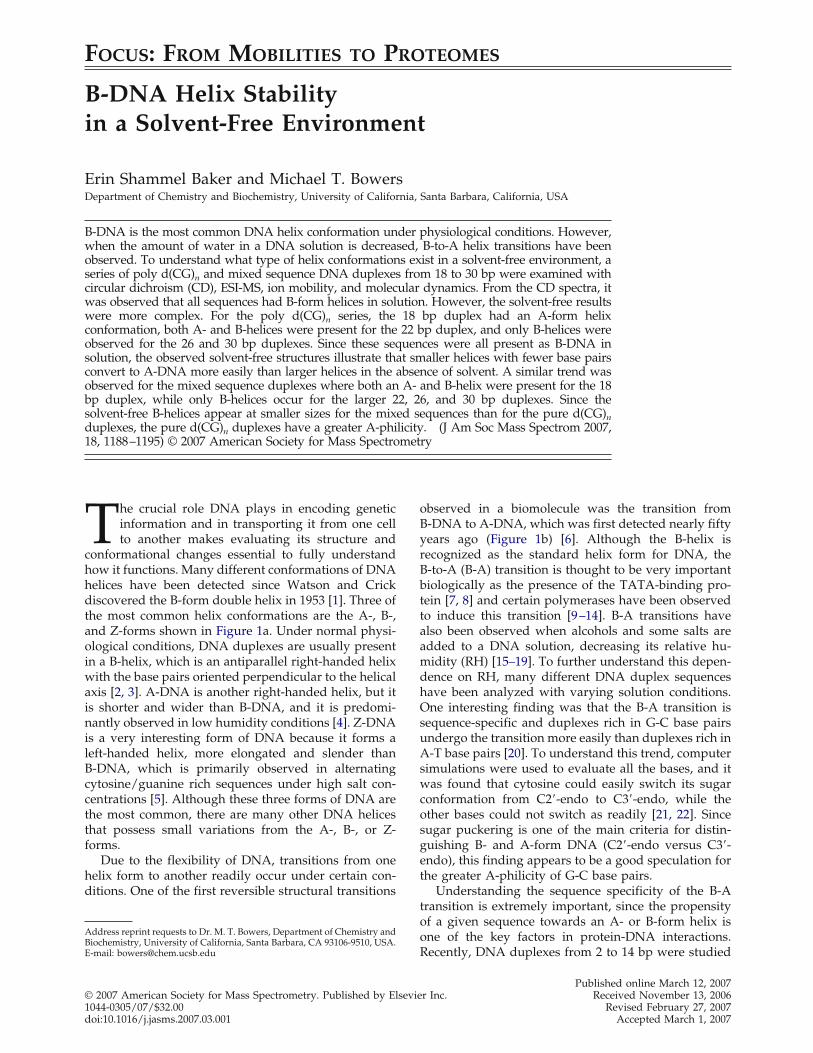
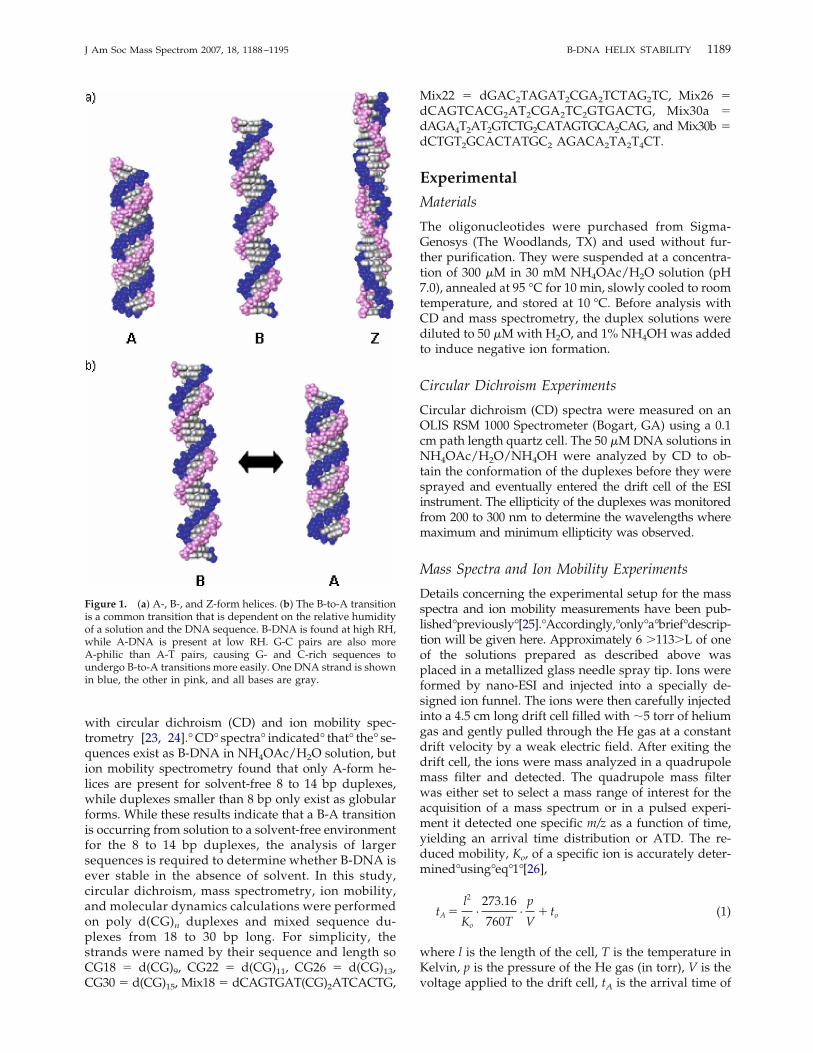
conformational changes essential to fully understandhow it functions. Many different conformations of DNAhelices have been detected since Watson and Crickdiscovered the B-form double helix in 1953 [1]. Three ofthe most common helix conformations are the A-, B-,and Z-forms shown in Figure 1a. Under normal physi-ological conditions, DNA duplexes are usually presentin a B-helix, which is an antiparallel right-handed helixwith the base pairs oriented perpendicular to the helicalaxis [2, 3]. A-DNA is another right-handed helix, but itis shorter and wider than B-DNA, and it is predomi-nantly observed in low humidity conditions [4]. Z-DNAis a very interesting form of DNA because it forms aleft-handed helix, more elongated and slender thanB-DNA, which is primarily observed in alternatingcytosine/guanine rich sequences under high salt con-centrations [5]. Although these three forms of DNA arethe most common, there are many other DNA helicesthat possess small variations from the A-, B-, or Z-forms.Due to the flexibility of DNA, transitions from one
helix form to another readily occur under certain con-ditions. One of the first reversible structural transitions
observed in a biomolecule was the transition fromB-DNA to A-DNA, which was first detected nearly fiftyyears ago (Figure 1b) [6]. Although the B-helix isrecognized as the standard helix form for DNA, theB-to-A (B-A) transition is thought to be very importantbiologically as the presence of the TATA-binding pro-tein [7, 8] and certain polymerases have been observedto induce this transition [9–14]. B-A transitions havealso been observed when alcohols and some salts areadded to a DNA solution, decreasing its relative hu-midity (RH) [15–19]. To further understand this depen-dence on RH, many different DNA duplex sequenceshave been analyzed with varying solution conditions.One interesting finding was that the B-A transition issequence-specific and duplexes rich in G-C base pairsundergo the transition more easily than duplexes rich inA-T base pairs [20]. To understand this trend, computersimulations were used to evaluate all the bases, and itwas found that cytosine could easily switch its sugarconformation from C2=-endo to C3=-endo, while theother bases could not switch as readily [21, 22]. Sincesugar puckering is one of the main criteria for distin-guishing B- and A-form DNA (C2=-endo versus C3=-endo), this finding appears to be a good speculation forthe greater A-philicity of G-C base pairs.Understanding the sequence specificity of the B-A
transition is extremely important, since the propensityof a given sequence towards an A- or B-form helix isone of the key factors in protein-DNA interactions.Recently, DNA duplexes from 2 to 14 bp were studied
Address reprint requests to Dr. M. T. Bowers, Department of Chemistry andBiochemistry, University of California, Santa Barbara, CA 93106-9510, USA.E-mail: [email protected]
Published online March 12, 2007© 2007 American Society for Mass Spectrometry. Published by Elsevier Inc. Received November 13, 20061044-0305/07/$32.00 Revised February 27, 2007doi:10.1016/j.jasms.2007.03.001 Accepted March 1, 2007
with circular dichroism (CD) and ion mobility spec-trometry [23, 24].°CD° spectra° indicated° that° the° se-quences exist as B-DNA in NH4OAc/H2O solution, bution mobility spectrometry found that only A-form he-lices are present for solvent-free 8 to 14 bp duplexes,while duplexes smaller than 8 bp only exist as globularforms. While these results indicate that a B-A transitionis occurring from solution to a solvent-free environmentfor the 8 to 14 bp duplexes, the analysis of largersequences is required to determine whether B-DNA isever stable in the absence of solvent. In this study,circular dichroism, mass spectrometry, ion mobility,and molecular dynamics calculations were performedon poly d(CG)n duplexes and mixed sequence du-plexes from 18 to 30 bp long. For simplicity, thestrands were named by their sequence and length soCG18 � d(CG)9, CG22 � d(CG)11, CG26 � d(CG)13,CG30 � d(CG)15, Mix18 � dCAGTGAT(CG)2ATCACTG,
Mix22 � dGAC2TAGAT2CGA2TCTAG2TC, Mix26 �dCAGTCACG2AT2CGA2TC2GTGACTG, Mix30a �dAGA4T2AT2GTCTG2CATAGTGCA2CAG, and Mix30b �dCTGT2GCACTATGC2 AGACA2TA2T4CT.
Experimental
Materials
The oligonucleotides were purchased from Sigma-Genosys (The Woodlands, TX) and used without fur-ther purification. They were suspended at a concentra-tion of 300 �M in 30 mM NH4OAc/H2O solution (pH7.0), annealed at 95 °C for 10 min, slowly cooled to roomtemperature, and stored at 10 °C. Before analysis withCD and mass spectrometry, the duplex solutions werediluted to 50 �Mwith H2O, and 1% NH4OH was addedto induce negative ion formation.
Circular Dichroism Experiments
Circular dichroism (CD) spectra were measured on anOLIS RSM 1000 Spectrometer (Bogart, GA) using a 0.1cm path length quartz cell. The 50 �MDNA solutions inNH4OAc/H2O/NH4OH were analyzed by CD to ob-tain the conformation of the duplexes before they weresprayed and eventually entered the drift cell of the ESIinstrument. The ellipticity of the duplexes was monitoredfrom 200 to 300 nm to determine the wavelengths wheremaximum and minimum ellipticity was observed.
Mass Spectra and Ion Mobility Experiments
Details concerning the experimental setup for the massspectra and ion mobility measurements have been pub-lished°previously°[25].°Accordingly,°only°a°brief°descrip-tion will be given here. Approximately 6 �113�L of oneof the solutions prepared as described above wasplaced in a metallized glass needle spray tip. Ions wereformed by nano-ESI and injected into a specially de-signed ion funnel. The ions were then carefully injectedinto a 4.5 cm long drift cell filled with �5 torr of heliumgas and gently pulled through the He gas at a constantdrift velocity by a weak electric field. After exiting thedrift cell, the ions were mass analyzed in a quadrupolemass filter and detected. The quadrupole mass filterwas either set to select a mass range of interest for theacquisition of a mass spectrum or in a pulsed experi-ment it detected one specific m/z as a function of time,yielding an arrival time distribution or ATD. The re-duced mobility, Ko, of a specific ion is accurately deter-mined°using°eq°1°[26],
tA �l2
Ko
·273.16
760T·
p
V� to (1)
where l is the length of the cell, T is the temperature inKelvin, p is the pressure of the He gas (in torr), V is thevoltage applied to the drift cell, tA is the arrival time of
Figure 1. (a) A-, B-, and Z-form helices. (b) The B-to-A transitionis a common transition that is dependent on the relative humidityof a solution and the DNA sequence. B-DNA is found at high RH,while A-DNA is present at low RH. G-C pairs are also moreA-philic than A-T pairs, causing G- and C-rich sequences toundergo B-to-A transitions more easily. One DNA strand is shownin blue, the other in pink, and all bases are gray.
1189J Am Soc Mass Spectrom 2007, 18, 1188–1195 B-DNA HELIX STABILITY

the ions taken from the center of the ATD peak, and to
is the amount of time the ion spends outside the driftcell before reaching the detector. A series of arrivaltimes is measured by changing the voltage applied tothe drift cell. A plot of tA versus p/V yields a straightline with a slope inversely proportional to Ko and anintercept of to. Once Ko is determined, the collisionalcross section of the ion, �, is calculated using eq 2,
� �3e
16No� 2�
�kbT�1⁄2 1Ko
(2)
where e is the charge of the ion, No is the numberdensity of He at STP, T is temperature, kb is Boltzmann’sconstant,°and°�°is°the°ion-He°reduced°mass°[26].
Theoretical Calculations
Structural information about the ions is obtained bycomparing the experimental cross sections determinedfrom the ATDs to calculated values of theoretical mod-els. Candidate structures of each duplex ion weregenerated°using°the°parm99°force°field°[27]°and°theAMBER° 7° [28]° set° of° programs.° Canonical° A-° andB-form helix starting geometries were created using theNUCGEN utility within AMBER and Z-forms weregenerated° using° HyperChem° [29].° 300° K° moleculardynamics simulations were run on each complex for 2ns using the AMBER 7 set of programs, and every 5 psa structure was saved. Each structure was then energy-minimized and its cross section calculated. For ionswith more than 200 atoms, collisional cross sectionswere calculated using hard-sphere scattering and tra-jectory°models°developed°by°the°Jarrold°group°[30,°31].In the calculations, the starting structures eventuallyconverged to give one or more steady-state structureswhere the cross section remains relatively constant. Theaverage cross sections of the final 50 to 100 structures ineach steady state were used for comparison with theexperimental values.The experimentally observed overall charge state of
the complexes is readily identified from the mass spec-tra, but the exact locations of the deprotonation sitesrequired for modeling are not known. Thus, the depro-tonation sites on the DNA were divided and dispersedamong the strands, with at least two neutral phosphategroups° between° every° deprotonated° group° [32–36].Multiple duplex structures were modeled with manydifferent deprotonation sites, but no theoretical differ-ences in cross section or conformation were observed asa function of charge location, consistent with previouslypublished°data°on°smaller°DNA°duplexes°[23,°37].
Results and Discussion
Circular Dichroism
Circular dichroism (CD) was utilized in determiningthe solution phase helix conformations of the sequences
studied. CD is able to characterize whether DNA has anA-, B-, or Z-form helix, since A-DNA has a maximumnear 265 nm, B-DNA has a maximum near 280 nm, andZ-DNA has a maximum near 260 nm as shown inFigure° 2b° [38–42].° A° typical° CD° spectrum° for° thesequences°analyzed°is°shown°in°Figure°2a.°All°of°thesequences studied had spectra indicative of B-DNAwith only small differences in the intensity of themaximum and minimum ellipticity were observed(longer sequences exhibit more intense maxima andminima, probably due to the additional base pairingand stacking interactions).
Mass Spectra
The nano-ESI mass spectra of CG18 and CG30 areshown°in°Figure°3.°Deprotonated°single°strands°andduplexes were present in the mass spectra for all of thesequences analyzed with NH4
� adducts to the right ofeach peak. Because the poly d(CG)n strands and some ofthe mixed sequences are self-complementary, care mustbe taken in assigning the peaks in the mass spectra.Duplexes with odd charge states can be unambiguously
Figure 2. (a) A typical CD spectrum for the 18 to 30 bp sequencesanalyzed. The spectra shown is for Mix22. (b) Expected CDspectra for A-DNA (red), B-DNA (blue), and Z-DNA (black).
1190 BAKER AND BOWERS J Am Soc Mass Spectrom 2007, 18, 1188–1195

identified, but the duplexes with even charge states mayalso correspond to single strands with half the chargestate. One interesting observation was that the mostabundant charge state of the duplexes in all of the massspectra collected was always equal to half the numberof base pairs (i.e., the most abundant peak for the 18 bpduplexes corresponds to the �9 charge state, while themost abundant peak for the 30 bp duplexes had a �15charge state).
Ion Mobility
To examine the conformational properties of the DNAduplexes, ion mobility experiments were performed. Ineach case, the appropriate ion for each complex wasgently injected into the drift cell and its ATD collected.
Poly d(CG)n Duplexes
ATDs for the CG18, CG22, CG26, and CG30 duplexes intheir most abundant odd charge states are shown inFigure°4.°The°other°less°abundant°odd°charge°states°foreach duplex gave ATDs similar to those shown inFigure°4,°while°the°even°charge°states°were°not°ana-lyzed because of the presence of single strands. Singlepeaks were observed in the ATDs for the CG18 and
CG26 duplexes, indicating that most likely only onefamily of conformers is present. However, two peakswere present for the CG22 and CG30 duplexes, indica-tive of two conformations, suggesting that some type ofconformational change is occurring at these sequencelengths. The collision cross sections of the most abun-dant°charge°state°for°each°duplex°are°listed°in°Table°1.Cross sections for the other odd charge-state duplexespresent in the mass spectra were also evaluated, and itwas found that as the charge state of each complexbecomes more negative, an enlargement in cross sectionof �1% per odd charge state occurs. These results areshown°for°the°22°and°26°bp°duplexes°in°Table°2.°Asobserved from other biological systems studied withion°mobility°and°theoretical°calculations°[43,°44],°thisincrease in cross section is due to the increase in chargerepulsion between strands. Thus, only the lowest chargestate duplex structures were analyzed theoretically.Theoretical modeling was utilized to understand
Figure 3. Nano-ESI mass spectra for (a) CG18 and (b) CG30.Single-strand and duplex peaks were observed for all sequencesanalyzed and the most abundant duplex peak always had a chargestate of half the number of base pairs. SS is the abbreviation forsingle strand.
Figure 4. ATDs for the 18, 22, 26, and 30 bp poly d(CG) duplexes.The labels A, B1, and B2 refer to the type of helix observed (seetext).
1191J Am Soc Mass Spectrom 2007, 18, 1188–1195 B-DNA HELIX STABILITY

why two conformations were present for the CG22 andCG30 duplexes, while only one conformer occurred forthe other duplexes. To evaluate these conformations,A-, B-, and Z-form helices for each duplex were ana-lyzed with 300 K molecular dynamics simulations. Onlyone steady state was observed in the dynamics plots forall of the A-, B-, and Z-form helices, except when aB-helix starting structure was used for (CG30)2. Anexample plot of cross section versus time with onesteady° state° is° shown° in° Figure° 5a° for° the° B-helixstarting structure of (CG18)2, and the dynamics plot forthe B-helix starting structure of (CG30)2 with twosteady°states°is°shown°in°Figure°5b.°The°average°crosssection of the final 50 to 100 structures for each steadystate°is°listed°in°Table°1.When the theoretical structures for the different helix
forms of each duplex were analyzed, it was found thatthe resulting helices at the end of the dynamics simu-lations were similar to the starting solution helices forthe A- and Z-forms. However, the B-form helices for theCG18, CG22, and CG26 duplexes were different fromtheir starting solution helices as they all had a bend near
the end of their helices. Two forms of the CG30 B-formhelix°were°observed°in°the°dynamics°plot°in°Figure°5b,where the initial B2 conformer (2240 Å
2 is similar instructure to the solution B-helix, but after �200 ps itconverts into a helix with a bend at the end (B1conformer, 1950 Å2, analogous to the solvent-free B-form helices for the smaller poly d(CG)n duplexes. TheB2 conformation for CG30 is considered a steady-statestructure in dynamics calculation because it endures fora significant time before isomerizing to B1. It doesappear that the AMBER force field predicts B1 to bemore stable than B2 based on our 2 nanosecond simu-lation but that may either be a force field effect orattributable to the necessarily limited time of the dy-namics run. Clearly, the B2 conformer is observedexperimentally supporting its long-term stability (seebelow). Conversely, in the simulations for CG18, CG22and CG26, the solution form B-helix starting structure
Table 1. Experimental and theoretical cross sections (Å2) of theduplexes
Duplex Expta
Theorybcd
A-helix B-helix Z-helix
[(CG18)2 – 9H]9� 1268 1254 1221 1305[(CG22)2 – 11H]11� 1403
1558 1395 1549 1600[(CG26)2 – 13H]13� 1763 1635 1750 1720[(CG30)2 – 15H]15� 1948 1950
2249 1875 2240 2000[(Mix18)2 – 9H]9� 1227
1319 1221 1315 1263[(Mix22)2 – 11H]11� 1529 1486 1524 1458[(Mix26)2 – 13H]13� 1776 1764
2020 1676 2035 1812[Mix30a · Mix30b – 15H]15� 2203 2190
2406 1950 2375 2070
a1% reproducibility error.b�2% standard deviation.cSimilar cross sections were observed for the duplexes of other oddcharge states.dTwo different families of B-helices were observed (see text and Figure 6).
Table 2. Experimental cross sections (Å2) of 22 and 26 bpduplexes versus charge statea
Duplex
Charge state
�11 �13 �15
(CG22)2 1403 14111558 1567 –
(Mix22)2 1529 1542 –(CG26)2 – 1763 1779(Mix26)2 1776 1784
– 2020 2031
a1% reproducibility error.
Figure 5. 300 K dynamics plots of cross section versus dynamicstime for (a) the CG18 duplex and (b) the CG30 duplex. In bothcases, a solution form B-helix starting structure was used. Onlyone steady state was observed for the CG18 duplex, but twosteady states were present for the CG30 duplex. The dynamicssimulations were run for 2 ns and every 5 ps a structure was savedand its cross section calculated. Analysis of the resulting structuresallowed the structural assignments given in the Figure (see textand°Figure°6).
1192 BAKER AND BOWERS J Am Soc Mass Spectrom 2007, 18, 1188–1195

immediately converts to a single B-form helix andretains that structure for the entire dynamics run.When the experimental cross sections for the du-
plexes were compared with their theoretical values, atrend was observed for the data. A-form helices corre-lated with the experimental cross sections for (CG18)2and the shortest time peak for (CG22)2. However, thelonger time peak for (CG22)2 agreed with a bent B-formhelix (termed B1), indicating that at the 22 bp lengthB-DNA is finally stable in a solution-free environment.The single peak for (CG26)2 and the two experimentalcross sections for (CG30)2 also correlate with B-helices:the bent B1 form matched with the experimental crosssection for (CG26)2 and the shorter time peak in the(CG30)2 ATD, and the near solution B2 form correlatedwith the cross section for the longer time ATD peak for(CG30)2. The model A- and Z-form helices for (CG26)2and (CG30)2 did not agree with any of the measuredcross sections. Theoretical structures for the helices thatcorrelated with the experimental cross sections of eachsequence°are°illustrated°in°Figure°6.Previous ion mobility data have illustrated that sol-
vent-free helices first appear for the 8 bp poly d(CG)duplex, while smaller duplexes only occur as globularstructures° [23].° This° data° also° showed° that° for° the
d(CG)n sequences from 8 to 18 bp duplex, a B-Atransition occurred from solution to the solvent-freeenvironment°of°the°experiment°(Figure°7a).°This°B-Atransition has been observed for other small DNAduplexes when the relative humidity of the solution isdecreased°[45–48],°so°it°is°not°unreasonable°to°presumethat smaller duplexes can change from a B-form to anA-form during the desolvation process that occurs inESI. However, in this study we observed that for theCG22 duplex both an A- and B-form are present in theexperiment and only B-DNA is present in d(CG)nduplexes longer than 22 bp. From these results, appar-ently larger duplexes with increased base pair stackingare able to retain their B-form helix throughout thedesolvation and analysis process, resulting in an onlymodestly transformed B-form helix at the end of theexperiment.°Figure°7b°illustrates°this°trend.
Mixed Sequence Duplexes
Since it has been observed that sequences rich in G-Cpairs are more A-philic than sequences rich in A-Tpairs, the helix forms of sequences with A-T pairs mustbe evaluated to understand how sequence compositioneffects° the° solvent-free° B-A° transition° [20–22].° TheATDs for a series of mixed duplexes in their most odd
Figure 6. Theoretical structures from the 300 K dynamics for the(a) CG18, (b) CG22, (c) CG26, and (d) CG30 duplexes that matchthe experimental cross sections. One strand is blue and the otheris pink.
Figure 7. Summary of the poly d(CG) duplexes analyzed. (a) Forthe CG duplexes from 8 bp to 18 bp, only A-form helices wereobserved without solvent. (b) The first B-form helix was observedfor CG duplexes at 22 bp and B-helices were detected exclusivelyat 26 bp and above.
1193J Am Soc Mass Spectrom 2007, 18, 1188–1195 B-DNA HELIX STABILITY

abundant°charge°states°are°shown°in°Figure°8.°Similar°tothe poly d(CG)n duplexes, the less abundant odd chargestates for each duplex gave ATDs similar to thoseshown. The even charge states were not analyzedbecause of the presence of single strands. Two peakswere observed in all of the ATDs for the mixed du-plexes, except for the Mix22 duplex, which only had asingle peak. The experimental cross sections are givenin°Table°1.Theoretical modeling was utilized to understand the
helix conformations of the mixed sequence duplexes.Only one steady state was observed in the dynamicsplots for all of the A-, B-, and Z-form helices, except theB-forms of the Mix26 and Mix30 duplexes, which dis-played two steady states similar to the CG30 duplex inFigure°5b.°The°average°cross°section°of°each°form°isgiven°in°Table°1.°When°the°theoretical°cross°sectionswere compared with the experimental values for eachduplex, the shorter time peak for the Mix18 duplexmatched the A-helix and the longer peak agreed with aB-form helix. However, the Mix22, Mix26, and Mix30duplexes only correlated with B-form helices. The DNAhelices that match the experimental cross sections are
shown°in°Figure°9.°The°two°theoretical°B-helix°struc-tures for the Mix26 andMix30 duplexes, B1 and B2, wereanalyzed to determine the conformational change oc-curring. Analogous to (CG30)2, the larger conformer(B2) was an elongated helix similar to the solutionB-helix, while the smaller conformer (B1) had a bentend. When these two conformers were compared withthe two experimental cross sections, the B1 conformersagreed with the smaller value and the B2 structuresmatched the larger cross sections for both the Mix26and Mix30 duplexes.When the results from the solvent-free poly d(CG)n
helices and mixed helices were compared, an importantfinding was observed. Both sequence types have A-form helices present at smaller sequence lengths. How-ever, B-form helices first appear at 18 bp for the mixedsequence duplexes, while B-helices are not present forthe poly d(CG)n helices until 22 bp. Since B-DNA isobserved at smaller helix sizes in the mixed sequenceduplexes (with some A-T pairs) than for the pured(CG)n duplexes, it can be concluded that the solutiontrend of G-C pairs being more A-philic than A-T pairs isalso relevant to the solvent-free helices and conse-quently is an intrinsic property of the duplexes, not asolvent effect.
Summary
The mass spectrometry, ion mobility, and moleculardynamics results presented provide insight into thesize- and sequence-dependent conformations of DNA
Figure 8. ATDs for the mixed 18, 22, 26, and 30 bp duplexes. Thelabels A, B1, and B2 refer to the type of helix observed (see text andFigure°9).
Figure 9. Theoretical structures from the 300 K dynamics for the(a) Mix18, (b) Mix22, (c) Mix26, and (d) Mix30 duplexes that matchthe experimental cross sections. One strand is dark blue and theother is light blue.
1194 BAKER AND BOWERS J Am Soc Mass Spectrom 2007, 18, 1188–1195

helices upon dehydration. The main conclusions areillustrated below.(1) d(CG)n duplexes between 8 and 18 bp have
B-form helices in solution and convert to an A-formhelix in a solvent-free environment. However, startingat the 22 bp duplex, a bent form B-helix becomes stablewithout solvent and at 30 bp a solution like B-helix firstappears.(2) For the mixed sequences with both C-G and A-T
pairs, the bent B-form helix becomes stable at the 18 bpduplex and the solution form B-helix at the 26 bpduplex, indicating that A-T pairs are less A-philic thanC-G pairs. This is an intrinsic property and not a solventeffect.(3) Solution B-form helices are conserved without
solvent, but the length at which the helices are pre-served is sequence- and size-dependent.
AcknowledgmentsThe authors gratefully acknowledge the support of the NationalScience Foundation under grant CHE-0503728.
References1. Watson, J. D.; Crick, F. H. Molecular Structure of Nucleic Acids: AStructure for Deoxyribose Nucleic Acid. Nature 1953, 171, 737.
2. Langridge, R.; Wilson, H. R.; Hooper, C. W.; Wilkins, M. H. F.;Hamilton, L. D. The Molecular Configuration of Deoxyribonucleic Acid.I. X-ray Diffraction Study of a Crystalline Form of the Lithium Salt. J.Mol. Biol. 1960, 2, 19–37.
3. Langridge, R.; Marvin, D. A.; Seeds, W. E.; Wilson, H. R.; Hamilton,L. D. The Molecular Configuration of Deoxyribonucleic Acid. II. Mo-lecular Models and their Fourier Transforms. J. Mol. Biol. 1960, 2, 38.
4. Fuller, W.; Wilkins, M. H. F.; Wilson, H. R.; Hamilton, L. D.; Arnott, S.The Molecular Configuration of Deoxyribonucleic Acid. IV. X-rayDiffraction Study of the A Form. J. Mol. Biol. 1965, 12, 60.
5. Wang, A. H. J.; Quigley, G. J.; Kolpak, F. J.; Crawford, J. L.; vanBoom,J. H.; van der Marel, G.; Rich, A. Molecular Structure of a Left-HandedDouble Helical DNA Fragment at Atomic Resolution. Nature 1979, 282,680.
6. Franklin, R. E.; Gosling, R. G. The structure of sodium thymonucleatefibers. I. The influence of water content. Acta Crystallogr. 1953, 6, 673.
7. Kim, Y.; Geiger, J. H.; Hahn, S.; Sigler, P. B. Crystal Structure of a YeastTBP/TATA-Box Complex. Nature 1993, 365, 512.
8. Kim, J. L.; Nikolov, D. B.; Burley, S. K. Cocrystal Structure of TBPRecognizing the minor groove of a TATA element.Nature 1993, 365, 520.
9. Florentiev, V. L.; Ivanov, V. I. RNA Polymerase: Two-step Mechanismwith Overlapping Steps. Nature 1970, 228, 519.
10. Beabealashvily, R. S.; Ivanov, V. I.; Minchenkova, L. E.; Savotchkina, L.P. RNA polymerase-DNA complexes I. The study of the conformationof nucleic acids at the growing point of RNA in an RNA polymerase-DNA system. Biochim. Biophys. Acta 1972, 259, 35.
11. Setlow, P. DNA in dormant spores of Bacillus species is in an A-likeconformation. Mol. Microbiol. 1992, 6, 563.
12. Ivanov, V. I.; Minchenkova, L. E.; Chernov, B. K.; McPhie, P.; Ryu, S.;Garges, S.; Barber, A. M.; Zhurkin, V. B.; Adhya, S. CRP-DNA Com-plexes: Inducing the A-like Form in the Binding Sites with an ExtendedCentral Spacer. J. Mol. Biol. 1995, 245, 228.
13. Eom, S. H.; Wang, J.; Steitz, T. A. Structure of Taq polymerase with DNAat the Polymerase Active Site. Nature 1996, 382, 278.
14. Jones, S.; Heyningen, P.; Berman, H. M.; Thornton, J. M. Protein-DNAInteractions: A Structural Analysis. J. Mol. Biol. 1999, 287, 877.
15. Brahm, J.; Mommaerts, W. F. H. M. A Study of Conformation of NucleicAcids in Solution by Means of Circular Dichroism. J. Mol. Biol. 1964, 10,73.
16. Ivanov, V. I.; Minchenkova, L. E.; Minyat, E. E.; Frank-Kamenetskii,M. D.; Schyolkina, A. K. The B to A Transition of DNA in Solution.J. Mol. Biol. 1974, 87, 817.
17. Vorlickova, M.; Minyat, E. E.; Kypr, J. Cooperative Changes in theChiroptical Properties of DNA Induced by Methanol. Biopolymers, 1984,23, 1.
18. Minyat, E. E.; Ivanov, V. I.; Kritzyn, A. M.; Minchenkova, L. E.;Schyolkina, A. K. Spermine and Spermidine-Induced B to A Transitionof DNA in Solution. J. Mol. Biol. 1978, 128, 397.
19. Xu, Q.; Shoemaker, R. K.; Braunlin, W. H. Induction of B-A transitionsof Deoxyoligonucleotides by Multivalent Cations in Dilute AqueousSolution Biophys. J. 1993, 65, 1039.
20. Ivanov, V. I.; Minchenkova, L. E. The A-form of DNA—In search ofBiological Role (A Review). Mol. Biol. 1995, 28, 780.
21. Gorin, A. A.; Ulyanov, N. B.; Zhurkin, V. B. S-N Transition of the SugarRing in B-form DNA. Mol. Biol. 1990, 24, 1036.
22. Foloppe, N.; MacKerell, A. D. Intrinsic Conformational Properties ofDeoxyribonucleosides: Implicated Role for Cytosine in the EquilibriumAmong the A, B, and Z Forms of DNA. Biophys. J. 1999, 76, 3206.
23. Gidden, J.; Ferzoco, A. Baker, E. S.; Bowers, M. T. Duplex Formation andthe Onset of Helicity in Poly d(CG)n Oligonucleotides in a Solvent-FreeEnvironment J. Am. Chem. Soc. 2004, 126, 15132.
24. Gidden, J.; Baker, E. S.; Ferzoco, A.; Bowers, M. T. Structural Motifs ofDNA Complexes in the Gas Phase Int. J. Mass Spectrom. 2005, 240, 183.
25. Wyttenbach, T.; Kemper, P. R.; Bowers, M. T. Design of a NewElectrospray Ion Mobility Mass Spectrometer Int. J. Mass Spectrom. 2001,212, 13.
26. Mason, E. A.; McDaniel, E. W. Transport Properties of Ions in Gases;Wiley: New York, NY, 1988.
27. Cheatham, T. E.; Cieplak, P.; Kollman, P. A. J. Biomol. Struct. Dyn. 1999,16, 8458.
28. Case, D. A.; Pearlman, D. A.; Caldwell, J. W.; Cheatham T. E., III; Wang,J.; Ross, W. S.; Simmerling, C. L.; Darden, T. A.; Merz, K. M.; Stanton,R. V.; Cheng, A. L.; Vincent, J. J.; Crowley, M.; Tsui, V.; Gohlke, H.;Radmer, R. J.; Duan, Y.; Pitera, J.; Massova, I.; Seibel, G. L.; Singh, U. C.;Weiner, P. K.; Kollman, P. A. AMBER 7; University of California: SanFrancisco, CA, 2002.
29. HyperChem 7.0; Hypercube Inc., Gainesville, FL.30. Mesleh, M. F.; Hunter, J. M.; Shvartsburg, A. A.; Schwartz, G. C.;
Jarrold, M. F. Structural Information from Ion Mobility Measurements:Effects of the Long-Range Potential J. Phys. Chem. 1996, 100, 16082.
31. Shvartsburg, A. A.; Jarrold, M. F. An Exact Hard-Spheres ScatteringModel for the Mobilities of Polyatomic Ions. Chem. Phys. Lett. 1996, 261,86.
32. Maher, L. J.; Wold, B.; Dervan, P. B. Inhibition of DNA Binding Proteinsby Oligonucleotide-Directed Triple Helix Formation. Science 1989, 245,725.
33. Demidov, V. V.; Potaman, V. N.; Frank-Kamenetskii, M. D.; Egholm. M.;Buchard, O.; Sönnichsen, S. H.; Nielsen, P. E. Stability of PeptideNucleic Acids in Human Serum and Cellular Extracts. Biochem. Phar-macol. 1994, 48, 1310.
34. Tyagi, S.; Kramer, F. R. Molecular Beacons: Probes that Fluoresce uponHybridization. Nat. Biotechnol. 1996, 14, 303.
35. Holland, P. M.; Abramson, R. D.; Watson, R.; Gefland, D. H. Detectionof Specific Polymerase Chain Reaction Product by Utilizing the 5=¡3=Exonuclease Activity of Thermus aquaticus DNA Polymerase. Proc. Natl.Acad. Sci. U.S.A. 1991, 88, 7276.
36. Thelwell, N.; Millington, S.; Solinas, A.; Booth, J.; Brown, T. Mode ofAction and Application of Scorpion Primers to Mutation Detection.Nucleic Acids Res. 2000, 28, 3752.
37. Rueda, M.; Kalko, S. G.; Luque, F. J.; Orozco, M. The Structure andDynamics of DNA in the Gas Phase. J. Am. Chem. Soc. 2003, 125, 8007.
38. Veenstra, T. D. Electrospray Ionization Mass Spectrometry: A Promis-ing New Technique in the Study of Protein/DNA Noncovalent Com-plexes. Biochem. Biophys. Res. Commun. 1999, 257, 1.
39. Riazance, J. H.; Baase, W. A.; Johnson, W. C., Jr.; Hall, K.; Cruz, P.;Tinoco, I., Jr. Evidence for Z-form RNA by vacuum UV circulardichroism. Nucleic Acids Res. 1985, 13, 4983.
40. Segersnolten, G.M.J.; Sijtsema, N. M.; Otto, C. Evidence for HoogsteenGC Base Pairs in the Proton-Induced Transition from Right-Handed toLeft-Handed Poly(dG-dC)·Poly(dG-dC). Biochemistry 1997, 36, 13241.
41. Poehl, F. M.; Jovin, T. M. Salt-Induced Cooperative ConformationalChange of a Synthetic DNA: Equilibrium and Kinetic Studies withPoly(dG-dC). J. Mol. Biol. 1972, 67, 375.
42. Trantirek, L.; Stefl, R.; Vorlickova, M.; Koca, J.; Sklenar, V.; Kypr, J. AnA-type Double Helix of DNA Having B-Type Puckering of the Deoxyri-bose Rings. J. Mol. Biol. 2000, 297, 907.
43. Baker, E. S.; Hong, J. W.; Gaylord, B. S.; Bazan, G. C.; Bowers, M. T.PNA/dsDNA Complexes: Site-Specific Binding and dsDNA BiosensorApplications. J. Am. Chem. Soc. 2006, 128, 8484.
44. Baker, E. S.; Bernstein, S. L.; Gabelica, V.; De Pauw, E.; Bowers, M. T.G-Quadruplexes in Telomeric Repeats Are Conserved in a Solvent-FreeEnvironment. Int. J. Mass Spectrom. 2006, 253, 225.
45. Schnier, P. D.; Klassen, J. S.; Strittmatter, E. F.; Williams, E. R. ActivationEnergies for Dissociation of Double Strand Oligonucleotide Anions:Evidence for Watson-Crick Base Pairing in Vacuo. J. Am. Chem. Soc.1998, 120, 9605.
46. Gabelica, V.; De Pauw, E. Comparison Between Solution-Phase Stabilityand Gas-Phase Kinetic Stability of Oligodeoxynucleotide Duplexes.J. Mass Spectrom. 2001, 36, 397.
47. Gabelica, V.; Rosu, F.; Houssier, C.; De Pauw, E. Gas-Phase ThermalDenaturation of an Oligonucleotide Duplex and Its Complexes withMinor Groove Binders. Rapid Commun. Mass Spectrom. 2000, 14, 464.
48. Gabelica, V.; De Pauw, E. Collision-Induced Dissociation of 16-merDNA Duplexes with Various Sequences: Evidence for Conservation ofthe Double Helix Conformation in the Gas Phase. Int. J. Mass Spectrom.2002, 219, 151.
1195J Am Soc Mass Spectrom 2007, 18, 1188–1195 B-DNA HELIX STABILITY