Embed Size (px)
Citation preview
Azerbaijan’s Current and Potential Comparative
Advantage: An Exploratory Study
Lal K. Almas, Ph.D. Fulbright Scholar and Professor of
Agricultural Business and Economics
Department of Agricultural Sciences
West Texas A&M University, Canyon, TX USA
and
Nazim Uzbey Hajiyev, Ph.D. Associate Professor and Chief of division in
Research Institute for Economic Studies,
Azerbaijan State University of Economics
Baku, Azerbaijan
[email protected] and [email protected]
Selected Paper prepared for presentation at the
International Conference on Policy Modeling (EcoMod 2013)
Prague, Czech Republic, July 1-3, 2013
Copyright 2013 by Lal K. Almas and Nazim U. Hajiyev. All rights reserved. Readers may
make verbatim copies of this document for non-commercial purposes by any means, provided
that this copyright notice appears on all such copies.
Azerbaijan’s Current and Potential Comparative
Advantage: An Exploratory Study
Abstract
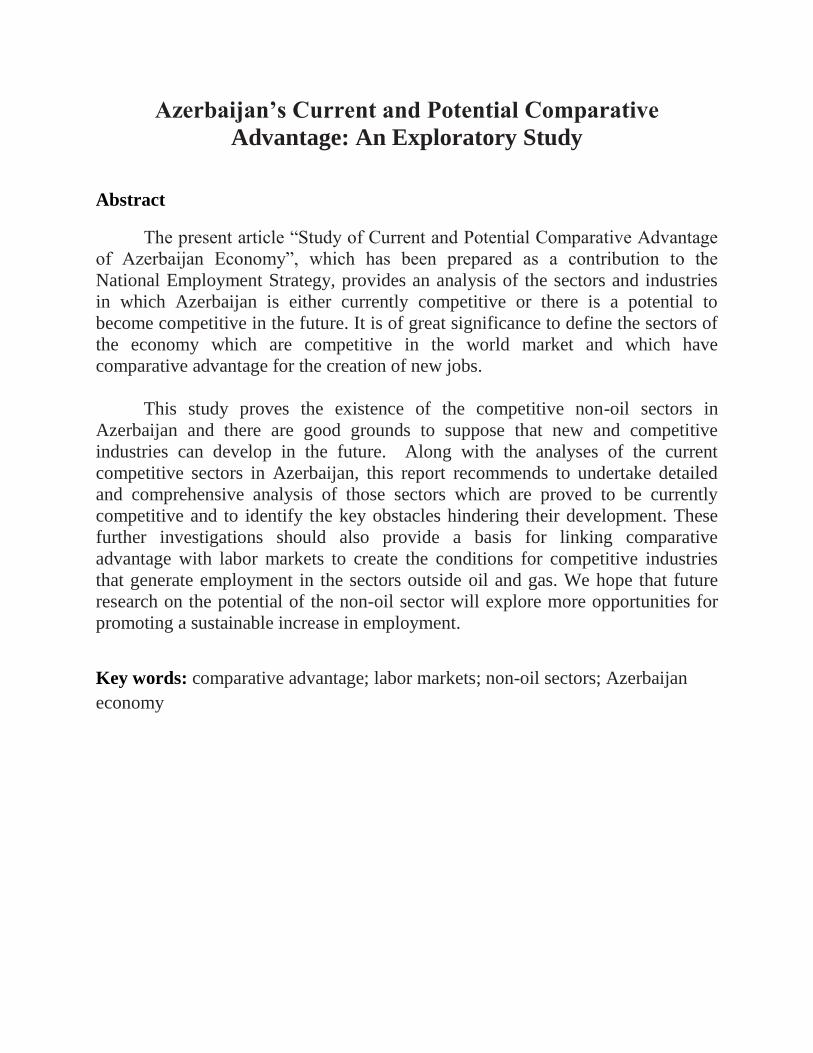
The present article “Study of Current and Potential Comparative Advantage
of Azerbaijan Economy”, which has been prepared as a contribution to the
National Employment Strategy, provides an analysis of the sectors and industries
in which Azerbaijan is either currently competitive or there is a potential to
become competitive in the future. It is of great significance to define the sectors of
the economy which are competitive in the world market and which have
comparative advantage for the creation of new jobs.
This study proves the existence of the competitive non-oil sectors in
Azerbaijan and there are good grounds to suppose that new and competitive
industries can develop in the future. Along with the analyses of the current
competitive sectors in Azerbaijan, this report recommends to undertake detailed
and comprehensive analysis of those sectors which are proved to be currently
competitive and to identify the key obstacles hindering their development. These
further investigations should also provide a basis for linking comparative
advantage with labor markets to create the conditions for competitive industries
that generate employment in the sectors outside oil and gas. We hope that future
research on the potential of the non-oil sector will explore more opportunities for
promoting a sustainable increase in employment.
Key words: comparative advantage; labor markets; non-oil sectors; Azerbaijan
economy
Azerbaijan’s Current and Potential Comparative
Advantage: An Exploratory Study
Introduction
Azerbaijan gained its independence from the Soviet Union in 1991, but the country
continues to face considerable problems in making the transition from a command
to a market economy, including the loss of its traditional markets, the need to
diversify its economy, excessive bureaucratic regulation, and the slow pace of
structural reforms.
Azerbaijan is an industrial-agricultural republic. The diversified economy of
Azerbaijan is based on the use of rich and various mineral reserves. Besides oil and
gas, the reserves of iron ore, zinc ore, molybdenum ore, aluminum, rock salt,
boring waters containing iodine and bromine, gypsum, lime stone, bitumen, clay,
and marble are used in industrial exploitation, including, hydro-electric power
resources.
The agriculture of the Republic is specialized in the cultivation of vegetables,
fruits, cotton, tobacco, subtropical cultures, silkworm and sheep breeding.
Accordingly, special place in the industrial structure of the country is shared by the
fields busy with primary processing of the agricultural raw material.
Azerbaijan possesses considerable labor manpower reserves, as the result of
natural accretion of population. A far-flung transport network supplies the
developing economic relations of Azerbaijan with foreign countries. Azerbaijan is
distinguished as an area of oil extraction and refining, chemical, electromechanical
industries, oil engineering and machine building, ferrous and nonferrous
metallurgy industries, production of building materials, light and food industries.
The main sections of the Republic's economy are the branches of heavy industry
and industry on the whole.
Today Oil sector generates 42.0 per cent of the gross domestic product, but only
0.9 per cent of all jobs. That's why, today encouraging new businesses in non-oil
sector and spur economic development is one of the biggest challenges of the
Government of Azerbaijan.

The Government of Azerbaijan with the support of international organizations
(UNDP, ILO) developed an Employment Strategy for the solving of these
problems. The creation of new jobs and the upgrading of existing jobs have been a
key focus of the Government of Azerbaijan.
An Employment Strategy must be developed on the base of results of scientifically
justified researches and analyses. It is of great importance to define the sectors
(products) and sub-sectors of economy which are competitive in world markets and
which have potential comparative advantage for the creation of new jobs. And
today the question of which Azerbaijani products have a comparative advantage is
becoming increasingly relevant and important as the world markets become more
and more competitive.
This study provides an analysis of the sectors and industries in which Azerbaijan is
either currently competitive or for which there is initial evidence that it might have
the potential to become competitive in the future. There are four main objectives
that this analysis is intended to address. These are:
1. Competition and Trade Policy. In discussion with respect to the employment
strategy the need for Azerbaijan to develop a solid base of non-oil sectors which
are internationally competitive was widely recognized. To do this it is necessary to
create an environment of competition by removing barriers to competition both
between Azerbaijani firms and with respect to foreign competitors. However, the
Government of Azerbaijan, like many governments in other countries is likely to
have concerns with respect to opening national markets to domestic and foreign
competition.
In any country it is easy to identify those sectors of the economy that are likely to
be adversely affected by policy liberalization. That is, it is usually easy to see
where firm closures and job losses are likely to occur in those industries which are
hopelessly uncompetitive. These are obvious to any government because these
Industries actually exist.
However, what is much harder for governments to see is that liberalization does
not just destroy jobs in existing, uncompetitive industries but also creates new jobs
in competitive new or expanding industries. Overall, Azerbaijan's economy would
be better off if existing uncompetitive sectors could be replaced with competitive
new sectors or the expansion of existing competitive ones. The problem for
Government is that the loss of jobs in uncompetitive sectors is easy to see but the

Creation of new jobs by sectors which either do not exist at present or exist on a
small scale is much harder to conceive.
The first objective of this study is, therefore, to assess whether there is a realistic
possibility of competitive sectors developing in Azerbaijan. It does not and cannot
provide any firm evidence or guarantee that specific sectors will develop. What it
is intended to do is to reassure the government that there is in general a realistic
prospect that the effects of liberalizing competition and trade will include long
term increases in jobs in new or expanded industries as well as short term losses in
jobs in uncompetitive ones.
2. Removing Constraints to Business. The Employment Strategy and earlier
studies of business in Azerbaijan have provided much useful insight concerning the
obstacles and constraints affecting existing business in Azerbaijan. However, this
analysis needs to be extended and developed further. In particular, the question
needs to be asked: “What has prevented new competitive industries developing in
Azerbaijan and what has prevented existing sectors which are currently
competitive from operating on a larger scale?” To do this requires some broad idea
of where Azerbaijan's current and potential advantages lie. This study is intended
to provide this basis for further identifying the key constraints involved and in
developing policy responses to remove them.
3. Promoting Inward Foreign Direct Investment. Given the small size of
Azerbaijan's economy many possible foreign investors are only likely to be
interested in Azerbaijan if it offers the potential to produce competitively for
export to other markets. However, for such projects Azerbaijan is just one of many
locations that investors could choose. To select their preferred location investors
must therefore choose between many locations, many of which they will have very
limited information about.
To attract such investors, investment promotion agencies in many countries
provide a broad list of sectors which potential investors might consider further.
This does not provide investors with any firm or certain “winners” but simply
helps investors to identify which sectors in Azerbaijan might be worth undertaking
a much more detailed investigation of feasible projects. A further objective of this
study is to provide such a “first screening” for the purposes of investment
promotion.
4. Removing Interventionism. This study is intended to produce a broad and
general assessment of what the structure of production might be in Azerbaijan
under free competition and trade. It is not intended as and can never serve as a
basis for picking winners. The establishment of new state enterprises in any sectors
identified as competitive or potentially competitive would be most unlikely to
succeed. Using public funds rather than the investors own funds removes key
incentives for entrepreneurship and efficiency with the results that such firms
would be much less likely to be competitive. Creating publicly owned firms also
creates incentives for the government to protect them against both domestic and
foreign competition precisely the opposite of what this study seeks to show is
needed to develop competitive industry.
Likewise this study could be misinterpreted as providing the basis not for direct
government ownership of business but for a policy of steering or interventionism.
For the same reasons – that protecting, subsidizing or otherwise distorting market
incentive inhibits rather than encourages competitiveness - the intention of this
study is the opposite. The study seeks to demonstrate that Azerbaijan has less to
fear and more to gain from liberalized markets than is currently supposed.
The first section provides an overview of the relevant economic theories of
international trade, including the theory of comparative advantage. The
methodology and data are explained in Section 2, while Section 3 presents and
discusses the results, including the, Balassa RCA index and net export ratios and
Finger and Krein index. Section 4 concludes the paper.
1. Overview of economic theories of international trade
1.1 International trade and comparative advantage
The theory of comparative advantage is one of the oldest economic theories of
trade, dating from David Ricardo (1817). To this date it remains the dominant
explanation of why any country would specialize in exporting certain categories of
goods and services and in importing others. It can be seen as a cost-based
explanation of international trade.
The earliest theory of international trade and of absolute advantage was put
forward by Adam Smith (1766). Smith argued that countries will tend to export
those goods or services which they are capable of producing more cheaply than
their trading partners and tend to import those which they are only capable of
producing more expensively. Ricardo's first contribution was to show that such
trade does not depend so much on differences between countries in the prices of
individual goods and services but on differences in the prices of one good or
service relative to another. Accordingly Ricardo's theory of comparative advantage
predicts that countries export goods which they are capable of producing relatively
cheaply compared to their trading partners and import goods which they are
capable of producing relatively more expensively.
It is easy to see how a country which is capable of producing a good or service
more cheaply than other countries would export it. Extending this from absolute to
relative prices is more complex but still comparatively straightforward.
Unfortunately, interpreting comparative advantage is more complex. In this context
being capable of producing a good more cheaply does not mean that we can simply
check the current relative prices of different goods or services and expect them to
match up with observed trade flows. This is because international trade itself
changes the prices of goods and services. Many goods and services are traded at
world prices which bear no necessary relationship to domestic cost conditions. The
term “capable of producing” particular country was wholly isolated from world
trade. Since it is difficult to think of many cases were individual countries have
ever been so isolated it is impossible to ever observe such prices.
Since we cannot directly observe comparative advantage (the difference between
countries in relative prices when they are wholly isolated from international trade)
it is necessary to extend comparative advantage theory to establish what underlying
forces would create it. The starting point for this is to ask what can create cost
differences in the production of goods and services between countries. Essentially,
there are two possibilities why costs might differ between countries. Firstly, one
country might simply use the same resources more efficiently another. Secondly,
one country might be able to obtain key inputs more cheaply than another.
Ricardo's (1817) own explanation was one of the former sets of explanations.
According to Ricardo's theory, differences in relative costs were caused by
differences in the (relative) productivity of labor between countries. To this date
Ricardian comparative advantage is still seen as an important explanation of
international trade although modern writers are much more likely to cite
technological differences as the primary cause of international differences in
productivity.
Economic theories making use of the second type of explanation (differences in the
costs of factor inputs) first arose with Heckscher (1919) and Ohlin (1933). The
Heckscher-Ohlin (H-O) model of international trade sees comparative advantage as
being determined by international differences in the supplies of factors of
production. In its simplest form the model has two factors of production capital

and labor. Suppose one country, say the USA, has more capital per worker than a
second country, say India. This would imply that the price of capital relative to
labor would be cheaper in the US than in India. Assuming that there are no
significant differences in technology between the two, this would also imply that
the cost of producing goods or services using capital intensively relative to those
using labor intensively would be lower in the US than in India. In other words a
comparative advantage would exist.
A common misconception with the H-O model is that it deals with only capital and
labor. In fact it can be shown to apply with many factors of production. With
multiple factors of production its core prediction is quite simple. Countries will
tend to have a comparative advantage and, therefore, to export goods or services
which make intensive use of those factors of production in which they are
comparatively rich. Conversely they will tend to import goods or services which
make intensive use of factors of production in which they are comparatively poor.
Much of recent empirical research on the H-O model see, for example, Webster
(1993) emphasizes the importance of skills and education in the labor force as a
key determinant of comparative advantage and trade.
Recent theoretical work by Davies (1995) has successfully integrated the Ricardian
and H-O views of comparative advantage. That is, we arrive at a single, combined
view of comparative advantage. This unified model predicts that comparative
advantage is simultaneously determined by both international differences in
technology (or, more accurately, productivity) and by international differences in
the available supplies of factor inputs.
There are a number of theories which explain why countries might simultaneously
export and import the same good or service. The majority of these require some
form of product differentiation either in terms of quality or simply in terms of
different varieties of the same good. Taking, firstly, differences in quality, Falvey
(1981) sets out a model which essentially predicts that countries may have a
comparative advantage in one quality of a good or service. For example, Italy
might export high quality designer clothing and import low quality clothing, with
the underlying reason for Italy's comparative advantage in high quality clothing
arising from Italy's superior design or designers.
A second category of models, most commonly associated with Krugman (1979),
considers the case where goods or services do not differ with respect to quality but
where one variety is simply made different from another. In these models
international trade arises for two key reasons. Firstly, individual consumers have a

taste for variety such that they prefer to consume different varieties of the same
good or service. Secondly, economies of scale mean that the domestic market can
only produce a fixed number of varieties. Suppose, for example, there are two
countries, each of which produces 10 varieties of the same good or service. By
engaging in international trade both countries could now increase the number of
varieties to 20. However, it is also likely that both countries would produce fewer
varieties say, each now produces only 8. Both countries could now consume 16
varieties, substantially more than without trade, but the reduction in the number of
varieties produced means that economies of scale can be better exploited. Under
these circumstances trade occurs because consumers not only obtain greater variety
but also obtain each variety at lower cost.
Another closely related, theory is that put forward by Lancaster (1980). In this
model consumers do not have an individual taste for variety and buy only a single
variety. However, consumers differ from each other in terms of the variety that
they would most like to buy. Since consumers differ from each other according to
their preferred (ideal) variety this means that there is a taste for variety in
aggregate. From this point the model is essentially similar to the case of an
individual taste for variety. That is, international trade enables consumers to obtain
a variety nearer to their ideal and, by reducing, the number of varieties produced,
to obtain their preferred variety at lower cost.
The final category of model, associated with Brander and Krugman (1983)
assumes that products are not differentiated at all. Instead they assume that the
market for a particular good is characterized by imperfect competition. In the
simplest case, take two countries, each of which has a single national monopolist,
protected by barriers to trade. Now remove these trade barriers. The two national
monopolists now, in effect, constitute an international duopoly. Under these
circumstances the international rivalry between the two firms will ensure that both
have little choice other than to supply each others' markets. In this case,
international trade (intraindustry) arises as a direct result of rivalry between firms
in monopolized sectors of the economy.
1.2 . Summary and Implications of Trade Theory
Based on the preceding discussion we can establish a number of comparatively
simple predictions of the economic theories of trade with respect to international
trade in goods and services. These are –
Prediction 1: countries will tend to export and import the same goods to each other
where national markets are highly monopolized.
Prediction 2: countries will tend to export and import the same good (service) to
each other where product differentiation is important.
Prediction 3: countries will tend to export and import the same good (service) to
each other where significant differences in product quality exist.
Prediction 4: countries will tend to, on balance, export a specific good where they
have a technological or productivity advantage.
Prediction 5: countries will tend to, on balance, export a specific good which uses
intensively factor inputs in which they are comparatively rich and to import a good
which makes intensive use of factor inputs in which they are comparatively poor.
From the point of view of trade it would seem that all of these theoretical
predictions have potential relevance.
2. Methodology and data
2.1 Methodology of Revealed and Potential Comparative Advantages Analysis
Comparative advantage is, as previously discussed, notoriously difficult to
measure. Officially, a comparative advantage is a difference between countries in
the relative prices that would prevail if these countries were isolated from trade.
Since we cannot observe this isolation, comparative advantage cannot be directly
measured. It is, however, possible to observe the underlying conditions which give
rise to comparative advantage. That is, we could attempt to measure both
differences in technology or productivity and differences in the supplies of factor
inputs. However, to do so would be a colossal task.
In consequence, the most common approach is to invoke Balassa's (1965) principle
of revealed comparative advantage. This argues that, since trade is generated by
underlying comparative advantage, we can use data on exports and imports to infer
this underlying pattern of advantage. This principle has given rise to a number of
indicators of revealed comparative advantage (RCA). For the purposes of this
paper we utilize two of these measures.
The first of these measures is the index proposed by Balassa (1965) himself. The
Balassa index (Bij ) is given as :
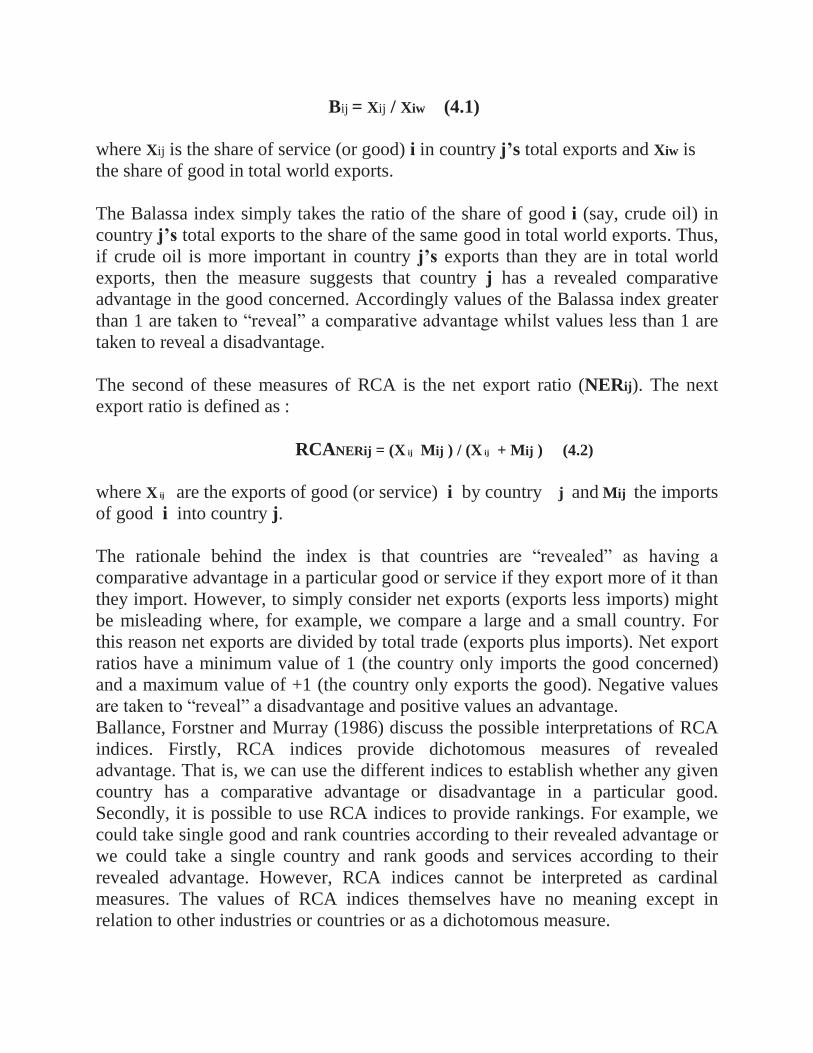
Bij = Xij / Xiw (4.1)
where Xij is the share of service (or good) i in country j’s total exports and Xiw is
the share of good in total world exports.
The Balassa index simply takes the ratio of the share of good i (say, crude oil) in
country j’s total exports to the share of the same good in total world exports. Thus,
if crude oil is more important in country j’s exports than they are in total world
exports, then the measure suggests that country j has a revealed comparative
advantage in the good concerned. Accordingly values of the Balassa index greater
than 1 are taken to “reveal” a comparative advantage whilst values less than 1 are
taken to reveal a disadvantage.
The second of these measures of RCA is the net export ratio (NERij). The next
export ratio is defined as :
RCANERij = (X ij Mij ) / (X ij + Mij ) (4.2)
where X ij are the exports of good (or service) i by country j and Mij the imports
of good i into country j.
The rationale behind the index is that countries are “revealed” as having a
comparative advantage in a particular good or service if they export more of it than
they import. However, to simply consider net exports (exports less imports) might
be misleading where, for example, we compare a large and a small country. For
this reason net exports are divided by total trade (exports plus imports). Net export
ratios have a minimum value of 1 (the country only imports the good concerned)
and a maximum value of +1 (the country only exports the good). Negative values
are taken to “reveal” a disadvantage and positive values an advantage.
Ballance, Forstner and Murray (1986) discuss the possible interpretations of RCA
indices. Firstly, RCA indices provide dichotomous measures of revealed
advantage. That is, we can use the different indices to establish whether any given
country has a comparative advantage or disadvantage in a particular good.
Secondly, it is possible to use RCA indices to provide rankings. For example, we
could take single good and rank countries according to their revealed advantage or
we could take a single country and rank goods and services according to their
revealed advantage. However, RCA indices cannot be interpreted as cardinal
measures. The values of RCA indices themselves have no meaning except in
relation to other industries or countries or as a dichotomous measure.

Finally, RCA indices have one major flaw. The principle of revealed comparative
advantage presumes that observed trade flows are generated by underlying
comparative advantages and disadvantages. It is this which allows us to use
observed trade data to infer the underlying pattern of advantage. However,
observed trade flows are not just created by underlying economic forces but are
often significantly affected by government policies with respect to international
trade. This problem is potentially more serious for trade in services than for trade
in goods. Liberalization of trade in goods is sufficiently advanced that it is at least
possible to claim that trade policies are unlikely to have materially affected
observed exports and imports. For services, where liberalization is less well
advanced and where protection against import competition has traditionally been
through a series of measures whose effects are unclear, this is a much less credible
claim.
In consequence, RCA indices remain reliable measures of whether any country has
an advantage or not in a specific good (i.e. as a dichotomous measure). As
mentioned above Balassa index and net export ratio help to define goods (or
services) which have comparative advantage currently. It is also possible to define
potential comparative advantages. First thing here is to know which country is
similar to the country (let's say to Azerbaijan). From the viewpoint of comparative
advantage, similarity of economies is treated as a main indicator. Similarities in
technologies, productivity, production and other factors are considered as main
ones for comparison. This creates a hypothesis about possibility of a good exported
in similar country to be exported by the country.
Exports similarity is measured by Finger and Krein index:
Xia - share of good in the export of country A
Xib - share of good in the export of country B
i = 1 ....... n (for all products n)
Country's export similarity to total world export can be taken as basis and export
similarity to other countries (indicator) should be compared to it. At least, country's
export similarity indicator to more than 30 countries should be calculated (we
calculated export similarity of Azerbaijan with 84 countries).

The question here is what products are exported by these countries that the country
(for example, Azerbaijan) can export.
For this reason we measure Balassa net export RSAB for these countries. This
shows products of these countries which have comparative advantage. From this
list we can find products which have comparative advantages and use it as a
hypothesis. As a result we get the list of potential products for more
comprehensive analysis.
2.2 Data
All data used in this paper were taken from the World integrated Trade Solution
(the World Bank) database and PCTAC trade statistics(World Trade Organization)
database This database provides information on the exports and imports of
different categories of goods for a sample of 183 countries. Data base of last 3
years (2007-2009) were used for the calculations. Using these data bases we
conducted an analysis based on standard theories and empirical techniques for
international trade.
3. Analysis
In this section we present three sets of analysis. Firstly, we present an analysis of
exports of Azerbaijan using the Balassa index of revealed comparative advantage
(RCA). Secondly, we present a similar analysis using the net export ratio measure
of RCA. Finally, we present exports similarity of Azerbaijan with other countries
using the Finger and Krein index.
3.1. Balassa Revealed Comparative Advantage Indices
In Table 1 we present Balassa RCA indices in 4 digit production code (SITC 3
Revision) for Azerbaijan Republic. These are annual values for the years 2007 to
2009. Formally the Balassa indices (see section 4) are defined to be the ratio of the
share of the good in the country's total exports to the share of the same good in
total world exports.
Computation of Balassa RCA indices forAzerbaijan show followings:
Agricultural products (processed and semi processed agricultural products
included):Being partly agricultural country Azerbaijan has revealed comparative
advantage in tobacco, apple, nuts, tea, vegetables, oil seeds, raw cotton,
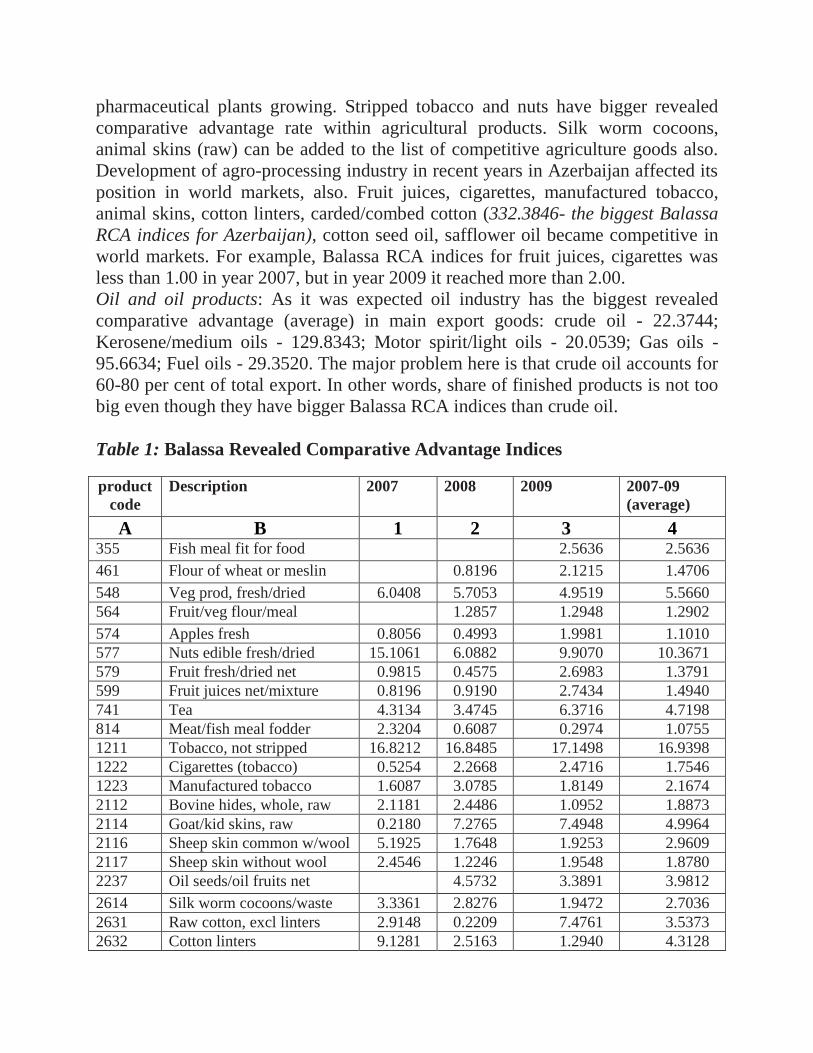
pharmaceutical plants growing. Stripped tobacco and nuts have bigger revealed
comparative advantage rate within agricultural products. Silk worm cocoons,
animal skins (raw) can be added to the list of competitive agriculture goods also.
Development of agro-processing industry in recent years in Azerbaijan affected its
position in world markets, also. Fruit juices, cigarettes, manufactured tobacco,
animal skins, cotton linters, carded/combed cotton (332.3846- the biggest Balassa
RCA indices for Azerbaijan), cotton seed oil, safflower oil became competitive in
world markets. For example, Balassa RCA indices for fruit juices, cigarettes was
less than 1.00 in year 2007, but in year 2009 it reached more than 2.00.
Oil and oil products: As it was expected oil industry has the biggest revealed
comparative advantage (average) in main export goods: crude oil - 22.3744;
Kerosene/medium oils - 129.8343; Motor spirit/light oils - 20.0539; Gas oils -
95.6634; Fuel oils - 29.3520. The major problem here is that crude oil accounts for
60-80 per cent of total export. In other words, share of finished products is not too
big even though they have bigger Balassa RCA indices than crude oil.
Table 1: Balassa Revealed Comparative Advantage Indices
product
code Description
2007 2008
2009
2007-09
(average)
A B 1 2 3 4 355 Fish meal fit for food 2.5636 2.5636
461 Flour of wheat or meslin 0.8196 2.1215 1.4706
548 Veg prod, fresh/dried 6.0408 5.7053 4.9519 5.5660 564 Fruit/veg flour/meal 1.2857 1.2948 1.2902
574 Apples fresh 0.8056 0.4993 1.9981 1.1010 577 Nuts edible fresh/dried 15.1061 6.0882 9.9070 10.3671 579 Fruit fresh/dried net 0.9815 0.4575 2.6983 1.3791 599 Fruit juices net/mixture 0.8196 0.9190 2.7434 1.4940 741 Tea 4.3134 3.4745 6.3716 4.7198 814 Meat/fish meal fodder 2.3204 0.6087 0.2974 1.0755 1211 Tobacco, not stripped 16.8212 16.8485 17.1498 16.9398 1222 Cigarettes (tobacco) 0.5254 2.2668 2.4716 1.7546 1223 Manufactured tobacco 1.6087 3.0785 1.8149 2.1674 2112 Bovine hides, whole, raw 2.1181 2.4486 1.0952 1.8873 2114 Goat/kid skins, raw 0.2180 7.2765 7.4948 4.9964 2116 Sheep skin common w/wool 5.1925 1.7648 1.9253 2.9609 2117 Sheep skin without wool 2.4546 1.2246 1.9548 1.8780 2237 Oil seeds/oil fruits net 4.5732 3.3891 3.9812
2614 Silk worm cocoons/waste 3.3361 2.8276 1.9472 2.7036 2631 Raw cotton, excl linters 2.9148 0.2209 7.4761 3.5373 2632 Cotton linters 9.1281 2.5163 1.2940 4.3128

2633 Cotton waste 2.4229 0.7219 0.2170 1.1206 2634 Cotton, carded/combed 539.319
3 207.401
1 250.4334 332.3846
2822 Waste/scrap alloy steel 4.8221 1.2417 3.0319
2852 Alumina(aluminium oxide) 12.6973 4.9573 11.5470 9.7339
2881 Metaliferous non-fer ash 8.2634 8.2634
2882 Non-fer metal waste 6.5812 1.7341 4.1576
2924 Pharmaceutical plants 3.7504 3.8539 4.8199 4.1414
3330 Petrol./bitum. oil,crude 26.6177 17.9715 22.5339 22.3744
3341 Motor spirit/light oils 5.6251 4.2229 50.3137 20.0539
3342 Kerosene/medium oils 35.5694 22.9663 330.9671 129.8343
3343 Gas oils 39.7437 34.5818 212.6648 95.6634
3344 Fuel oils, net 0.0164 5.5926 82.4469 29.3520
3345 Lubs(high petr cont) etc 2.3539 0.3786 3.2539 1.9955
3354 Petrol. bitumen/coke/etc 0.6069 1.5532 3.8829 2.0143
3441 Ethylene etc liquified 1.3082 1.3082
3510 Electrical energy 6.7698 1.0205 4.6105 4.1336
4212 Cotton seed oil 46.3016 45.2488 69.9280 53.8262
4215 Safflower oil 1.2729 1.1007 1.1766 1.1834
4229 Fix veg fat, not soft 17.6422 4.2212 5.6168 9.1601
5113 Halogenated hc derivs 1.3083 0.5064 1.5831 1.1326
5121 Acyclic monohyd. alcohols 2.3164 1.1431 3.1468 2.2021
5161 Ethers/peroxides/derivs 1.4905 0.8068 0.8642 1.0538
5711 Polyethylene 3.2428 0.8872 4.1247 2.7516
5759 Plastics, 2.1364 0.7023 1.4480 1.4289
6581 Textile sacks/bags 5.9013 3.7756 6.4309 5.3693
6727 Semi-fin iron/st. >.25%c 0.0015 6.6579 3.3297
6762 Hot-form stl bar/rod 0.1078 1.4973 3.1656 1.5902
7234 Constr/mining machin 2.5390 1.0396 0.8922 1.4903
7239 Earth moving mach parts 2.0232 2.5991 2.1296 2.2507
7427 Pumps/liqu elevators 2.3975 1.8879 0.3205 1.5353
7822 Special-use vehicles 2.8509 2.3251 0.6029 1.9263
7921 Helicopters 1.0086 1.0086
7932 Ships/boats 3.0176 0.0430 0.0248 1.0285
7933 Vessels for breaking up 7.9446 7.9446
7937 Tugs and pusher craft 1.0164 1.0164
8731 Gas/liquid/electr meters 1.4331 1.1526 0.5858 1.0572
8741 Navigation/survey/et app 0.9590 1.6187 2.1847 1.5875
8986 Recorded magnetic tapes 7.0367 12.9640 2.2856 7.4288
Chemical and petrochemical industry: As is seen from the table, other major sector
of national economy has revealed comparative advantage in ethylene (1.3082),
polyethylene (2.7516), and plastics (1.4289) production.
Mining industry: Except for crude oil, Azerbaijan has revealed comparative
advantage in alumina (aluminium oxide) mining.
Non-oil sector: The sector is represented by construction/mining machinery, earth
moving machinery parts, pumps, liquid elevators, special-use vehicles,
gas/liquid/electricity meters, tugs and pusher craft, navigation/survey apparatus,
textile sacks, bags, recorded magnetic tapes.
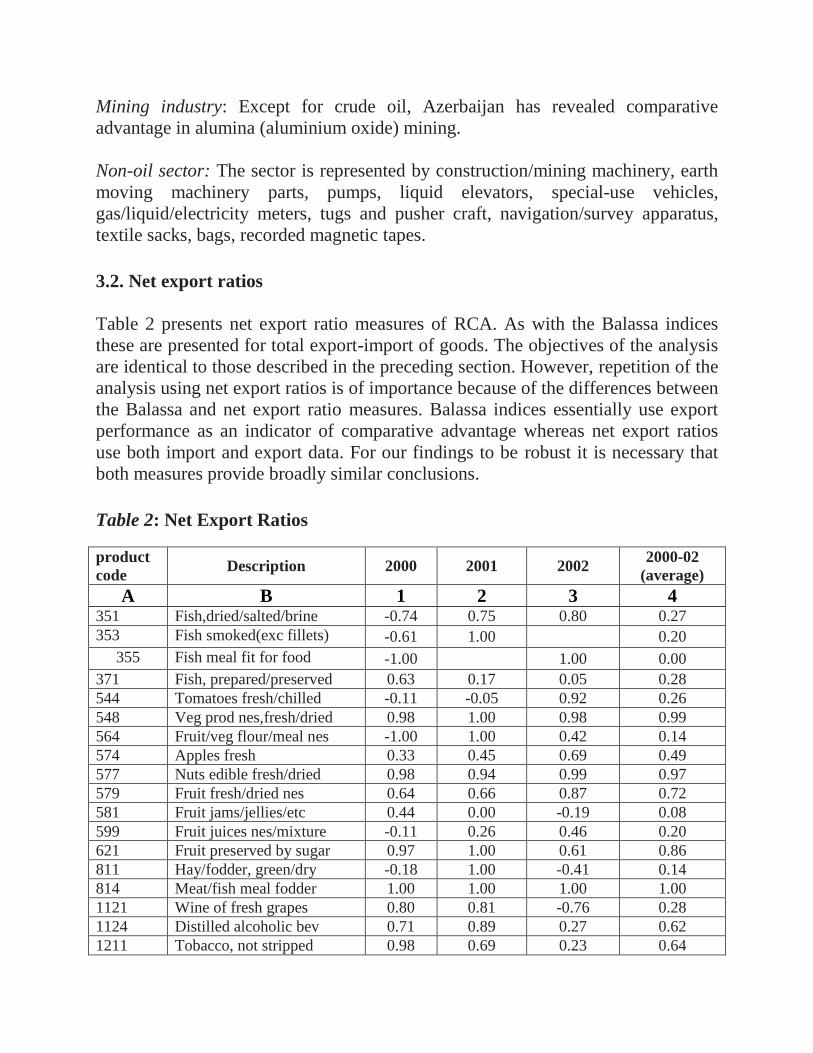
3.2. Net export ratios
Table 2 presents net export ratio measures of RCA. As with the Balassa indices
these are presented for total export-import of goods. The objectives of the analysis
are identical to those described in the preceding section. However, repetition of the
analysis using net export ratios is of importance because of the differences between
the Balassa and net export ratio measures. Balassa indices essentially use export
performance as an indicator of comparative advantage whereas net export ratios
use both import and export data. For our findings to be robust it is necessary that
both measures provide broadly similar conclusions.
Table 2: Net Export Ratios
product
code Description 2000 2001 2002
2000-02
(average)
A B 1 2 3 4 351 Fish,dried/salted/brine -0.74 0.75 0.80 0.27 353 Fish smoked(exc fillets) -0.61 1.00 0.20
355 Fish meal fit for food -1.00 1.00 0.00 371 Fish, prepared/preserved 0.63 0.17 0.05 0.28 544 Tomatoes fresh/chilled -0.11 -0.05 0.92 0.26 548 Veg prod nes,fresh/dried 0.98 1.00 0.98 0.99
564 Fruit/veg flour/meal nes -1.00 1.00 0.42 0.14
574 Apples fresh 0.33 0.45 0.69 0.49
577 Nuts edible fresh/dried 0.98 0.94 0.99 0.97
579 Fruit fresh/dried nes 0.64 0.66 0.87 0.72
581 Fruit jams/jellies/etc 0.44 0.00 -0.19 0.08
599 Fruit juices nes/mixture -0.11 0.26 0.46 0.20
621 Fruit preserved by sugar 0.97 1.00 0.61 0.86
811 Hay/fodder, green/dry -0.18 1.00 -0.41 0.14
814 Meat/fish meal fodder 1.00 1.00 1.00 1.00
1121 Wine of fresh grapes 0.80 0.81 -0.76 0.28
1124 Distilled alcoholic bev 0.71 0.89 0.27 0.62
1211 Tobacco, not stripped 0.98 0.69 0.23 0.64

1222 Cigarettes (tobacco) -0.17 0.41 0.20 0.15
2111 Bovine/equine hide raw 1.00 1.00 0.84 0.95
2112 Bovine hides, whole, raw 0.96 1.00 0.97 0.98
2114 Goat/kid skins, raw 1.00 1.00 1.00 1.00
2116 Sheep skin common w/wool 0.98 0.88 0.98 0.95
2117 Sheep skin without wool 1.00 1.00 1.00 1.00
42222 Soya beans 1.00 -1.00 0.00
2237 Oil seeds/oil fruits nes -1.00 0.99 0.99 0.33
2321 Rubber synth from oil -0.40 -0.19 0.63 0.01
2450 Fuel wood/wood charcoal 1.00 -1.00 0.00
2475 Hardwood,rough,untreated 1.00 1.00 -1.00 0.33
2511 Paper/board waste/scrap 0.99 1.00 1.00 1.00
2613 Raw silk not thrown 1.00 1.00
2614 Silk worm cocoons/waste 1.00 1.00 1.00 1.00
2631 Raw cotton,excl linters 1.00 1.00 1.00 1.00
2633 Cotton waste 1.00 1.00 1.00 1.00
2634 Cotton,carded/combed 1.00 1.00 1.00 1.00
2681 Wool, greasy 0.98 1.00 0.99
2682 Wool nes, uncombed 1.00 -0.32 1.00 0.56
2724 Ntrl potassium salts 1.00 1.00
2815 Iron ore,conc,not agglom 1.00 1.00
2821 Waste/scrap cast iron 1.00 1.00 1.00
2822 Waste/scrap alloy steel 1.00 0.98 0.99
2823 Ferrous waste/scrap nes 1.00 0.94 -1.00 0.31
2852 Alumina(aluminium oxide) 1.00 1.00 1.00 1.00
2879 Base metal ore/conc nes 1.00 -1.00 0.00
2882 Non-fer metal waste nes 0.99 1.00 -1.00 0.33
2924 Pharmaceutical plants 1.00 1.00 1.00 1.00
3330 Petrol./bitum. oil,crude 1.00 1.00 1.00 1.00
3341 Motor spirit/light oils 1.00 1.00 1.00 0.99
3342 Kerosene/medium oils 1.00 0.99 0.96 0.99
3343 Gas oils 0.95 0.91 0.97 0.94
3344 Fuel oils,nes -0.95 1.00 1.00 0.35
3351 Petroleum jelly/waxes -1.00 0.98 0.82 0.27
3354 Petrol. bitumen/coke/etc 0.94 0.98 0.97 0.97
3441 Ethylene etc liquified 1.00 1.00
4111 Fish/marine mamm.oil/fat 1.00 1.00 1.00 1.00
4212 Cotton seed oil 0.79 0.67 0.98 0.81
4214 Olive oil -0.32 0.17 0.42 0.09
4229 Fix veg fat nes not soft 0.35 0.61 -0.52 0.14
4311 Animal/veg oil modified 0.67 0.41 1.00 0.69
5111 Acyclic hydrocarbons 0.52 0.81 0.99 0.77
5113 Halogenated hc derivs 0.89 0.78 0.79 0.82
5121 Acyclic monohyd alcohols 0.34 0.30 0.52 0.39
5154 Organo-sulphur compounds 1.00 -0.86 0.07
5161 Ethers/peroxides/derivs 0.92 0.81 0.75 0.83
5226 Inorg bases/metal ox nes -0.24 0.43 0.07 0.09
5711 Polyethylene 0.95 0.94 0.88 0.92
5741 Polyacetals/polyethers 0.62 0.80 0.75 0.72
5759 Plastics 0.65 0.23 0.83 0.57
6115 Sheep leather w/out wool 1.00 1.00
6581 Textile sacks/bags 0.60 0.42 0.79 0.60
6593 Hand woven rugs 0.99 1.00 0.88 0.96
6595 Carpets, woven -0.04 0.01 0.59 0.19
6821 Copper refined/unrefined 0.98 1.00 -1.00 0.33
6841 Aluminium/alloys unwrt 1.00 0.68 -1.00 0.23
6891 Tungsten/molyb/tant/magn 1.00 1.00
6898 Cobalt/cadm/titan/zircon 0.89 0.64 0.76
7148 Gas turbines nes 0.91 0.43 0.08 0.47
7251 Pulp/paper making
machines 0.91 -0.81 0.75 0.28
7465 Cyl roller bearings nes -0.84 0.69 0.31 0.05
7521 Analog/hybrid computers 0.98 0.23 0.61
7912 Rail locomotives etc nes 1.00 1.00
7917 Rail/tram pass coach etc 1.00 1.00
7932 Ships/boats nes 0.94 0.00 -0.87 0.02
8962 Original prints etc 1.00 1.00
8963 Original sculpture etc 1.00 -1.00 1.00 0.33
8986 Recorded magnetic tapes 0.61 0.81 0.17 0.53
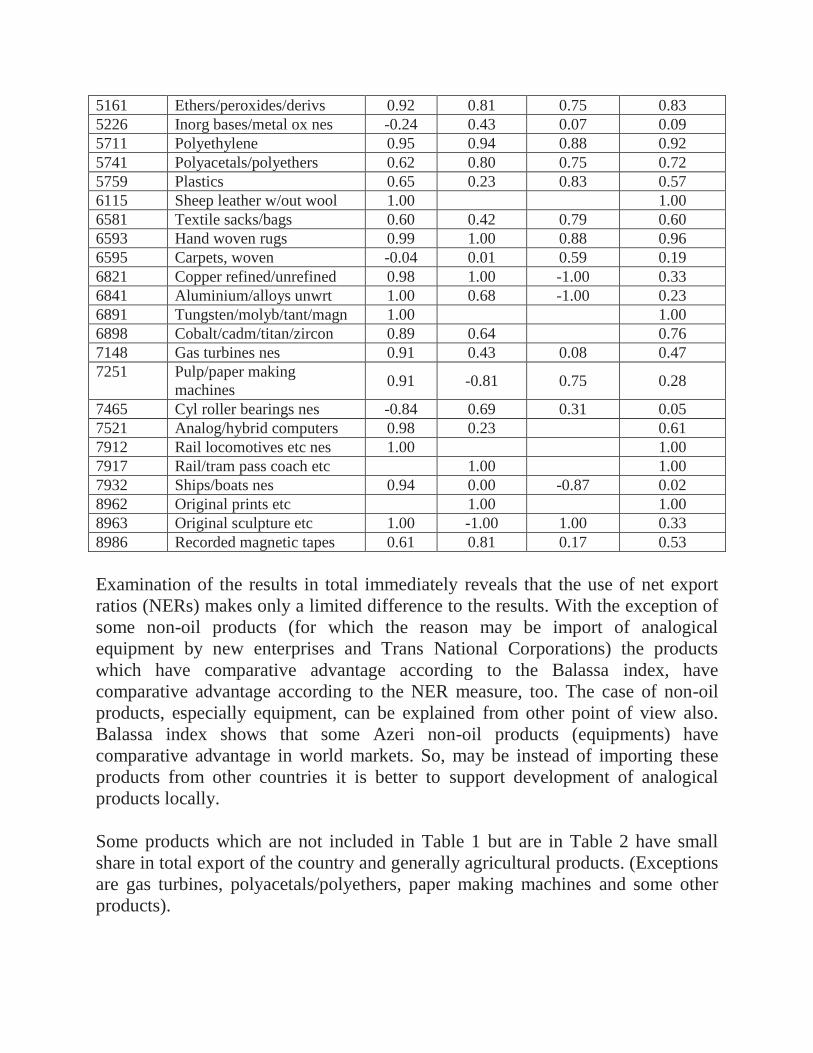
Examination of the results in total immediately reveals that the use of net export
ratios (NERs) makes only a limited difference to the results. With the exception of
some non-oil products (for which the reason may be import of analogical
equipment by new enterprises and Trans National Corporations) the products
which have comparative advantage according to the Balassa index, have
comparative advantage according to the NER measure, too. The case of non-oil
products, especially equipment, can be explained from other point of view also.
Balassa index shows that some Azeri non-oil products (equipments) have
comparative advantage in world markets. So, may be instead of importing these
products from other countries it is better to support development of analogical
products locally.
Some products which are not included in Table 1 but are in Table 2 have small
share in total export of the country and generally agricultural products. (Exceptions
are gas turbines, polyacetals/polyethers, paper making machines and some other
products).
Fish meal fit for food was totally imported in 2007, but Azerbaijan started to
export this good in 2009. That's why we have 0.00 in the average NER. But it does
not mean that Azerbaijan have no comparative advantage in the export of fish meal
fit for food. Change from import to export of the product can be considered as
good tendency due to establishment of production of the same product in the
country. And Balassa index shows that Azerbaijan has comparative advantage in
this product.
But generally, in this paper, calculations according to the Balassa index and
according to net export ratios give almost similar results.
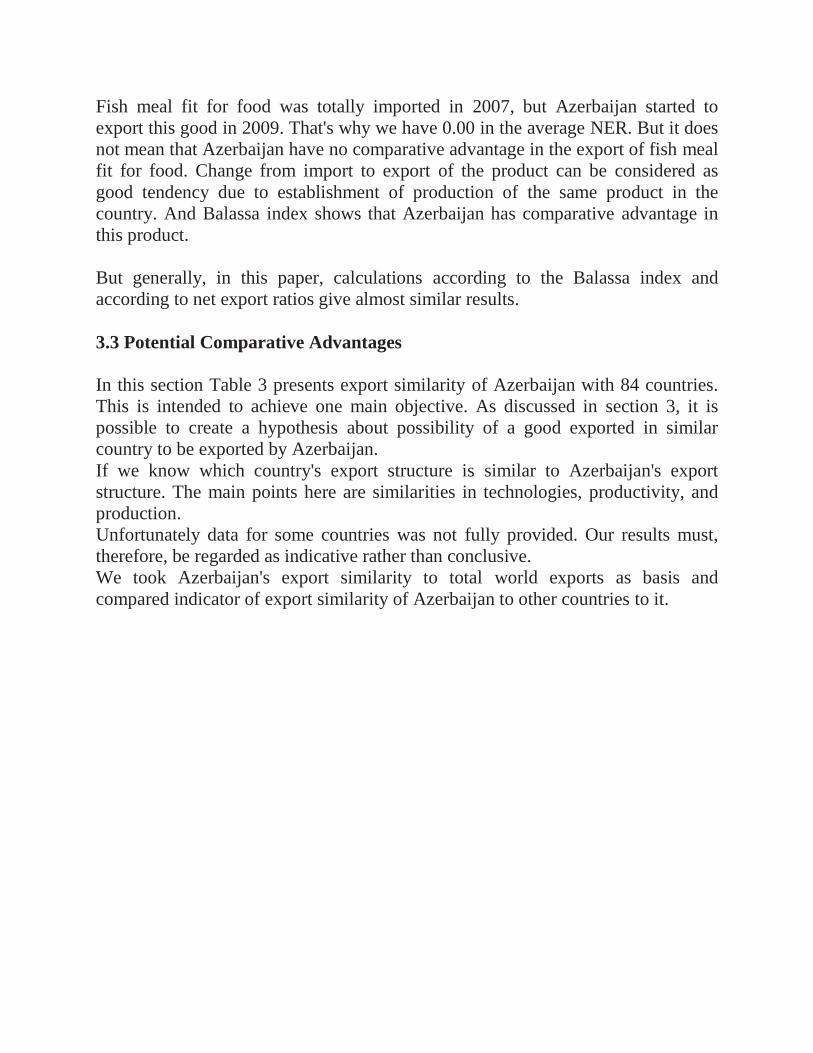
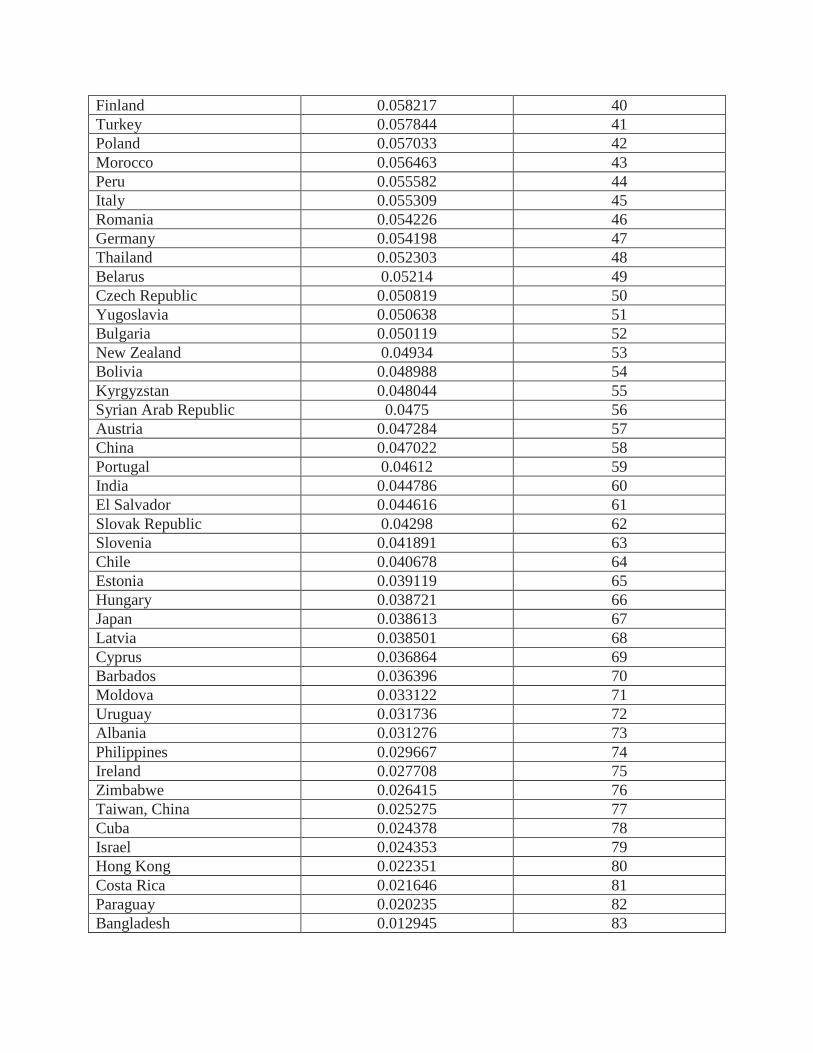
3.3 Potential Comparative Advantages
In this section Table 3 presents export similarity of Azerbaijan with 84 countries.
This is intended to achieve one main objective. As discussed in section 3, it is
possible to create a hypothesis about possibility of a good exported in similar
country to be exported by Azerbaijan.
If we know which country's export structure is similar to Azerbaijan's export
structure. The main points here are similarities in technologies, productivity, and
production.
Unfortunately data for some countries was not fully provided. Our results must,
therefore, be regarded as indicative rather than conclusive.
We took Azerbaijan's export similarity to total world exports as basis and
compared indicator of export similarity of Azerbaijan to other countries to it.

Table 3: Export Similarity of Azerbaijan with Other Countries
Country Average Ranking Iran 0.688338 1 Saudi Arabia 0.672593 2 Venezuela 0.603485 3 Nigeria 0.565711 4 Kazakhstan 0.533365 5 Norway 0.522377 6 Algeria 0.500355 7 Qatar 0.474428 8 Ecuador 0.43711 9 Colombia 0.292357 10 Russian Federation 0.291686 11 Trinidad and Tobago 0.217059 12 Argentina 0.183139 13 Lithuania 0.17692 14 Cote d'Ivoire 0.172164 15 Egypt 0.151975 16 Bahrain 0.147711 17 Indonesia 0.146025 18 Greece 0.130971 19 Australia 0.119874 20 Mexico 0.114244 21 Turkmenistan 0.114205 22 United Kingdom 0.107495 23 Canada 0.102593 24 World 0.098367 Senegal 0.097100 25 Netherlands 0.094864 26 Georgia 0.092354 27 Denmark 0.085127 28 Malaysia 0.084498 29 Belgium 0.077276 30 Brazil
0.072596 31
Spain 0.070232 32 Croatia 0.067682 33 Ukraine 0.066162 34 Singapore 0.065753 35 USA 0.065224 36 France (Monaco included) 0.064024 37
TFYR Macedonia 0.063543 38
South Africa 0.061916 39
Finland 0.058217 40
Turkey 0.057844 41
Poland 0.057033 42
Morocco 0.056463 43
Peru 0.055582 44
Italy 0.055309 45
Romania 0.054226 46
Germany 0.054198 47
Thailand 0.052303 48
Belarus 0.05214 49
Czech Republic 0.050819 50
Yugoslavia 0.050638 51
Bulgaria 0.050119 52
New Zealand 0.04934 53
Bolivia 0.048988 54
Kyrgyzstan 0.048044 55
Syrian Arab Republic 0.0475 56
Austria 0.047284 57
China 0.047022 58
Portugal 0.04612 59
India 0.044786 60
El Salvador 0.044616 61
Slovak Republic 0.04298 62
Slovenia 0.041891 63
Chile 0.040678 64
Estonia 0.039119 65
Hungary 0.038721 66
Japan 0.038613 67
Latvia 0.038501 68
Cyprus 0.036864 69
Barbados 0.036396 70
Moldova 0.033122 71
Uruguay 0.031736 72
Albania 0.031276 73
Philippines 0.029667 74
Ireland 0.027708 75
Zimbabwe 0.026415 76
Taiwan, China 0.025275 77
Cuba 0.024378 78
Israel 0.024353 79
Hong Kong 0.022351 80
Costa Rica 0.021646 81
Paraguay 0.020235 82
Bangladesh 0.012945 83

As is seen from Table 3 there are 24 countries above medium (world level) and
most of them are oil exporter countries. As we mentioned above, crude oil
accounts for about 60-80 per cent of total exports of Azerbaijan (This figure is
about 90 per cent for oil products) and finally it influences summary of minimums
during the calculation of export similarities with oil exporter countries drastically.
For example, in year 2000 crude oil accounts for 48.9 per cent of total export of
Norway, its share for Azerbaijan is 56.4 per cent. So, 0.489 out of total export
similarity value for Azerbaijan and Norway comes from crude oil in 2000. The
same we can say about Iran, Saudi Arabia, Venezuela, Nigeria, Kazakhstan,
Algeria, Qatar, Ecuador, Russian Federation, and Columbia.
We think there is a need for more detailed analyses. It is necessary to calculate all
Balassa indices for non-oil sector (excluding oil sector from export of Azerbaijan
and other countries, also from total world export) by using the methodology of this
paper.
There are some other countries with which Azerbaijan has export similarities, too.
These countries also have big export of oil products, but they don't export crude oil
like above mentioned countries, they export processed oil products such as motor
spirit/light oils, kerosene/medium oils, gas oils, lubricants (high petrol
concentration) etc. And it makes sense to investigate export structure of these
countries and try to find products which should be exported by Azerbaijan.
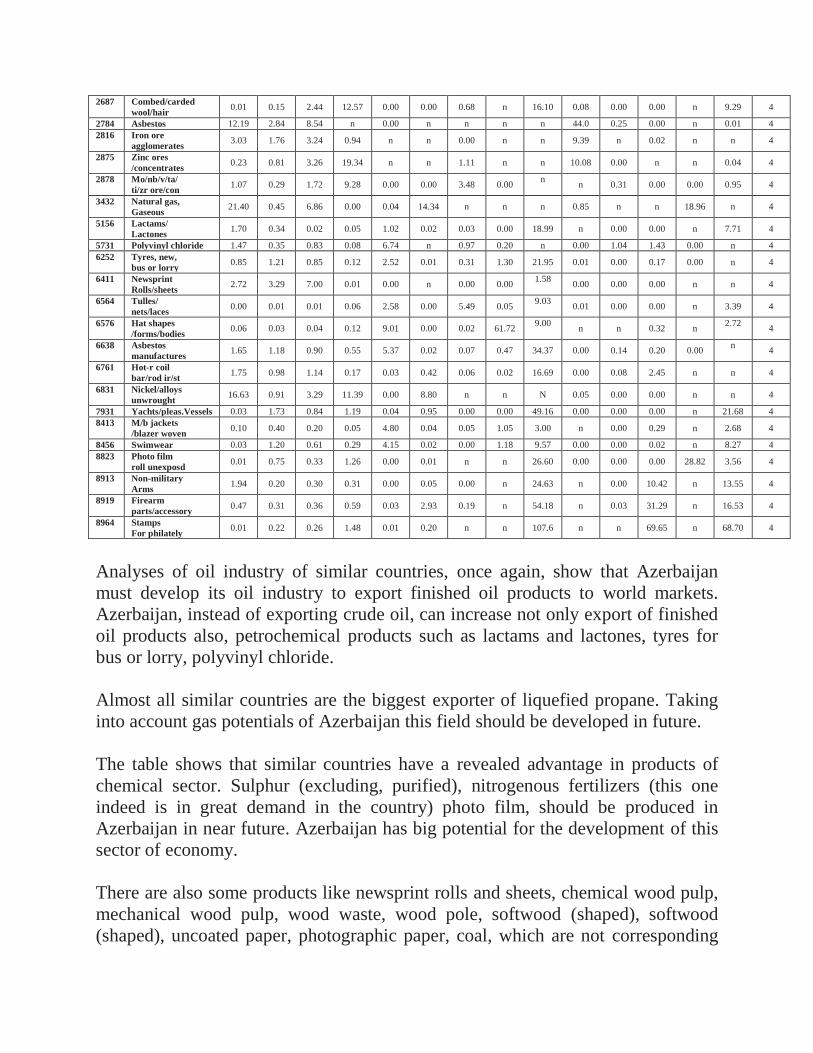
Table 4 includes a more detailed list of the products in which similar countries
currently have a revealed advantage but Azerbaijan does not. No doubt, with the
large number of similar countries identified (24 countries); it is difficult to produce
a table including products from all similar countries. To reduce results to more
manageable proportions we suggested using data from the countries on the top of
the Table 3 and from some developed countries like the United Kingdom, Canada,
and Australia which are also above the median (basis). The last column of resulting
table (see ranking) provides number of countries which currently have a revealed
advantage in certain product according to 2007-2009 average. We analyzed and
presented list of products in which four or more similar countries have a revealed
advantage. But whole list of products is given in Appendixes.

Table 4: Detailed list of products in which similar countries currently have a
revealed advantage according to 2007-2009 average
Pro
d.
Co
de
Description
Ru
ssia
Th
e U
nit
ed
Kin
gd
om
Can
ad
a
Au
strali
a
Colu
mb
ia
Norw
ay
Iran
Ecu
ad
or
Qata
r
Kaza
kh
stan
S.
Arab
ia
Ven
ezu
ela
Alg
eria
Nig
eria
Ran
kin
g*
A B 1 2 3 4 5 6 7 8 9 10 11 12 13 14 15
3421 Liquefied
propane 1.13 2.95 4.93 3.61 0.27 8.47 5.98 N 29.74 1.93 n 0.00 63.23 n 8
2512 Mechanical
wood pulp 0.00 1.29 5.54 0.01 0.00 13.90 0.00 N 5.53 n n 0.00 1.42 66.78 6
3212 Other coal 3.30 0.03 1.29 29.15 23.81 n 0.03 N n 7.07 n 2.35 n n 6
8911 Armoured
Fighting vehicle 0.00 0.70 1.56 0.46 0.01 1.38 2.13 N 39.73 n 0.00 16.75 n 21.57 6
430 Barley grain 2.95 1.05 1.82 12.43 0.00 0.00 0.00 0.01 n 7.57 0.00 n n n 5
2239 Oil seed
/etc flour/meal 0.19 0.39 0.37 1.01 0.32 0.00 0.01 0.04 8.79 2.37 0.00 12.46 n 2.86 5
2462 Woodwaste
(incl sawdust) 0.48 1.66 6.36 0.14 0.00 0.49 0.00 0.01 2.12 0.01 0.00 0.00 1.22 53.06 5
2473 Wood poles,
Treated 0.26 1.76 3.84 0.64 0.24 0.85 n 1.92 13.10 0.00 n 0.00 2.05 25.79 5
2483 Softwood
shaped/grooved 0.36 1.18 3.61 0.25 0.09 0.49 0.00 0.49 8.35 0.02 0.03 0.00 4.26 44.01 5
2485 Hardwood
shaped/grooved 0.07 0.73 1.03 0.12 0.82 0.16 0.00 1.27 8.09 0.00 0.01 0.00 1.72 10.21 5
2683 Fine animal
hair, uncombed 0.21 2.15 0.11 0.99 0.00 0.00 9.53 n 160.9 1.51 0.06 n n 52.35 5
2721 Animal, veg
fertilizer, crude 0.08 0.74 0.56 0.65 1.10 2.58 0.23 0.32 23.16 0.00 3.94 0.18 n 9.90 5
2741 Sulphur exc.
Purified 5.96 2.55 4.18 0.03 0.19 0.00 2.22 n 6.11 0.03 0.68 0.00 n 0.75 5
5259 Stable isotopes/
Compound 3.41 1.83 1.16 0.01 0.00 0.55 n n 13.13 2.13 0.12 n n 12.69 5
5621 Nitrogenous
Fertilizers 7.23 0.17 2.29 0.44 0.07 0.00 0.22 0.00 27.24 0.01 4.56 1.67 0.91 n 5
6412 Uncoated
Paper/board 0.64 1.67 2.56 0.64 1.30 2.64 0.00 0.01 13.52 0.00 0.01 0.09 0.00 0.00 5
8824 Photographic
paper unexp. 0.04 1.62 0.92 4.18 0.10 0.01 n n 49.98 0.00 0.00 0.00 55.26 7.60 5
8825 Photo
film/plates undevd 0.01 0.44 0.40 1.16 0.09 4.08 n 0.11 28.46 n 0.03 0.03 7.14 1.30 5
8912 Bombs
/ammunition/etc 4.31 0.15 0.29 0.28 0.01 2.48 0.65 n 42.27 n 0.00 26.27 n 38.55 5
354 Fish liver
/roe,dr/sm/sal 1.34 0.02 8.66 0.22 0.00 1.58 n 3.45 n 0.00 n n n 0.00 4
362 Crustaceans,
not frozen 0.06 1.38 4.22 10.52 1.13 0.86 0.09 0.13 n n 0.01 0.09 0.19 n 4
372 Shellfish
prepared/prsvd 0.32 0.20 1.59 1.63 0.16 2.98 0.00 2.93 n n 0.01 0.17 n n 4
471 Cereal flour
(non-wheat) 0.09 0.25 0.57 2.04 2.02 0.03 0.01 6.01 n 0.07 0.01 7.13 0.00 0.00 4
472 Cereal meal
non-wheat 1.22 0.45 2.34 0.74 2.50 0.00 0.00 0.07 0.09 3.04 0.01 0.03 n n 4
481 Cereals/
Breakf. foods 0.12 4.05 1.93 1.26 1.02 0.04 0.16 0.54 0.04 0.01 0.04 0.51 n n 4
482 Malt,
malt flour 0.06 1.78 2.30 7.78 2.42 0.00 n n n 0.79 n n n n 4
616 Natural honey 0.03 0.44 1.43 2.73 0.04 0.02 1.78 0.13 0.01 0.04 0.48 0.00 n 1.10 4
619 Sugars net
/syrups/etc. 0.08 1.48 1.65 0.35 2.24 0.05 0.04 0.00 n 0.00 0.01 0.08 0.00 7.53 4
733 Chocolate
bars net 0.77 0.81 1.08 1.75 1.43 0.52 n 2.28 n 0.03 0.04 0.19 0.01 n 4
2121 Mink skins,
Raw 0.49 2.70 1.11 n n 1.02 n n 3.05 n n n n 0.95 4
2226 Rape/colza
/mustard seeds 0.21 8.97 4.44 12.71 0.00 0.00 0.00 n 7.86 0.21 n n n 0.98 4
2322 Reclaimed/
waste rubber 0.39 3.12 2.30 0.20 0.26 0.02 0.12 0.08 13.24 n 0.20 0.08 n 12.15 4
2513 Chemwood
pulp dissolving 1.52 0.64 3.17 0.00 n 9.12 n n 0.43 n 0.00 n 0.01 29.95 4
2649 Jute etc
Tow/waste etc 0.07 0.73 0.16 0.03 0.00 0.24 0.05 n 6.63 n 2.26 n 9.94 0.10
4
2687 Combed/carded
wool/hair 0.01 0.15 2.44 12.57 0.00 0.00 0.68 n 16.10 0.08 0.00 0.00 n 9.29 4
2784 Asbestos 12.19 2.84 8.54 n 0.00 n n n n 44.0 0.25 0.00 n 0.01 4
2816 Iron ore
agglomerates 3.03 1.76 3.24 0.94 n n 0.00 n n 9.39 n 0.02 n n 4
2875 Zinc ores
/concentrates 0.23 0.81 3.26 19.34 n n 1.11 n n 10.08 0.00 n n 0.04 4
2878 Mo/nb/v/ta/
ti/zr ore/con 1.07 0.29 1.72 9.28 0.00 0.00 3.48 0.00
n
n 0.31 0.00 0.00 0.95 4
3432 Natural gas,
Gaseous 21.40 0.45 6.86 0.00 0.04 14.34 n n n 0.85 n n 18.96 n 4
5156 Lactams/
Lactones 1.70 0.34 0.02 0.05 1.02 0.02 0.03 0.00 18.99 n 0.00 0.00 n 7.71 4
5731 Polyvinyl chloride 1.47 0.35 0.83 0.08 6.74 n 0.97 0.20 n 0.00 1.04 1.43 0.00 n 4
6252 Tyres, new,
bus or lorry 0.85 1.21 0.85 0.12 2.52 0.01 0.31 1.30 21.95 0.01 0.00 0.17 0.00 n 4
6411 Newsprint
Rolls/sheets 2.72 3.29 7.00 0.01 0.00 n 0.00 0.00
1.58
0.00 0.00 0.00 n n 4
6564 Tulles/
nets/laces 0.00 0.01 0.01 0.06 2.58 0.00 5.49 0.05
9.03
0.01 0.00 0.00 n 3.39 4
6576 Hat shapes
/forms/bodies 0.06 0.03 0.04 0.12 9.01 0.00 0.02 61.72
9.00
n n 0.32 n
2.72
4
6638 Asbestos
manufactures 1.65 1.18 0.90 0.55 5.37 0.02 0.07 0.47 34.37 0.00 0.14 0.20 0.00
n
4
6761 Hot-r coil
bar/rod ir/st 1.75 0.98 1.14 0.17 0.03 0.42 0.06 0.02 16.69 0.00 0.08 2.45 n n 4
6831 Nickel/alloys
unwrought 16.63 0.91 3.29 11.39 0.00 8.80 n n N 0.05 0.00 0.00 n n 4
7931 Yachts/pleas.Vessels 0.03 1.73 0.84 1.19 0.04 0.95 0.00 0.00 49.16 0.00 0.00 0.00 n 21.68 4
8413 M/b jackets
/blazer woven 0.10 0.40 0.20 0.05 4.80 0.04 0.05 1.05 3.00 n 0.00 0.29 n 2.68 4
8456 Swimwear 0.03 1.20 0.61 0.29 4.15 0.02 0.00 1.18 9.57 0.00 0.00 0.02 n 8.27 4
8823 Photo film
roll unexposd 0.01 0.75 0.33 1.26 0.00 0.01 n n 26.60 0.00 0.00 0.00 28.82 3.56 4
8913 Non-military
Arms 1.94 0.20 0.30 0.31 0.00 0.05 0.00 n 24.63 n 0.00 10.42 n 13.55 4
8919 Firearm
parts/accessory 0.47 0.31 0.36 0.59 0.03 2.93 0.19 n 54.18 n 0.03 31.29 n 16.53 4
8964 Stamps
For philately 0.01 0.22 0.26 1.48 0.01 0.20 n n 107.6 n n 69.65 n 68.70 4
Analyses of oil industry of similar countries, once again, show that Azerbaijan
must develop its oil industry to export finished oil products to world markets.
Azerbaijan, instead of exporting crude oil, can increase not only export of finished
oil products also, petrochemical products such as lactams and lactones, tyres for
bus or lorry, polyvinyl chloride.
Almost all similar countries are the biggest exporter of liquefied propane. Taking
into account gas potentials of Azerbaijan this field should be developed in future.
The table shows that similar countries have a revealed advantage in products of
chemical sector. Sulphur (excluding, purified), nitrogenous fertilizers (this one
indeed is in great demand in the country) photo film, should be produced in
Azerbaijan in near future. Azerbaijan has big potential for the development of this
sector of economy.
There are also some products like newsprint rolls and sheets, chemical wood pulp,
mechanical wood pulp, wood waste, wood pole, softwood (shaped), softwood
(shaped), uncoated paper, photographic paper, coal, which are not corresponding
with natural potential of Azerbaijan. Traditionally, Azerbaijan imports these
products.
Woven jackets, blazers, swimwear, hat shapes and other products of textile
industry might be developed in near future, too. In the same time, potential of
cotton and wool industry should be used for this reason.
We find out from the detailed analyze of export structure of other countries also
that Azerbaijan should be able to export oil seeds flour and meal, barley grain, fine
animal hair, salted, frozen, preserved and dried fish liver, not frozen crustaceans,
cereal (non-wheat) flour, cereal meal, cereals breakfast foods, sugars, syrups, malt,
malt flour, natural honey, combed and carded wool. At present, Azerbaijan exports
other agricultural products to world market even in small quantities.
All products, which are chosen from the export list of similar countries for
Azerbaijan, are corresponding to the natural and economic potentials of
Azerbaijan.
4. Conclusions
Results of these analyses have been taken into consideration during preparation of
Employment Strategy Paper.
Computation of Balassa RCA indices for Azerbaijan showed that some products of
agriculture (tobacco, apple, nuts, tea, vegetables, oil seeds, raw cotton, and
pharmaceutical plants growing) and processing (fruit juices, cigarettes,
manufactured tobacco, animal skins, cotton linters, carded and combed cotton,
cotton seed oil, safflower oil), oil industry (kerosene and medium oils, motor spirit
and light oils, gas oils, fuel oils), chemical and petrochemical industry (ethylene,
polyacetals and polyethers, polyethylene and plastics) have a very big potential.
Government policy must support development of these sectors which are
competitive in world markets and will be key sectors for the creation of new jobs.
It has been accepted that creating an enabling environment for the development of
both business and employment is a key feature of the employment strategy. In
large measure this requires the identification of the constraints which prevent the
development of the private sector and implementing measures to overcome these
constraints. That is, it must address those constraints which prevent or inhibit
competitive industries developing.
This study shows that competitive (non-oil) sectors do exist in Azerbaijan and that
there are good grounds to suppose that new and competitive industries could
develop in the future. This is not to say that such enterprises could or should be
developed through the creation of new state owned enterprises or through an
interventionist strategy. Such policy approaches would be far more likely to reduce
rather than increase competitiveness.
In contrast our first key recommendation is that the government undertakes a
careful and detailed analysis of those sectors which are shown to currently be
competitive in Azerbaijan with a view to identifying the key obstacles which
prevent these sectors from increasing further their exports. This analysis should
cover both constraints in supplying export markets (such as protectionism in export
markets, lack of market intelligence, customs procedures and transport
infrastructure) and constraints affecting production (for example, excessive
regulation, monopoly power, requirements for skilled labor, finance).
Our second key recommendation is that the government undertakes a similar
detailed analysis of those sectors which are shown to be a current source of
advantage in similar countries but do not reveal an advantage for Azerbaijan. Here
the key question that needs to be addressed is: “Since these are currently export
sectors in similar countries why is it that neither domestic nor foreign investors
have invested in developing these in Azerbaijan?” Like the analysis for existing
sectors, this would need to identify the key constraints. However, this analysis
would need to be broader in scope and include, for example, the information
available to potential investors.
We would further recommend that once the government has identified the key
constraints it acts to remove these. For example, if it is found that Azerbaijan's
exports are blocked by protectionism in export markets then the Government of
Azerbaijan should open discussions with key foreign governments for removal of
trade barriers. Likewise, if a lack of information on export opportunities proves a
key constraint then it should develop effective export market intelligence services.
We strongly suggest that more detailed analyses should be done for the
computation of export similarities. It should be reasonable to carry out same type
of research for non-oil sector (excluding oil sector).
Potentials of service sector (especially, transit potential) must be carefully
researched in order to find out other possibilities for job creation.
As well, some non-oil sectors which could be developed on the base of natural and
economic potential of the country have to be researched too.
We believe that this study has made a valuable contribution to development of an
employment strategy by drawing attention to the need to encourage a competitive
private sector and, hence, a sustainable increase in employment. However, this
study focused on competitiveness by industry and did not directly link
competitiveness to labor markets. We recommend that further research is needed to
provide a basis for linking industrial competitiveness to labor markets. Such
research would address questions such as:
To what extent do different types of labor (for example, skilled manual or
unskilled) provide a source of advantage for Azerbaijan at present?
What industries in other countries make intensive use of the types of labor
that provide a basis for Azerbaijan's current advantages?
How would openness to competition and trade be likely to affect the demand
for different types of labor in Azerbaijan?
Such research would involve the use of techniques initially developed by Leontief
(1953) and subsequently developed into what is now known as the factor content
model. Further details of this technique can be supplied if required
References
Webster A., Hardwick P. (2003) International Trade in Financial Services,
School of Finance and Law, University of Bournemouth
Balassa, B. (1965), Trade Liberalization and 'Revealed Comparative
Advantage', The Manchester School of Economic and Social Studies, 33,
pp. 99-123.
Ohlin, B. (1933), Interregional and International Trade, Cambridge MA:
Harvard University Press.
Ricardo, D. (1817), Principles of Economy and Taxation.
Smith, A. (1766), The Wealth of Nations, reprinted as Cannan, E. (ed.)
(1961), London: Methuen.