Embed Size (px)
Citation preview
AXA IM SENIOR SECURED LOANS EXPERTISE
7th May 2015
www.axa-im-structuredfinance.com
This document is for Professional Adviser use only. This communication must not be relied upon by Retail Clients. Circulation must
be restricted accordingly.
Ref. Ares(2017)3025174 - 16/06/2017
2
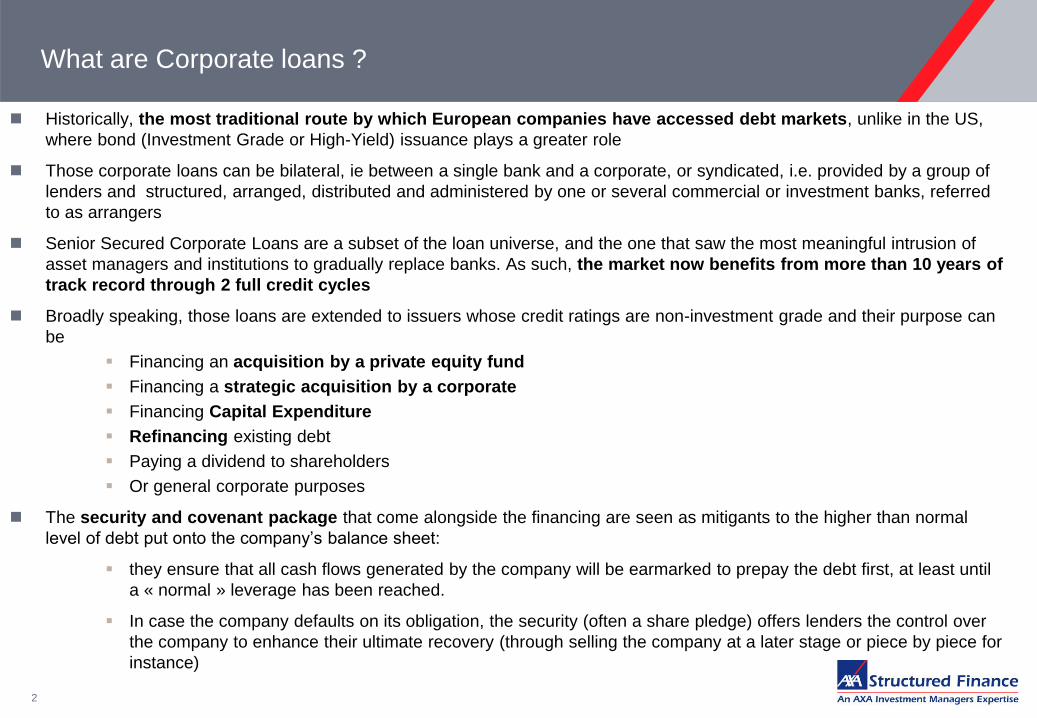
What are Corporate loans ?
Historically, the most traditional route by which European companies have accessed debt markets, unlike in the US,
where bond (Investment Grade or High-Yield) issuance plays a greater role
Those corporate loans can be bilateral, ie between a single bank and a corporate, or syndicated, i.e. provided by a group of
lenders and structured, arranged, distributed and administered by one or several commercial or investment banks, referred
to as arrangers
Senior Secured Corporate Loans are a subset of the loan universe, and the one that saw the most meaningful intrusion of
asset managers and institutions to gradually replace banks. As such, the market now benefits from more than 10 years of
track record through 2 full credit cycles
Broadly speaking, those loans are extended to issuers whose credit ratings are non-investment grade and their purpose can
be
Financing an acquisition by a private equity fund
Financing a strategic acquisition by a corporate
Financing Capital Expenditure
Refinancing existing debt
Paying a dividend to shareholders
Or general corporate purposes
The security and covenant package that come alongside the financing are seen as mitigants to the higher than normal
level of debt put onto the company’s balance sheet:
they ensure that all cash flows generated by the company will be earmarked to prepay the debt first, at least until
a « normal » leverage has been reached.
In case the company defaults on its obligation, the security (often a share pledge) offers lenders the control over
the company to enhance their ultimate recovery (through selling the company at a later stage or piece by piece for
instance)

3
Why are corporate loans so resilient ?
Senior secured loans
Mezzanine debt
Structural and contractual seniority
Access to collateral in case of default
Strong covenant structure
Lender control and investor protection
Max leverage, min interest coverage, min cash flow
coverage on a maintenance basis (i.e. at any time
throughout the life of the transaction)
Protective legal documentation
Limitations on indebtedness, acquisitions, dividends
Change of ownership clause
Contractual maturity of senior debt is shorter than
contractual maturity of subordinated debt
Privileged access to cash flows through legal
documentation
Excess cash flows
Proceeds of asset disposals
Proceeds of IPO/equity raising
Priority of corporate payments
Senior secured loans
Highest priority
50/ 70% of the capital
structure
Mezzanine Debt
Senior unsecured debt
Subordinated unsecured
debt
Preferred stock
Comm
on
stock
Lowest priority
10/20% of the capital
structure
Usually only of the 3
alternatives
20/40% of the capital structure
Even 50%+ on 2010 vintage

Bonds
Corporate Loans come under various names: bank loans, senior secured loans or leveraged loans
Credit risk based on
the ability of the
borrower to generate
cash-flows and
refinance
Secured
by physical assets
and/or equity shares of
the borrowers
Floating rate
Margin over Euribor
pre-payable at anytime at
par
Average life of
c. 3 to 5 years
The most senior corporate debt asset
Priority of corporate payments
Senior secured loans
Highest priority
Senior unsecured debt (HY)
Subordinated debt
(HY/Mezzanine)
Equity
Lowest priority
Higher historical
recovery rate
Usually unsecured,
frequently
subordinated
Fixed rate
callable at specific
conditions after some time
Average life of
typically 7 to 10
years
Loans
Lower historical
recovery rate
Usually No Covenant
Protective Covenants
(on leverage, cash flow
cover, additional debt,
dividends, etc…)
Corporate Loans : definition and main characteristics
4
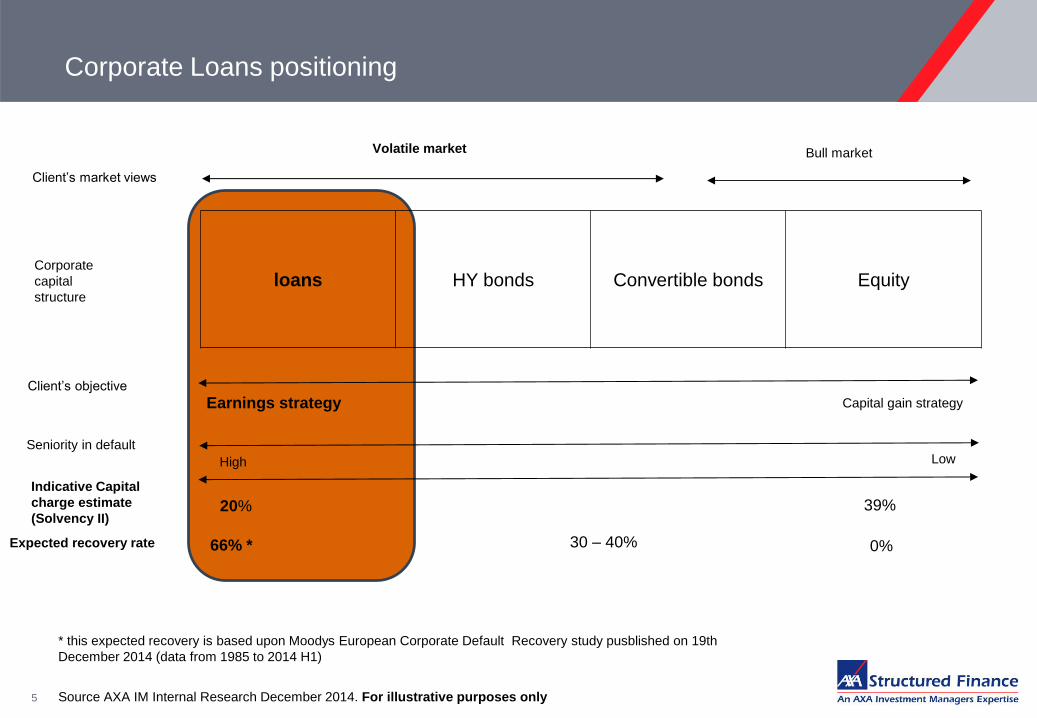
loans HY bonds Convertible bonds Equity
Client’s market views
Volatile market Bull market
Earnings strategy Capital gain strategy
Client’s objective
Seniority in default
66% * 0% Expected recovery rate 30 – 40%
Indicative Capital
charge estimate
(Solvency II) 20% 39%
Corporate
capital
structure
5 Source AXA IM Internal Research December 2014. For illustrative purposes only
Corporate Loans positioning
Low High
* this expected recovery is based upon Moodys European Corporate Default Recovery study pusblished on 19th
December 2014 (data from 1985 to 2014 H1)

Asset hierarchy / Where do Corporate Loans stand in the credit continuum ?
Satellites
Satellites
• Credit: foreign IG, CRE, High-yield, lev. loans, Emerging debt, ABS, CLO,
ILS
• Convertibles
• Property • Equity: Emerging, small, defensive, thematic
CORE SATELLITES
Exp
ecte
d R
etu
rn
Risk Profile (Volatility, capital requirement)
1.5%
3.0%
6.0%
10%
• Credit IG • Govies Periph
Defensive+
• Real Estate loans • Residential Mortgage • ABS/ CLO senior • Infrastructure • Private Debt
Yield Enhancement
• Emerging Debt • HighYield Bond • Corporate Loan
• Convertible • Defensive Equity
• Real Estate
Barbell
• « High octane » Structured assets
• Equities
10% S2 SCR 25% S2 SCR 40% S2 SCR
Corporate Loans are a key credit strategy in the Insurers’ asset hierarchy
6
Source AXA IM The expected return are indicative and provided for information purposes only. No representation is made by AXA IM that such return will be achieved. Actual results may vary and the variations may be material. The calculation of the S2 SCR is based upon a specific assumption set. AXA IM makes no representations about such assumptions and provides no assurance that the calculations can or will be realized. AXA IM expressly disclaims any responsibility for this calculation

7
Leveraged Loans High Yield Bonds
Senior Second Lien Mezzanine Senior Secured Subordinate
Seniority First ranking Usually ranks equal to
senior, but above
mezzanine and high yield
Ranks behind senior and
second lien
Most of the high yield debt market is made of
subordinated debt (which ranks behind senior and
second lien) and which is unsecured (few senior
secured bonds have been issued so far)
Security Enjoys first pledge over
all major subsidiaries
through combination of
structural / contractual
subordination
Shares security with
senior. However, is
second in line for
repayment
Second/third (if structure has
second lien)
Spread/Coupon Euribor + 250 to 500
bps
Euribor + 400 to 700 bps Cash margin of Euribor + 400
to 600 bps and 450 to 700 PIK
(i.e. capitalised interest)
7-9% 8-12%
Covenants Broad range of financial and non-financial maintenance covenants tested every quarter Incurrence covenants only (tested upon specific
cases)
Documentation Extensive Limited
Secondary Trading
Conventions
T+10 par, T+20 distressed Usually T+3, exchange traded
Coupon: Fixed/Floating Floating Fixed
Maturity Typically from 5 to 10 years (However, given that all loans are callable at par, the
historical average life of loans is 2.5 years)
Typically 10 year
Call Protections Senior secured callable at any time. Call protections and premiums mostly for second
lien and mezzanine.
Call protections
Private / Public Rating Mostly private ratings Public ratings
Volatility Historically low, higher since summer 2007 (see p.7) High (see p.7)
Recovery in Default Average historical rate of 70% Average historical rate of 30%
Source: Citi, Morgan Stanley
European Leveraged Loans and High Yield Bonds
8
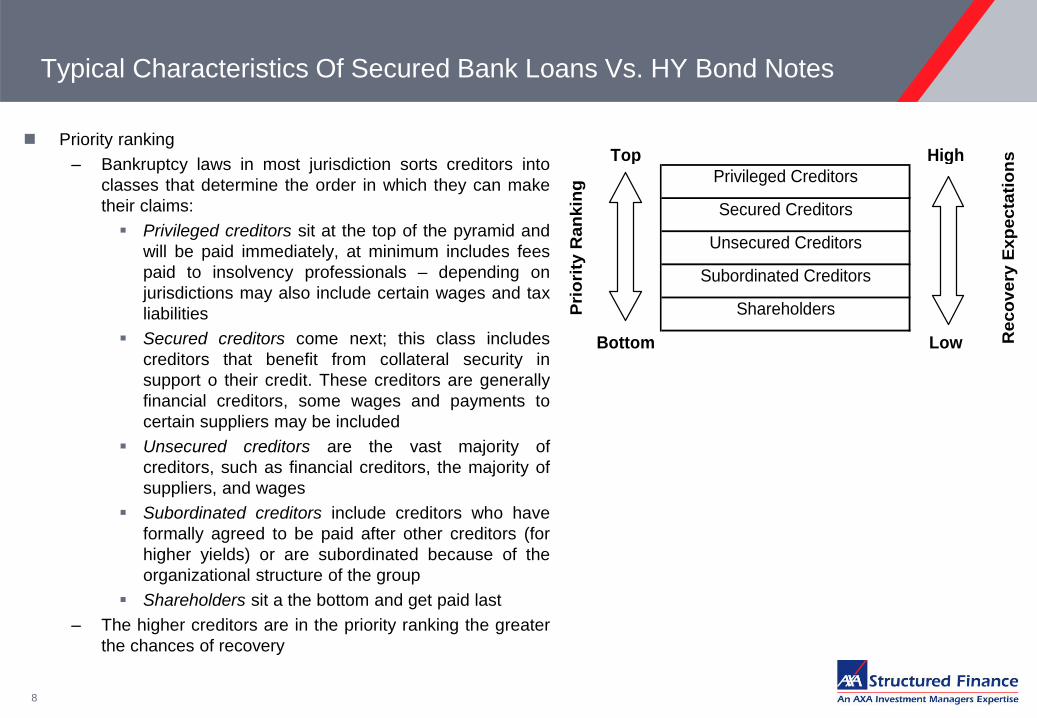
Typical Characteristics Of Secured Bank Loans Vs. HY Bond Notes
Priority ranking
– Bankruptcy laws in most jurisdiction sorts creditors into
classes that determine the order in which they can make
their claims:
Privileged creditors sit at the top of the pyramid and
will be paid immediately, at minimum includes fees
paid to insolvency professionals – depending on
jurisdictions may also include certain wages and tax
liabilities
Secured creditors come next; this class includes
creditors that benefit from collateral security in
support o their credit. These creditors are generally
financial creditors, some wages and payments to
certain suppliers may be included
Unsecured creditors are the vast majority of
creditors, such as financial creditors, the majority of
suppliers, and wages
Subordinated creditors include creditors who have
formally agreed to be paid after other creditors (for
higher yields) or are subordinated because of the
organizational structure of the group
Shareholders sit a the bottom and get paid last
– The higher creditors are in the priority ranking the greater
the chances of recovery
Top High
Privileged Creditors
Secured Creditors
Unsecured Creditors
Subordinated Creditors
Shareholders
Bottom Low
Pri
ori
ty R
an
kin
g
Re
co
ve
ry E
xp
ec
tati
on
s

9
Typical Characteristics Of Secured Bank Loans Vs. HY Bond Notes
Secured Creditors
– Creditors are secured when they benefit from security or collateral in support of a debt instrument. If thecompany defaults the lender can repossess and realize the collateral to satisfy its claim against the company.Two different objectives may be achieved by requiring collateral:
To ensure that no other financial creditors will rank more senior in insolvency, enhancing recoveryprospects
To achieve full recovery in an event of default
– Collateral may include
Collateral secured by financial assets : Cash / bank accounts, traded securities, Receivables, Insurancepolicies
Collateral secured by tangible assets : Inventory / stocks, Transportation and equipment, real Estate,Equipment
Collateral secured by agreements of various types : Right and patents, contracts and concessions
Intangible asset and shares in subsidiaries
Covenants / Undertakings
– Loan agreements have a series of restrictions that dictate to varying degrees how borrower can operate andcarry themselves financially. The size of the covenant package increase with the borrower’s financial risk.
– The main objective being, to some extend, to control the financial risk in controlling debt issuance, in imposingreporting requirements (monthly, quarterly, annual financial statements, budget, annual meetings…) and cashusage (limitation on capex, acquisitions, disposals, guaranties, dividends…)
– Financial covenants will be set to ensure minimum financial performance measures against the borrower.These covenant are called maintenance covenant as the Borrower must maintain quarterly compliance orsuffer a technical default on the loan agreement – this is a critical difference between loans and bonds (wherefinancial covenants are incurrence based – i.e. not tested regularly but only when incurring additional debt, forinstance).
– Financial covenant package usually includes at least a leverage ratio, a cash flow cover, an interest cover, amaximum capex covenant

CORPORATE LOAN IS A BUILDING BLOCK OF THE HIGH YIELD BUCKET MAIN STRUCTURAL DIFFERENCES LOANS / BONDS
YIELD for corporate loans comparable to HYB (As of 31st March 2015)
o European HYB yield stands at 4,59% (yield to worst offered by the CS Euro HY Bond index) vs. Euribor + 518 bps 3Y discounted margin for the CS Euro Loan index
o US HYB yield stands at 6,60% (Oil & Gas effect) vs. Libor + 518 bps for 3Y discounted margin CS US loans Index
DIVERSIFICATION BENEFITS ACROSS THE HIGH YIELD CREDIT UNIVERSE
o Only 13% overlap in number of issuers between European loans and European HYB
o Only 27% overlap in number of issuers between US loans and US HYB
VOLATILITY : A better suited asset class for insurers from a accounting volatility standpoint
o European Loan market : Monthly volatility (annualized) : 3,84%
o European HYB market : Monthly volatility (annualized) : 7,01%
o US Loan market : Monthly volatility (annualized) : 5,75%
o US HYB market : Monthly volatility (annualized) : 7,85%
(tracked by the Credit Suisse European and US Index from January 2010 to December 2014)
Source: Credit Suisse, March 2015 Past performance are not necessarily representative of future results. Historical market performance are not reliable indicators of future market behavior.
Asset hierarchy / Corporate loan vs. High Yield Bond : Same but Different
10
11
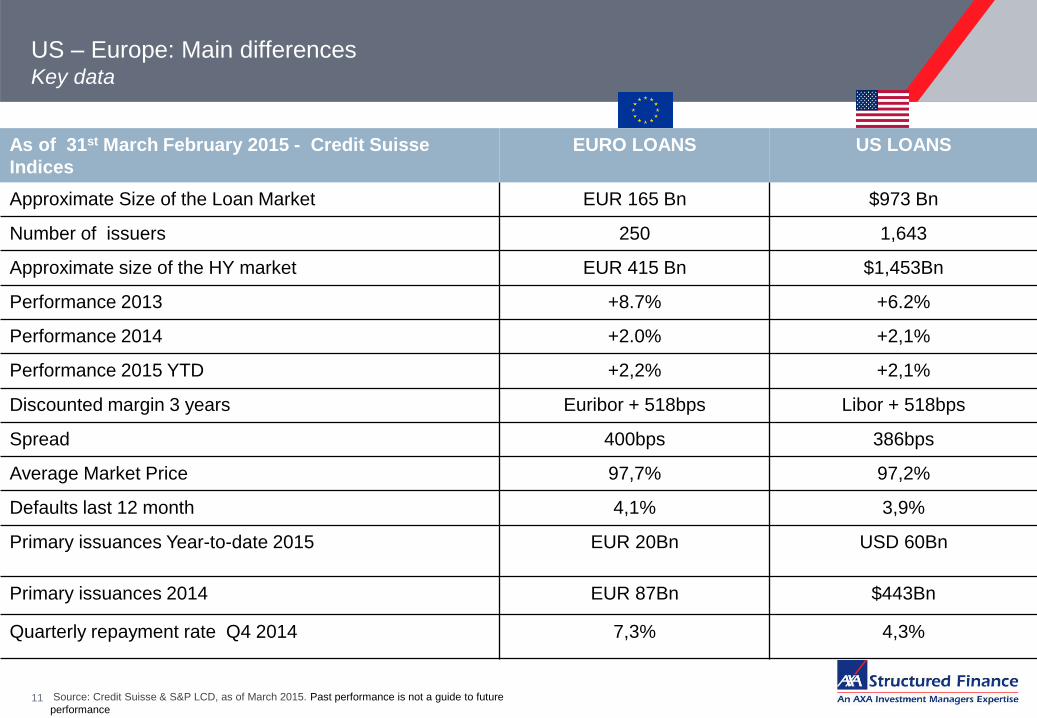
As of 31st March February 2015 - Credit Suisse
Indices
EURO LOANS US LOANS
Approximate Size of the Loan Market EUR 165 Bn $973 Bn
Number of issuers 250 1,643
Approximate size of the HY market EUR 415 Bn $1,453Bn
Performance 2013 +8.7% +6.2%
Performance 2014 +2.0% +2,1%
Performance 2015 YTD +2,2% +2,1%
Discounted margin 3 years Euribor + 518bps Libor + 518bps
Spread 400bps 386bps
Average Market Price 97,7% 97,2%
Defaults last 12 month 4,1% 3,9%
Primary issuances Year-to-date 2015 EUR 20Bn USD 60Bn
Primary issuances 2014 EUR 87Bn $443Bn
Quarterly repayment rate Q4 2014 7,3% 4,3%
US – Europe: Main differences Key data
Source: Credit Suisse & S&P LCD, as of March 2015. Past performance is not a guide to future
performance

12
Trailing 12m trend in loan turnover has been steady in the post-credit crisis period, averaging 83%
This contrasts with the more worrisome trend in the high yield market which has been in steady
decline and shows no signs of slowing
The ownership base is also an important factor here with the loan market approximately 50%
owned by CLOs, with another 3-5% in insurance portfolios, both of which have more permanent
and consistent behavior.
High yield, on the other hand, is nearly 50% owned by the more fickle retail buyer base, with only
11-15% held in insurance portfolios
Sources: LSTA Trade Data Study, Thomson Reuters LPC, S&P LCD, Barclays, Credit Alpha, Market Axess (12/31/14)
Market liquidity provides valuable portfolio management tool
Volumes and Turnover in the US and EUR Leveraged Loan Markets

13
Loans are becoming a standardized asset class
Source: AXA IM
Issue Solution Lead Current Status
Loan identifiers CUSIP and ISIN
Bloomberg IDs
Markit ID
S&P Live - Plan for 100% coverage for S&P
Counterparty identifiers Market Entity Identifiers (MEIs) Markit Live - Over 33,000 MEIs issued
Position reconciliation Loan/Serv and LoanReach DTCC and
Euroclear
Live - More than 5,800 facilities covered
Counterparty data (KYC) Markit Document Exchange (MDE) Markit Live - Account setup, MEI integration and
manual flows complete
Messaging (too many faxes..) WSOData/WSOFax/MarkitClear (trade
documents)
FPML (Swift type messaging system)
Markit
DTCC
FPML pilot is complete
Integration of DTCC into Markit
WSOData complete
Trade Matching & settlement MarkitClear Markit Live - 90% of US market share
Live - 30% of EMEA market share
Delivery Vs Payment (DVP) • LoanSERV
• LoanReach
DTCC
Euroclear
UAT underway
Interoperability between 2 systems
Settlement Data WSOData (loan data)
MarkitClear (trade data)
Markit Next step is to provide real-time
Trade capture/reconciliation WSO (main data system for loan
managers)
MarkitClear
Markit 19 of 20 top global traders use
MarkitClear. Reconciliation will be
automated
Loan Agents systems ACBS, Loan IQ, FlexCube
WSO, CDO Suite
90% of Agents coverage
70% of Buy-side

14
Loans are becoming tradable like bonds
Source: AXA IM
Loans are now an asset class that is more transparent and tradable
– Loan Traders (55 contributors) give daily quotes through Markit (see on the right hand side)
– 70 loans in Europe are being traded everyday by the Street
– Loans can be easily priced like Floating Rate Notes through Bloomberg
– Settlement times (average 20-30 days) remain an issue but being currently adressed

15
Example of live runs on Bloomberg (Citibank)
Source: AXA IM
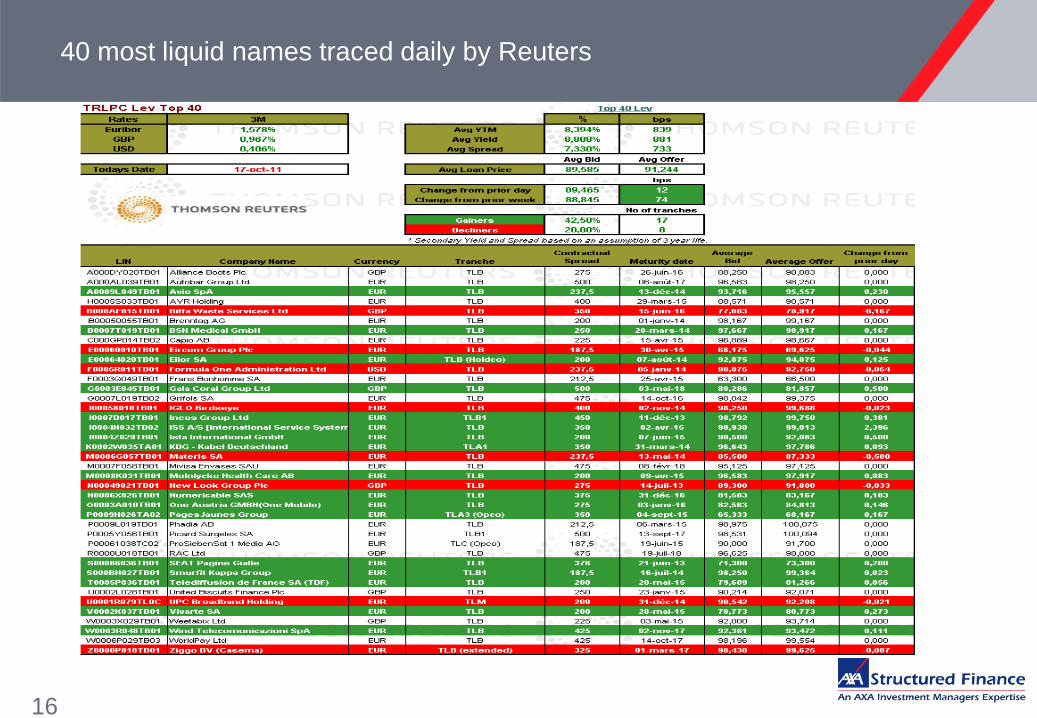
16
40 most liquid names traced daily by Reuters

APPENDIX - MARKET UPDATE
17

18
ANNEX: Average Recovery Rates And Standard Deviations On
Historical Defaults (S&P data)
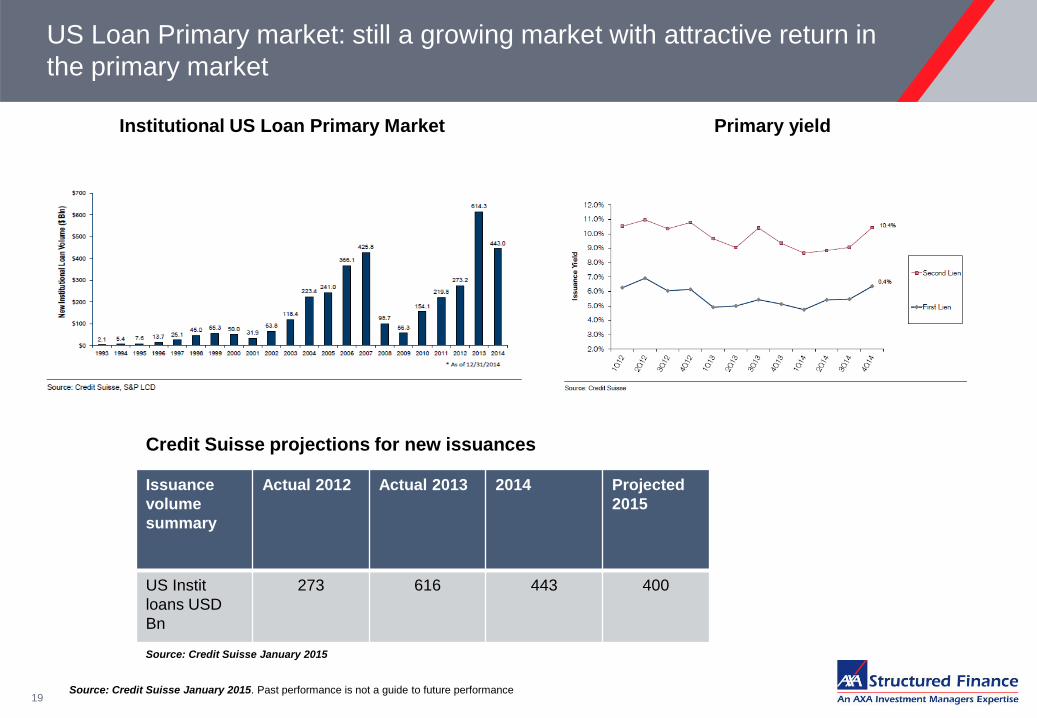
US Loan Primary market: still a growing market with attractive return in
the primary market
19
Institutional US Loan Primary Market
Source: Credit Suisse January 2015. Past performance is not a guide to future performance
Credit Suisse projections for new issuances
Issuance
volume
summary
Actual 2012 Actual 2013 2014 Projected
2015
US Instit
loans USD
Bn
273 616 443 400
Source: Credit Suisse January 2015
Primary yield
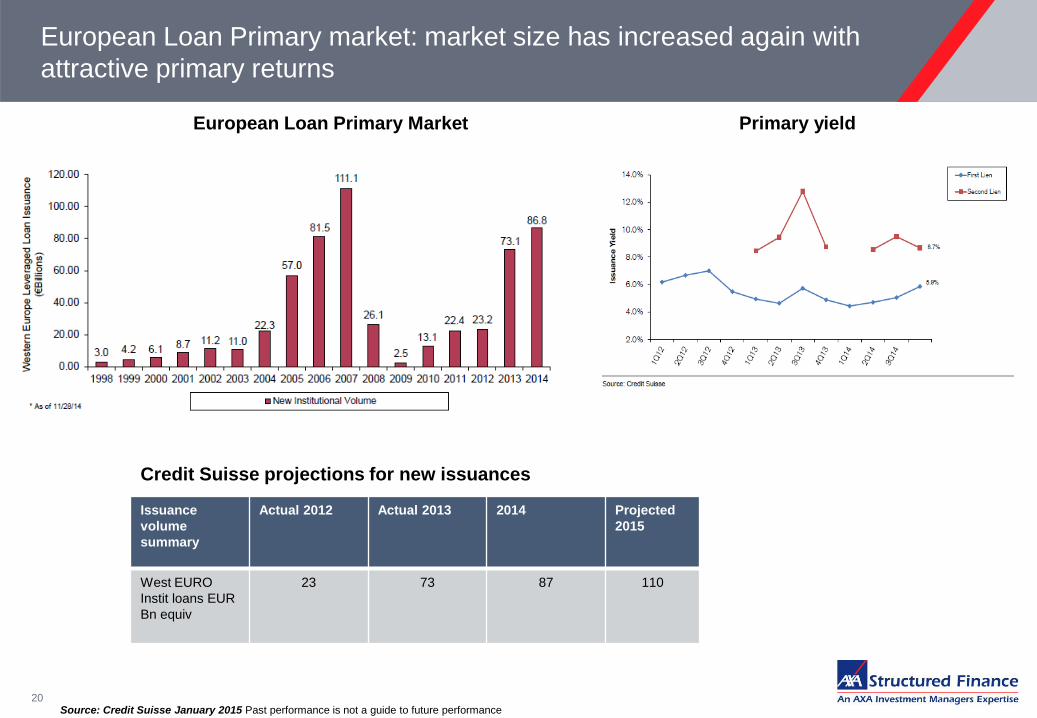
European Loan Primary market: market size has increased again with
attractive primary returns
20 Source: Credit Suisse January 2015 Past performance is not a guide to future performance
European Loan Primary Market
Credit Suisse projections for new issuances
Issuance
volume
summary
Actual 2012 Actual 2013 2014 Projected
2015
West EURO
Instit loans EUR
Bn equiv
23 73 87 110
Primary yield
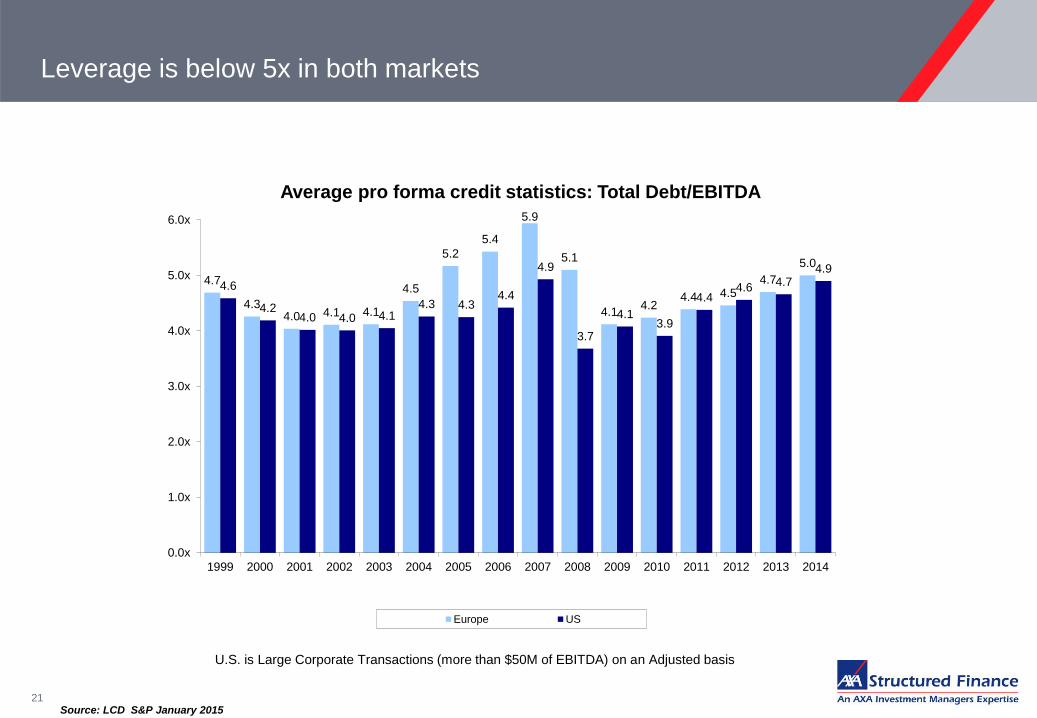
Leverage is below 5x in both markets
21
Average pro forma credit statistics: Total Debt/EBITDA
Source: LCD S&P January 2015
U.S. is Large Corporate Transactions (more than $50M of EBITDA) on an Adjusted basis
4.7
4.3 4.0 4.1 4.1
4.5
5.2
5.4
5.9
5.1
4.1 4.2
4.4 4.5 4.7
5.0
4.6
4.2 4.0 4.0 4.1
4.3 4.3 4.4
4.9
3.7
4.1 3.9
4.4 4.6 4.7
4.9
0.0x
1.0x
2.0x
3.0x
4.0x
5.0x
6.0x
1999 2000 2001 2002 2003 2004 2005 2006 2007 2008 2009 2010 2011 2012 2013 2014
Europe US

Spread per unit of leverage still attractive at 90bps per turn of leverage
in both markets
22
Spread per unit of Leverage
Source: LCD S&P janvier 2015. Past performance is not a guide to future performance
0 bps
20 bps
40 bps
60 bps
80 bps
100 bps
120 bps
140 bps
160 bps
180 bps
Europe U.S.

Average contributed equity above 2007 levels
23
Average contributed equity
Source: LCD S&P October 2014
0%
10%
20%
30%
40%
50%
60%
2001 2002 2003 2004 2005 2006 2007 2008 2009 2010 2011 2012 2013 2014
Eq
uit
y a
s a
Pe
rce
nt
of
To
tal S
ou
rce
s
Europe US
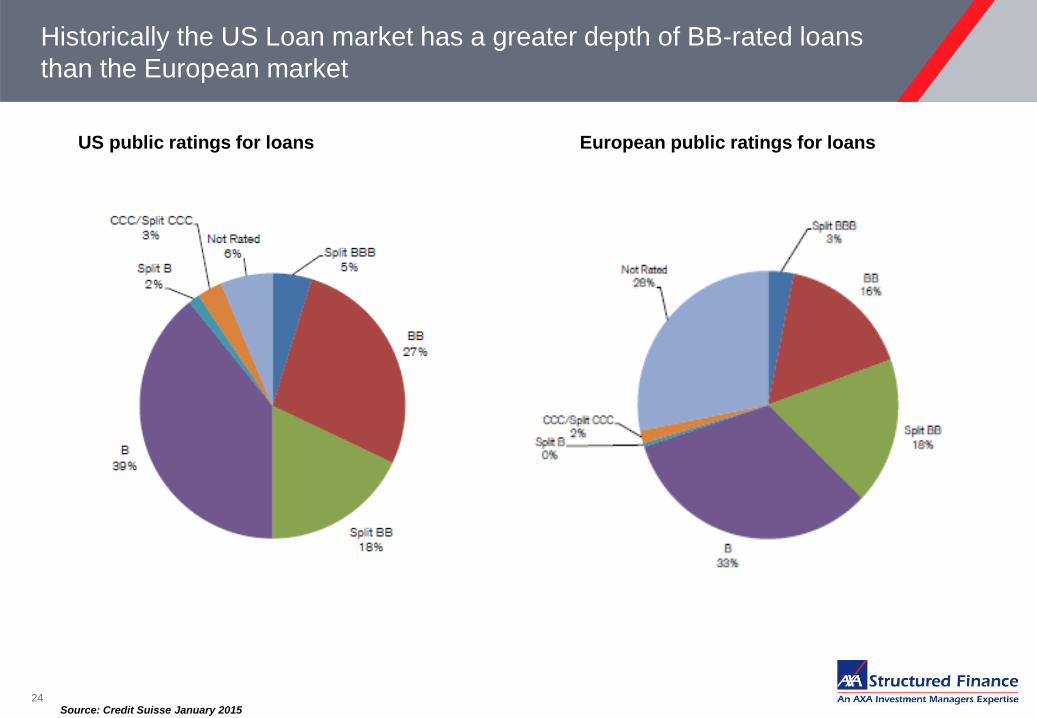
Historically the US Loan market has a greater depth of BB-rated loans
than the European market
24
European public ratings for loans
Source: Credit Suisse January 2015
US public ratings for loans

Relative value in the US: High Yield Vs Leveraged Loans
25
Leveraged Loan Discount margin 3 years
Source: Credit Suisse February 2015 Past performance is not a guide to future performance
Average spread to worst of the Credit Suisse High Yield Index
At the end of February 2015:
- 512 bps of spread-to-worst for High Yield bonds
- 521 bps discount margin for loans above the historical average
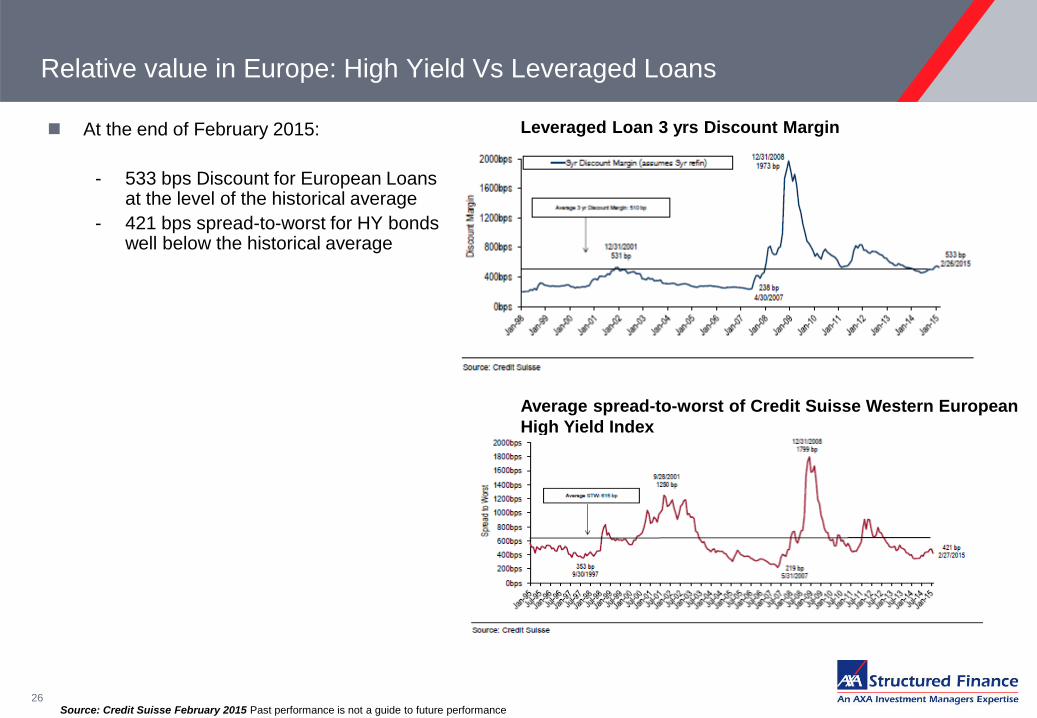
Relative value in Europe: High Yield Vs Leveraged Loans
26
Leveraged Loan 3 yrs Discount Margin
Source: Credit Suisse February 2015 Past performance is not a guide to future performance
Average spread-to-worst of Credit Suisse Western European
High Yield Index
At the end of February 2015:
- 533 bps Discount for European Loans at the level of the historical average
- 421 bps spread-to-worst for HY bonds well below the historical average

Disclaimer
27
This presentation is intended for professional advisers’ use only and should not be relied upon by retail clients. Circulation must be restricted accordingly. Any reproduction of this information, in
whole or in part, is prohibited.
This presentation does not constitute an offer to sell or buy any units in the Fund. Information relating to investments may have been based on research and analysis undertaken or procured by AXA Investment
Managers UK Limited for its own purpose and may have been made available to other expertises within the AXA Investment Managers group of companies who in turn may have acted upon it. Whilst every care is
taken over these comments, no responsibility is accepted for errors omissions that may be contained therein. It is therefore not to be taken as a recommendation to enter into any investment transactions.
Information in this document may be updated from time to time and may vary from previous or future published versions of the document.
This presentation should not be regarded as an offer, solicitation, invitation or recommendation to subscribe for any AXA IM investment service or product and is being provided for informational purposes only. The
views expressed do not constitute investment advice and do not necessarily represent the views of any company within the AXA Investment Managers Group and may be subject to change without notice. No
representation or warranty (including liability towards third parties), express or implied, is made as to the accuracy, reliability or completeness of the information contained herein.
Please note that some of the Funds mentioned may not be available in certain jurisdictions. Please check the countries in which the Fund is registered with the asset manager.
The AXA IM Loan Fund is a Qualifying Investor Fund (QIF) domiciled in Ireland. The Fund is not recognised by the UK Financial Conduct Authority and is not to be marketed to retail investors in the UK. There may
be tax implications for a UK investor investing in the Fund and tax advice should be obtained before an investment is made.
Past performance is not a guide to future performance. The value of investments and the income from them can fluctuate and investors may not get back the amount originally invested. Changes in exchange rates
will affect the value of investments made overseas. Fixed income securities are subject to interest rate risk, credit risk, prepayment risk and market risk. High yield securities are subject to a greater risk of loss of
principal and interests than higher-rated, investment grade fixed income securities. Investors in offshore vehicles advised or sub-advised, in whole or in part, by AXA Investment Managers Group employing the
investment strategy described herein may be subject to currency exchange risk. There is no guarantee that the objectives of the investment strategy described herein will be achieved. Investments in newer markets
and smaller companies offer the possibility of higher returns but may also involve a higher degree of risk. An initial charge is usually made when you purchase units. Your investment should be for the medium to long
term i.e. typically 5-10 years.
Before investing, you should read the prospectus, which includes investment risks relating to these funds. The information contained herein is not a substitute for independent advice.
AXA Structured Finance is an expertise of AXA Investment Managers UK Limited. Issued by AXA Investment Managers UK Limited, which is authorized and regulated by the Financial Conduct Authority in the UK.
Registered in England and Wales No: 01431068. Registered Office: 7 Newgate Street, London EC1A 7NX. Telephone calls may be recorded for quality assurance purposes.