Embed Size (px)
Citation preview

8/6/2019 AWEA first quarter wind energy review
http://slidepdf.com/reader/full/awea-first-quarter-wind-energy-review 1/8
U.S. Wind IndustryFirst Quarter 2011
Market ReportApril 2011
AWEA Data Services
America’s wind power industry installed 1,118 MW of new capacity in the first
quarter of 2011 alone and entered the second quarter with another 5,600 MWunder construction. The under construction figures are nearly twice themegawatts that the industry reported at this time in both 2009 and 2010;moreover, two-thirds of those megawatts are already locked in under long-termpower purchase agreements, indicating an enduring industry that has provenboth nimble and strong through a range of economic and policy conditions.

8/6/2019 AWEA first quarter wind energy review
http://slidepdf.com/reader/full/awea-first-quarter-wind-energy-review 2/8
U.S. Annual and Cumulative Wind Power Capacity
American Wind Energy Association · 1st Quarter 2011 Market Report
0
5,000
10,000
15,000
20,000
25,000
30,000
35,000
40,000
45,000
2001 2002 2003 2004 2005 2006 2007 2008 2009 2010 2011
Annual Capacity Installations (MW)
Cumulative Capacity Installations (MW)
The U.S. wind industry installed 1,118 MW of windpower in the first quarter of 2011, compared to 541MW in the first quarter of 2010. The projectscompleted in the first quarter were spread across 12states.
These installations bring the U.S. cumulative capacityto 41,400 MW.
C a p a c i t y ( M W
)
8/6/2019 AWEA first quarter wind energy review
http://slidepdf.com/reader/full/awea-first-quarter-wind-energy-review 3/8
U.S. Wind Power Capacity Installations by Quarter
American Wind Energy Association · 1st Quarter 2011 Market Report
0
500
1,000
1,500
2,000
2,500
3,000
3,500
4,000
4,500
2008 2009 2010 2011
1Q
2Q
3Q
4Q
C a p a c i t y ( M W
)
8/6/2019 AWEA first quarter wind energy review
http://slidepdf.com/reader/full/awea-first-quarter-wind-energy-review 4/8
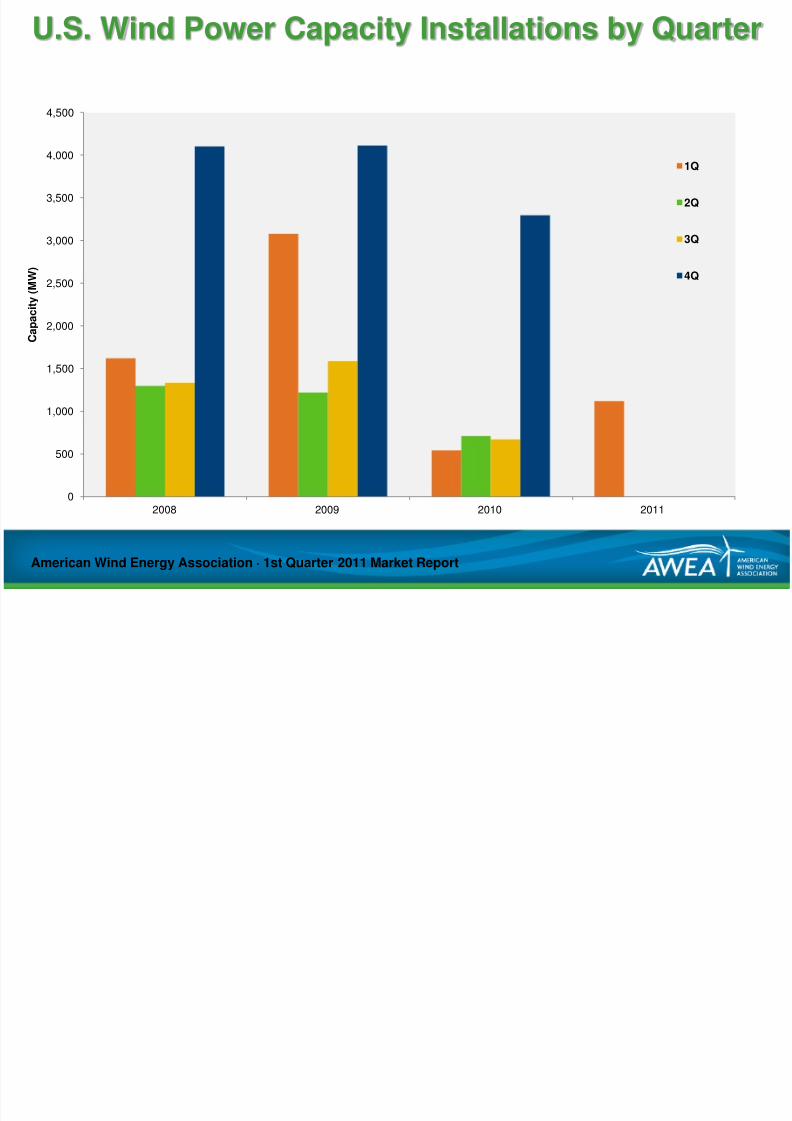
U.S. Wind Power Capacity Installations, Top States
0 2,000 4,000 6,000 8,000 10,000 12,000
Missouri
Wisconsin
Idaho
New MexicoPennsylvania
South Dakota
Kansas
Colorado
Indiana
New York
Wyoming
North Dakota
Oklahoma
Oregon
Illinois
Washington
Minnesota
California
Iowa
Texas
Through 2010
1Q 2011
American Wind Energy Association · 1st Quarter 2011 Market Report
Most Capacity Additions in 1Q 2011 Capacity (MW) Minnesota 293
Illinois 240
Washington 151
Idaho 119
Nebraska 81
Fastest Growing in 1Q 2011 Growth Hawaii 47.5%
Nebraska
38.0%
Idaho 33.6%
Minnesota 13.3%
Illinois 11.7%
8/6/2019 AWEA first quarter wind energy review
http://slidepdf.com/reader/full/awea-first-quarter-wind-energy-review 5/8
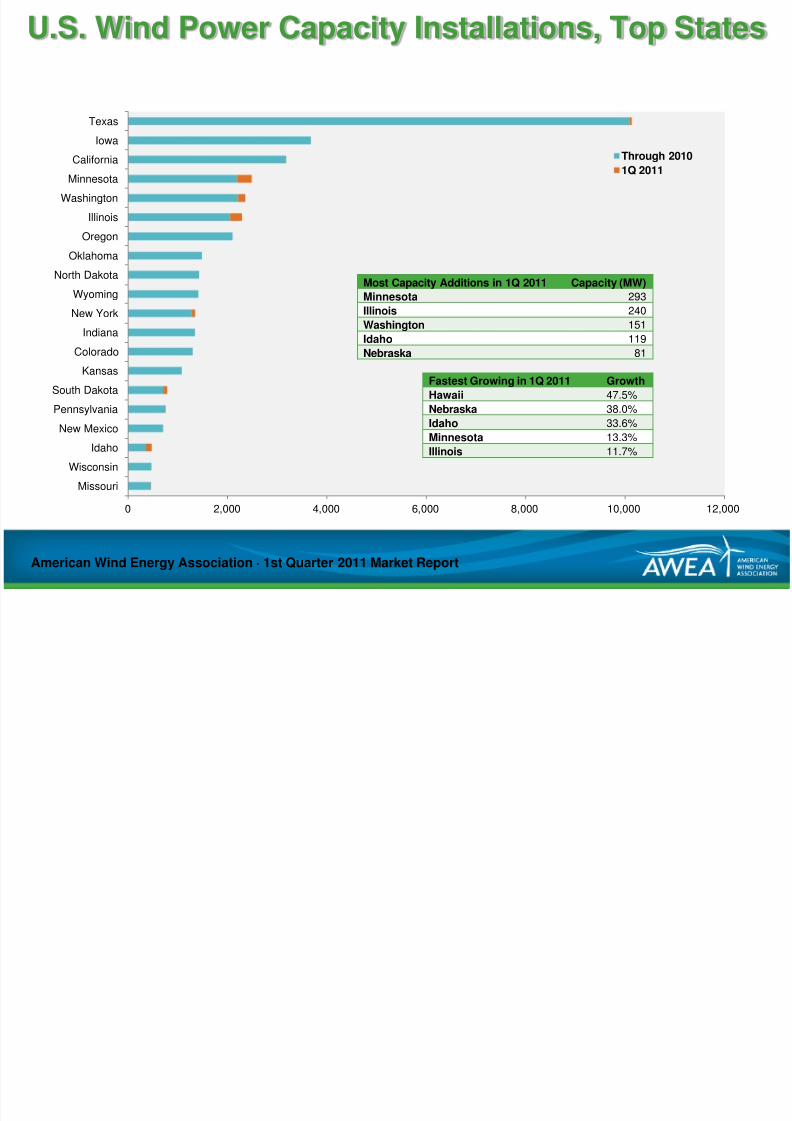
U.S. Wind Power Capacity Under Construction
American Wind Energy Association · 1st Quarter 2011 Market Report
0
1,000
2,000
3,000
4,000
5,000
6,000
7,000
8,000
9,000
10,000
4Q07 1Q08 2Q08 3Q08 4Q08 1Q09 2Q09 3Q09 4Q09 1Q10 2Q10 3Q10 4Q10 1Q11
W i n d C a p a c i t y ,
M W
New Under Construction in Quarter All Under Construction in Quarter Completed Capacity in Quarter
The wind industry had well over 5,600 MW under construction at theend of 2010. During the f irst quarter of 2011, construction began onat least 850 MW of new projects. These projects are spread across
26 states.
8/6/2019 AWEA first quarter wind energy review
http://slidepdf.com/reader/full/awea-first-quarter-wind-energy-review 6/8
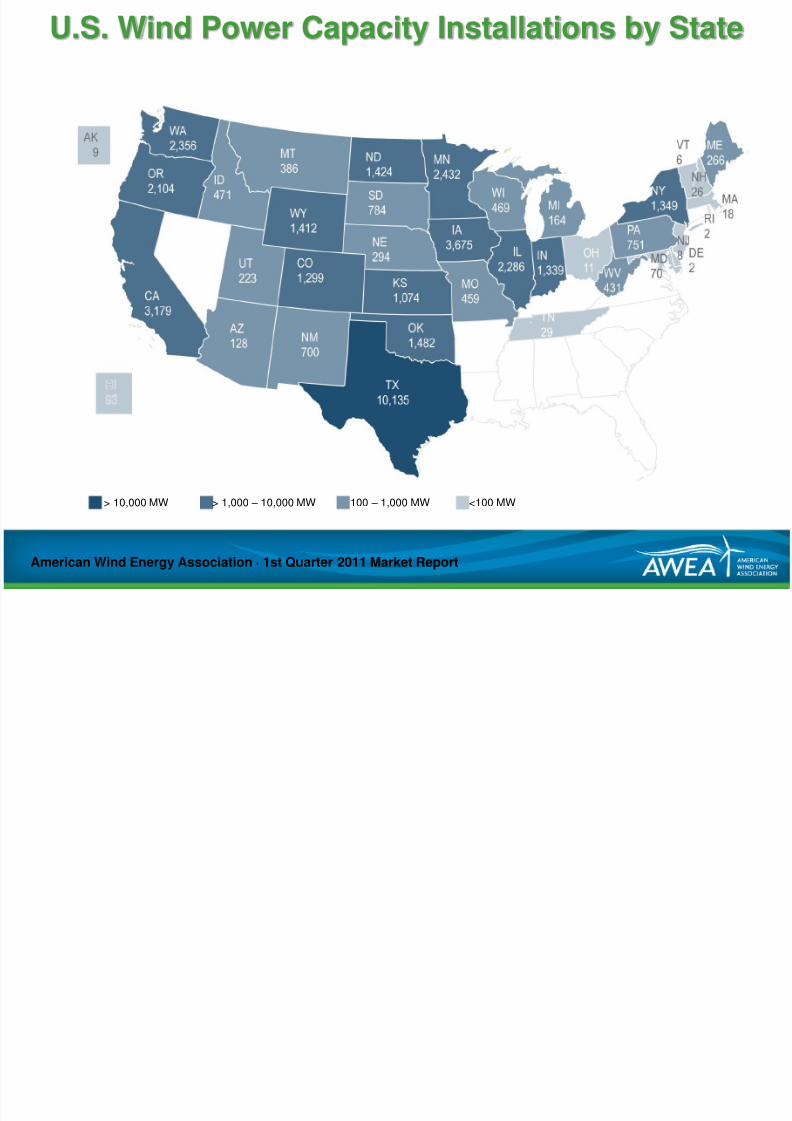
U.S. Wind Power Capacity Installations by State
American Wind Energy Association · 1st Quarter 2011 Market Report
> 10,000 MW > 1,000 – 10,000 MW 100 – 1,000 MW <100 MW

8/6/2019 AWEA first quarter wind energy review
http://slidepdf.com/reader/full/awea-first-quarter-wind-energy-review 7/8
Projects Installed 1Q 2011
American Wind Energy Association · 1st Quarter 2011 Market Report
* Completed, but not reported in 4Q 2010 AWEA Market Report
State Project Name
Project
Capacity
(MW)
Number Of
Wind
Turbines
Turbine
Rating
(MW)
Turbine
Manufacturer Project Developer Project Owner Power Purchaser
CA Tehachapi 1.6 Proto-Type 1.6 1 1.60 GE Energy GE Energy GE Energy GE Energy
HI Kahuku Wind 30.0 12 2.50 Clipper First Wind First Wind HECO
IDIdaho Wind Partners 1 (11 farms
- 2011)118.5 72 1.50 GE Energy
Exergy Development Group
/ Reunion Power
Idaho Wind Partners 1,
LLCIdaho Power
IL Big Sky Wind Facility 239.4 114 2.10 Suzlon Midwest Wind Energy Edison Mission Group
MN Adams 19.8 12 1.65 Alstom Juhl Wind Juhl Wind Xcel Energy
MN Bent Tree 201.3 122 1.65 VestasWind Capital Group/Alliant
Energy
Alliant Energy (Wisconsin
Power & Light)
Alliant Energy
(Wisconsin Power &
Light)
MN Danielson Wind 19.8 12 1.65 Alstom Juhl Wind Juhl Wind Xcel Energy
MN Lakefield (Phase I) 52.5 35 1.50 GE Energy enXco enXcoIndianapolis Power &
Light
MOLost Creek Ridge Wind Farm
(2011)1.6 1 1.60 GE Energy Wind Capital Group Wind Capital Group
Associated Electric
Cooperative Inc. (AECI)
NE Laredo Ridge 81.0 54 1.50 GE Energy Midwest Wind Energy Edison Mission Group NPPD
NY Hardscrabble 74.0 37 2.00 Gamesa Iberdrola Renewables Iberdrola Renewables
PA Frey Farm 3.2 2 1.60 GE Energy
PPL Renewable Energy,
LLC and Lancaster County
Solid Waste Management
Authority
PPL Renewable Energy Turkey Hill Dairy
SD Crow Lake (2011) 75.0 50 1.50 GE Energy
PrairieWinds SD1
(Subsidiary of Basin
Electric)
PrairieWinds SD1
(Subsidiary of Basin
Electric) 63 MW; South
Dakota Wind Partners
10.5 MW; MitchellTechnical Institute 1.5 MW
Basin Electric Power
TX Loraine II 49.5 33 1.50 GE Energy Third Planet Windpower Third Planet Windpower Merchant
WA Juniper Canyon 151.2 63 2.40 Mitsubishi Iberdrola Renewables Iberdrola Renewables
TOTAL: 1118.4 620
WA Kititas Valley * 100.8 48 2.10 Suzlon Horizon-EDPR Horizon- EDPR 7777

8/6/2019 AWEA first quarter wind energy review
http://slidepdf.com/reader/full/awea-first-quarter-wind-energy-review 8/8
Glossary of Terms
American Wind Energy Association · 1st Quarter 2011 Market Report
Term Description Information Source
Capacity (in Megawatts, MW) Total nameplate capacity rating of the wind power project andonline or under construction turbines
Information as confirmed from projectdeveloper at end of each quarter.
Project Name Wind project name supplied by the project developer Project Developer
Completion Quarter Quarter on which wind project is considered to be operational.Usually "Commercial Operation Date”
Specific criteria for "Completion" is at thediscretion of the project developer.
Project Developer Company or companies managing most aspects of projectdevelopment process. Is often a joint effort among severalcompanies.
Project Developer
Turbine Manufacturer Turbine vendor or original equipment manufacturer Project Developer or Turbine Manufacturer
Turbine Rating Nameplate capacity rating of each turbine – typically themaximum potential power output of the turbine generator
Project Developer, Owner or TurbineManufacturer
Owner/Equity Partner Company or companies that will have a managing interest inproject when it is complete, though they may not have 100%ownership. Does not usually include structural equity investors.
Project Developer Owner
Power Purchaser Utility contracted to purchase power under long-term PowerPurchase Agreement (PPA) contract or use the power in case of
utility ownership.
Project Developer or Owner
Merchant Wind power plants that are built without a traditional long-termpower purchase agreement, instead selling power into a spot-market, sometimes with a hedge contract, or an option to sellthe power at a certain price in the future.
Project Developer or Owner