Embed Size (px)
Citation preview

International Journal of Sciences: Basic and Applied Research
(IJSBAR)
ISSN 2307-4531 (Print & Online)
http://gssrr.org/index.php?journal=JournalOfBasicAndApplied
---------------------------------------------------------------------------------------------------------------------------
181
Awareness, Acceptability, and Relevance of the Vision,
Mission, Goals, and Objectives of the Programs of Naval
State University Graduate School
Susan S. Bentora*, Paul Matthew S. Bentorb, Claire Theresa S. Bentorc
aDean, Graduate School, Naval State University, Naval, Biliran 6560, Philippines bInstructor, CIICT, Naval State University, Naval, Biliran 6560, Philippines
cInstructor, CAS, Naval State University, Naval, Biliran 6560, Philippines aEmail: [email protected]
bEmail: [email protected] cEmail: [email protected]
Abstract
The study generally aimed to determine the level of awareness, acceptability, and relevance of the vision,
mission, goals and objectives of the programs of the NSU graduate school. It utilized the descriptive method of
research. The results of the study provide an insight into the awareness, relevance, and acceptance of the
students and NSU constituents of the vision, mission, goals and objectives of the graduate programs of the
university. The outcome may be beneficial in generating information for the enhancement of the practices of the
Graduate school as well as in the dissemination and evaluation of their VMGO. The results revealed that the
graduate school students and other respondents of the study were fully aware, fully relevant and fully acceptable
of the NSU Vision, and Mission and Graduate School goals and objectives of the different courses. Future
research undertakings are conducted similarly to the study in order to increase awareness, relevance, and
acceptance especially among newly enrolled graduate students of the university.
------------------------------------------------------------------------
* Corresponding author.
brought to you by COREView metadata, citation and similar papers at core.ac.uk
provided by GSSRR.ORG: International Journals: Publishing Research Papers in all Fields

International Journal of Sciences: Basic and Applied Research (IJSBAR) (2017) Volume 32, No 1, pp 181-206
182
Keywords: awareness; acceptability; relevance; Naval State University; vision; mission; goals and objectives;
programs of graduate school.
1. Introduction
Every academic institution aspires for quality and excellence of its academic programs. One way of attaining
this is through accreditation. According to the Accrediting Agency of Chartered Colleges and University in the
Philippines Inc. (AACCUP), accreditation is a formal recognition of an education program as processing certain
standards of a quality or excellence based on analysis of the merit of its objectives. It is a means of stimulating
and accelerating the institutional growth and development of schools desiring to achieve excellence, relevance,
and effectiveness. Through this process, an institution could point out its specific needs for quality education
delivery. The authors in [1] account that the vision, mission, goals and objectives statements are the fundamental
guides for the future of the institution and its academic programs. They define collective efforts and align the
whole organization towards the accomplishment of programs and activities. The vision and mission are
statements on the long-term view of the institution of itself and of the world within which it operates, including
the fundamental purpose of its existence, its long-term role and stature, and what it does to achieve this purpose
and how it would like to play its role. The program educational objectives are broad statements that describe the
career and professional accomplishments that the program is preparing graduates to achieve within three to five
years of graduation. These objectives are based on the needs of the program’s constituencies [2]. The graduate
school of Naval State University is heading towards the accreditation of its six programs to determine how well
the university has achieved its objectives and its performance, capabilities, strength and weakness so that it can
appropriately respond to any challenge. In the accreditation process, there are ten areas to be surveyed and the
most fundamental of all area is Area I which is the vision, mission, and objectives. It is fundamental because an
SUC is judged by the degree to which its VMGOs are attained or realized [3]. Numerous studies regarding the
VMGO have been conducted in recent years. A study has shown that the students of a university are aware of its
vision, mission, goals, and objectives and that these students understand and accept these statements, along with
the responsibility of realizing such objectives in their own capacities [4]. Another study has similarly concluded
that the constituents of a university are aware and keen in knowing the importance of the core principles
contained in their VMGOs [5]. The importance of the VMGO to an organization’s success is hard to overstate.
VMGO statements define collective efforts and align the whole organization towards the accomplishment of
programs/projects/activities [6]. It has long been recognized as a key concept in the corporate world as well as in
the academe. Vision and mission are components of strategic management [7]. Given this significance, it is
important to mention the meaning of these key concepts of vision, mission, and objectives. A vision statement is
a forward-looking statement that defines the ideal state of an organization in the future [8]. It gives a picture of
what we want to achieve as a group. It gives every member of the organization hope that something can be
achieved. It is the guiding star that keeps us going in the right direction. The mission statement provides the
necessary guidance for developing strategy, defining critical success factors, searching out key opportunities,
making resource allocation choices and pleasing stakeholders. The mission represents the synthesis of what the
customers and the employees see as being the core business, what products and services should be realized, who
customers are and what values should be delivered to them [9]. Objectives are the ends towards which activity is
aimed; they are the results to be achieved. They represent not only the end point of planning but the end toward

International Journal of Sciences: Basic and Applied Research (IJSBAR) (2017) Volume 32, No 1, pp 181-206
183
which other management functions are aimed. The objectives of the enterprise are the basic plans of the
organization. In other words, the VMGO must be unified and must move towards the same direction. This
means that the objectives should be formulated and done to reach the goals. As a whole, the VMGO of any
institution sets the direction to be pursued by the entire system so much so that all members should aspire for it
and must be committed to its realization. This commitment starts with the awareness and acceptability of this
VMGO by its stakeholders.
2. Methodology
This study utilized the descriptive method of research. This was conducted at the Main Campus in Naval State
University during the school year 2015 – 2016. The respondents of the study were the students of Doctor in
Management, Doctor of Education, Master in Education, Master in Public Management and NSU constituents
with a total of 189 respondents. A semi-structured questionnaire was constructed by the researcher. The
questionnaires were personally distributed to the respondents. The data were analyzed according to the
objectives of the study and were tabulated in a series of tables. Descriptive statistics such as frequency counts,
percentages, and means were used.
3. Results and Discussion
3.1 NSU Vision
Globally competitive state university imbued with positive values contributory to sustainable development and
progress. Table 1 shows the distribution of respondents according to the level of awareness of the NSU vision.
More than three-fourths of the Ed. D. students or 76.67 percent were fully aware of the NSU vision. On the
average, the majority of the respondents 67.72 percent were fully aware.
Table 1: Distribution of Respondents according to the Level of Awareness of the NSU Vision
Awareness
NSU
Constituents
D.M.
Students
Ed.D.
Students
MPM
Students
MAED
Students Overall
f % f % f % f % f % f %
Not Aware
Partially
Aware 2 3.28
2 6.25 1 3.03 4 2.12
Aware 24 39.34 8 24.24 7 23.33 7 21.88 8 24.24 57 30.16
Fully Aware 35 57.38 25 75.76 23 76.67 23 71.88 24 72.73 128 67.72
TOTAL 61 100 33 100 30 100 32 100 33 100 189 100
The student's group shows that the greatest proportion “fully acceptable” or 75.76 percent were the MAED
students followed by D.M. students 72.73 percent, MPM 59.38 percent and a lower proportion 56.67 percent
were Ed.D. students expressing that they “fully accepted” the NSU vision.

International Journal of Sciences: Basic and Applied Research (IJSBAR) (2017) Volume 32, No 1, pp 181-206
184
Table 2: Distribution of Respondents according to the Level of Acceptability on the NSU Vision
Acceptability
NSU
Constituents
D.M.
Students
Ed.D.
Students
MPM
Students
MAED
Students Overall
f % f % f % f % f % f %
Not Acceptable
Partially
Acceptable 3 4.92 1 3.03
1 3.13 1 3.03 5 2.65
Acceptable 28 45.90 8 24.24 13 43.33 12 37.50 7 21.21 75 39.68
Fully
Acceptable 30 49.18 24 72.73 17 56.67 19 59.38 25 75.76 109 57.67
TOTAL 61 100 33 100 30 100 32 100 33 100 189 100
On the NSU constituents, almost half 49.18 percent fully accepted while 45.90 percent were “acceptable”. An
insignificant number 4.92 percent were “partially acceptable” while nobody answered, “not accepted”.
Table 3: Distribution of Respondents according to the Relevance on the NSU Vision
Relevance NSU
Constituents
D.M.
Students
Ed.D.
Students
MPM
Students
MAED
Students Overall
f % f % f % f % f % f %
Not Relevant
Partially Relevant 1 3.03 1 3.13 2 1.06
Relevant 30 49.18 8 24.24 13 43.33 10 31.25 8 24.24 71 37.57
Fully Relevant 31 50.82 24 72.73 17 56.67 21 65.63 25 75.76 116 61.38
TOTAL 61 100 33 100 30 100 32 100 33 100 189 100
As shown in Table 3, 75.76 percent of the MAED students clearly said that NSU vision is fully relevant. On the
overall rating, majority 61.38 percent of the respondents claimed that NSU vision is fully relevant.
3.2 NSU Mission
To generate world-class graduate adequately equipped with quality education professional training, and relevant
skills in maritime education, engineering, art and sciences, and health-related programs, tourism, education,
ICT, criminology, business and entrepreneurship, agriculture, fishery and forestry through instruction, research,
extension, and production services.
The distribution of respondents according to the level of awareness of the NSU mission is given in Table 4.

International Journal of Sciences: Basic and Applied Research (IJSBAR) (2017) Volume 32, No 1, pp 181-206
185
Many of the student respondents in Ed. D. obtained 86.67 percent which means that they are fully aware of the
NSU mission followed by D.M. students 75.76 percent, MPM 75 percent and MAED students 66.67 percent.
Meanwhile, most of the NSU constituents attained 63.93 percent, 34.43 percent were aware and only 1.64
percent was partially aware.
In general, more than one-half 71.96 percent of the respondents were fully aware of the mission and 26.98
percent were aware of the mission.
Table 4: Distribution of Respondents according to the Level of Awareness on the NSU Mission
Awareness NSU
Constituents
D.M.
Students
Ed.D.
Students
MPM
Students
MAED
Students Overall
f % f % F % f % f % f %
Not Aware
Partially Aware 1 1.64 1 3.13 2 1.06
Aware 21 34.43 8 24.24 4 13.33 7 21.88 11 33.33 51 26.98
Fully Aware 39 63.93 25 75.76 26 86.67 24 75.00 22 66.67 136 71.96
TOTAL 61 100 33 100 30 100 32 100 33 100 189 100
Table 5: Distribution of Respondents according to the Level of Acceptability on the NSU Mission
Acceptability
NSU
Constituents
D.M.
Students
Ed.D.
Students
MPM
Students
MAED
Students Overall
f % f % F % f % f % f %
Not Acceptable 1 3.13 1 0.53
Partially
Acceptable 3 4.92
1 3.03 4 2.12
Acceptable 24 39.34 8 24.24 14 46.67 9 28.13 14 42.42 69 36.51
Fully Acceptable 34 55.74 25 75.76 16 53.33 22 68.75 18 54.55 115 60.85
TOTAL 61 100 33 100 30 100 32 100 33 100 189 100
As gleaned in Table 5, the majority of D.M. students 75.76 percent fully accepted the NSU mission, followed by
MPM students 68.75 percent.
While the response of NSU constituents, more than half or 55.74 percent were also fully acceptable, 39.34
percent were acceptable and only 4.92 percent were partially acceptable.
Table 6 presents the distribution of respondents according to the relevance of the NSU mission. Among of the
students’ respondents, D.M. got 75.76 percent which they claimed that NSU mission is fully relevant while
NSU constituents obtained the same percentage of 49.18 in both fully aware and aware.

International Journal of Sciences: Basic and Applied Research (IJSBAR) (2017) Volume 32, No 1, pp 181-206
186
Table 6: Distribution of Respondents according to the Relevance on the NSU Mission
Relevance
NSU
Constituents
D.M.
Students
Ed.D.
Students
MPM
Students
MAED
Students Overall
f % f % F % f % f % f %
Not Relevant
Partially
Relevant 1 1.64
1 0.53
Relevant 30 49.18 8 24.24 11 36.67 10 31.25 12 36.36 71 37.57
Fully
Relevant 30 49.18 25 75.76 19 63.33 22 68.75 21 63.64 117 61.90
TOTAL 61 100 33 100 30 100 32 100 33 100 189 100
3.3 GS Goal
To make NSU a center of human resources development towards quality and equality of life through relevant
graduate programs, emphasizing research capabilities of students transforming them into the creator of
knowledge not just users of knowledge.
Table 7: Distribution of Respondents according to the Level of Awareness of the GS Goal
Awareness
NSU
Constituents
D.M.
Students
Ed.D.
Students
MPM
Students
MAED
Students Overall
f % f % f % f % f % f %
Not Aware 1 1.64 1 0.53
Partially
Aware 3 4.92
2 6.25 1 3.03 6 3.17
Aware 28 45.90 6 18.18 15 50.00 7 21.88 8 24.24 64 33.86
Fully Aware 29 47.54 27 81.82 15 50.00 23 71.88 24 72.73 118 62.43
TOTAL 61 100 33 100 30 100 32 100 33 100 189 100
Table 7 presents the distribution of respondents according to the level of awareness of the Graduate School goal.
Among of the students’ respondents, D.M. got 81.82 percent which they claimed that they are fully aware while
NSU constituents obtained the percentage of 47.54 in fully aware and 45.90 percent in aware.
Table 8 presents the distribution of respondents according to the acceptability of the Graduate School goal.
Among of the students’ respondents, MAED got 75.76 percent which they declared fully acceptable while NSU
constituents obtained the percentage of 49.18 in the fully acceptable category.

International Journal of Sciences: Basic and Applied Research (IJSBAR) (2017) Volume 32, No 1, pp 181-206
187
As shown in Table 9, 75.76 percent both in MAED and D.M. students clearly said that Graduate School goal is
fully relevant. On the overall rating, majority 60.85 percent of the respondents claimed that Graduate School
goal is fully relevant.
Table 8: Distribution of Respondents according to the Acceptability of the GS Goal
Acceptability
NSU
Constituents
D.M.
Students
Ed. D.
Students
MPM
Students
MAED
Students Overall
f % f % f % f % f % f %
Not Acceptable
Partially
Acceptable 4 6.56
1 3.13 1 3.03 6 3.17
Acceptable 27 44.26 10 30.30 15 50.00 9 28.13 7 21.21 68 35.98
Fully
Acceptable 30 49.18 23 69.70 15 50.00 22 68.75 25 75.76 115 60.85
TOTAL 61 100 33 100 30 100 32 100 33 100 189 100
Table 9: Distribution of Respondents according to the Relevance of the GS Goal
Relevance
NSU
Constituents
D.M.
Students
Ed.D.
Students
MPM
Students
MAED
Students Overall
f % f % F % f % f % f %
Not Relevant
Partially
Relevant 3 4.92
1 3.13
4 2.12
Relevant 29 47.54 8 24.24 15 50.00 10 31.25 8 24.24 70 37.04
Fully
Relevant 29 47.54 25 75.76 15 50.00 21 65.63 25 75.76 115 60.85
TOTAL 61 100 33 100 30 100 32 100 33 100 189 100
3.4 Objectives of DM
Objective 1 – To promote executive and leadership capabilities as an instrument for change, productivity, and
development.
The first objective is stated as “To promote executive and leadership capabilities as an instrument for change,
productivity, and development”.

International Journal of Sciences: Basic and Applied Research (IJSBAR) (2017) Volume 32, No 1, pp 181-206
188
More than one-half of the student respondents 63.64 percent responded that they were fully aware of the first
objective of Doctor in Management. Meanwhile, NSU constituents attained 49.18 percent who were fully aware
and only 3.28 percent were not aware.
Table 10: Distribution of Respondents according to the Level of Awareness of the D.M. Objective One
Awareness NSU Constituents D.M. Students Overall
f % f % f %
Not Aware 2 3.28 2 2.13
Partially Aware 4 6.56 4 4.26
Aware 25 40.98 12 36.3 37 39.36
Fully Aware 30 49.18 21 63.64 51 54.26
TOTAL 61 100 33 100% 94 100
Table 11: Distribution of Respondents according to the Acceptability of the D.M. Objective One
Acceptability NSU Constituents D.M. Students Overall
f % f % f %
Not Acceptable
Partially Acceptable 2 3.28 2 2.13
Acceptable 26 42.62 9 27.27% 35 37.23
Fully Acceptable 33 54.10 24 72.73% 57 60.64
TOTAL 61 100 33 100% 94 100
In terms of the acceptability of the first objective, majority 72.73 percent of D.M. students rated fully acceptable
and 27.27 percent were acceptable.
More than one-half 54.10 percent of the NSU constituents were fully acceptable, 43.62 percent were acceptable
and only 3.28 percent were partially acceptable.
On the average, more than one-half of the total respondents fully acceptable 60.64 percent while 37.23 percent
were acceptable and only few 2.13 percent were partially acceptable.
In terms of the relevance of the first objective, most of the D.M. students 75.75 percent rated fully relevant and
24.24 percent were relevant. More than one-half 52.4 percent of the NSU constituents were fully relevant, 42.62
percent were relevant and only 4.92 percent were partially relevant.
On the average, more than one-half of the total respondents fully relevant 60.64 percent while 36.17 percent
were relevant and only few 3.19 percent were partially relevant.

International Journal of Sciences: Basic and Applied Research (IJSBAR) (2017) Volume 32, No 1, pp 181-206
189
Objective 2 – To develop decision-making capabilities by straightening the culture of research, especially on
legal and scientific realism for the advancement of the organization.
Table 12: Distribution of Respondents according to the Relevance of the D.M. Objective One
Relevance NSU Constituents D.M. Students Overall
Freq. % Freq. % Freq. %
Not Relevant
Partially Relevant 3 4.92 3 3.19
Relevant 26 42.62 8 24.24 34 36.17
Fully Relevant 32 52.46 25 75.76 57 60.64
TOTAL 61 100 33 100 94 100
Table 13: Distribution of Respondents according to the Level of Awareness of the D.M. Objective Two
Awareness NSU Constituents D.M. Students Overall
Freq. % Freq. % Freq. %
Not Aware 2 3.28 2 2.13
Partially Aware 4 6.56 4 4.26
Aware 28 45.90 10 30.30 38 40.43
Fully Aware 27 44.26 23 69.70 50 53.19
TOTAL 61 100 33 100 94 100
The second objective is “To develop decision-making capabilities by straightening the culture of research
especially on legal and scientific realism for the advancement of the organization.” More than one-half 69.70
percent of the student respondent responded that they are fully aware with the objective two of Doctor in
Management.
A little less than one-third 30.30 percent were aware while nobody in partially aware and not aware respectively.
Table 14: Distribution of Respondents according to the Acceptability of the D.M. Objective Two
Acceptability NSU Constituents D.M. Students Overall
f % f % f %
Not Acceptable
Partially Acceptable 3 4.92 3 3.19
Acceptable 23 37.70 12 36.36 35 37.23
Fully Acceptable 35 57.38 21 63.64 56 59.57
TOTAL 61 100 33 100 94 100

International Journal of Sciences: Basic and Applied Research (IJSBAR) (2017) Volume 32, No 1, pp 181-206
190
As illustrated in Table 14, most of the D.M. students 63.64 percent fully accepted while 36.36 percent claimed
that they accepted the objective two of the program.
Of all the respondents, more than one-half 59.57 percent were fully acceptable while more than one-third 37.23
percent were acceptable. Only few 3.19 percent were partially acceptable.
Table 15: Distribution of Respondents according to the Relevance of the D.M. Objective Two
Relevance NSU Constituents D.M. Students Overall
Freq. % Freq. % Freq. %
Not Relevant
Partially Relevant 3 4.92 3 3.19
Relevant 27 44.26 10 30.30 37 39.36
Fully Relevant 31 50.82 23 69.70 54 57.45
TOTAL 61 100 33 100 94 100
Table 15 shows that most of the D.M. students 69.70 percent said that the second objective was fully relevant
while 30.30 percent claimed that it was relevant.
Of all the respondents, more than one-half 57.45 percent were fully relevant while more than one-third 39.37
percent were relevant. Only few 3.19 percent were partially relevant.
Objective 3 – To keep abreast of the trends, problems, and issues in public governance.
Table 16: Distribution of Respondents according to the Level of Awareness of the D.M. Objective Three
Awareness NSU Constituents D.M. Students Overall
f % f % f %
Not Aware 2 3.28 2 2.13
Partially Aware 4 6.56 4 4.26
Aware 25 40.98 7 21.21 32 34.04
Fully Aware 30 49.18 26 78.79 56 59.57
TOTAL 61 100 33 100 94 100
The third objective of the D.M. program is to keep abreast of the trends, problems, and issues in public
governance.
The majority of D.M. students 78.79 percent were fully aware and 49.18 percent of NSU constituents were also
fully aware.

International Journal of Sciences: Basic and Applied Research (IJSBAR) (2017) Volume 32, No 1, pp 181-206
191
On the overall, more than one-half 59.57 percent were fully aware while a little 2.13 percent were not aware.
As illustrated in Table 17, it shows the distribution of respondents according to the acceptability of the D.M.
students of the third objective.
The majority of D.M. students 75.76 percent were fully acceptable and 54.10 percent of NSU constituents were
also fully acceptable.
On the overall, more than one-half 61.70 percent were fully acceptable while a little 2.13 percent were not
acceptable.
Table 17: Distribution of Respondents according to the Acceptability of the D.M. Objective Three
Acceptability NSU Constituents D.M. Students Overall
Freq. % Freq. % Freq. %
Not Acceptable
Partially Acceptable 2 3.28 2 2.13
Acceptable 26 42.62 8 24.24 34 36.17
Fully Acceptable 33 54.10 25 75.76 58 61.70
TOTAL 61 100 33 100 94 100
Table 18: Distribution of Respondents according to the Relevance of the D.M. Objective Three
Relevance NSU Constituents D.M. Students Overall
Freq. % Freq. % Freq. %
Not Relevant
Partially Relevant 3 4.92 3 3.19
Relevant 27 44.26 8 24.24 35 37.23
Fully Relevant 31 50.82 25 75.76 56 59.57
TOTAL 61 100 33 100 94 100
As presented in Table 18, it shows the distribution of respondents according to the relevance of the D.M.
students of the third objective.
The majority of D.M. students 75.76 percent claimed that the third objective was fully relevant while 50.82
percent of NSU constituents were also fully relevant.
On the overall, more than one-half 59.57 percent said fully relevant while a little 3.19 percent were not relevant.

International Journal of Sciences: Basic and Applied Research (IJSBAR) (2017) Volume 32, No 1, pp 181-206
192
Objective 4 – To instill proper attitude values and ethic towards work for total human development.
Table 19 shows the distribution of respondents according to the level of awareness of the D.M. students of the
fourth objective.
The majority of D.M. students 87.88 percent claimed that they were fully aware of the fourth objective while
50.82 percent of NSU constituents were also fully aware.
On the overall, more than one-half 63.83 percent said fully aware while a little 2.13 percent were not aware.
Table 19: Distribution of Respondents according to the Level of Awareness of the D.M. Objective Four
Awareness NSU Constituents D.M. Students Overall
Freq. % Freq. % Freq. %
Not Aware 2 3.28 2 2.13
Partially Aware 4 6.56 4 4.26
Aware 24 39.34 4 12.12 28 29.79
Fully Aware 31 50.82 29 87.88 60 63.83
TOTAL 61 100 33 100 94 100
Table 20: Distribution of Respondents according to the Acceptability of the D.M. Objective Four
Acceptability NSU Constituents D.M. Students Overall
Freq. % Freq. % Freq. %
Not Acceptable
Partially Acceptable 3 4.92 3 3.19
Acceptable 26 42.62 9 27.27 35 37.23
Fully Acceptable 32 52.46 24 72.73 56 59.57
TOTAL 61 100 33 100 94 100
Table 20 shows the distribution of respondents according to the acceptability of the D.M. students of the fourth
objective. The majority of D.M. students 72.73 percent stated that they fully accepted with the fourth objective
while 52.46 percent of NSU constituents were also fully accepted. On the overall, more than one-half 59.57
percent said fully acceptable while a little 3.19 percent were partially acceptable.
As presented in Table 21, it shows the distribution of respondents according to the relevance of the D.M.
students of the fourth objective.
The majority of D.M. students 84.85 percent claimed that the fourth objective was fully relevant while 54.10
percent of NSU constituents were also fully relevant.

International Journal of Sciences: Basic and Applied Research (IJSBAR) (2017) Volume 32, No 1, pp 181-206
193
On the overall, more than one-half 64.89 percent said fully relevant while a little 4.26 percent were partially
relevant.
Table 21: Distribution of Respondents according to the Relevance of the D.M. Objective Four
Relevance NSU Constituents D.M. Students Overall
Freq. % Freq. % Freq. %
Not Relevant
Partially Relevant 4 6.56 4 4.26
Relevant 24 39.34 5 15.15 29 30.85
Fully Relevant 33 54.10 28 84.85 61 64.89
TOTAL 61 100 33 100 94 100
Objective 5 – To harness graduate students’ potentials and abilities for the managerial and administrative
position.
Table 22: Distribution of Respondents according to the Level of Awareness of the D.M. Objective Five
Awareness NSU Constituents D.M. Students Overall
Freq. % Freq. % Freq. %
Not Aware 2 3.28 2 2.13
Partially Aware 4 6.56 4 4.26
Aware 26 42.62 7 21.21 33 35.11
Fully Aware 29 47.54 26 78.79 55 58.51
TOTAL 61 100 33 100 94 100
Table 22 shows the distribution of respondents according to the level of awareness of the D.M. students of the
fifth objective.
The majority of D.M. students 78.79 percent claimed that they were fully aware of the fifth objective while
47.54 percent of NSU constituents were also fully aware.
On the overall, more than one-half 58.51 percent said fully aware while a little 2.13 percent were not aware.
Table 23 shows the distribution of respondents according to the acceptability of the D.M. students of the fifth
objective.
The majority of D.M. students 84.85 percent stated that they fully accepted with the fifth objective while 52.46
percent of NSU constituents were also fully accepted.

International Journal of Sciences: Basic and Applied Research (IJSBAR) (2017) Volume 32, No 1, pp 181-206
194
On the overall, more than one-half 63.83 percent said fully acceptable while a little 3.19 percent were partially
acceptable.
Table 23: Distribution of Respondents according to the Acceptability of the D.M. Objective Five
Acceptability NSU Constituents D.M. Students Overall
Freq. % Freq. % Freq. %
Not Acceptable
Partially Acceptable 3 4.92 3 3.19
Acceptable 26 42.62 5 15.15 31 32.98
Fully Acceptable 32 52.46 28 84.85 60 63.83
TOTAL 61 100 33 100 94 100
Table 24: Distribution of Respondents according to the Relevance of the D.M. Objective Five
Relevance NSU Constituents D.M. Students Overall
Freq. % Freq. % Freq. %
Not Relevant
Partially Relevant 4 6.56 4 4.26
Relevant 25 40.98 3 9.09 28 29.79
Fully Relevant 32 52.46 30 90.91 62 65.96
TOTAL 61 100 33 100 94 100
As presented in Table 24, it shows the distribution of respondents according to the relevance of the D.M.
students of the fifth objective. The majority of D.M. students 90.91 percent claimed that the fifth objective was
fully relevant while 52.46 percent of NSU constituents were also fully relevant. On the overall, more than one-
half 65.96 percent said fully relevant while a little 4.26 percent were partially relevant.
3.5 Objectives of Ed. D
Objectives 1 – Develop and sustain academic excellence and effective leadership for the socio-economic
development of the country and the world through research and research-based higher instruction for the
attainment of advance and specialized knowledge in order to improve the quality of life.
The first objective is to develop and sustain academic excellence and effective leadership for the socio-
economic development of the country and the world through research and research-based higher instruction for
the attainment of advance and specialized knowledge in order to improve the quality of life. The greatest
proportion of Ed. D. students 76.67 percent and NSU constituents 49.18 percent fully aware of the aforecited
objective.

International Journal of Sciences: Basic and Applied Research (IJSBAR) (2017) Volume 32, No 1, pp 181-206
195
Table 25: Distribution of Respondents according to the Level of Awareness of the Ed.D. Objective One
Awareness NSU Constituents Ed.D. Students Overall
Freq. % Freq. % Freq. %
Not Aware 2 3.28 2 2.20
Partially Aware 4 6.56 4 4.40
Aware 25 40.98 7 23.33 32 35.16
Fully Aware 30 49.18 23 76.67 53 58.24
TOTAL 61 100 30 100 91 100
On the overall, the greatest proportion of the whole respondents 58.24 percent fully aware of the first objective
Table 26: Distribution of Respondents according to the Acceptability of the Ed.D. Objective One
Acceptability NSU Constituents Ed.D. Students Overall
Freq. % Freq. % Freq. %
Not Acceptable
Partially Acceptable 3 4.92 3 3.30
Acceptable 26 42.62 11 36.67 37 40.66
Fully Acceptable 32 52.46 19 63.33 51 56.04
TOTAL 61 100 30 100 91 100
The first objective is to develop and sustain academic excellence and effective leadership for the socio-
economic development of the country and the world through research and research-based higher instruction for
the attainment of advance and specialized knowledge in order to improve the quality of life. The greatest
proportion of Ed. D. students 63.33 percent and NSU constituents 52.46 percent fully acceptable with the
aforecited objective. On the other hand, the lowest proportion of the overall respondents agreed but at a lower
category of partially acceptable.
Table 27: Distribution of Respondents according to the Relevance of the Ed.D. Objective One
Relevance NSU Constituents Ed.D. Students Overall
Freq. % Freq. % Freq. %
Not Relevant
Partially Relevant 3 4.92 3 3.30
Relevant 27 44.26 9 30.00 36 39.56
Fully Relevant 31 50.82 21 70.00 52 57.14
TOTAL 61 100 30 100 91 100

International Journal of Sciences: Basic and Applied Research (IJSBAR) (2017) Volume 32, No 1, pp 181-206
196
As gleaned in Table 27, the majority of the Ed. D. students 70 percent claimed that objective 1 is fully relevant
to the program offered in the Graduate School. Meanwhile, 50.82 percent of the NSU constituents agreed that
the aforementioned objective is also fully relevant.
On the overall, the greatest proportion of the whole respondents is more than one-half 57.14 percent fully
relevant with the first objective while a little proportion 3.30 percent were partially relevant.
Objective 2 – Expand frontiers of knowledge by innovating ideas and theories based on advance research and
communicating its findings and results to the different sectors and stakeholders.
Table 28: Distribution of Respondents according to the Level of Awareness of the Ed.D. Objective Two
Awareness NSU Constituents Ed.D. Students Overall
Freq. % Freq. % Freq. %
Not Aware 2 3.28 2 2.20
Partially Aware 4 6.56 4 4.40
Aware 28 45.90 8 26.67 36 39.56
Fully Aware 27 44.26 22 73.33 49 53.85
TOTAL 61 100 30 100 91 100
As presented in Table 28, the majority of the Ed. D. students 73.33 percent claimed that they were fully aware
with the objective 2. Meanwhile, 45.92 percent of the NSU constituents were aware of the aforementioned
objective.
On the overall, the greatest proportion of the whole respondents is more than one-half 53.85 percent fully aware
of the first objective while a little proportion 2.20 percent were not aware.
Table 29: Distribution of Respondents according to the Acceptability of the Ed.D. Objective Two
Acceptability NSU Constituents Ed.D. Students Overall
Freq. % Freq. % Freq. %
Not Acceptable
Partially Acceptable 3 4.92 3 3.30
Acceptable 27 44.26 11 36.67 38 41.76
Fully Acceptable 31 50.82 19 63.33 50 54.95
TOTAL 61 100 30 100 91 100
As presented in Table 29, the majority of the Ed. D. students 63.33 percent claimed that they fully accepted with
the objective 2. Meanwhile, 50.82 percent of the NSU constituents were also fully accepted of the
aforementioned objective.

International Journal of Sciences: Basic and Applied Research (IJSBAR) (2017) Volume 32, No 1, pp 181-206
197
On the overall, the greatest proportion of the whole respondents is more than one-half 54.95 percent fully
acceptable with the first objective while a little proportion 3.30 percent were partially acceptable.
Table 30: Distribution of Respondents according to the Relevance of the Ed.D. Objective Two
Relevance NSU Constituents Ed.D. Students Overall
Freq. % Freq. % Freq. %
Not Relevant
Partially Relevant 4 6.56 4 4.40
Relevant 24 39.34 9 30.00 33 36.26
Fully Relevant 33 54.10 21 70.00 54 59.34
TOTAL 61 100 30 100 91 100
As gleaned in Table 30, the majority of the Ed. D. students 70 percent claimed that objective 2 is fully relevant
to the program offered in the Graduate School. Meanwhile, 54.10 percent of the NSU constituents agreed that
the aforementioned objective is also fully relevant.
On the overall, the greatest proportion of the whole respondents is more than one-half 59.34 percent fully
relevant with the second objective while a little proportion 4.40 percent were partially relevant.
3.6 Objectives of MPM
Objective 1 – Familiarize the nature, duties, and composition of the different government agencies in the local
and national levels, Government Corporation and higher education institution.
Table 31: Distribution of Respondents according to the Level of Awareness of the MPM Objective One
Awareness NSU Constituents M.P.M. Students Overall
Freq. % Freq. % Freq. %
Not Aware 2 3.28 2 2.15
Partially Aware 3 4.92 1 3.13 4 4.30
Aware 26 42.62 7 21.88 33 35.48
Fully Aware 30 49.18 24 75.00 54 58.06
TOTAL 61 100 32 100 93 100
The first objective of MPM program is to familiarize the nature, duties, and composition of the different
government agencies in the local and national levels, Government Corporation and higher education institution.
The table shows that the greatest proportion of MPM students 75.0 percent and NSU constituents 49.18 percent
were fully aware with the aforecited objective 1.

International Journal of Sciences: Basic and Applied Research (IJSBAR) (2017) Volume 32, No 1, pp 181-206
198
On the other hand, the highest proportion of the overall respondents agreed more than one-half 58.06 percent but
at a lower category of not aware of 2.15 percent.
Table 32: Distribution of Respondents according to the Acceptability of the MPM Objective One
Acceptability NSU Constituents M.P.M. Students Overall
Freq. % Freq. % Freq. %
Not Acceptable
Partially Acceptable 4 6.56 4 4.30
Acceptable 29 47.54 13 40.63 42 45.16
Fully Acceptable 28 45.90 19 59.38 47 50.54
TOTAL 61 100 32 100 93 100
Table 32 presents the distribution of respondents according to the acceptability of the MPM objective 1. It is
noted that the greatest proportion of MPM students 59.38 percent fully accepted the objective one while the
NSU constituents 47.54 percent were acceptable and 45.90 percent were fully acceptable. On the other hand, the
highest proportion of the overall respondents agreed more than one-half 50.54 percent were fully acceptable but
at a lower category of partially acceptable with 4.30 percent.
Table 33: Distribution of Respondents according to the Relevance of the MPM Objective One
Relevance NSU Constituents M.P.M. Students Overall
Freq. % Freq. % Freq. %
Not Relevant
Partially Relevant 4 6.56 4 4.30
Relevant 27 44.26 10 31.25 37 39.78
Fully Relevant 30 49.18 22 68.75 52 55.91
TOTAL 61 100 32 100 93 100
Objective 2 – Recognize the various dimensions of public administration such as its fundamental courses,
policies, rules, regulations and procedure.
The second objective of the MPM program is to recognize the various dimensions of public administration such
as its fundamental courses, policies, rules, regulations and procedure. As gleaned in the table, the majority of
MPM students 68.75 percent stated that they were fully aware with the objective 2 while 49.18 percent of NSU
constituents were also fully aware.
On the overall, more than one-half 55.91 percent said that they are fully aware while a little 2.15 percent were
not aware.

International Journal of Sciences: Basic and Applied Research (IJSBAR) (2017) Volume 32, No 1, pp 181-206
199
Table 34: Distribution of Respondents according to the Level of Awareness of the MPM Objective Two
Awareness NSU Constituents M.P.M. Students Overall
Freq. % Freq. % Freq. %
Not Aware 2 3.28 2 2.15
Partially Aware 3 4.92 3 3.23
Aware 26 42.62 10 31.25 36 38.71
Fully Aware 30 49.18 22 68.75 52 55.91
TOTAL 61 100 32 100 93 100
Table 35: Distribution of Respondents according to the Acceptability of the MPM Objective Two
Acceptability NSU Constituents M.P.M. Students Overall
Freq. % Freq. % Freq. %
Not Acceptable
Partially acceptable 4 6.56 4 4.30
Acceptable 29 47.54 11 34.38 40 43.01
Fully Acceptable 28 45.90 21 65.63 49 52.69
TOTAL 61 100 32 100 93 100
Table 35 presents the distribution of respondents according to the acceptability of the MPM objective 2. It is
noted that the greatest proportion of MPM students 65.63 percent fully accepted the objective 2 while the NSU
constituents 47.54 percent were acceptable and 45.90 percent were fully acceptable. On the other hand, the
highest proportion of the overall respondents agreed more than one-half 52.69 percent were fully acceptable but
at a lower category of partially acceptable with 4.30 percent.
Table 36: Distribution of Respondents according to the Relevance of the MPM Objective Two
Relevance NSU Constituents M.P.M. Students Overall
Freq. % Freq. % Freq. %
Not Relevant
Partially Relevant 4 6.56 4 4.30
Relevant 27 44.26 11 34.38 38 40.86
Fully Relevant 30 49.18 21 65.63 51 54.84
TOTAL 61 100 32 100 93 100
Table 36 shows the distribution of respondents according to the level of relevance of the MPM objective 2. It is
noted that the greatest proportion of MPM students 65.63 percent claimed that objective 2 was fully relevant

International Journal of Sciences: Basic and Applied Research (IJSBAR) (2017) Volume 32, No 1, pp 181-206
200
while the NSU constituents 49.18 percent said fully relevant. On the other hand, the highest proportion of the
overall respondents agreed more than one-half 54.84 percent were fully relevant but at a lower category of
partially relevant with 4.30 percent.
Objective 3 – Enhancement proper work attitudes, values, ethics, and conduct.
Table 37: Distribution of Respondents according to the Level of Awareness of the MPM Objective Three
Awareness NSU Constituents M.P.M. Students Overall
Freq. % Freq. % Freq. %
Not Aware 2 3.28 2 2.15
Partially Aware 3 4.92 3 3.23
Aware 26 42.62 7 21.88 33 35.48
Fully Aware 30 49.18 25 78.13 55 59.14
TOTAL 61 100 32 100 93 100
The third objective of the MPM program is to enhance the proper work attitudes, values, ethics and conduct. As
gleaned in the table, the majority of MPM students 78.13 percent stated that they were fully aware with the
objective 3 while 49.18 percent of NSU constituents were also fully aware.
On the overall, more than one-half 59.14 percent said that they are fully aware while a little 2.15 percent were
not aware
Table 38: Distribution of Respondents according to the Acceptability of the MPM Objective Three
Acceptability NSU Constituents M.P.M. Students Overall
Freq. % Freq. % Freq. %
Not Acceptable
Partially acceptable 4 6.56 4 4.30
Acceptable 28 45.90 11 34.38 39 41.94
Fully Acceptable 29 47.54 21 65.63 50 53.76
TOTAL 61 100 32 100 93 100
Table 38 presents the distribution of respondents according to the acceptability of the MPM objective 3. It is
noted that the greatest proportion of MPM students 65.63 percent fully accepted the objective 3 while the NSU
constituents 47.54 percent were fully acceptable. On the other hand, the highest proportion of the overall
respondents agreed more than one-half 53.75 percent were fully acceptable but at a lower category of partially
acceptable with 4.30 percent.
Table 39 shows the distribution of respondents according to the level of relevance of the MPM objective 3. It is

International Journal of Sciences: Basic and Applied Research (IJSBAR) (2017) Volume 32, No 1, pp 181-206
201
noted that the greatest proportion of MPM students 65.63 percent claimed that objective 3 was fully relevant
while the NSU constituents 45.90 percent said fully relevant. On the other hand, the highest proportion of the
overall respondents agreed more than one-half 52.69 percent were fully relevant but at a lower category of
partially relevant with 4.30 percent.
Objective 4 – Hone the competencies of government employees and officials for managerial and executive
functions.
Table 39: Distribution of Respondents according to the Relevance of the MPM Objective Three
Relevance NSU Constituents M.P.M. Students Overall
Freq. % Freq. % Freq. %
Not Relevant
Partially Relevant 4 6.56 4.30% 4.30
Relevant 29 47.54 11 34.38 43.01% 43.01
Fully Relevant 28 45.90 21 65.63 52.69% 52.69
TOTAL 61 100 32 100 100% 100
Table 40: Distribution of Respondents according to the Level of Awareness of the MPM Objective Four
Awareness NSU Constituents M.P.M. Students Overall
Freq. % Freq. % Freq. %
Not Aware 2 3.28 2 2.15
Partially Aware 3 4.92 3 3.23
Aware 26 42.62 5 15.63 31 33.33
Fully Aware 30 49.18 27 84.38 57 61.29
TOTAL 61 100 32 100 93 100
The fourth objective of the MPM program is to hone the competencies of government employees and officials
for managerial and executive functions. As gleaned in the table, the majority of MPM students 84.38 percent
stated that they were fully aware with the objective 4 while 49.18 percent of NSU constituents were also fully
aware. On the overall, more than one-half 61.29 percent said that they are fully aware while a little 2.15 percent
were not aware.
Table 41 presents the distribution of respondents according to the acceptability of the MPM objective 4. It is
noted that the greatest proportion of MPM students 65.63 percent fully accepted the objective 4 while the NSU
constituents 50.82 percent were fully acceptable. On the other hand, the highest proportion of the overall
respondents agreed more than one-half 55.91 percent were fully acceptable but at a lower category of partially
acceptable with 4.30 percent.

International Journal of Sciences: Basic and Applied Research (IJSBAR) (2017) Volume 32, No 1, pp 181-206
202
Table 41: Distribution of Respondents according to the Acceptability of the MPM Objective Four
Acceptability NSU Constituents M.P.M. Students Overall
Freq. % Freq. % Freq. %
Not Acceptable
Partially acceptable 4 6.56 4 4.30
Acceptable 26 42.62 11 34.38 37 39.78
Fully Acceptable 31 50.82 21 65.63 52 55.91
TOTAL 61 100 32 100 93 100
Table 42: Distribution of Respondents according to the Relevance of the MPM Objective Four
Relevance NSU Constituents M.P.M. Students Overall
Freq. % Freq. % Freq. %
Not Relevant
Partially Relevant 4 6.56 4 4.30
Relevant 25 40.98 10 31.25 35 37.63
Fully Relevant 32 52.46 22 68.75 54 58.06
TOTAL 61 100 32 100 93 100
Table 42 shows the distribution of respondents according to the relevance of the MPM objective 4. It is noted
that the greatest proportion of MPM students 68.75 percent claimed that objective 4 was fully relevant while the
NSU constituents 52.46 percent said fully relevant. On the other hand, the highest proportion of the overall
respondents agreed more than one-half 58.06 percent were fully relevant but at a lower category of partially
relevant with 4.30 percent.
3.7 Objectives of Maed
Objective 1 – Create greater opportunities for knowledge generation, skills development, and desirable attitudes
not only for personal gain but also for other’s welfare.
The first objective of the MAED program is to create greater opportunities for knowledge generation, skills
development, and desirable attitudes not only for personal gain but also for other’s welfare.
As gleaned in the table, the majority of MAED students 72.73 percent claimed that they were fully aware with
the objective 1 while 55.74 percent of NSU constituents were also fully aware.
On the overall, more than one-half 61.70 percent said that they are fully aware while a little 2.13 percent were
not aware.

International Journal of Sciences: Basic and Applied Research (IJSBAR) (2017) Volume 32, No 1, pp 181-206
203
Table 43: Distribution of Respondents according to the Level of Awareness of the MAED Objective One
Awareness NSU Constituents MAED Students Overall
Freq. % Freq. % Freq. %
Not Aware 2 3.28 2 2.13
Partially Aware 4 6.56 4 4.26
Aware 21 34.43 9 27.27 30 31.91
Fully Aware 34 55.74 24 72.73 58 61.70
TOTAL 61 100 33 100 94 100
Table 44: Distribution of Respondents according to the Acceptability of the MAED Objective One
Acceptability NSU Constituents MAED Students Overall
Freq. % Freq. % Freq. %
Not Acceptable
Partially acceptable 5 8.20 5 5.32
Acceptable 22 36.07 10 30.30 32 34.04
Fully Acceptable 34 55.74 23 69.70 57 60.64
TOTAL 61 100 33 100 94 100
Table 44 presents the distribution of respondents according to the acceptability of the MAED objective 1. It is
noted that the greatest proportion of MAED students 69.70 percent fully accepted the objective 1 while the NSU
constituents 55.74 percent were fully acceptable. On the other hand, the highest proportion of the overall
respondents agreed more than one-half 60.64 percent were fully acceptable but at a lower category of partially
acceptable with 5.32 percent.
Table 45: Distribution of Respondents according to the Relevance of the MAED Objective One
Relevance NSU Constituents MAED Students Overall
Freq. % Freq. % Freq. %
Not Relevant
Partially Relevant 3 4.92 3 3.19
Relevant 25 40.98 8 24.24 33 35.11
Fully Relevant 33 54.10 25 75.76 58 61.70
TOTAL 61 100 33 100 94 100
Table 45 shows the distribution of respondents according to the relevance of the MAED objective 1. It is noted
that the greatest proportion of MAED students 75.75 percent claimed that objective 1 was fully relevant while
International Journal of Sciences: Basic and Applied Research (IJSBAR) (2017) Volume 32, No 1, pp 181-206
204
the NSU constituents 54.10 percent said fully relevant. On the other hand, the highest proportion of the overall
respondents agreed more than one-half 61.70 percent were fully relevant but at a lower category of partially
relevant with 3.90 percent.
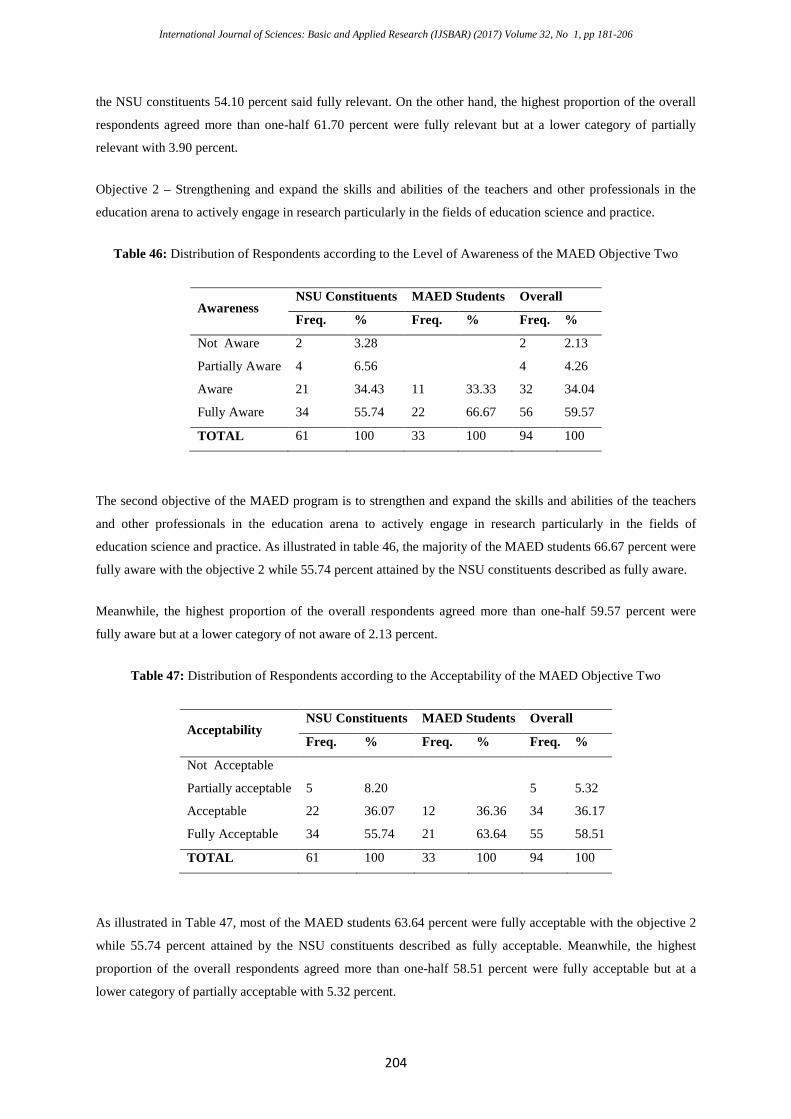
Objective 2 – Strengthening and expand the skills and abilities of the teachers and other professionals in the
education arena to actively engage in research particularly in the fields of education science and practice.
Table 46: Distribution of Respondents according to the Level of Awareness of the MAED Objective Two
Awareness NSU Constituents MAED Students Overall
Freq. % Freq. % Freq. %
Not Aware 2 3.28 2 2.13
Partially Aware 4 6.56 4 4.26
Aware 21 34.43 11 33.33 32 34.04
Fully Aware 34 55.74 22 66.67 56 59.57
TOTAL 61 100 33 100 94 100
The second objective of the MAED program is to strengthen and expand the skills and abilities of the teachers
and other professionals in the education arena to actively engage in research particularly in the fields of
education science and practice. As illustrated in table 46, the majority of the MAED students 66.67 percent were
fully aware with the objective 2 while 55.74 percent attained by the NSU constituents described as fully aware.
Meanwhile, the highest proportion of the overall respondents agreed more than one-half 59.57 percent were
fully aware but at a lower category of not aware of 2.13 percent.
Table 47: Distribution of Respondents according to the Acceptability of the MAED Objective Two
Acceptability NSU Constituents MAED Students Overall
Freq. % Freq. % Freq. %
Not Acceptable
Partially acceptable 5 8.20 5 5.32
Acceptable 22 36.07 12 36.36 34 36.17
Fully Acceptable 34 55.74 21 63.64 55 58.51
TOTAL 61 100 33 100 94 100
As illustrated in Table 47, most of the MAED students 63.64 percent were fully acceptable with the objective 2
while 55.74 percent attained by the NSU constituents described as fully acceptable. Meanwhile, the highest
proportion of the overall respondents agreed more than one-half 58.51 percent were fully acceptable but at a
lower category of partially acceptable with 5.32 percent.

International Journal of Sciences: Basic and Applied Research (IJSBAR) (2017) Volume 32, No 1, pp 181-206
205
Table 48 shows that majority of the MAED students 78.79 percent were fully relevant with the objective 2 while
55.74 percent attained by the NSU constituents described as fully relevant.
Meanwhile, the highest proportion of the overall respondents agreed more than one-half 63.83 percent were
fully relevant but at a lower category of partially relevant with 3.19 percent.
Table 48: Distribution of Respondents according to the Relevance of the MAED Objective Two
Relevance NSU Constituents MAED Students Overall
Freq. % Freq. % Freq. %
Not Relevant
Partially Relevant 3 4.92 3 3.19
Relevant 24 39.34 7 21.21 31 32.98
Fully Relevant 34 55.74 26 78.79 60 63.83
TOTAL 61 100 33 100 94 100
3. Conclusion and Recommendation
4.1 Conclusion
The graduate school students’ respondents of the study were fully aware, fully relevant and fully acceptable of
the NSU Vision and Mission and Graduate School Goals and Objectives of the different courses (i.e. DM, Ed.
D., MPM, MAED). On the NSU Vision of awareness, relevance, and acceptability, MAED students got the
highest percentage. While the NSU Mission of awareness Ed. D. students got the highest percentage, DM got
the highest percentage in acceptability and relevance. As regards to graduate school goals, DM got the highest
percentage in awareness, MAED got the highest percentage in acceptability and DM and MAED share the
highest percentage in acceptability. The respondents’ responses on the objectives of the courses in graduate
school like Doctor of management, Doctor of Education, Master of Public Management and Master in
Elementary Education have clearly indicated that they are fully aware, fully relevant and fully acceptable in the
said objectives.
4.2 Recommendation
Anchored on the findings of this study, Naval State University, and the Graduate School should sustain the core
principles of NSU’s Vision and Mission and Graduate School’s Goals and Objectives. Strategies, programs, and
activities that contributed to the high level of awareness, relevance, and acceptability should be strengthened and
continued. Assessment of the awareness, relevance, and acceptance of the VMGOs by the students be done
periodically to determine the need for revision in order to meet innovations and challenges of the changing

International Journal of Sciences: Basic and Applied Research (IJSBAR) (2017) Volume 32, No 1, pp 181-206
206
needs of the times. And finally, a study on the extent of dissemination of the NSU and the Graduate School’s
VMGOs should be conducted to sustain their effectiveness.
References
[1] S.P. Robbins, M. Coulter, & R. Stuart-Kotze. (2003). Management. Toronto: Prentice Hall.
[2] CHED Memorandum Order (CMO) No. 37, Series of 2012
[3] AACCUP Revised Instrument. The Accrediting Agency of Chartered Colleges and Universities in the
Philippines, Inc., 2010
[4] R. Castillo. (2014). “Awareness, acceptance, and perception of Batangas State University stakeholders
towards its vision, mission, goals, and objectives.” International Journal of Sciences: Basic and Applied
Research, 14(1), 546-563.
[5] M. Salom, & Z. Florendo. (2013). “Awareness, acceptability, and relevance of the vision, mission,
goals, and objectives of the BSEMT program”, International Scientific Research Journal, 5(1) 236-245.
[6] S.P. Robbins, M. Coulter, & R. Stuart-Kotze. (2003). Management. Toronto: Prentice Hall.
[7] L. MacDonald. “What Do Clear Vision & Mission Statements Contribute to the Strategic Management
Process?” Internet: http://smallbusiness.chron.com/clear-vision-mission-statements-contribute-
strategic-management-process-24100.html, [August 2016].
[8] J.M. Spallina. (2004). “Strategic Planning - Getting Started: Mission, Vision, and Values”, Journal of
Oncology Management. January-February.
[9] C. Bratianu, & I. Jianu. (2007). “The Vision and Mission of the University. Case Study – The Academy
of Economic Studies of Bucharest.” Internet:
http://econpapers.repec.org/article/ephjournl/v_3a2_3ay_3a2007_-3ai_3a2_3an_3a4.htm, [August
2016]