Embed Size (px)
Citation preview

Prepared for:
Antrim Wind Energy, LLC
Colin High, Ph.D., RSG Inc. Gurpreet Neeraj, RSG Inc.
December 22, 2011
D A T A A N A L Y S I S S O L U T I O N S
Avoided Emissions from the Antrim Wind Project

Resource Systems Group, Inc. Antrim Wind – Avoided Emissions 28 December 2011 Page i
TABLE OF CONTENTS
1.0 INTRODUCTION ....................................................................................... 1
2.0 THE ANTRIM WIND FARM ......................................................................... 1
3.0 THE NEW ENGLAND ISO POWER MARKET ................................................... 2
4.0 AVOIDED EMISSIONS IN POWER MARKETS ................................................... 2
5.0 ANALYTICAL METHODOLOGY ..................................................................... 2
6.0 RESULTS ................................................................................................. 5
7.0 CONCLUSIONS ......................................................................................... 8
LIST OF TABLES
Table 1: List of Major Variably Dispatched Fossil-Fueled Plants in the Analysis ................................................... 4 Table 2: Average Annual Avoided Emission Rates from the Antrim Wind Farm (lbs/MWh) ................................ 5 Table 3: Comparison of eGRID system average emission rates compared with RSG TMM Model emission rates
for the New England ISO power market ........................................................................................................ 6 Table 4: Scenario A. (2010 analysis): Total Annual Avoided Emissions from the Antrim Wind Farm (Tons per
year) ............................................................................................................................................................... 6 Table 5: Scenario B. (Long term average): Total Annual Avoided Emissions from the Antrim Wind Farm (Tons
per year) ........................................................................................................................................................ 6 Table 6: Scenario A. (2010 analysis): Total Annual Avoided Water Use from the Antrim Wind Farm (gallons per
year) ............................................................................................................................................................... 8 Table 7: Scenario B. (Long term average): Total Annual Avoided Water Use from the Antrim Wind Farm
(gallons per year) ........................................................................................................................................... 8
LIST OF FIGURES
Figure 1: Map of the Location of the Antrim Wind Farm and Fossil Fuel Plants in the Analysis ............................ 3 Figure 2: Annual Generation by Fossil-Fuel Type
in the New England ISO (2007 Data) ............................................................................................................. 5 Figure 3: Average Monthly Total Avoided Emissions from the Antrim Wind Farm for Scenario A and B. ............ 7

Resource Systems Group, Inc. Antrim Wind – Avoided Emissions 28 December 2011 Page ii
LIST OF ACRONYMS
CAA Clean Air Act
CAIR Clean Air Interstate Rule (EPA)
CSAPR Cross State Air Pollution Rule (EPA)
CEM Continuous Emission Monitors
CO2 Carbon Dioxide
DOE U.S. Department of Energy
EPA U.S. Environmental Protection Agency
kWh Kilowatt-Hour
ISO Independent System Operator
ISO-NE New England Independent System Operator
NYISO New York Independent System Operator
MARO U.S. Department of Energy Mid-Atlantic Regional Office
MWh Megawatt-Hour
NAAQS National Ambient Air Quality Standards
NOx Nitrogen Oxides
NREL National Renewable Energy Laboratory
OAQPS EPA Office of Air Quality Planning and Standards
PJM PJM (Pennsylvania, New Jersey, Maryland) Interconnection
SIP State Implementation Plan
SO2 Sulfur Dioxide

Resource Systems Group, Inc. Antrim Wind – Avoided Emissions 28 December 2011 Page 1
1.0 INTRODUCTION This report provides an evaluation of the avoided air pollutants and water usage (together termed as “avoided emissions”) from the operation of the proposed Antrim wind farm to be located in the sparsely settled Northwest portion of Antrim, NH with an installed capacity of 30 Megawatts (MW).
This report is a prospective evaluation of the avoided emissions from the operation of the project. The evaluation applies a methodology using the Time Matched Marginal (TMM) emissions model developed by Resource Systems Group, Inc (RSG). The methodology is based on generally accepted principles and procedures for estimating emissions reductions from wind and other renewable electric power generation on the electric grid.1, 2
The methodology in this report is consistent with the approach used by other experts in the field. It has been used in previous studies of avoided emissions from wind and other renewable generation in most electric grid regions in the country including the ISO New England, NYISO and the PJM Interconnection power market3. The PJM New Jersey study, including its methodology, was published in June 2006 and was co-authored by technical experts from both the National Renewable Energy Laboratory (NREL) and the Global Environment and Technology Foundation, a prominent non-profit organization in the energy and environmental field. In addition, both the studies of the PJM for Maryland and New Jersey have been reviewed and accepted by the U.S. Environmental Protection Agency, the Department of Energy. 4 The Maryland study was accepted by the Environmental Protection Agency to support its first-ever approval of a renewable energy purchase for nitrogen oxide (NOx) emissions reduction credit in a State Implementation Plan (SIP) under the Clean Air Act. 5 The methodology in the Maryland report using the RSG TMM Model also was published by NREL as a model for air emissions assessment for other wind energy projects. 6 The RSG TMM Model has also been applied extensively for estimating avoided emissions for energy efficiency and renewable energy projects in all 50 states for the DOE Loan Program Office.
2.0 THE ANTRIM WIND FARM Antrim Wind Energy LLC is proposing to develop a utility scale wind energy generation facility in the sparsely settled northwest portion of Antrim on private property that extends from the east summit of the Tuttle Hill to the north flank of Willard Mountain. To the north of the project area lie the PSNH electrical transmission corridor which contains 34.5KV and 115KV transmission lines, and the Franklin Pierce Highway (State Route 9). The Project will consist of ten wind turbine generators and the total extent of tree clearing for roads and all construction is anticipated to encompass less than 65 acres. This analysis is based on a nameplate capacity of 30 MW for the project consisting of 10 Acciona AW-3000 wind turbines.
1 The Greenhouse Gas Protocol, Guidelines for Quantifying GHG reductions from Grid-Connected Electricity Projects, World Resources Institute (WRI), http://www.ghgprotocol.org/files/ghgp/electricity_final.pdf
2 Roadmap for Incorporating Energy Efficiency/Renewable Energy Policies and Programs into State Implementation Plans/Tribal Implementation Plans, US EPA, Office of Air Quality Planning and Standards, Research Triangle Park, North Carolina. http://www.epa.gov/airquality/pdfs/eeremanual.pdf
3 Report on the Clean Energy/ Air Quality Integration Initiative Pilot Project of the U.S. DOE Mid-Atlantic Regional Office, June 2006. 70 Fed. Reg. 24988 (May 12, 2005). See also, Metropolitan Washington Council of Governments, “Plan to Improve Air Quality in the Washington, DC-MD-VA Region,” February 19, 2004 at http://www.mwcog.org/committee/committee/archives.asp?COMMITTEE_ID=14 (Scroll down to February 19, 2004, pp. 7-77 to 7-81 and Appendix J, pp. J-71 to J-76).
4 Op cit.. 5 70 Fed. Reg. 24988 (May 12, 2006). 6 National Renewable Energy Laboratory, Model State Implementation Plan (SIP) Documentation for Wind Energy Purchase in State with Renewable Energy Set-Aside, May 2005, Subcontract Report NREL/SR-500-38075. See http://www.windpoweringamerica.gov/sips.asp

Resource Systems Group, Inc. Antrim Wind – Avoided Emissions 28 December 2011 Page 2
3.0 THE NEW ENGLAND ISO POWER MARKET Electric power generated from wind energy at the Antrim wind farm will be sold into the New England ISO power market. The power plants used in this analysis are shown in Figure 1. The import and export of power is not considered, because, in a relatively large power market area such as New England ISO, relatively little power is imported or exported. Furthermore, the wind farm when it displaces generation outside the New England ISO power market will typically displace generation on the margin of the same type of variably-dispatched fossil fuel units that are included in this analysis. As a result, there will be very little difference in average avoided emission rates. All displaced generation by wind is expected to occur primarily at the plants listed in Table 1. As there is currently transmission capacity for the project, any potential future transmission constraints are not considered in this analysis. These simplifying assumptions are unlikely to significantly affect the results at this level and for the purposes of the report.
4.0 AVOIDED EMISSIONS IN POWER MARKETS Wind power has zero direct air emissions and will create reduced air emissions from other electrical generators. Wind creates these reductions because of the way the electric power system works. Wind is a “must run” power source. Once it is installed, wind generation has zero fuel costs and very low operating costs. When wind energy is available, it will displace generation at facilities with higher operating costs and which can be variably dispatched. The emissions from those fossil-fuel generating units are then avoided. Wind almost never displaces nuclear power, hydroelectric power, or other renewable energy sources, because like wind, these units have low incremental operating costs. Additionally, nuclear power and hydroelectric power are normally fully dispatched and are rarely able to respond to unscheduled rapidly changing and unpredictable changes in load.
The electrical generation that is displaced by wind power also varies by time of day and season and with the mix of fossil-fueled generation. In the New England ISO power market area, this mix includes coal, oil, and natural gas. The avoided emissions from all the major pollutants tend to be higher in areas with more coal-fired generation and lower where natural gas is the dominant fuel. Efficiency and the pollution control system performance of fossil-fueled units also are important.
5.0 ANALYTICAL METHODOLOGY This analysis evaluates avoided emissions that will occur when electric generation from the Antrim Wind Farm is sold into the New England ISO power grid. This avoided emissions analysis is based on projected generation from the Antrim Wind Farm and on EPA emissions data for the fossil-fueled power plants for the year 2007. 1
The methodology used in this report is the RSG time-matched marginal (TMM) avoided emissions analysis model using an incremental generation-weighted average of the emissions of plants that are variably dispatched to meet changing demand. The analysis matches the projected hour-by-hour generation of the Antrim Wind Farm with the actual hourly generation of fossil-fueled units in the ISO New England power market area shown in Figure 1.
1 The most recent year for which complete and consistent validated data are available from the EPA is 2007. Changes since 2007 are not expected to have a significant effect on this avoided emissions analysis.

Resource Systems Group, Inc. Antrim Wind – Avoided Emissions 28 December 2011 Page 3
Figure 1: Map of the Location of the Antrim Wind Farm and Fossil Fuel Plants1 in the Analysis
Note: For clarity not all the power plants used in the analysis can have name labels on this map. For a complete list of all plants in the analysis refer to Table 1 below.
1 Note: The marginal emission rates are calculated for all fuel types at individual units for every plant.
Resource Systems Group, Inc. Antrim Wind – Avoided Emissions 28 December 2011 Page 4
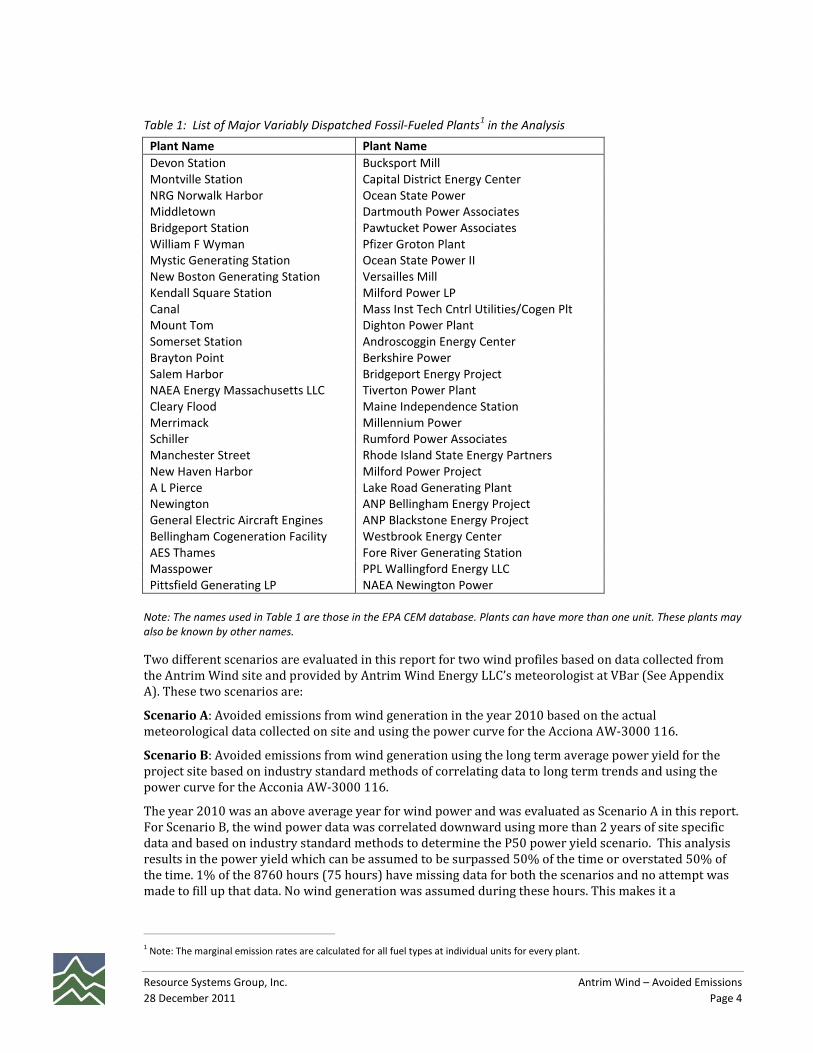
Table 1: List of Major Variably Dispatched Fossil-Fueled Plants1 in the Analysis Plant Name Plant Name Devon Station Bucksport Mill Montville Station Capital District Energy Center NRG Norwalk Harbor Ocean State Power Middletown Dartmouth Power Associates Bridgeport Station Pawtucket Power Associates William F Wyman Pfizer Groton Plant Mystic Generating Station Ocean State Power II New Boston Generating Station Versailles Mill Kendall Square Station Milford Power LP Canal Mass Inst Tech Cntrl Utilities/Cogen Plt Mount Tom Dighton Power Plant Somerset Station Androscoggin Energy Center Brayton Point Berkshire Power Salem Harbor Bridgeport Energy Project NAEA Energy Massachusetts LLC Tiverton Power Plant Cleary Flood Maine Independence Station Merrimack Millennium Power Schiller Rumford Power Associates Manchester Street Rhode Island State Energy Partners New Haven Harbor Milford Power Project A L Pierce Lake Road Generating Plant Newington ANP Bellingham Energy Project General Electric Aircraft Engines ANP Blackstone Energy Project Bellingham Cogeneration Facility Westbrook Energy Center AES Thames Fore River Generating Station Masspower PPL Wallingford Energy LLC Pittsfield Generating LP NAEA Newington Power
Note: The names used in Table 1 are those in the EPA CEM database. Plants can have more than one unit. These plants may also be known by other names.
Two different scenarios are evaluated in this report for two wind profiles based on data collected from the Antrim Wind site and provided by Antrim Wind Energy LLC’s meteorologist at VBar (See Appendix A). These two scenarios are:
Scenario A: Avoided emissions from wind generation in the year 2010 based on the actual meteorological data collected on site and using the power curve for the Acciona AW-3000 116.
Scenario B: Avoided emissions from wind generation using the long term average power yield for the project site based on industry standard methods of correlating data to long term trends and using the power curve for the Acconia AW-3000 116.
The year 2010 was an above average year for wind power and was evaluated as Scenario A in this report. For Scenario B, the wind power data was correlated downward using more than 2 years of site specific data and based on industry standard methods to determine the P50 power yield scenario. This analysis results in the power yield which can be assumed to be surpassed 50% of the time or overstated 50% of the time. 1% of the 8760 hours (75 hours) have missing data for both the scenarios and no attempt was made to fill up that data. No wind generation was assumed during these hours. This makes it a
1 Note: The marginal emission rates are calculated for all fuel types at individual units for every plant.

Resource Systems Group, Inc. Antrim Wind – Avoided Emissions 28 December 2011 Page 5
conservative estimate of the annual wind generation capacity and the projected avoided emissions from the wind farm.
The expected hourly generation for the wind farm is matched by RSG’s TMM database model against the hourly generation of the variably dispatched fossil fuel units at plants shown in Figure 1 and Table 1. This information forms the basis for matching and creating the set of generation units in each hour which can be displaced. This analysis identifies the marginal generation units which are dispatched to follow the changing load on the system in the New England ISO power market (ISO-NE). The hourly generation data for the fossil fuel plants have been calculated by using the hourly carbon dioxide (CO2) emissions from the continuous emissions monitors (CEMs) and the generation average CO2 emission rates per MWh for each facility as reported to the U.S. Environmental Protection Agency (EPA). 1 The hourly emission rates for nitrogen oxides (NOx), sulfur dioxide (SO2) and carbon dioxide (CO2) are taken from the CEM data reported to EPA by the owners and operators of the fossil-fueled power plants. The average NOx, SO2 and CO2 avoided emission rates are based on a weighted average of the emissions at fossil-fueled units, which are matched at each hour when wind generation occurs. The weighting is based on each generation unit’s contribution to the changing load. The variably dispatched fossil fueled generation in New England ISO region is dominated by gas. This can be seen in Figure 2 that shows the annual generation of fossil fueled units in the New England ISO by fuel type.
Figure 2: Annual Generation by Fossil-Fuel Type in the New England ISO (2007 Data)
6.0 RESULTS The annual avoided emissions can be expressed in terms of the average rate in lbs/MWh and as total annual emissions in tons per year for the plant. The average annual avoided emission rate for NOx, SO2 and CO2 in lbs/MWh resulting from the wind power generation at the Antrim Wind Farm are shown Table 2. Note that these marginal emission rates do not change between the two scenarios because of the presence of the same fleet of marginal units in the system.
Table 2: Average Annual Avoided Emission Rates from the Antrim Wind Farm (lbs/MWh)
CO2 N2O CH4 NOx SO2 PM
Gas 901 0.002 0.018 0.2 0.2 0.68
Oil 1954 0.034 0.174 1.8 6.4 0.63
Coal 2285 0.043 0.031 1.5 8.2 0.69
Annual 1159 0.010 0.037 0.5 1.7 0.68
lbs/MWh
These rates are likely representative of the situation in 2007 to 2011. In future years, the magnitude and pattern of avoided emission rates will be similar but will be affected by future changes in the distribution of fossil-fueled generation in New England ISO and adjoining power market areas.
1 U.S. Environmental Protection Agency, Continuous Emission Monitoring Database for year 2007, Office of Air and Radiation.

Resource Systems Group, Inc. Antrim Wind – Avoided Emissions 28 December 2011 Page 6
Comparison of Emission Rates
Table 3: Comparison of eGRID system average emission rates compared with RSG TMM Model emission rates for the New England ISO power market
CO2 NOx SO2
(in lbs/MWh)
eGRID System Average 828 0.84 2.84 RSG TMM Model 1159 0.50 1.70
In Table 3, the RSG TMM Model marginal emission rates for SO2, NOx, and CO2 are compared with eGRID system average emission rates (also known as output emissions rates) for the New England ISO power market. The reason for the differences in avoided emission rates is primarily the result of differences in methodology. The eGrid database simply averages the emission rates of all plants in the system including near zero emissions sources such as nuclear and hydropower. It does not identify the marginal plants nor does it calculate the marginal emission rates. It does not take into consideration the time matching of wind generation. That approach is much less accurate than the model used in this report. However, there is a broad agreement on emission rates.
The total annual avoided emissions from the operation of the Antrim Wind Farm are shown in Table 4 and Table 5 for the scenarios A and B respectively.
Table 4: Scenario A. (2010 analysis): Total Annual Avoided Emissions from the Antrim Wind Farm (Tons per year)
MWH CO2 N2O CH4 NOx SO2 PM
Gas 96,410 43,420 0.1 0.9 10 9 33
Oil 12,334 12,050 0.2 1.1 11 39 4
Coal 13,090 14,952 0.3 0.2 10 53 4
Annual 121,991 70,682 0.6 2.2 31 102 41
tons
Table 5: Scenario B. (Long term average): Total Annual Avoided Emissions from the Antrim Wind Farm (Tons per year)
MWH CO2 N2O CH4 NOx SO2 PM
Gas 81,103 36,532 0.1 0.7 8 8 28
Oil 10,428 10,188 0.2 0.9 9 33 3
Coal 11,063 12,636 0.2 0.2 8 45 4
Annual 102,725 59,573 0.5 1.9 26 87 35
tons
The Antrim Wind Farm will also result in significant avoided emissions of fine particulate matter, mercury, volatile organic compounds, carbon monoxide and other toxic air pollutants. These pollutants can have adverse public health impacts. The avoided emissions of these pollutants cannot be quantified as accurately as NOx, SO2 and CO2 because they are not subject to continuous monitoring requirements. However, these additional avoided emissions will in general follow the same pattern as the avoided emissions of CO2. The monthly avoided emissions are shown in Figure 3. Figure 3 shows that wind creates the greatest amount of avoided emissions in the fall, winter, and spring. This is because wind power is weakest in the summer months.

Resource Systems Group, Inc. Antrim Wind – Avoided Emissions 28 December 2011 Page 7
Figure 3: Average Monthly Total Avoided Emissions from the Antrim Wind Farm for Scenario A and B.

Resource Systems Group, Inc. Antrim Wind – Avoided Emissions 28 December 2011 Page 8
The avoided water usage was calculated using the avoided generation by fuel and turbine type from the RSG TMM Model for both the scenarios A and B. The water consumption rate for each fuel type and turbine type was obtained from publicly available sources.1, 2 The results for avoided water usage in gallons per year are shown below in Table 6 and Table 7 for the two scenarios A and B respectively.
Table 6: Scenario A. (2010 analysis): Total Annual Avoided Water Use from the Antrim Wind Farm (gallons per year)
Fuel MWh avoided Water avoided (gal)
Gas 96,410 8,811,890Oil 12,334 7,400,426
Coal 13,090 4,581,523TOTAL 121,834 20,793,839
Table 7: Scenario B. (Long term average): Total Annual Avoided Water Use from the Antrim Wind Farm (gallons per year)
Fuel MWh avoided Water avoided (gal)
Gas 81,103 7,412,816Oil 10,428 6,256,851
Coal 11,063 3,871,936TOTAL 102,594 17,541,603
7.0 CONCLUSIONS This report concludes that there are significant avoided air emissions that may be expected to result from electric power generation by the Antrim Wind Farm. The avoided emissions will include NOx, SO2 and CO2 which have been quantified. In addition there will be significant avoided emissions of fine particulate matter, mercury, volatile organic compounds, carbon monoxide, and other toxic air pollutants. The avoidance of emissions of all these pollutants has public health benefits and contributes to the mitigation of global warming. The avoided emissions from the wind farm will also reduce the overall cost of lowering the cap on NOx and SO2 and the cost of limiting greenhouse gas emissions in New England.
The avoided emissions will also have specific environmental benefits. The avoidance of NOx emissions will contribute to reducing the occurrence of high ozone days in New England and Eastern Canada. This coupled with reductions in SO2 will reduce the impacts of acid precipitation on regional forests and lakes. The avoidance of fine particulate matter, NOx, and SO2 will contribute to reducing regional haze and respiratory health risks. Lastly, avoided mercury emissions will contribute to efforts to reduce human exposure to environmental mercury, a compound that is both directly dangerous to human health and indirectly hazardous through the consumption of freshwater fish.
Most significantly, the reduction in CO2 emissions will contribute to the mitigation of the potentially severe impact of global warming on the climate of New England and the world. To put the impacts in perspective, the greenhouse gas avoided emissions benefits of the Antrim Wind Farm for the two scenarios are equivalent to:
1 Water and Sustainability (Volume 3): U.S. Water Consumption for Power Production –The Next Half Century, Electric Power Research Institute, Palo Alto, CA: 2002
2 "Power Generation water use in Texas from Years 2000 to 2060" prepared for Texas Water Development Board by representatives of Investor Owned Utilities of Texas, Jan 2003

Resource Systems Group, Inc. Antrim Wind – Avoided Emissions 28 December 2011 Page 9
Scenario A (2010 analysis): taking approximately 12,614 passenger vehicles off the road or the CO2 emissions from the electricity use of 8,021 homes for one year or the carbon sequestered by 13,717 acres of pine or fir forests.1
Scenario B (Long term average): taking approximately 10,631 passenger vehicles off the road or the CO2 emissions from the electricity use of 6,761 homes for one year or the carbon sequestered by 11,561 acres of pine or fir forests.1
At the present time the development of commercial wind power, other than energy efficiency and conservation is one of the more cost effective means of reducing carbon dioxide emissions and therefore of mitigating the pending climate crisis2, 3. This important environmental benefit of avoided emissions should be considered in balancing other impacts of the Antrim Wind Farm.
1 EPA Greenhouse Gas Equivalencies Calculator, http://www.epa.gov/cleanenergy/energy-resources/calculator.html 2 http://www.nrel.gov/analysis/costs.html 3 “Levelized Cost of Energy Analysis.” (2008). Presentation at NARUC, Lazard, June.


![207art rsg[1]](https://img.dokumen.tips/doc/110x75/55c1a90dbb61ebda4d8b4612/207art-rsg1.jpg)