Embed Size (px)
Citation preview

Aviva plc Results 2017

Disclaimer Cautionary statements: This should be read in conjunction with the documents distributed by Aviva plc (the “Company” or “Aviva”) through The Regulatory News Service (RNS). This presentation contains, and we may make other verbal or written “forward-looking statements” with respect to certain of Aviva’s plans and current goals and expectations relating to future financial condition, performance, results, strategic initiatives and objectives. Statements containing the words “believes”, “intends”, “expects”, “projects”, “plans”, “will,” “seeks”, “aims”, “may”, “could”, “outlook”, “likely”, “target”, “goal”, “guidance”, “trends”, “future”, “estimates”, “potential” and “anticipates”, and words of similar meaning, are forward-looking. By their nature, all forward-looking statements involve risk and uncertainty. Accordingly, there are or will be important factors that could cause actual results to differ materially from those indicated in these statements. Aviva believes factors that could cause actual results to differ materially from those indicated in forward-looking statements in the presentation include, but are not limited to: the impact of ongoing difficult conditions in the global financial markets and the economy generally; the impact of simplifying our operating structure and activities; the impact of various local and international political, regulatory and economic conditions; market developments and government actions (including those arising from the referendum on UK membership of the European Union); the effect of credit spread volatility on the net unrealised value of the investment portfolio; the effect of losses due to defaults by counterparties, including potential sovereign debt defaults or restructurings, on the value of our investments; changes in interest rates that may cause policyholders to surrender their contracts, reduce the value of our portfolio and impact our asset and liability matching; the impact of changes in short or long term inflation; the impact of changes in equity or property prices on our investment portfolio; fluctuations in currency exchange rates; the effect of market fluctuations on the value of options and guarantees embedded in some of our life insurance products and the value of the assets backing their reserves; the amount of allowances and impairments taken on our investments; the effect of adverse capital and credit market conditions on our ability to meet liquidity needs and our access to capital; changes in, or restrictions on, our ability to initiate capital management initiatives; changes in or inaccuracy of assumptions in pricing and reserving for insurance business (particularly with regard to mortality and morbidity trends, lapse rates and policy renewal rates), longevity and endowments; a cyclical downturn of the insurance industry; the impact of natural and man-made catastrophic events on our business activities and results of operations; our reliance on information and technology and third-party service providers for our operations and systems; the inability of reinsurers to meet obligations or unavailability of reinsurance coverage; increased competition in the UK and in other countries where we have significant operations; regulatory approval of extension of use of the Group’s internal model for calculation of regulatory capital under the European Union’s Solvency II rules; the impact of actual experience differing from estimates used in valuing and amortising deferred acquisition costs (“DAC”) and acquired value of in-force business (“AVIF”); the impact of recognising an impairment of our goodwill or intangibles with indefinite lives; changes in valuation methodologies, estimates and assumptions used in the valuation of investment securities; the effect of legal proceedings and regulatory investigations; the impact of operational risks, including inadequate or failed internal and external processes, systems and human error or from external events (including cyber attack); risks associated with arrangements with third parties, including joint ventures; our reliance on third-party distribution channels to deliver our products; funding risks associated with our participation in defined benefit staff pension schemes; the failure to attract or retain the necessary key personnel; the effect of systems errors or regulatory changes on the calculation of unit prices or deduction of charges for our unit-linked products that may require retrospective compensation to our customers; the effect of fluctuations in share price as a result of general market conditions or otherwise; the effect of simplifying our operating structure and activities; the effect of a decline in any of our ratings by rating agencies on our standing among customers, broker-dealers, agents, wholesalers and other distributors of our products and services; changes to our brand and reputation; changes in government regulations or tax laws in jurisdictions where we conduct business, including decreased demand for annuities in the UK due to proposed changes in UK law; the inability to protect our intellectual property; the effect of undisclosed liabilities, integration issues and other risks associated with our acquisitions; and the timing/regulatory approval impact, integration risk, and other uncertainties, such as non-realisation of expected benefits or diversion of management attention and other resources, relating to announced acquisitions and pending disposals and relating to future acquisitions, combinations or disposals within relevant industries; the policies, decisions and actions of government or regulatory authorities in the UK, the EU, the US or elsewhere, including the implementation of key legislation and regulation. For a more detailed description of these risks, uncertainties and other factors, please see ‘Other information – Shareholder Information – Risks relating to our business’ in Aviva’s most recent Annual Report. Aviva undertakes no obligation to update the forward looking statements in this presentation or any other forward-looking statements we may make. Forward-looking statements in this presentation are current only as of the date on which such statements are made.

3
Mark Wilson Aviva plc
Group Chief Executive Officer

4
EPS Cash
2017 key metrics – strong across the board
EPS 54.8p +7%1
Operating profit2
£3,068m +2%1
27.4p per share +18%
50% pay-out ratio
+4pp
Dividend
Capital
Capital Generation £2.6bn
Solvency II ratio3
198%
Cash remittance £2.4bn
Centre liquidity
£2.0bn
All footnotes on page 67

5
Growing EPS and dividend
EPS: +7%
49.0p 49.7p 51.1p54.8p
+7%
+3% +1%
2017 20161 20151 2014
Dividend per share: +18%
18.1p 20.8p 23.3p27.4p
2017
+12%
+18%
+15%
2015 2016 2014
All footnotes on page 67

6
Major markets – broad based profit growth across major markets
UK1,4
Ireland6
France5 Canada
Singapore Italy
Poland
Aviva Investors
£2.2bn +13% £507m +20% £177m +26% £46m -83%
£168m +21% £86m +18% £110m +10% £213m +0%
All footnotes on page 67

7
UK
Ireland
France Canada
Singapore Italy
BPA sales up 3x
Savings flows up 2x
GI COR7 93.9%
Revenue +14%
Net fund flows £1.6bn
Infrastructure origination +24%
VNB9 +14%
UL / protection: 48% of sales
GI COR7 94.5%
PYD adverse 1.3%
Challenging auto market
GI COR7 102.2%
>30% RoCE
Life – positive mix shift
GI COR7 86.7%
NWP +15%
GI COR7 91.4%
VNB9 up 2x
Net flows £2.3bn
VNB9 +29%
Aviva FA: 673 advisers
Poland
Aviva Investors
Major markets – competitive advantages delivering results
All footnotes on page 67

8
Major markets – targeting above mid-single digit growth from 2018
UK
Ireland
France Canada
Singapore Italy
Savings, structural growth
BPA & GCS, expand appetite
Digital direct, gaining share
Externalisation: 3rd party AUM
Diversified excellence
Adding talent & capability
Mix, further optimisation
Unlock distribution potential
Efficiency benefits
Recovery program
Distribution breadth
Composite expansion
GI, continued growth
Direct sales productivity
Digital direct, partner channel
Maintain margin excellence
Scale up composite
Friends First integration
Broaden distribution
Product innovation driving improved mix and margin
Disruption play
Expand FA channel
Leading asset platform
Poland
Aviva Investors
All footnotes on page 67

9
Strategic investments support long-term growth
High growth
Turkey
China
India
Indonesia
Vietnam
1.4bn
1.3bn
261m
92.7m
Hong Kong
Growth drivers Market
79.5m
7.4m
Population
• Disruption play • JV with Tencent approved
• No. 2 Life position • Structural market growth
• Broad geographic footprint with agency growth • Digital agency tools boosting productivity
• Improved market fundamentals • Strategy under review
• JV with No. 1 conglomerate (Astra) • Geographic expansion, multi-channel approach
• 100% owned • Long-term exclusive distribution
All footnotes on page 67

Confidence in long-term growth prospects
Structural growth
Expanding capability Aviva advantage
Auto-enrolment
DB de-risking
Demographics
Welfare reform
GDP +
Big data & Artificial Intelligence
Aviva Investors
Bulk Purchase Annuities
Global Corporate & Specialty
Bolt-on M&A appetite
Trusted brand
Composite
Scale efficiency
Partner of choice
Digital ecosystem
10

11
£2bn capital deployment incrementally positive for EPS and cash-flow
Prefs and other buybacks- c.£500m Ability to cancel expensive preference shares through capital reduction*
Consider additional returns in 2H18
Organic growth
Capital returns
Bolt-on M&A
Invest to grow – self funding Aviva Investors, BPA, partnerships, GCS, LT savings
c.£600m Existing markets focus (incl. Friends First)
Digital and data capabilities
c.£900m Repay hybrid debt
Digital, BPA, Savings, AI,
HSBC partnership
$650m debt repayment
Vietnam, Wealthify
2018 2017
Debt deleveraging
£300m share buyback
*via a court approved reduction of capital at par plus accrued interest and arrears, and in the case of GA plc, issue premium, subject to approval from relevant issuer’s ordinary and preference shareholders voting together
12
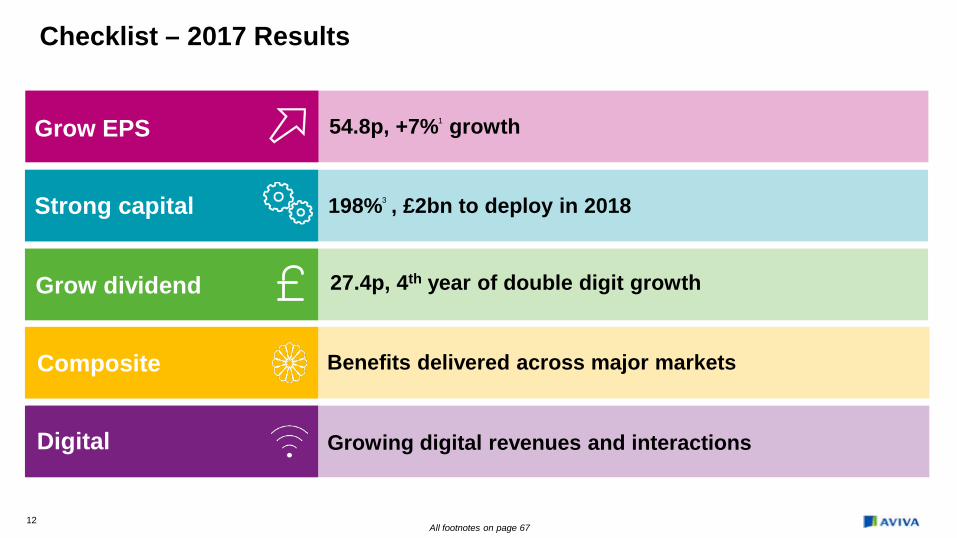
Checklist – 2017 Results
Grow dividend
Grow EPS
Composite
54.8p, +7%1 growth
27.4p, 4th year of double digit growth
Benefits delivered across major markets
Digital Growing digital revenues and interactions
Strong capital 198%3 , £2bn to deploy in 2018
All footnotes on page 67

Tom Stoddard Chief Financial Officer

14
Operating profit
£m FY16 FY17 Change
Major markets UK Insurance1,4 1,946 2,201 13%
Ireland (excl. Health) 73 86 18%
Aviva Investors 139 168 21%
France (excl. Antarius) 421 507 20%
Canada 269 46 (83)%
Poland 140 177 26%
Italy 212 213 -
Singapore 100 110 10%
Total major markets 3,300 3,508 6%
Strategic investments (52) (85) (63)%
Corporate costs, non insurance & other (131) (147) (12)%
Group debt costs (411) (400) 3%
FPI 140 119 (15)%
Contribution from disposals* 164 73 (55)%
Operating profit2 3,010 3,068 2%
Operating EPS1
54.8p
+7%
Operating EPS1 after I&R costs
52.0p
+11%
*Disposals include Antarius and part of Spain which completed in 2017 and Ireland Health which completed in 2016 All footnotes on page 67

15
Net asset value7
(11)p
(25)p
55p
Closing NAV per share at 31 December 2017 423p
Opening NAV per share at 1 January 2017 414p
3p
Operating profit
Investment variances & short-term fluctuations
Dividends
(7)p Share buyback
AVIF amortisation
Integration & restructuring
Pension movement
Disposals
Other
379
212141
FY17
(33)%
FY16 FY15
Integration & restructuring costs
23.1p15.3p
35.0p
FY16 FY17 FY15
Basic EPS
Ogden
x 2.3
£m
(4)p
(3)p
1p
All footnotes on page 67

16
Operating profit2
1,431 1,5231,758
368392
408
7%
13%
FY17
2,201
FY161
1,946 1,820
FY151
UK Insurance4
Life GI Health
Performance and priorities £m
• Unique large scale composite with unparalleled distribution and brand and a top 3 rank across multiple product lines
• Long term savings net flows near doubled to £5.6bn, BPA volumes9 tripled to £2bn and Protection VNB8 up 21%
• GI NWP up 4% with +14% in Direct; Best underwriting result in 11Y with 93.9% COR7 and improved underlying performance
• ROCE for combined UKI business improved to 14%
• Looking forward:
- Targeting rising savings net flows and increased BPA appetite
- Partnerships (incl. HSBC), new digital propositions and Global Corporate & Specialty to drive further GI NWP growth
All footnotes on page 67

17
Life
UK Insurance profit drivers
General Insurance
142185 4,078
3,930
656725
242 227
FY17 FY16
Operating profit (£m)
+9% operating profit2 growth from core segments +4% operating profit2 growth
Long-term savings
• £118bn AuA (+13%) • £20bn Platform AuA (+56%) • Stable inforce margin (25bps)
Annuities & Equity Release
• £4.3bn PVNBP (+58%) • Our largest ever BPA win (£0.6bn) • Continued asset optimisation
Protection
• New business volumes up 11% from continued success of digital platform & composite model
• Adverse claims experience in existing group business
Net written premiums (£m)
• Organic growth in higher margin products & channels
• +17% Direct Personal Motor • +8% Commercial Non Motor
93.993.9
Combined ratio7,11 (%)
• Underwriting result up 6% • Normalised COR improved by 1.3pp • 1.0pp benefit from PY releases
(FY16: 2.2pp)
Operating profit2 (£m)
• Sustainable earnings’ growth • Leading edge data analytics across
claims, underwriting and pricing
392 408
FY17 FY161
All footnotes on page 67

Ireland
18
Operating profit2
2432 33
28
4153
18%
40%
FY17
86
FY16
73
FY15
52
Life GI
Performance and priorities £m
• True Customer Composite (‘TCC’) with exceptional brand recognition and 15% market share in GI
• +15% NWP: growth across all channels and Direct in particular
• COR7 improved to 91.4% (FY16: 92.4%) from robust fraud management and rate increases despite lower releases and less benign weather
• VNB9 broadly stable at £11m
• Looking forward:
- Seek to replicate UK strengths by bringing together digital propositions & large scale composite model to capitalise on strong brand recognition
- Complete Friends First acquisition (expected to be accretive from Y1) and become the largest composite with 15% market share in both Life & GI
All footnotes on page 67

19
Operating profit2
139
168
105
21%
32%
FY17 FY16 FY15
Aviva Investors
FM
Performance and priorities
• Strong growth engine with 25.7% ROE (FY16: 24.4%)
• Operating profit margin increased to 29% (FY16: 27%)
• Growing share of external clients: 21% of AuM and 34% of revenue at FY17, +5pp and +2pp respectively vs. FY16
• £353bn AUM with net inflows of £1.6bn; AIMS AUM +40% to £12.6bn (FY16: £9.0bn)
• £4.1bn of infrastructure assets originated in 2017 (+24%)
• Looking forward:
- Target improved investment performance from AIMS to restore momentum in net flows and AuM growth
- Accelerate ‘Real Assets’ offering and continue to support UK through origination of long-term private debt assets
£m
All footnotes on page 67

20
Operating profit2
328 351403
7170
104
FY16
507
399
6%
FY17
20%
FY15
421
France
GI & Health Life
Performance and priorities
• Strong distribution footprint, with increased brand recognition providing an opportunity to expand our presence with customers
• Outperforming the market in 2017: Unit-linked net inflows +68% vs. +43% market12; GI premiums +3% vs. +2% market12
• VNB9 up 14% (excl. Antarius) with further shift in mix as protection & linked sales were 48% of PVNBP9 (FY16: 38%)
• COR7 improved to 94.5% from better underwriting and lower large losses; GI NWP +3% (excl. FX) with Direct up 5%
• Expense discipline: stable cost base excl. FX and Antarius
• Looking forward:
- Manage for efficiency - Unlock distribution potential by implementing differentiated
customer propositions under one Aviva brand
£m
(excl. Antarius)
All footnotes on page 67

21
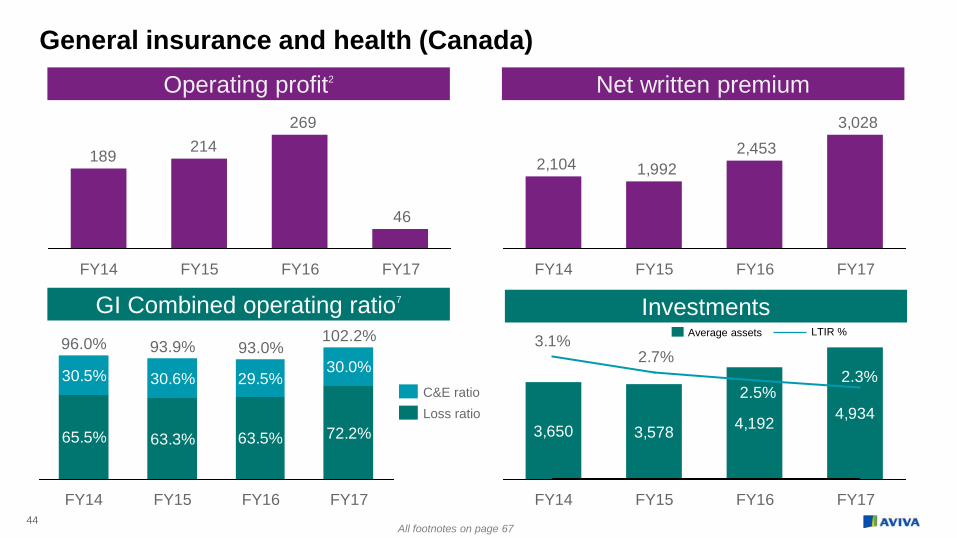
Operating profit2
214
269
46
26% (83)%
FY17 FY16 FY15
Canada
GI
Performance and priorities
• Off-year for typically high ROCE franchise, #2 GI insurer with a diversified distribution and 10% market share
• 6.7pp swing in prior year development (‘PYD’): (1.3)pp adverse at FY17 vs. 5.4pp favourable at FY16
• 7Y trend of favourable PYD following previous government reforms ceased, as evidenced by adverse trend in Ontario Auto market
• COR7 102.2% (FY16: 93.0%); Normalised AY COR 100.7% (FY16: 97.7%) mainly from higher claims inflation in Auto
• NWP up 23% to £3bn; Excl. RBC & FX, NWP up 5%
• Looking forward:
- Restore COR to 94-96% range by 2020 through targeted actions on pricing, underwriting and claims
- Prioritising underwriting profit growth over topline NWP
£m
All footnotes on page 67

22
Operating profit2
129 132156
10
21
140
1%
FY15
177
8
FY16 FY17
139
26%
Poland
Life GI
Performance and priorities
• High ROCE business with full TCC capabilities, multi-channel distribution, strong digital credentials and 15% share of profit pool
• VNB9 £57m (FY16: £54m); Maintained high quality mix with protection & unit-linked sales c85% of total
• COR7 improved to 86.7% from positive underwriting actions on Motor; NWP +36% benefitted from JV consolidation
• Distribution footprint further strengthened: MyAviva platform launched and new deal with ING announced
• Looking forward:
- Strong growth prospects
- Continue to build scale: further expand GI business and Digital/Direct offering, bolt-on M&A desirable
£m
All footnotes on page 67

23
Operating profit2
139170 168
33
42 45
23% -
213
FY17
172
212
FY15 FY16
Italy
GI Life
Performance and priorities £m
• Composite business with major bancassurance partnerships and a growing IFA franchise
• VNB9 more than doubled to £179m (FY16: £83m) from higher volumes and improved with-profit margin; Capital-light ‘hybrid’ product sales up 76%13 driving net flows of £2.3bn (+38%)
• New business strain dampened operating profit in 2017
• COR7 94.2% (FY16: 92.5%) from lower PYD with broadly stable underlying performance
• Looking forward:
- Continue shift to capital-light products, grow FA network and further develop digital capabilities
- Complete sale of Avipop JV to Banco BPM
All footnotes on page 67

24
Operating profit2
94112
(8)(12)
14%
FY17
110
118
FY16
100
FY15
88
(6)
Singapore
GI & Health Life
Performance and priorities £m
• Profitable franchise in leading wealth centre
• Top 6 life & health franchise / Opportunity to take additional share through disruptive distribution strategy
• 29% growth in VNB9 to £123m with double-digit volume increase in savings & protection products
• Aviva Financial Advisers: 673 advisers at FY17 (+60%) and market leader in FA regular premium space
• +10% operating profit despite expense of building FA channel & adverse impact on GI profitability from investment to build scale
• Looking forward:
- Capitalising on Aviva strengths as digital composite and partner of choice to accelerate growth
- Double digit sales growth target for FA segment
10%
All footnotes on page 67

25
Capital generation
£2.2bn
£0.9bn £(0.8)bn£(1.1)bn
£12.2bn£11.3bn
31-Dec-17 Disposals
£0.4bn
Dividend 2017 capital returns
Market, FX and other
£(0.2)bn
Other capital actions
Debt & centre costs
£(0.5)bn
BU underlying generation
31-Dec-16
Underlying capital
generation £1.7bn
Operating capital generation
£2.6bn
189%3
198%3
Actions include (£bn):
FL Part VIIs synergies 0.7 Other assumption & modelling changes 0.2 (net impacts)
All footnotes on page 67

26
Cash remittances
£m FY16 FY17 Change
UK10 1,187 1,800 52%
UK underlying 937 1,300 39%
Friends Life special 250 500 100%
Europe10 449 485 8%
Canada 130 55 (58)%
Asia - - -
Aviva Investors 39 57 46%
Cash remittances 1,805 2,398 33%
• Cumulative cash remittances (incl. proceeds from completed disposals only) on track at £4.6bn* vs. £8bn 2016-18 target
• £750m of Friends Life specials remitted to date vs. 2016-18 target of £1bn+
• France: DVA approval improves strength and resilience of local capital position; Opportunity for further capital optimisation in 2018 (FRPS)
• Canada’s remittance reflects disappointing FY17 performance
• Centre liquidity increased to £2.0bn (FY16: £1.8bn)
*Excludes proceeds from pending divestitures All footnotes on page 67

27
Capital deployment – 2018
De-leveraging c£0.9bn+
Bolt on M&A c£0.6bn
Capital returns >£0.5bn
**via a court approved reduction of capital at par plus accrued interest and arrears, and in the case of GA plc, issue premium, subject to approval from relevant issuer’s ordinary and preference shareholders voting together
Retiring hybrid debt €500m 6.875% T2 (May*)
$575m 7.875% RT1 (Nov*)
*Optional first call dates
Friends First Ireland
€130m
expected completion 1H18
£2bn available to deploy
M&A budget Focus on existing major markets
& Digital/Data capabilities
Unused component available for additional debt reduction or capital return
Liability management Ability to cancel expensive
preference shares through capital reduction**
Additional returns Share buy-back and/or special dividend potential in 2H18. Size subject to M&A
and liability management

28
Allocating resources to deliver growth and cash
12.5%
13.2%
FY17 FY16
Group ROE Allocating resources Driving cash & efficiency
• Complete pending divestitures
• Special remittances from UKI capital synergies
• Internal focus on Economic Value Added (‘EVA’) and business unit remittance ratios
• Global shared services
• Commencing Zero-Based Budgeting (‘ZBB’)
• Further back-book optimisation
• Big Data/AI & customer propositions
• Distribution relationships
• Aviva Investors
• Bulk Purchase Annuity
• Global Corporate & Specialty
• Strategic partnerships
• Bolt-on M&A

29
2017 operating EPS growth
FY17 operating
EPS
2017 share
buyback
Operating tax
Underlying growth
Weather & other
Assumption changes & prior year
development
FX Disposals
FY16 operating
EPS1
51.1p
54.8p
c(2)% c3% c6% c3.5% <0.5% c(1.5)% c(2)%
2018 outlook Targeting operating EPS growth >5%
?
-
Organic growth in major markets: >5%
Partial rebound in Canada: 1-2%
2017 capital returns: c2%
2018 planned capital returns: 1-1.5% (with full benefit in 2019)
+
Sources of EPS growth
FX, weather & other
+ + +
-
Perimeter changes: c(4)% from: • Residual impacts from 2017 disposals • FPI, Avipop & rest of Spain: mid year expected completions
Tax: c(1)-(2)%

30
Operating EPS Cash
Results and Targets
Operating EPS 54.8p +7%1
Aiming for >5%
growth p.a.
27.4p per share (+18%) 50% pay-out ratio
Targeting 55-60%
pay-out ratio by 2020
Dividend
Capital
Solvency II ratio3 198%
£3bn to deploy over
2018-19
Cash remittances £2.4bn
On track to deliver
£8bn 2016-18
All footnotes on page 67

Appendix

Life
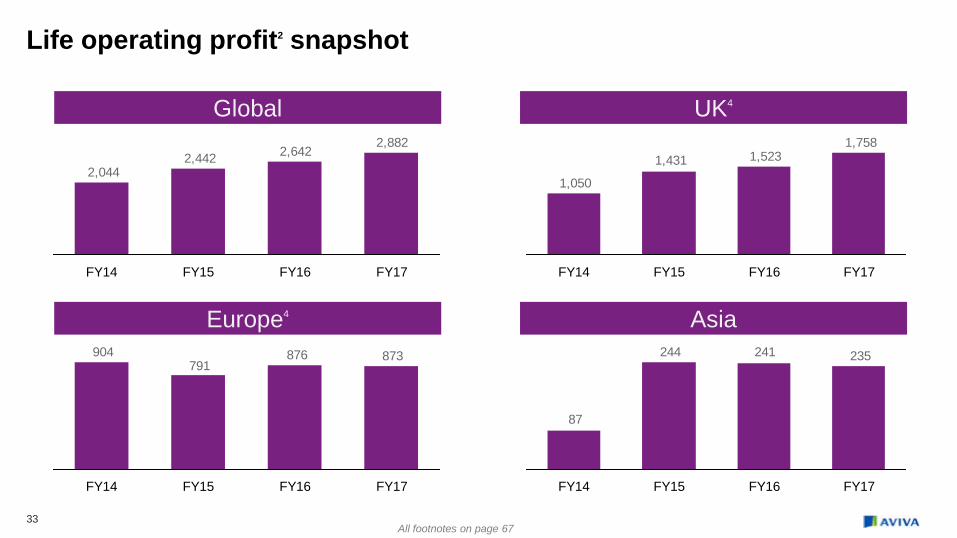
33
Life operating profit2 snapshot
2,8822,6422,442
2,044
FY16 FY17 FY14 FY15
All footnotes on page 67
1,7581,5231,431
1,050
FY15 FY16 FY17 FY14
Europe4
873876791
904
FY17 FY16 FY15 FY14
Global UK4
Asia 235241244
87
FY15 FY14 FY16 FY17

34
Profit drivers (Global life) Underwriting margin
Admin expenses & unit cost
New business (PVNBP9)
Investment return (AUM / margin) FY17
£40,795m
FY16
£35,037m
FY15
£29,765m
FY14
£24,407m
3.6%3.6%3.7%3.3%
2.3%2.6%2.6% 2.4% Acq. Margin
NB margin £580m£625m
£569m
£463m
FY17 FY16 FY15 FY14
£228.6bn£296.6bn
£339.7bn £357.2bn
FY17 FY16 FY15 FY14
77bps83bps
81bps 75bps
£867m£1,091m
£1,268m £1,312m
FY17 FY16 FY15 FY14
37bps 37bps 38bps
37bps
All footnotes on page 67

Investment revenues (Global life)
8861,268 1,579 1,634
624619
734 647
289 109166185
204
FY17
2,287
FY15
2,768 2,679
FY16
289
FY14
215 187
1,901
Unit linked
Participating
Expected return
Spread
Investment revenue mix
Spread (reserves/margin)
Unit linked (reserves/AMC)
Participating (reserves/bonus)
95.4bn 108.1bn 120.1bn 118.4bn
FY17 FY16 FY15 FY14
47.4bn58.6bn 67.7bn 70.2bn
FY14 FY17 FY16 FY15
85.8bn129.9bn 152.0bn 168.6bn
FY14 FY15 FY16
FY17
104bps98bps
103bps97bps
55bps61bps57bps
65bps 41bps43bps37bps
39bps
All footnotes on page 67
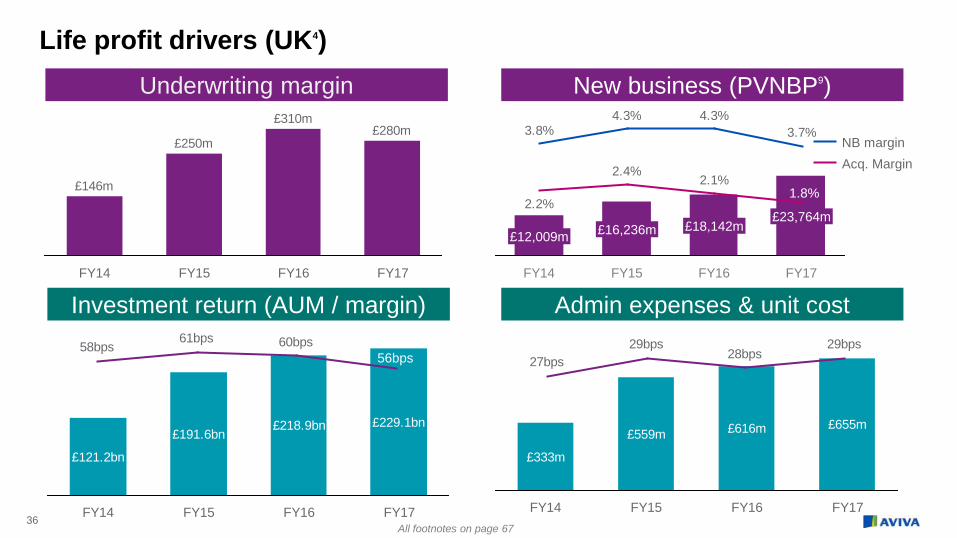
36
Life profit drivers (UK4) Underwriting margin
Admin expenses & unit cost
New business (PVNBP9)
Investment return (AUM / margin) FY17
£23,764m
FY16
£18,142m
FY15
£16,236m
FY14
£12,009m
3.7%4.3%4.3%
3.8%
2.1%2.4%
2.2%
Acq. Margin NB margin
£121.2bn
£191.6bn£218.9bn £229.1bn
FY17 FY16 FY15 FY14
61bps 60bps58bps56bps
£333m
£559m £616m £655m
FY17 FY16 FY15 FY14
29bps28bps
29bps27bps
£280m£310m
£250m
£146m
FY17 FY16 FY15 FY14
1.8%
All footnotes on page 67

37
£m Operating profit2 Margin Driver FY16
£m FY17
£m ∆ FY16 % bps
FY17 % bps Target range FY16 FY17
Long Term Savings
New (77) (74) 4% n/a n/a (90)-(100)
Existing 219 259 18% 25bps 25bps 25-30bps 88bn (Opening assets)
105bn (Opening assets)
Total 142 185 30%
Annuities & Equity Release
New 305 335 10% 11% 8% 7.5-8.5% 2,711m (PVNBP)
4,287m (PVNBP)
Existing 351 390 11% 67bps 68bps 55-70bps 52bn (Opening assets)
57bn (Opening assets)
Total 656 725 11%
Protection New 118 130 10% 54% 52% 40-50% 219m
(APE) 248m
(APE)
Existing 124 97 (22)% 8% 6% 7.5-8.5% 1.66bn (In-force premiums)
1.69bn (In-force premiums)
Total 242 227 (6)%
GI Underwriting1 232 246 6% 4,444m
(GI & Health NWP)
93.9%1 (GI COR)
4,587m (GI & Health NWP)
93.9% (GI COR)
LTIR & other 160 162 1%
Total 392 408 4%
Health Total 31 35 13%
Total from core businesses 1,463 1,580 8%
Legacy 332 331 - 40bps 41bps 35-40bps 83bn (Opening assets)
81bn (Opening assets)
Other 151 290 92% £150-200m
Total 1,946 2,201 13%
UK profit overview
All footnotes on page 67
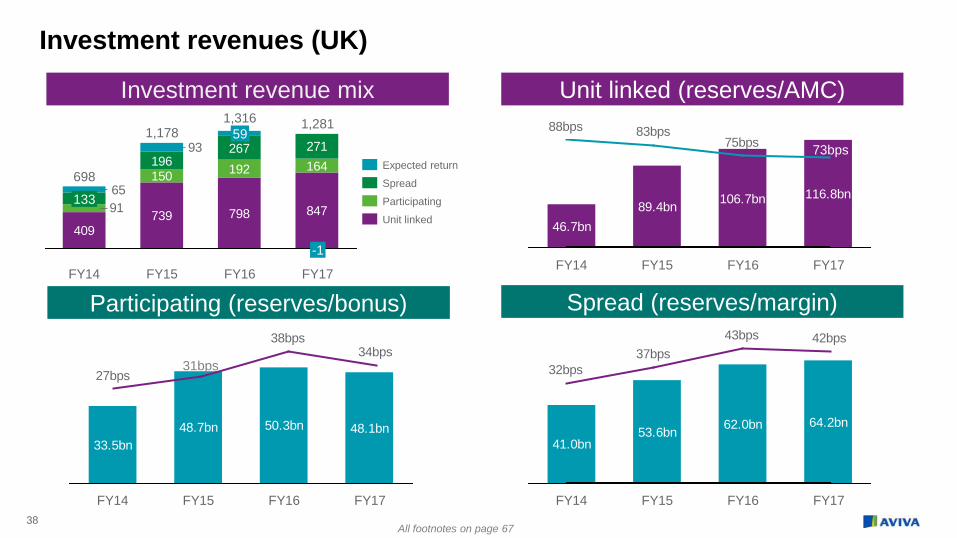
38
Investment revenues (UK)
409739 798
150 192
847
196267
164
91
93
65
271
FY17
1,281
-1
FY16
1,316 59
FY15
1,178
FY14
698
133 Unit linked
Participating
Spread
Expected return
Investment revenue mix
Spread (reserves/margin)
Unit linked (reserves/AMC)
Participating (reserves/bonus)
46.7bn89.4bn 106.7bn 116.8bn
FY17 FY16 FY15 FY14
33.5bn48.7bn 50.3bn 48.1bn
FY17 FY16 FY15 FY14
41.0bn53.6bn 62.0bn 64.2bn
FY17 FY16 FY15 FY14
75bps83bps88bps
73bps
34bps38bps
27bps31bps
42bps43bps37bps
32bps
All footnotes on page 67

39
Life profit drivers (Europe4) Underwriting margin
Admin expenses & unit cost
New business (PVNBP9)
Investment return (AUM / margin) FY17
£11,678m
FY16
£12,065m
FY15
£9,663m £9,059m
FY1411
2.6%
2.5%2.8%
2.7%
2.8%2.9%
2.4% Acq. Margin NB margin
£103.4bn £94.9bn£107.6bn £113.2bn
FY17 FY16 FY15 FY14
109bps107bps112bps
£498m £459m£556m £558m
FY17 FY15 FY14 FY16
49bps52bps
48bps48bps
£215m£239m£237m
£259m
FY14 FY15 FY16 FY17
All footnotes on page 67
103bps

40
Investment revenues (Europe4)
464 459 546 585
534 472527 487
126
FY17
1,171 6 93
FY16
1,170 13 84
FY15
1,019 9 79
FY14
1,153
29
Unit linked
Participating
Spread
Expected return
Investment revenue mix
Spread (reserves/margin)
Unit linked (reserves/AMC)
60.2bn 56.7bn66.3bn 66.4bn
FY17 FY16 FY15 FY14
Participating (reserves/bonus)
37.9bn34.0bn 36.8bn
42.3bn
FY17 FY16 FY15 FY14
5.3bn4.1bn 4.5bn
FY17 FY16 FY15 FY14
138bps148bps
135bps
122bps
73bps79bps83bps
89bps
22bps
55bps
13bps
4.5bn
29bps
All footnotes on page 67

General insurance & health

42
General insurance and health (Group) Net written premium
Investments GI Combined operating ratio7
64.0% 64.5% 69.2% 65.3%
31.6% 30.5% 30.9% 31.3%
95.0%
FY16
100.1%
FY17
96.6%
FY15 FY14
95.6%
C&E ratio Loss ratio
10,0359,134
8,0908,300
FY16 FY17 FY15 FY14
17,20015,268 14,369 14,770
FY17 FY16 FY15 FY14
2.5%2.4%2.6%2.8%
Operating profit2
700833765808
FY17 FY161 FY151 FY14
Average assets LTIR %
All footnotes on page 67

43
General insurance and health (UK4) Net written premium
Investments GI Combined operating ratio7
61.0% 64.7% 73.8% 61.0%
33.6% 31.1%32.5%
32.9%
FY17
93.9%
FY16
106.3%
FY15
95.8%
FY14
94.6%
Loss ratio C&E ratio
4,5874,4444,2144,181
FY17 FY16 FY15 FY14
9,436 8,080 6,776 6,149
FY17 FY16 FY15 FY14
2.7%2.7%2.8%2.4%
Operating profit2
443423389466
FY17 FY161 FY151 FY14
Average assets LTIR %
All footnotes on page 67
44
General insurance and health (Canada) Net written premium
Investments GI Combined operating ratio7
3,0282,453
1,9922,104
FY17 FY16 FY15 FY14
3,650 3,578 4,192 4,934
FY17 FY16 FY14 FY15
2.7%3.1%
2.3%
65.5% 63.3% 63.5% 72.2%
30.5% 30.6% 29.5%30.0%
FY17
102.2%
FY16
93.0%
FY15
93.9%
FY14
96.0%
Loss ratio C&E ratio
Operating profit2
46
269214189
FY17 FY16 FY15 FY14
Average assets LTIR %
2.5%
All footnotes on page 67

45
General insurance and health (Europe4)
Net written premium
Investments GI Combined operating ratio7
69.3% 66.4% 66.0% 63.1%
28.5% 28.9% 29.1% 30.2%
FY17
93.3%
FY16
95.1%
FY15
95.3%
FY14
97.8%
Loss ratio C&E ratio
2,2582,1001,7771,921
FY17 FY16 FY15 FY14
3,841 3,366 3,172 3,475
FY17 FY16 FY14 FY15
2.3%2.2%2.2%2.4%
Operating profit2
223168155146
FY17 FY16 FY15 FY14
Average assets LTIR %
All footnotes on page 67
Earnings per share

47
Operating earnings per share
FY16 FY17
Group operating profit2
3,010 3,068
Less operating tax (706) (639)
Minority Interest (147) (134)
DCI and fixed rate tier 1 notes (68) (65)
Preference shares (17) (17)
Total operating earnings after tax, MI & DCI and preference shares 2,072 2,213
Weighted average number of shares 4,051 4,041
Operating earnings per share 51.1 54.8
All footnotes on page 67

48
Basic earnings per share
FY16 FY17
Operating profit2 attributable to shareholders 2,072 2,213
Investment return variances and economic assumption changes on long-term business 313 86
Short-term fluctuation in return on investments backing non long-term business (398) (250)
Economic assumption changes on GI & Health business (193) (6)
Impairment of goodwill, joint ventures and associates and other amounts expensed - (49)
Amortisation and impairment of intangibles (137) (151)
Amortisation and impairment of acquired value of in-force business (455) (430)
Profit/(loss) on disposal and remeasurement of subsidiaries, JVs and associates (16) 113
Integration and restructuring costs (170) (111)
Other (398) -
Profit attributable to ordinary shareholders 618 1,415
Weighted average number of shares 4,051 4,041 Basic earnings per share 15.3p 35.0p
All footnotes on page 67

Returns

50
Operating return on total capital employed
1. Following a correction to accounting and modelling for annual management charge rebates in UK Life, prior year comparatives have been restated
30.1%
22.0%
12.5%
16.2%
13.4%
24.4%
14.0%13.5%15.7%
11.8%
25.7%
12.9%13.4%
2.4%
13.9%
FM Asia Europe 4 Canada UK4
FY17 FY16 FY15
All footnotes on page 67

51
Operating return on total capital employed & return on equity
Group return on equity Group return on capital employed
13.2%12.5%
14.1%
FY17 FY16 FY15
9.8%9.7%10.8%
FY17 FY16 FY15
All footnotes on page 67

52
`
£m Before tax After tax Weighted average
shareholders’ funds including non-controling interests
Return on Equity %
United Kingdom Life 1,758 1,425 11,191 12.7%
United Kingdom General Insurance 443 357 1,637 21.8%
United Kingdom 2,201 1,782 12,828 13.9%
Canada 46 34 1,442 2.4%
Europe 1,096 787 5,890 13.4%
Asia 227 212 1,638 12.9%
Fund management 164 127 495 25.7%
Corporate and Other Business{4} (273) (196) 5,669 n/a
Return on total capital employed 3,461 2,746 27,962 9.8%
Subordinated debt (389) (314) (7,224) 4.3%
Senior debt (4) (3) (1,398) 0.2%
Return on total equity 3,068 2,429 19,340 12.6%
Less: Non-controlling interests — (134) (1,325) 10.1%
Direct capital instrument and tier 1 notes — (65) (1,025) 6.3%
Preference capital — (17) (200) 8.5%
Return on equity shareholders' funds — 2,213 16,790 13.2%
Analysis of operating return on equity
All footnotes on page 67

Capital & cash flows

FY17 £bn % of SCR % of own funds
Tier 1 22.9 131% 77%
T1 unrestricted 20.3 116% 69% T1 restricted 2.6 15% 9% Tier 2 6.3 36% 21% Tier 3 0.3 2% 1%
29.5 169% 100%
54
Solvency II own funds by tier
• Regulatory view of own funds adjusted by £4.8bn due to with-profits funds, pension schemes and other pro-forma adjustments
• Shareholder view coverage ratio of 198%3
Shareholder view Regulatory view*
*Estimated
All footnotes on page 67

55
Solvency II – sensitivities Impact on Solvency cover ratio (SCR)
31/12/2017 SCR : 198%3
25bps increase in interest rate 4%
100bps increase in interest rate 15%
25bps decrease in interest rate (6)%
50bps decrease in interest rate (12)%
10% increase in market value of equity 2%
10% decrease in market value of equity (2)%
25% decrease in market value of equity (6)%
50bps increase in Corporate Bond spread 1%
100bps increase Corporate Bond spread (2)%
50bps decrease in Corporate Bond spread (1)%
10% increase in maintenance and investment expenses (6)%
10% increase in lapse rates (1)%
Credit downgrade on the annuity portfolio (4)%
5% increase in mortality / morbidity rates – life assurance (1)%
5% decrease in mortality rates – annuity business (11)%
5% increase in gross loss ratios (3)% All footnotes on page 67

External debt – a balanced maturity profile Subordinated debt profile
8.250% 6.875%
7.875%
6.875% 5.902%
6.625%
12.000%
8.250%
6.125%
8.25%
7.875%
6.875% 6.875% 5.9021%
All debt instruments have been presented at optional first call dates at nominal values converted to GBP using 31 December 2017 rates.
£266m
£162m
£600m
£400m£400m
£700m
£799m
£621m£577m
£500m
£450m
£444m
£800m
£500m
£210m
£425m
2038 2030 2029 2026 2025 2024 2023 2022
£1,300m
2021
£878m
2020
£869m
2018 2019
Tier 3
Tier 2
Restricted Tier 1
All footnotes on page 67

57
Preference shares
General Accident plc preference shares* £250m £21m p.a. interest costs
140m 8.875% shares of £1, paid in January & July £140m
110m 7.875% shares of £1, paid in April & October £110m
4 separate issues of preference shares
Aviva plc preference shares £200m £17m p.a. interest costs
100m 8.375% shares of £1, paid in March & September £100m
100m 8.75% shares of £1, paid in June & December £100m
• Ability to cancel expensive preference shares through capital reduction**
• High cost, non-tax deductible, cumulative dividend
• Considered debt for leverage calculations
• No capital recognition from 1 January 2026 under Solvency II (end of transitional period)
Total preference share capital £450m £38m p.a. interest costs
*General Accident plc (‘GA’) is a wholly owned subsidiary of Aviva plc **via a court approved reduction of capital at par plus accrued interest and arrears, subject to approval from relevant issuer’s ordinary and preference shareholders voting together All footnotes on page 67

58
External debt – a balanced maturity profile Excess centre cash flow
8.250% 6.875%
7.875%
6.875% 5.902%
6.625%
12.000%
8.250%
6.125%
8.25%
6.875% 6.875% 5.9021%
1,656
2,3982,213 185
Cash remitted to Group
Internal interest received
Dividends received
External interest paid
Other operating cash flows
Central spend Internal interest paid
(549)
(66) (183) 56
Excess centre cash flow
All footnotes on page 67

Balance sheet

60
Total managed assets
Participating assets by type Assets by liabilities covered
FY17
358,048
79,157
153,729
125,162
FY16
346,216
79,780
132,901
133,535
Shareholder funds Policyholder funds Participating funds
133,535 125,162
FY17
54,813
70,349
FY16
56,672
76,863
UK With-profits style
Euro-style
Shareholder assets by type 79,157 79,780
FY17
13,581
65,576
FY16
14,152
65,628 GI, Health & other
Annuity & non-profit
£m
All footnotes on page 67
61
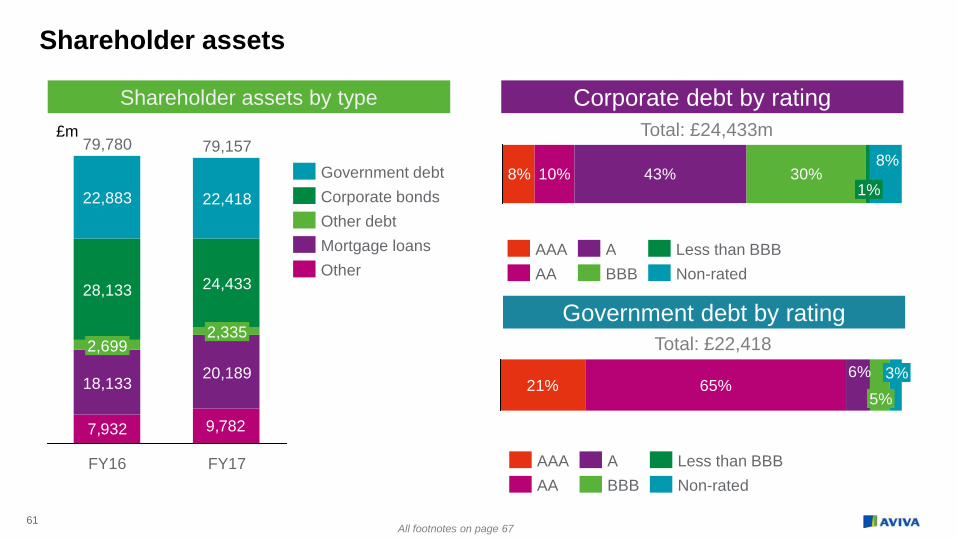
Shareholder assets
Shareholder assets by type
9,7827,932
22,418
79,780
18,133
FY17
2,699
22,883
79,157
20,189
24,433
FY16
28,133
2,335
Corporate debt by rating
Government debt by rating
8% 10% 43% 30%8%
1%
21% 65%6%
5% 3%
A BBB
Less than BBB Non-rated AA
AAA
BBB AAA
Non-rated Less than BBB A
AA
Total: £24,433m
Total: £22,418
£m
Other debt Mortgage loans Other
Corporate bonds Government debt
All footnotes on page 67

62
Shareholder assets
Corporate bonds by industry Loans by type
8% 18%
17%
7% 5%
9%
2%
14%
20%
Financials - Banks Real estate Oil & gas
Communications
Other Industrial Consumer services
Financials - Insurance & other Utilities
1% 2%
15%
82%
Healthcare, Infrastructure & PFI other loans Loans & advances to banks
Mortgage loans Other
Total: £24,515m
All footnotes on page 67

63
Shareholder assets – Mortgage loans
Mortgage loans Commercial real estate portfolio
95% 83% 85% 61% 58% 56%
446 9 1,583 1,492
1.4x 1.4x 1.5x 2.1x 2.2x 2.5x
FY16 FY15 FY13 FY12 FY17 FY14
Loans in arrears
Loan interest cover
46%
17%
37%
Total: £20,189m
Healthcare, infrastructure & PFI Commercial Securitised mortgage loans & equity release
Commercial: £7,547m
LTV
All footnotes on page 67

Other

65
Disposals – 2017 estimated contributions
Consideration Completion Operating profit (before tax & MI)
(£m)
Operating profit (after tax & MI)
Operating EPS (p)
IFRS NAV (Impact net of proceeds)
Antarius €500m 1Q17 22 6 0.2 Included
Spain (Part I) €475m Sept. ‘17 51 18 0.4 Included
Spain (Part II) €202m Mid-18 25 8 0.2 c.£80m
Avipop €265m Mid-18 51 18 0.4 c.£12m
FPIL £340m Mid-18 119 122 3.0 c.£(118)m
Taiwan Not disclosed Jan. ’18 Negligible Negligible Negligible Negligible
All footnotes on page 67

66
Estimated amortisation of acquired value of in-force
£0m
£100m
£200m
£300m
£400m
£500m
2017 2018 2019 2020 2021 2022 2023 2024 2025 2026 2027 2028
FPI FL UK Other Aviva businesses
This is our latest estimated projection as provided at FY17 and is subject to a number of factors including the effects of markets. We announced the sale of FPI in July 2017. It is expected to complete in early 2018.
All footnotes on page 67

67
Footnotes
1. 2016 and 2015 exclude the impact from an outward quota share reinsurance agreement written in 2015 and completed in 2016 in Aviva Insurance Limited (AIL) and the effects of Ogden in 2016.
2. Adjusted operating profit is an Alternative Performance Measure (APM) which is used by the Group to supplement the required disclosures under IFRS. 3. The estimated Solvency II position represents the shareholder view. This excludes the contribution to Group Solvency Capital Requirement (SCR) and
Group Own Funds of fully ring fenced with-profits funds of £3.3 billion (2016: £2.9 billion) and staff pension schemes in surplus of £1.5 billion (2016: £1.1 billion). These exclusions have no impact on Solvency II surplus. The estimated Solvency II position includes the pro forma impacts of the disposals of Friends Provident International Limited (£0.1 billion increase to surplus) and the Italian Avipop Assicurazioni S.p.A (£0.1 billion increase to surplus). The 31 December 2016 Solvency II position included pro forma adjustments for the impact of the announced disposal of Antarius and the future impact of changes to UK tax rules announced by the Chancellor of the Exchequer’s Autumn statement, which was removed following clarification in the 13 July 2017 Finance Bill. The 31 December 2016 Solvency II position also includes an adverse impact of a notional reset of the transitional provisions (TMTP) to reflect interest rates at 31 December 2016 £0.4 billion decrease to surplus
4. Following the launch of UK Insurance which brings together UK Life, UK General Insurance and UK Health into a combined business, the Ireland Life and General Insurance businesses have been aligned to the new management structure and reported within Europe. As a result, comparative balances have been restated.
5. France operating profit excludes the disposal of Antarius. 6. 2015 and 2016 operating profit movement for Ireland excludes operating profit from Ireland Health which was disposed of during 2016. 7. The combined operating ratio is now reported on an earned basis. Comparatives have been realigned to reflect this change. 8. NAV is presented net of tax & MI. 9. PVNBP and VNB are presented on an adjusted Solvency II basis. 10. Cash remitted to Group and Solvency II operating capital generation are managed at legal entity level. As Ireland constitutes a branch of the United
Kingdom business, cash remittances from Ireland were not aligned to the new management structure within Europe, but they were reported within United Kingdom.
11. Excludes the impact of the Ogden discount rate change in 2016. 12. FFA: Fédération Française de l’Assurance 13. Movements are in constant currency