Embed Size (px)
Citation preview
CAA AVIATION SAFETY REPORT
Published 24 December 2019
Aviation Safety Report
6 Monthly Summary of Aviation Safety for the year ended 30 June 2019
Intelligence Safety & Risk Analysis Unit
Page 2
Copyright Civil Aviation Authority
Distribution Director of Civil Aviation - Graeme Harris Chief Legal Counsel - John Sneyd Manager Regulatory Investigations – Rob Scriven Principal Medical Officer – Dougal Watson Principal Aviation Examiner – David Harrison T/L Regulatory Investigation Unit – Dianne Cooze T/L Licensing & Flight Training - Mark Boyle T/L Medical Certification – Christine Harris Deputy Director Air Transport & Airworthiness - Mark Hughes Manager Air Transport – Tom van Royen Team Leader, 121/129 Flight Operations - Rod Buchanan Team Leader, 125/135 Flight Operations – Chris Nicholls Manager Airworthiness - Shaun Johnson Team Leader Registration & Airworthiness - David Gill Team Leader Product Certification - Greg Baum Team Leader Product Continuing Airworthiness - Warren Hadfield Director New Southern Sky - Steve Smyth Deputy Director General Aviation - Steve Moore Manager Special Flight Operations and Recreational Aviation – Jonathan Mayne Team Leader - Unmanned Aircraft – Corey Price Team Leader - Flight Operations – Paula Moore Manager Helicopter & Agricultural Operations - Steve Kern Team Leader Flight Operations, Helicopter – Vicki Coats Team Leader Airworthiness, Helicopter & Agricultural - Adrian Duncan Manager Health & Safety – Lesley Coubrough Deputy Director Aviation Infrastructure & Personnel - Chris Ford Manager Aeronautical Services - Sean Rogers Manager Security – Debbie Suisted Deputy Chief Executive Strategy & Governance - John Kay Manager Intelligence, Safety & Risk Analysis - Jack Stanton Manager International & Regulatory Strategy - Mark von Motschelnitz Manager Safety Investigation - Jim Burtenshaw Manager Communications & Safety Promotion - Mike Richards Team Leader Safety Promotion – Kelly Gage Manager Planning & Performance - Lisa Rickard-Simms General Manager Corporate Services – Allan Frost Chief Information Officer – Arthur Devitt Chief Financial Officer – Andy Wells National Manager Property & Procurement Administration – Nick Price General Manager Organisational Development - Janine Hearn Manager Business Improvement – Nick McGirr T/L Learning & Development Darren Scott Manager HR Services - Kelly Sloper
Page 3
Published 24 December 2019
Table of Contents Introduction and Executive Summary .............................................................. 4
Introduction .......................................................................................................................................... 4 Key Indicators ....................................................................................................................................... 4 Executive Summary ............................................................................................................................ 5
Industry Size ................................................................................................................................ 5 Industry Activity ..................................................................................................................... 10 Safety Outcomes ...................................................................................................................... 13 Precursors to Safety Failure ............................................................................................... 15
Industry Size and Activity Data ....................................................................... 17 Registered Aircraft .......................................................................................................................... 17 Licences 18 Operators (Owners) ........................................................................................................................ 18 Certificated Operators .................................................................................................................... 19 Aircraft Movements ......................................................................................................................... 20
Long-Term Change in Aircraft Movements .................................................................. 20 Breakdown by Aerodrome .................................................................................................. 21
Air Transport Flights ...................................................................................................................... 23 Hours Flown ....................................................................................................................................... 25
Safety Target Structure ........................................................................................................ 26 Number of Accidents ............................................................................................................. 26 Flight Phase ............................................................................................................................... 26 Number of Fatalities .............................................................................................................. 27
Airspace Incidents ........................................................................................................................... 28 Breakdown by Aircraft Category ...................................................................................... 28 Breakdown by Severity ........................................................................................................ 29 Breakdown by Airspace Designation.............................................................................. 29 Breakdown of Airspace Incidents in Control Zones by Aerodrome .................. 30
Operational (Aircraft) Incidents ................................................................................................ 31 Breakdown by Aircraft Category ...................................................................................... 31 Breakdown by Severity ........................................................................................................ 32 Number of Incidents .............................................................................................................. 32
Defect Incidents ................................................................................................................................ 33 Breakdown by Aircraft Category ...................................................................................... 33 Breakdown by Severity ........................................................................................................ 34 Number of Incidents .............................................................................................................. 34
Occurrences — General ................................................................................................................. 35
Appendix — Definitions .................................................................................. 36 General 36 Safety Target Groups ...................................................................................................................... 39 Aircraft Categories ........................................................................................................................... 42 Significant Events ............................................................................................................................. 43 Serious Events ................................................................................................................................... 44 Safety Failure ..................................................................................................................................... 45 Close Call 45
Executive Summary Page 4
Copyright Civil Aviation Authority
Introduction and Executive Summary Introduction This safety report is produced using data from the Civil Aviation Authority’s Aviation Safety Management System. It primarily covers the period from 1 July 2018 to 30 June.1
Key Indicators • Key measures of industry activity have increased as follows in the above period.
o Aircraft on CAA records increased slightly by 1.0%
o Airline Air transport flights decreased by 5.5%
o Adventure Aviation flights including parachute descents increased by 5.8%
o Total hours flown increased by 1.0% varying by sector from 68% for Adventure Aviation to 10% decrease for Private flying
• The number of organisational certificates currently held has decreased by 0.9% to 1065.
• The number of accidents in the period was 120, up from 91 in the last period, and the trend is up relative to the average of the preceding three years (97 accidents pa 2016 to 2018).
• There were 13 fatalities, 4 more than in the previous 12 months and the third highest in the last ten years. The average of the last four years was 11.25 fatalities pa and the highest in the last ten years was 22 fatalities in 2012
• The accident statistics are now led by, private sport aircraft Part 115 sport transport and then private aeroplanes, but the principal contributors to the fatalities are private sport aircraft followed by other commercial helicopters, other commercial aeroplanes and the other commercial spot aircraft. The number of fatalities in ‘other commercial’ operations remains a concern and area of focus for the CAA.
J.D. Stanton Manager Intelligence Safety and Risk Analysis
1 This report uses June end years. Where quarters are referred to the first quarter is 1 July to 30 September.
Data in tables may not sum exactly to the total shown due to rounding
Executive Summary Page 5
Published 24 December 2019
Executive Summary Industry status as at 30 June 2019 and trend over the preceding 9 years
This section is organised into three parts
• Industry Size • Industry Activity • Safety Outcomes
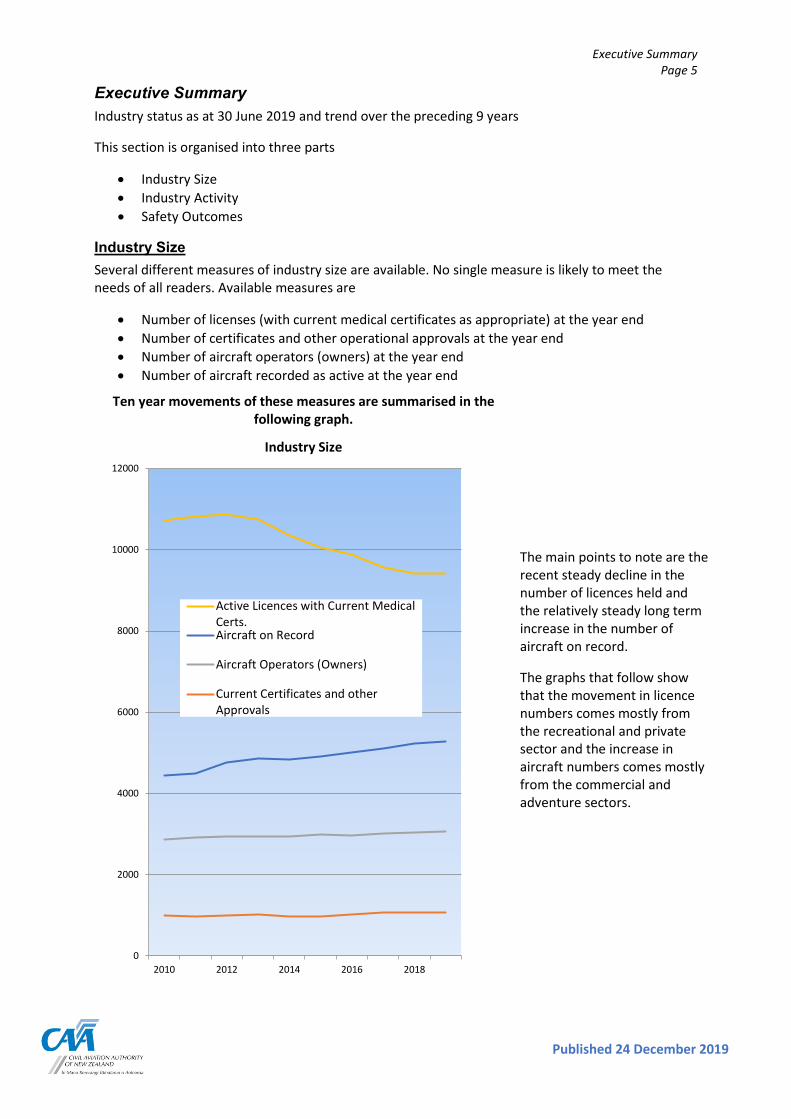
Industry Size Several different measures of industry size are available. No single measure is likely to meet the needs of all readers. Available measures are
• Number of licenses (with current medical certificates as appropriate) at the year end • Number of certificates and other operational approvals at the year end • Number of aircraft operators (owners) at the year end • Number of aircraft recorded as active at the year end
Ten year movements of these measures are summarised in the following graph.
The main points to note are the recent steady decline in the number of licences held and the relatively steady long term increase in the number of aircraft on record.
The graphs that follow show that the movement in licence numbers comes mostly from the recreational and private sector and the increase in aircraft numbers comes mostly from the commercial and adventure sectors.
0
2000
4000
6000
8000
10000
12000
2010 2012 2014 2016 2018
Industry Size
Active Licences with Current MedicalCerts.Aircraft on Record
Aircraft Operators (Owners)
Current Certificates and otherApprovals
Executive Summary Page 6
Copyright Civil Aviation Authority
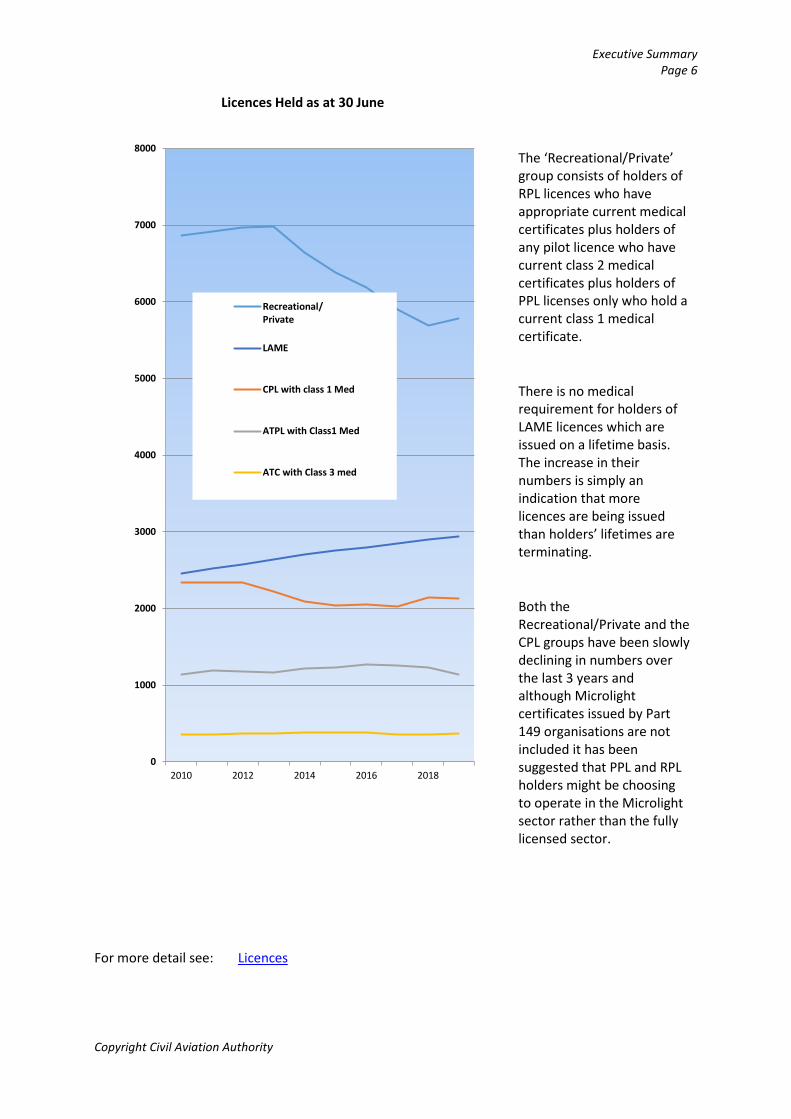
The ‘Recreational/Private’ group consists of holders of RPL licences who have appropriate current medical certificates plus holders of any pilot licence who have current class 2 medical certificates plus holders of PPL licenses only who hold a current class 1 medical certificate.
There is no medical requirement for holders of LAME licences which are issued on a lifetime basis. The increase in their numbers is simply an indication that more licences are being issued than holders’ lifetimes are terminating.
Both the Recreational/Private and the CPL groups have been slowly declining in numbers over the last 3 years and although Microlight certificates issued by Part 149 organisations are not included it has been suggested that PPL and RPL holders might be choosing to operate in the Microlight sector rather than the fully licensed sector.
For more detail see: Licences
0
1000
2000
3000
4000
5000
6000
7000
8000
2010 2012 2014 2016 2018
Licences Held as at 30 June
Recreational/Private
LAME
CPL with class 1 Med
ATPL with Class1 Med
ATC with Class 3 med
Executive Summary Page 7
Published 24 December 2019
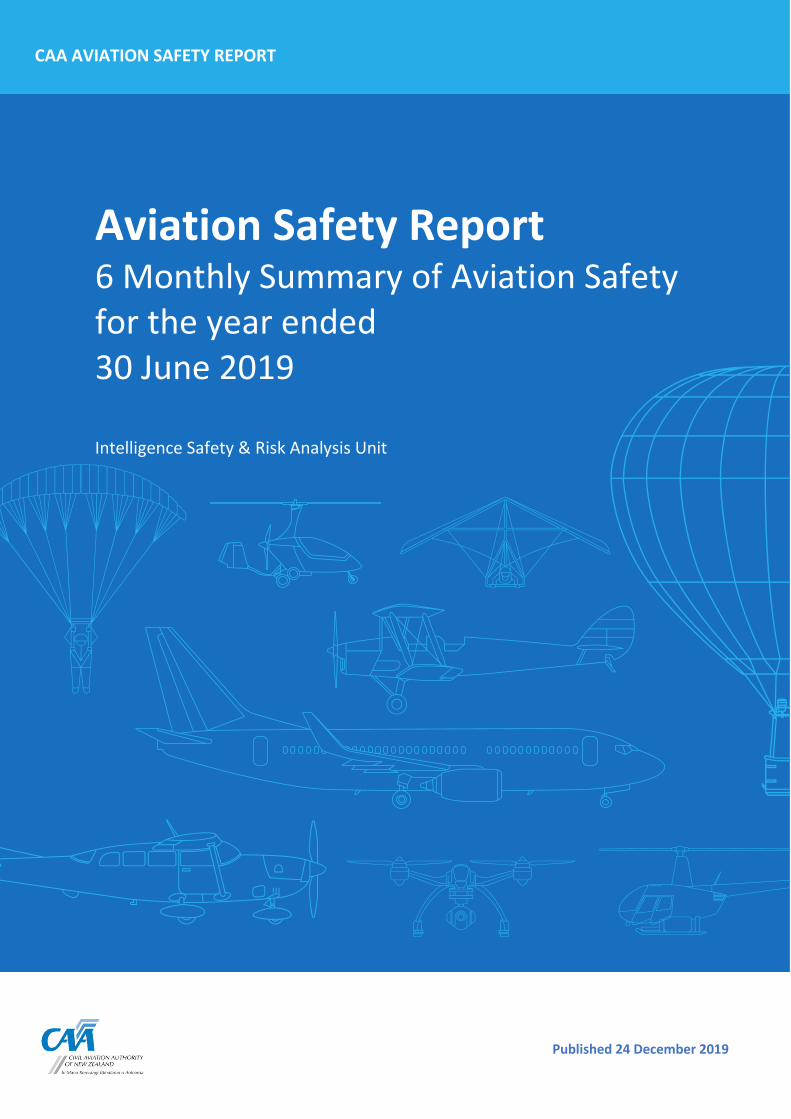
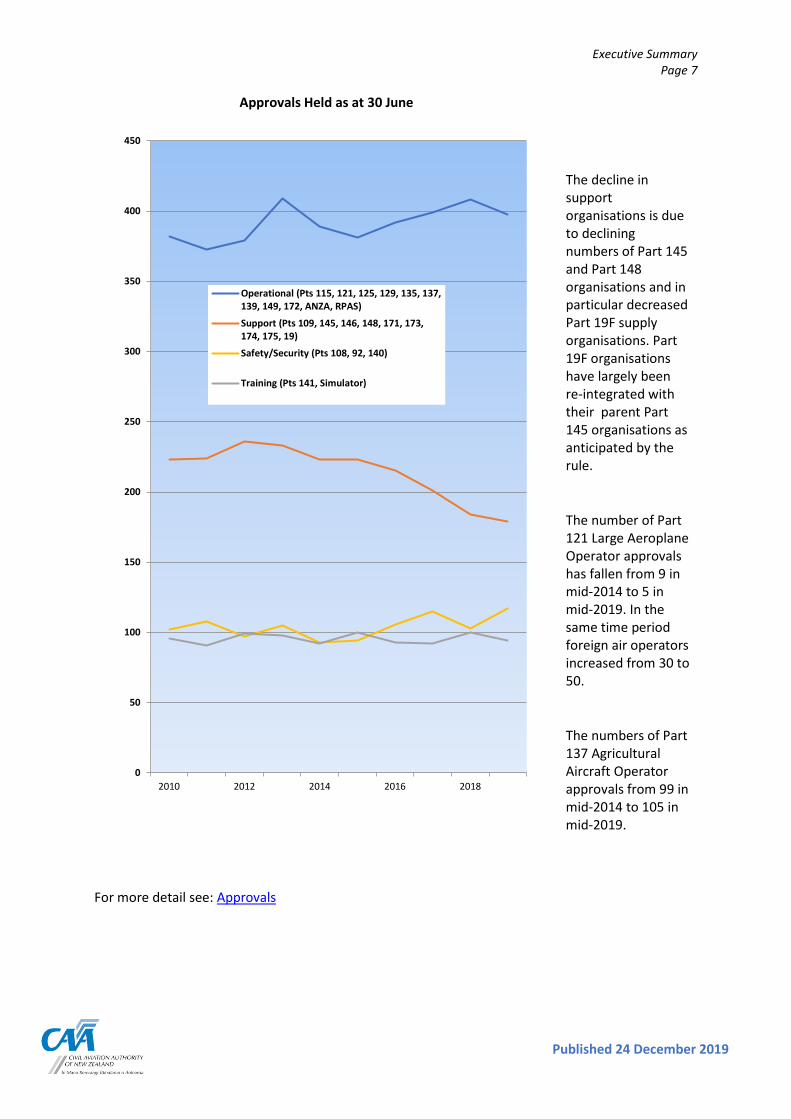
The decline in support organisations is due to declining numbers of Part 145 and Part 148 organisations and in particular decreased Part 19F supply organisations. Part 19F organisations have largely been re-integrated with their parent Part 145 organisations as anticipated by the rule.
The number of Part 121 Large Aeroplane Operator approvals has fallen from 9 in mid-2014 to 5 in mid-2019. In the same time period foreign air operators increased from 30 to 50.
The numbers of Part 137 Agricultural Aircraft Operator approvals from 99 in mid-2014 to 105 in mid-2019.
For more detail see: Approvals
0
50
100
150
200
250
300
350
400
450
2010 2012 2014 2016 2018
Approvals Held as at 30 June
Operational (Pts 115, 121, 125, 129, 135, 137,139, 149, 172, ANZA, RPAS)
Support (Pts 109, 145, 146, 148, 171, 173,174, 175, 19)
Safety/Security (Pts 108, 92, 140)
Training (Pts 141, Simulator)
Executive Summary Page 8
Copyright Civil Aviation Authority
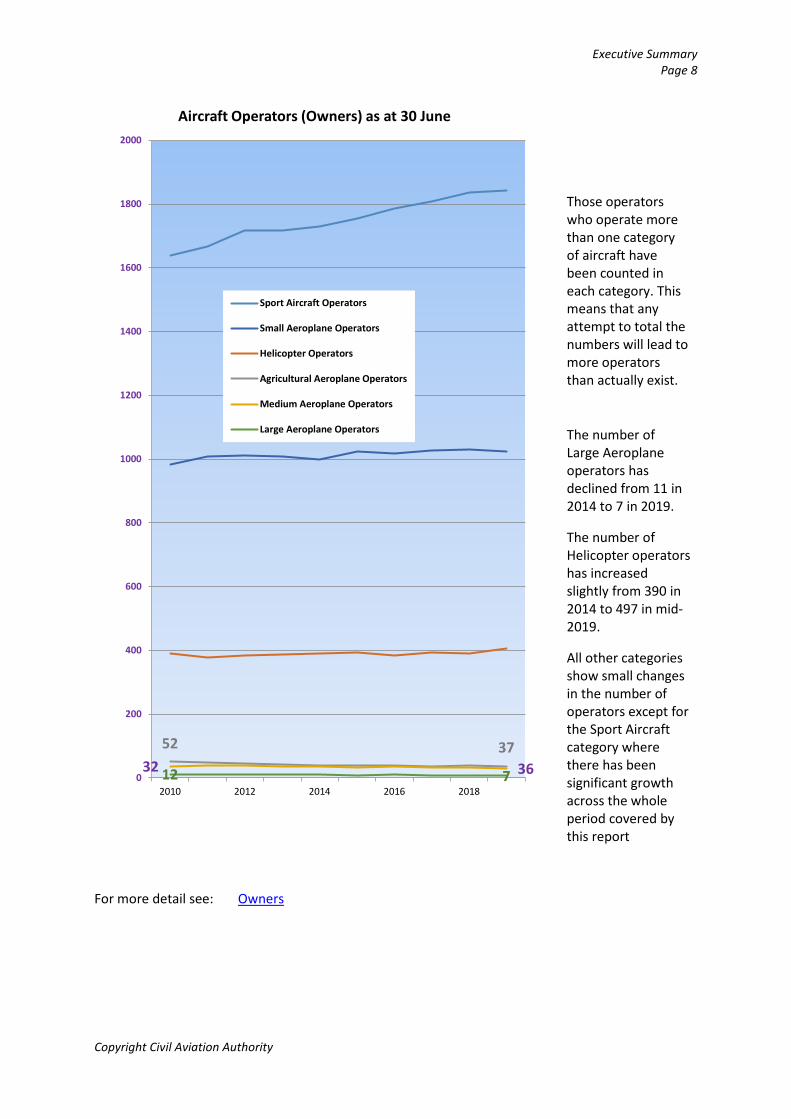
Those operators who operate more than one category of aircraft have been counted in each category. This means that any attempt to total the numbers will lead to more operators than actually exist.
The number of Large Aeroplane operators has declined from 11 in 2014 to 7 in 2019.
The number of Helicopter operators has increased slightly from 390 in 2014 to 497 in mid-2019.
All other categories show small changes in the number of operators except for the Sport Aircraft category where there has been significant growth across the whole period covered by this report
For more detail see: Owners
52 3732 3612 70
200
400
600
800
1000
1200
1400
1600
1800
2000
2010 2012 2014 2016 2018
Aircraft Operators (Owners) as at 30 June
Sport Aircraft Operators
Small Aeroplane Operators
Helicopter Operators
Agricultural Aeroplane Operators
Medium Aeroplane Operators
Large Aeroplane Operators
Executive Summary Page 9
Published 24 December 2019
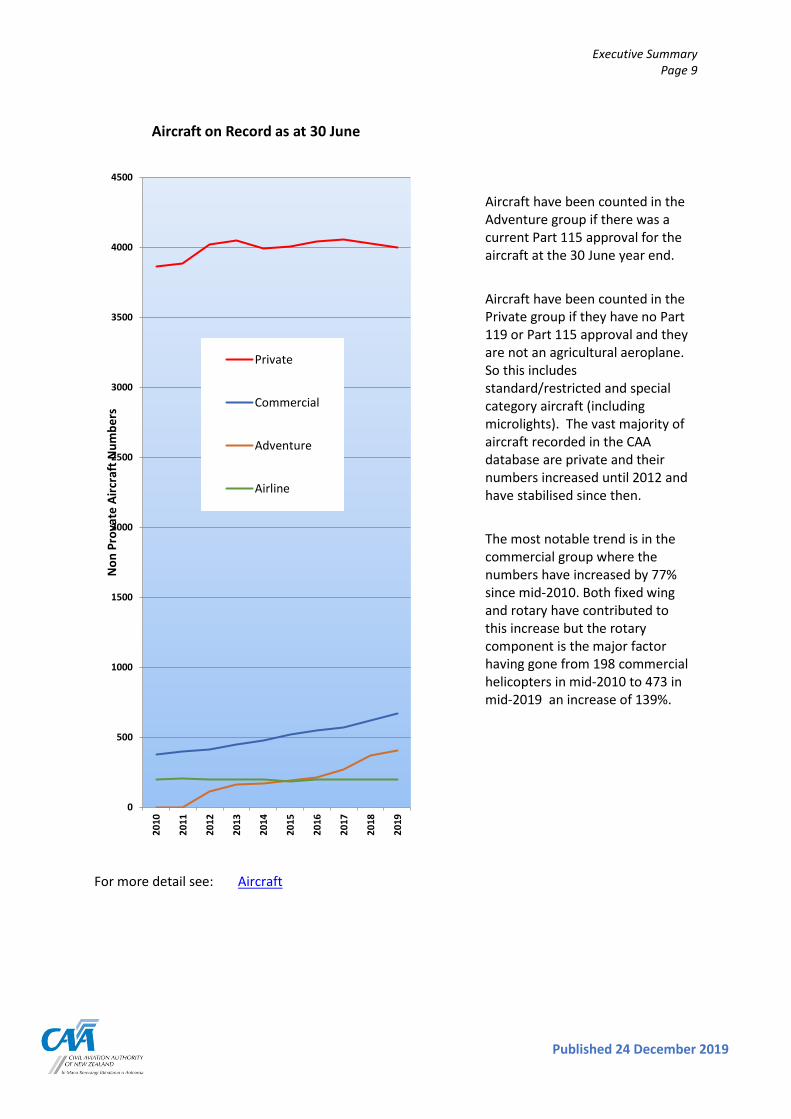
Aircraft have been counted in the Adventure group if there was a current Part 115 approval for the aircraft at the 30 June year end. Aircraft have been counted in the Private group if they have no Part 119 or Part 115 approval and they are not an agricultural aeroplane. So this includes standard/restricted and special category aircraft (including microlights). The vast majority of aircraft recorded in the CAA database are private and their numbers increased until 2012 and have stabilised since then. The most notable trend is in the commercial group where the numbers have increased by 77% since mid-2010. Both fixed wing and rotary have contributed to this increase but the rotary component is the major factor having gone from 198 commercial helicopters in mid-2010 to 473 in mid-2019 an increase of 139%.
For more detail see: Aircraft
0
500
1000
1500
2000
2500
3000
3500
4000
4500
2010
2011
2012
2013
2014
2015
2016
2017
2018
2019
Non
Pro
vate
Airc
raft
Num
bers
Aircraft on Record as at 30 June
Private
Commercial
Adventure
Airline
Executive Summary Page 10
Copyright Civil Aviation Authority
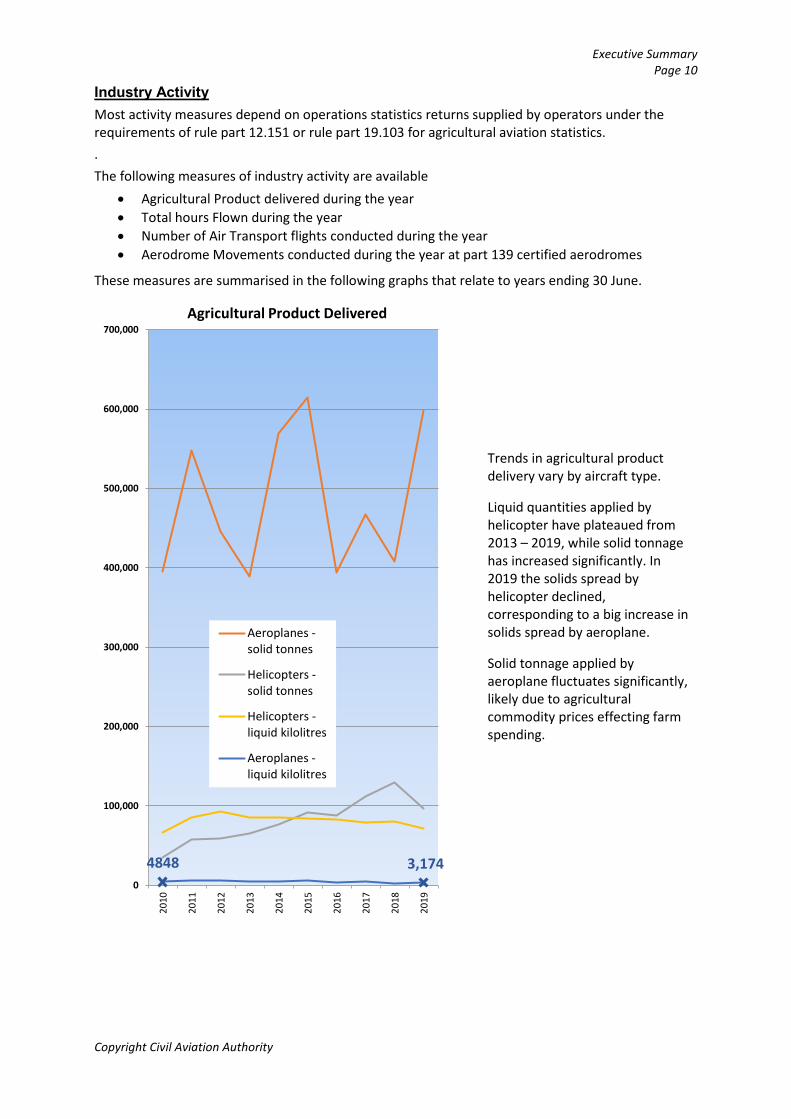
Industry Activity Most activity measures depend on operations statistics returns supplied by operators under the requirements of rule part 12.151 or rule part 19.103 for agricultural aviation statistics. . The following measures of industry activity are available
• Agricultural Product delivered during the year • Total hours Flown during the year • Number of Air Transport flights conducted during the year • Aerodrome Movements conducted during the year at part 139 certified aerodromes
These measures are summarised in the following graphs that relate to years ending 30 June.
Trends in agricultural product delivery vary by aircraft type.
Liquid quantities applied by helicopter have plateaued from 2013 – 2019, while solid tonnage has increased significantly. In 2019 the solids spread by helicopter declined, corresponding to a big increase in solids spread by aeroplane.
Solid tonnage applied by aeroplane fluctuates significantly, likely due to agricultural commodity prices effecting farm spending.
4848 3,174 0
100,000
200,000
300,000
400,000
500,000
600,000
700,000
2010
2011
2012
2013
2014
2015
2016
2017
2018
2019
Agricultural Product Delivered
Aeroplanes -solid tonnes
Helicopters -solid tonnes
Helicopters -liquid kilolitres
Aeroplanes -liquid kilolitres
Executive Summary Page 11
Published 24 December 2019
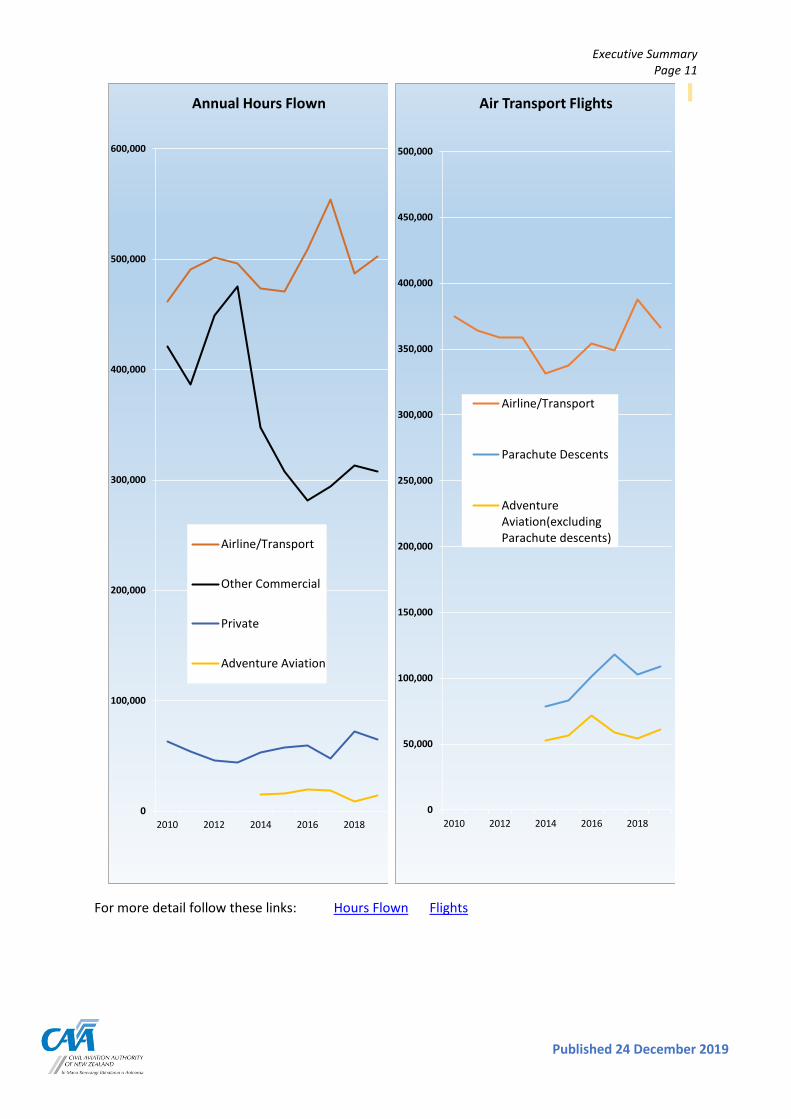
For more detail follow these links: Hours Flown Flights
0
100,000
200,000
300,000
400,000
500,000
600,000
2010 2012 2014 2016 2018
Annual Hours Flown
Airline/Transport
Other Commercial
Private
Adventure Aviation
0
50,000
100,000
150,000
200,000
250,000
300,000
350,000
400,000
450,000
500,000
2010 2012 2014 2016 2018
Air Transport Flights
Airline/Transport
Parachute Descents
AdventureAviation(excludingParachute descents)
Executive Summary Page 12
Copyright Civil Aviation Authority
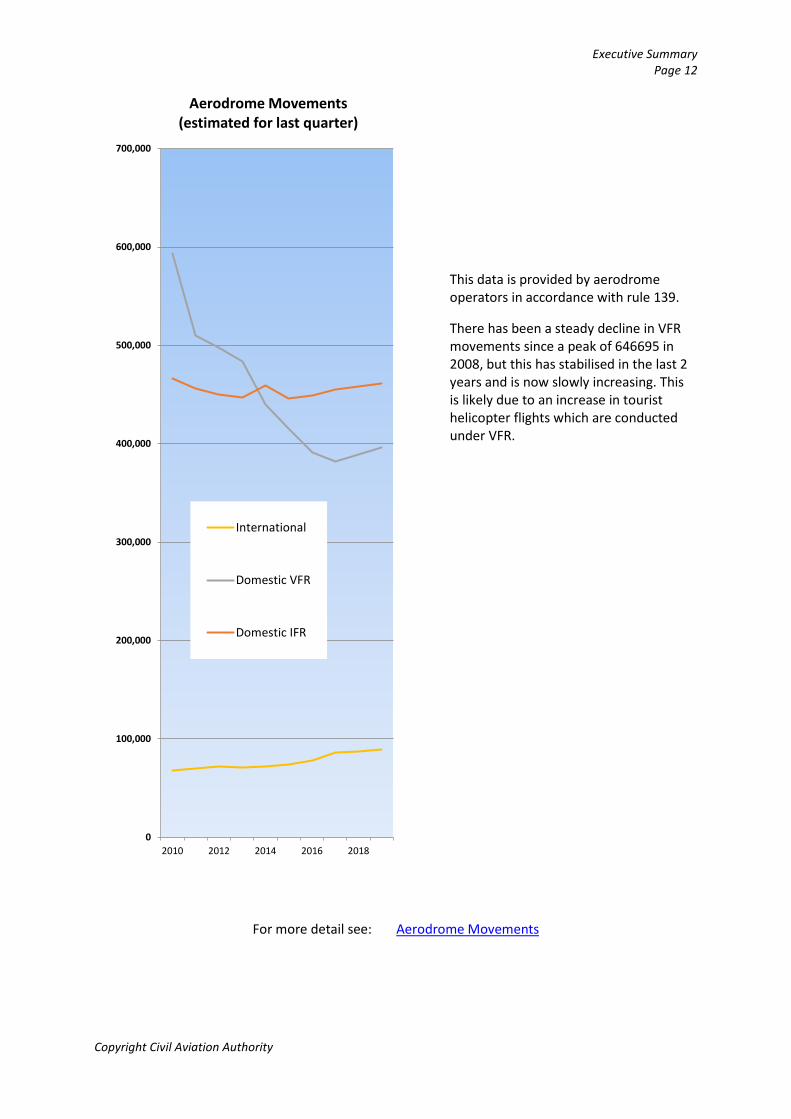
This data is provided by aerodrome operators in accordance with rule 139.
There has been a steady decline in VFR movements since a peak of 646695 in 2008, but this has stabilised in the last 2 years and is now slowly increasing. This is likely due to an increase in tourist helicopter flights which are conducted under VFR.
For more detail see: Aerodrome Movements
0
100,000
200,000
300,000
400,000
500,000
600,000
700,000
2010 2012 2014 2016 2018
Aerodrome Movements(estimated for last quarter)
International
Domestic VFR
Domestic IFR
Executive Summary Page 13
Published 24 December 2019
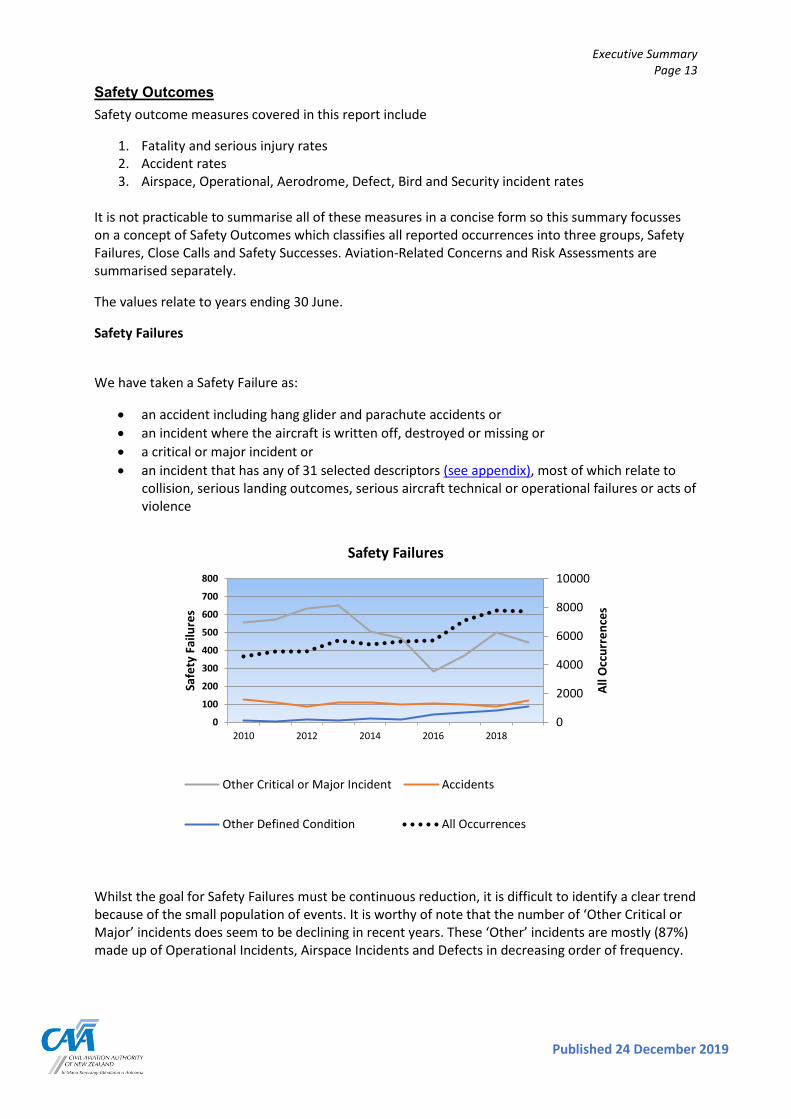
Safety Outcomes Safety outcome measures covered in this report include
1. Fatality and serious injury rates 2. Accident rates 3. Airspace, Operational, Aerodrome, Defect, Bird and Security incident rates
It is not practicable to summarise all of these measures in a concise form so this summary focusses on a concept of Safety Outcomes which classifies all reported occurrences into three groups, Safety Failures, Close Calls and Safety Successes. Aviation-Related Concerns and Risk Assessments are summarised separately.
The values relate to years ending 30 June.
Safety Failures
We have taken a Safety Failure as:
• an accident including hang glider and parachute accidents or • an incident where the aircraft is written off, destroyed or missing or • a critical or major incident or • an incident that has any of 31 selected descriptors (see appendix), most of which relate to
collision, serious landing outcomes, serious aircraft technical or operational failures or acts of violence
Whilst the goal for Safety Failures must be continuous reduction, it is difficult to identify a clear trend because of the small population of events. It is worthy of note that the number of ‘Other Critical or Major’ incidents does seem to be declining in recent years. These ‘Other’ incidents are mostly (87%) made up of Operational Incidents, Airspace Incidents and Defects in decreasing order of frequency.
0
2000
4000
6000
8000
10000
0
100
200
300
400
500
600
700
800
2010 2012 2014 2016 2018
All O
ccur
renc
es
Safe
ty F
ailu
res
Safety Failures
Other Critical or Major Incident Accidents
Other Defined Condition All Occurrences
Executive Summary Page 14
Copyright Civil Aviation Authority
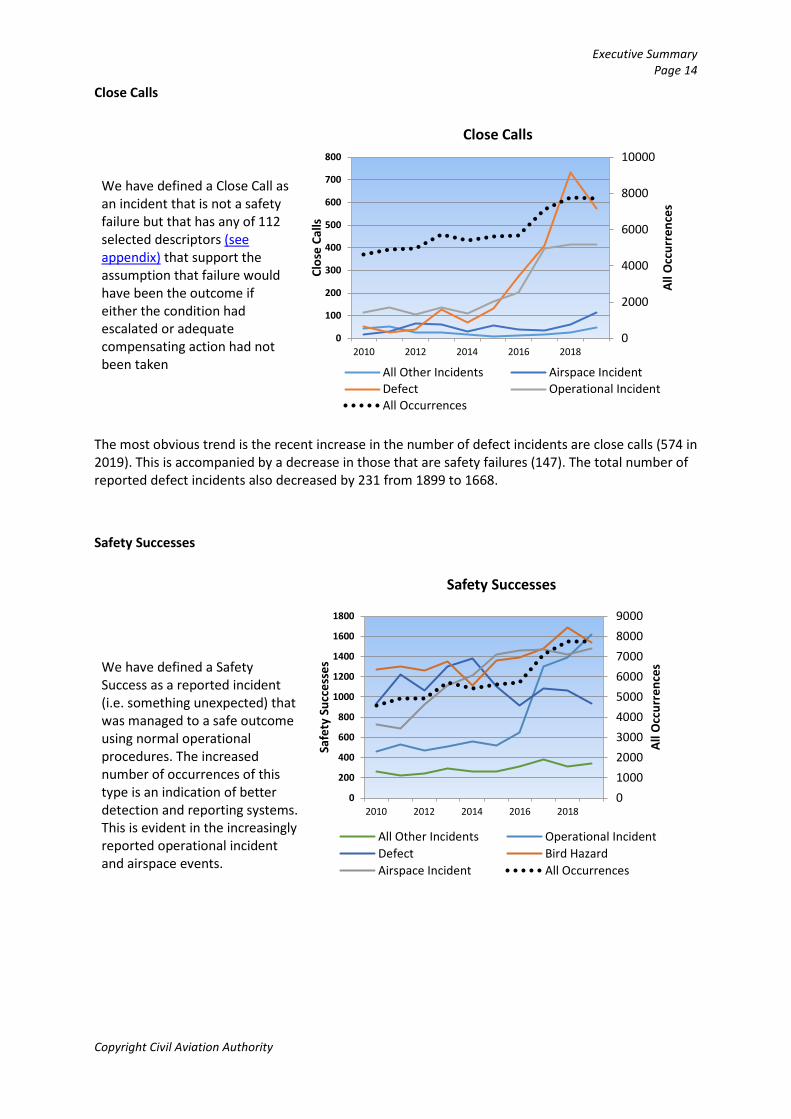
Close Calls
We have defined a Close Call as an incident that is not a safety failure but that has any of 112 selected descriptors (see appendix) that support the assumption that failure would have been the outcome if either the condition had escalated or adequate compensating action had not been taken
The most obvious trend is the recent increase in the number of defect incidents are close calls (574 in 2019). This is accompanied by a decrease in those that are safety failures (147). The total number of reported defect incidents also decreased by 231 from 1899 to 1668.
Safety Successes
We have defined a Safety Success as a reported incident (i.e. something unexpected) that was managed to a safe outcome using normal operational procedures. The increased number of occurrences of this type is an indication of better detection and reporting systems. This is evident in the increasingly reported operational incident and airspace events.
0
2000
4000
6000
8000
10000
0
100
200
300
400
500
600
700
800
2010 2012 2014 2016 2018
All O
ccur
renc
es
Clos
e Ca
lls
Close Calls
All Other Incidents Airspace IncidentDefect Operational IncidentAll Occurrences
0100020003000400050006000700080009000
0
200
400
600
800
1000
1200
1400
1600
1800
2010 2012 2014 2016 2018
All O
ccur
renc
es
Safe
ty S
ucce
sses
Safety Successes
All Other Incidents Operational IncidentDefect Bird HazardAirspace Incident All Occurrences
Executive Summary Page 15
Published 24 December 2019
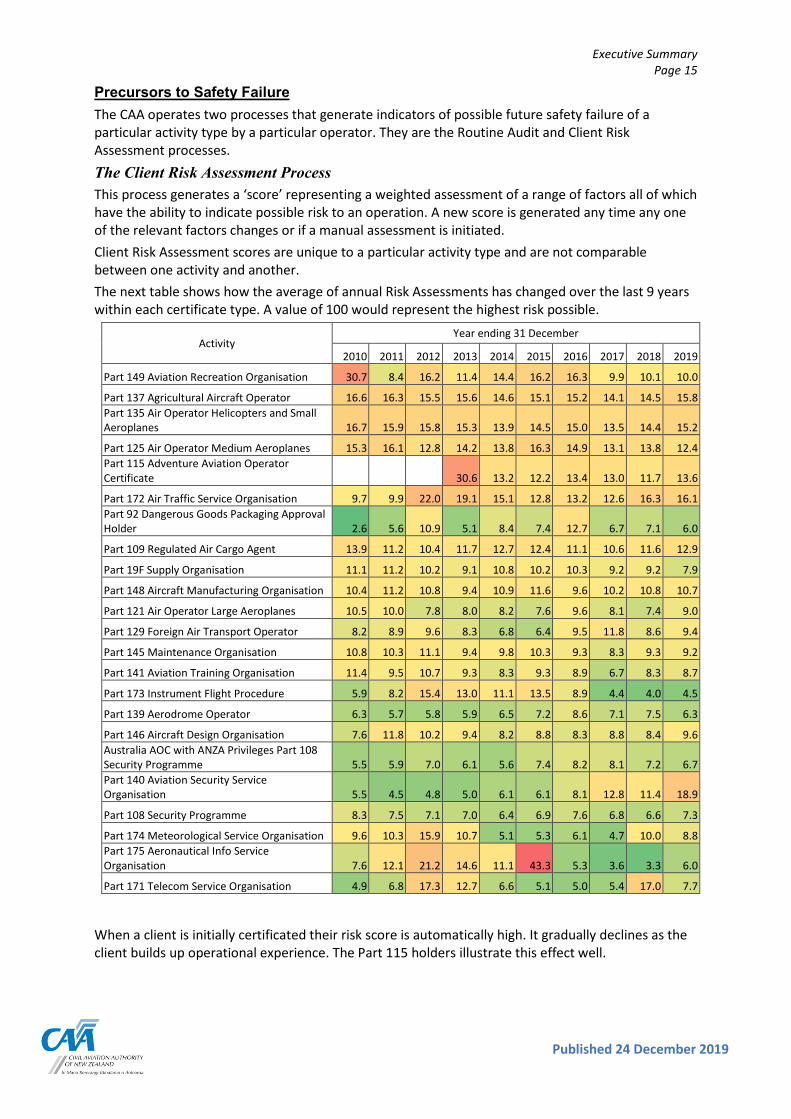
Precursors to Safety Failure The CAA operates two processes that generate indicators of possible future safety failure of a particular activity type by a particular operator. They are the Routine Audit and Client Risk Assessment processes. The Client Risk Assessment Process This process generates a ‘score’ representing a weighted assessment of a range of factors all of which have the ability to indicate possible risk to an operation. A new score is generated any time any one of the relevant factors changes or if a manual assessment is initiated. Client Risk Assessment scores are unique to a particular activity type and are not comparable between one activity and another. The next table shows how the average of annual Risk Assessments has changed over the last 9 years within each certificate type. A value of 100 would represent the highest risk possible.
Activity Year ending 31 December
2010 2011 2012 2013 2014 2015 2016 2017 2018 2019
Part 149 Aviation Recreation Organisation 30.7 8.4 16.2 11.4 14.4 16.2 16.3 9.9 10.1 10.0
Part 137 Agricultural Aircraft Operator 16.6 16.3 15.5 15.6 14.6 15.1 15.2 14.1 14.5 15.8 Part 135 Air Operator Helicopters and Small Aeroplanes 16.7 15.9 15.8 15.3 13.9 14.5 15.0 13.5 14.4 15.2
Part 125 Air Operator Medium Aeroplanes 15.3 16.1 12.8 14.2 13.8 16.3 14.9 13.1 13.8 12.4 Part 115 Adventure Aviation Operator Certificate 30.6 13.2 12.2 13.4 13.0 11.7 13.6
Part 172 Air Traffic Service Organisation 9.7 9.9 22.0 19.1 15.1 12.8 13.2 12.6 16.3 16.1 Part 92 Dangerous Goods Packaging Approval Holder 2.6 5.6 10.9 5.1 8.4 7.4 12.7 6.7 7.1 6.0
Part 109 Regulated Air Cargo Agent 13.9 11.2 10.4 11.7 12.7 12.4 11.1 10.6 11.6 12.9
Part 19F Supply Organisation 11.1 11.2 10.2 9.1 10.8 10.2 10.3 9.2 9.2 7.9
Part 148 Aircraft Manufacturing Organisation 10.4 11.2 10.8 9.4 10.9 11.6 9.6 10.2 10.8 10.7
Part 121 Air Operator Large Aeroplanes 10.5 10.0 7.8 8.0 8.2 7.6 9.6 8.1 7.4 9.0
Part 129 Foreign Air Transport Operator 8.2 8.9 9.6 8.3 6.8 6.4 9.5 11.8 8.6 9.4
Part 145 Maintenance Organisation 10.8 10.3 11.1 9.4 9.8 10.3 9.3 8.3 9.3 9.2
Part 141 Aviation Training Organisation 11.4 9.5 10.7 9.3 8.3 9.3 8.9 6.7 8.3 8.7
Part 173 Instrument Flight Procedure 5.9 8.2 15.4 13.0 11.1 13.5 8.9 4.4 4.0 4.5
Part 139 Aerodrome Operator 6.3 5.7 5.8 5.9 6.5 7.2 8.6 7.1 7.5 6.3
Part 146 Aircraft Design Organisation 7.6 11.8 10.2 9.4 8.2 8.8 8.3 8.8 8.4 9.6 Australia AOC with ANZA Privileges Part 108 Security Programme 5.5 5.9 7.0 6.1 5.6 7.4 8.2 8.1 7.2 6.7 Part 140 Aviation Security Service Organisation 5.5 4.5 4.8 5.0 6.1 6.1 8.1 12.8 11.4 18.9
Part 108 Security Programme 8.3 7.5 7.1 7.0 6.4 6.9 7.6 6.8 6.6 7.3
Part 174 Meteorological Service Organisation 9.6 10.3 15.9 10.7 5.1 5.3 6.1 4.7 10.0 8.8 Part 175 Aeronautical Info Service Organisation 7.6 12.1 21.2 14.6 11.1 43.3 5.3 3.6 3.3 6.0
Part 171 Telecom Service Organisation 4.9 6.8 17.3 12.7 6.6 5.1 5.0 5.4 17.0 7.7
When a client is initially certificated their risk score is automatically high. It gradually declines as the client builds up operational experience. The Part 115 holders illustrate this effect well.
Executive Summary Page 16
Copyright Civil Aviation Authority
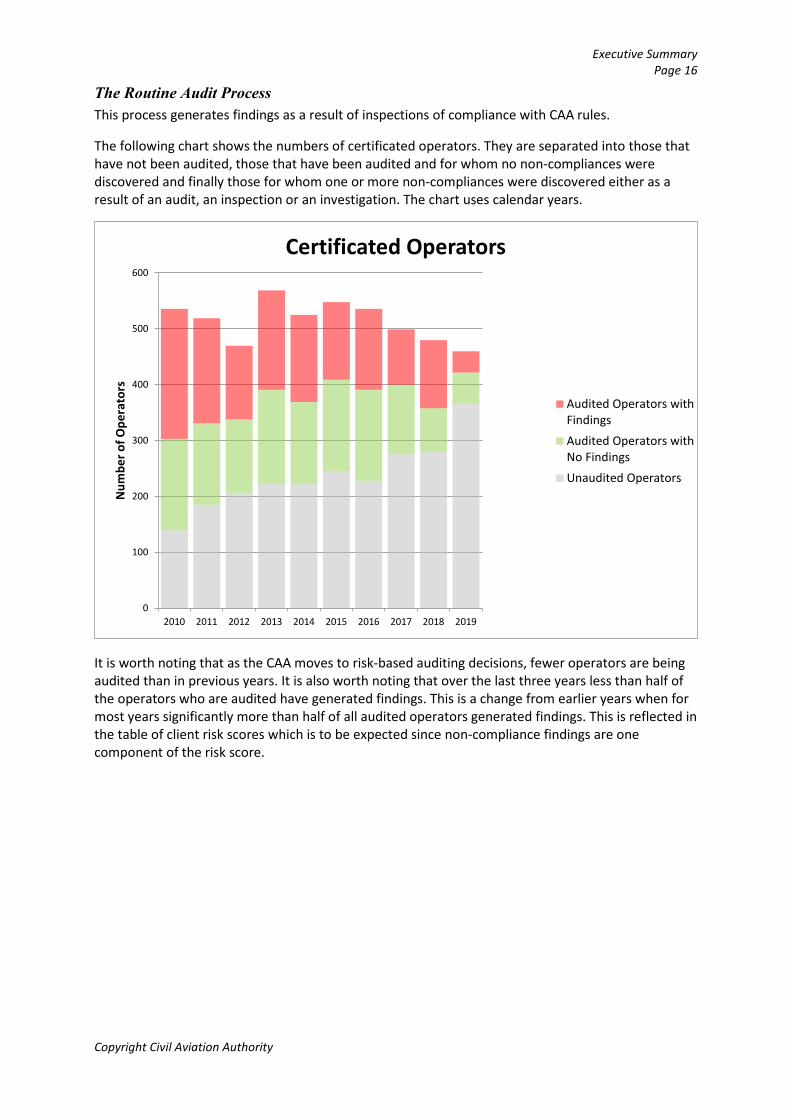
The Routine Audit Process This process generates findings as a result of inspections of compliance with CAA rules.
The following chart shows the numbers of certificated operators. They are separated into those that have not been audited, those that have been audited and for whom no non-compliances were discovered and finally those for whom one or more non-compliances were discovered either as a result of an audit, an inspection or an investigation. The chart uses calendar years.
It is worth noting that as the CAA moves to risk-based auditing decisions, fewer operators are being audited than in previous years. It is also worth noting that over the last three years less than half of the operators who are audited have generated findings. This is a change from earlier years when for most years significantly more than half of all audited operators generated findings. This is reflected in the table of client risk scores which is to be expected since non-compliance findings are one component of the risk score.
0
100
200
300
400
500
600
2010 2011 2012 2013 2014 2015 2016 2017 2018 2019
Num
ber o
f Ope
rato
rs
Certificated Operators
Audited Operators withFindingsAudited Operators withNo FindingsUnaudited Operators
Occurrence Analysis Page 17
Published 24 December 2019
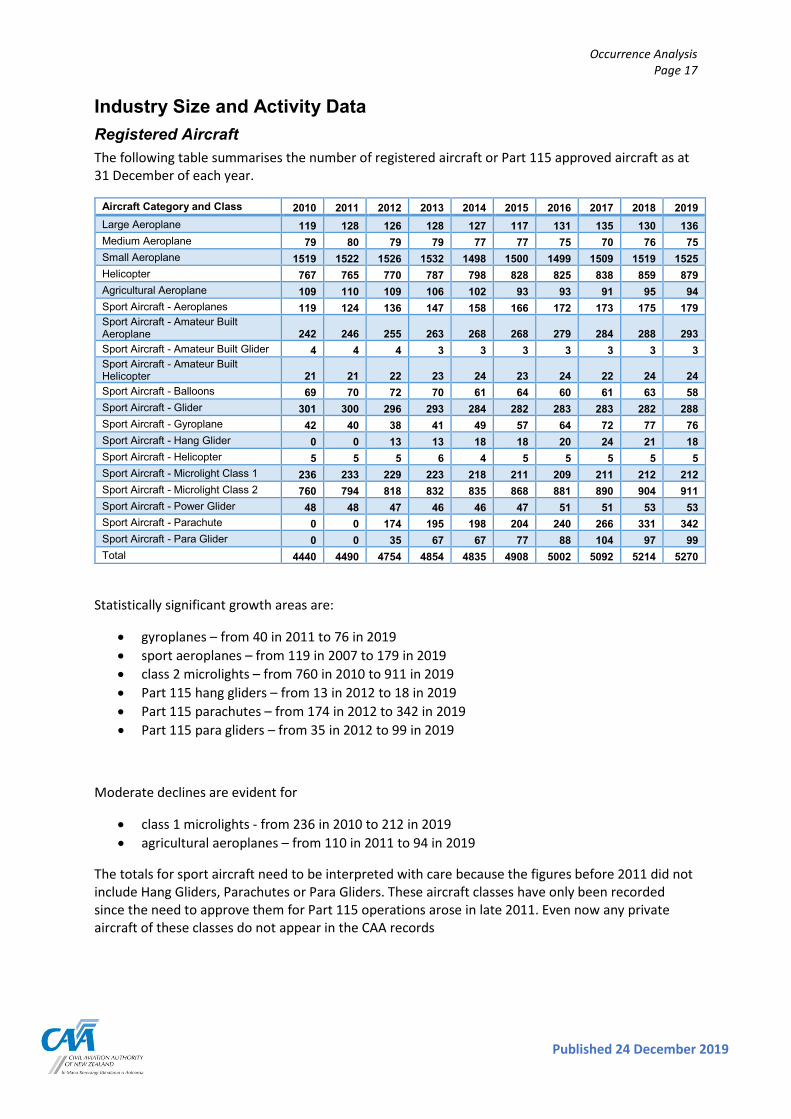
Industry Size and Activity Data Registered Aircraft The following table summarises the number of registered aircraft or Part 115 approved aircraft as at 31 December of each year.
Aircraft Category and Class 2010 2011 2012 2013 2014 2015 2016 2017 2018 2019 Large Aeroplane 119 128 126 128 127 117 131 135 130 136 Medium Aeroplane 79 80 79 79 77 77 75 70 76 75 Small Aeroplane 1519 1522 1526 1532 1498 1500 1499 1509 1519 1525 Helicopter 767 765 770 787 798 828 825 838 859 879 Agricultural Aeroplane 109 110 109 106 102 93 93 91 95 94 Sport Aircraft - Aeroplanes 119 124 136 147 158 166 172 173 175 179 Sport Aircraft - Amateur Built Aeroplane 242 246 255 263 268 268 279 284 288 293 Sport Aircraft - Amateur Built Glider 4 4 4 3 3 3 3 3 3 3 Sport Aircraft - Amateur Built Helicopter 21 21 22 23 24 23 24 22 24 24 Sport Aircraft - Balloons 69 70 72 70 61 64 60 61 63 58 Sport Aircraft - Glider 301 300 296 293 284 282 283 283 282 288 Sport Aircraft - Gyroplane 42 40 38 41 49 57 64 72 77 76 Sport Aircraft - Hang Glider 0 0 13 13 18 18 20 24 21 18 Sport Aircraft - Helicopter 5 5 5 6 4 5 5 5 5 5 Sport Aircraft - Microlight Class 1 236 233 229 223 218 211 209 211 212 212 Sport Aircraft - Microlight Class 2 760 794 818 832 835 868 881 890 904 911 Sport Aircraft - Power Glider 48 48 47 46 46 47 51 51 53 53 Sport Aircraft - Parachute 0 0 174 195 198 204 240 266 331 342 Sport Aircraft - Para Glider 0 0 35 67 67 77 88 104 97 99 Total 4440 4490 4754 4854 4835 4908 5002 5092 5214 5270
Statistically significant growth areas are:
• gyroplanes – from 40 in 2011 to 76 in 2019 • sport aeroplanes – from 119 in 2007 to 179 in 2019 • class 2 microlights – from 760 in 2010 to 911 in 2019 • Part 115 hang gliders – from 13 in 2012 to 18 in 2019 • Part 115 parachutes – from 174 in 2012 to 342 in 2019 • Part 115 para gliders – from 35 in 2012 to 99 in 2019
Moderate declines are evident for
• class 1 microlights - from 236 in 2010 to 212 in 2019 • agricultural aeroplanes – from 110 in 2011 to 94 in 2019
The totals for sport aircraft need to be interpreted with care because the figures before 2011 did not include Hang Gliders, Parachutes or Para Gliders. These aircraft classes have only been recorded since the need to approve them for Part 115 operations arose in late 2011. Even now any private aircraft of these classes do not appear in the CAA records
Occurrence Analysis Page 18
Copyright Civil Aviation Authority
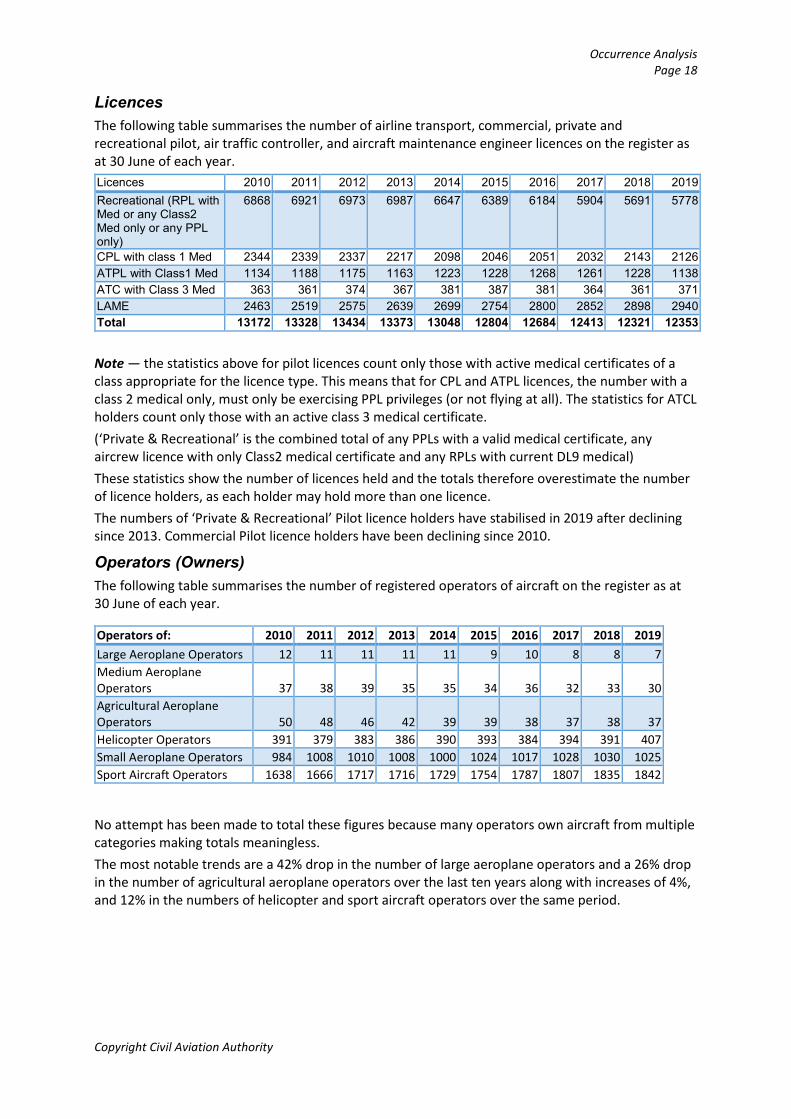
Licences The following table summarises the number of airline transport, commercial, private and recreational pilot, air traffic controller, and aircraft maintenance engineer licences on the register as at 30 June of each year. Licences 2010 2011 2012 2013 2014 2015 2016 2017 2018 2019 Recreational (RPL with Med or any Class2 Med only or any PPL only)
6868 6921 6973 6987 6647 6389 6184 5904 5691 5778
CPL with class 1 Med 2344 2339 2337 2217 2098 2046 2051 2032 2143 2126 ATPL with Class1 Med 1134 1188 1175 1163 1223 1228 1268 1261 1228 1138 ATC with Class 3 Med 363 361 374 367 381 387 381 364 361 371 LAME 2463 2519 2575 2639 2699 2754 2800 2852 2898 2940 Total 13172 13328 13434 13373 13048 12804 12684 12413 12321 12353 Note — the statistics above for pilot licences count only those with active medical certificates of a class appropriate for the licence type. This means that for CPL and ATPL licences, the number with a class 2 medical only, must only be exercising PPL privileges (or not flying at all). The statistics for ATCL holders count only those with an active class 3 medical certificate. (‘Private & Recreational’ is the combined total of any PPLs with a valid medical certificate, any aircrew licence with only Class2 medical certificate and any RPLs with current DL9 medical) These statistics show the number of licences held and the totals therefore overestimate the number of licence holders, as each holder may hold more than one licence. The numbers of ‘Private & Recreational’ Pilot licence holders have stabilised in 2019 after declining since 2013. Commercial Pilot licence holders have been declining since 2010.
Operators (Owners) The following table summarises the number of registered operators of aircraft on the register as at 30 June of each year.
Operators of: 2010 2011 2012 2013 2014 2015 2016 2017 2018 2019 Large Aeroplane Operators 12 11 11 11 11 9 10 8 8 7 Medium Aeroplane Operators 37 38 39 35 35 34 36 32 33 30 Agricultural Aeroplane Operators 50 48 46 42 39 39 38 37 38 37 Helicopter Operators 391 379 383 386 390 393 384 394 391 407 Small Aeroplane Operators 984 1008 1010 1008 1000 1024 1017 1028 1030 1025 Sport Aircraft Operators 1638 1666 1717 1716 1729 1754 1787 1807 1835 1842
No attempt has been made to total these figures because many operators own aircraft from multiple categories making totals meaningless. The most notable trends are a 42% drop in the number of large aeroplane operators and a 26% drop in the number of agricultural aeroplane operators over the last ten years along with increases of 4%, and 12% in the numbers of helicopter and sport aircraft operators over the same period.
Occurrence Analysis Page 19
Published 24 December 2019
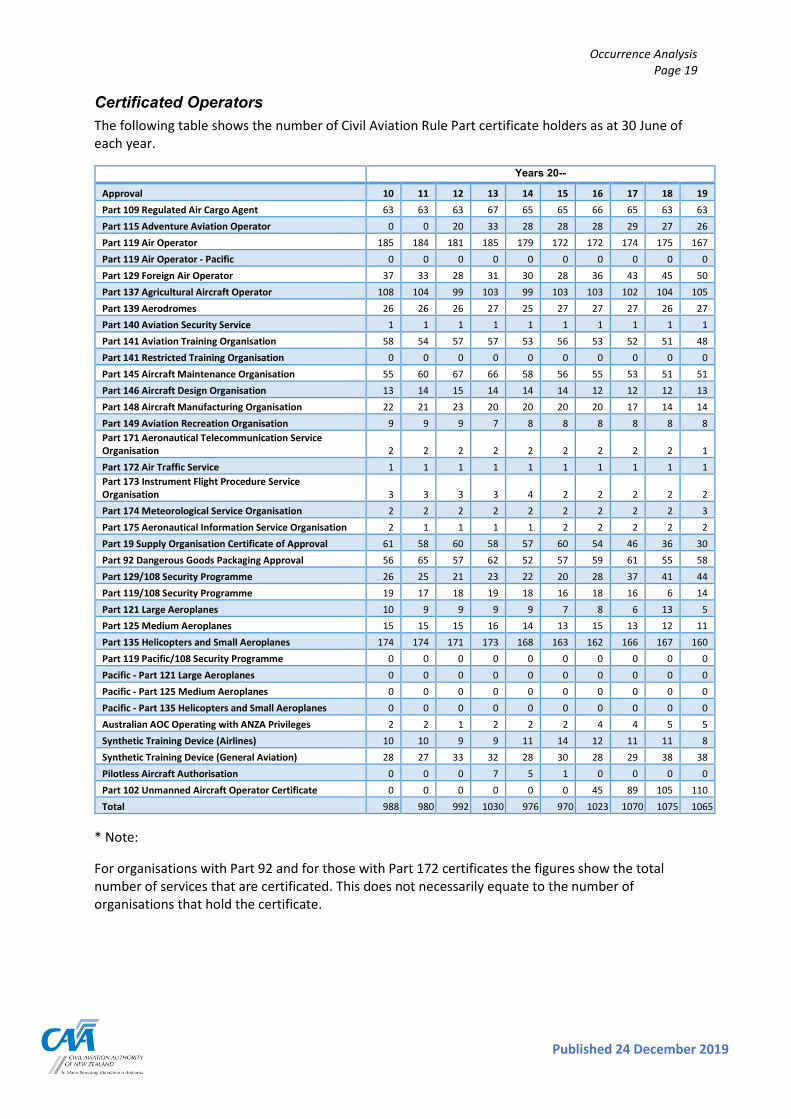
Certificated Operators The following table shows the number of Civil Aviation Rule Part certificate holders as at 30 June of each year.
Years 20--
Approval 10 11 12 13 14 15 16 17 18 19 Part 109 Regulated Air Cargo Agent 63 63 63 67 65 65 66 65 63 63 Part 115 Adventure Aviation Operator 0 0 20 33 28 28 28 29 27 26 Part 119 Air Operator 185 184 181 185 179 172 172 174 175 167 Part 119 Air Operator - Pacific 0 0 0 0 0 0 0 0 0 0 Part 129 Foreign Air Operator 37 33 28 31 30 28 36 43 45 50 Part 137 Agricultural Aircraft Operator 108 104 99 103 99 103 103 102 104 105 Part 139 Aerodromes 26 26 26 27 25 27 27 27 26 27 Part 140 Aviation Security Service 1 1 1 1 1 1 1 1 1 1 Part 141 Aviation Training Organisation 58 54 57 57 53 56 53 52 51 48 Part 141 Restricted Training Organisation 0 0 0 0 0 0 0 0 0 0 Part 145 Aircraft Maintenance Organisation 55 60 67 66 58 56 55 53 51 51 Part 146 Aircraft Design Organisation 13 14 15 14 14 14 12 12 12 13 Part 148 Aircraft Manufacturing Organisation 22 21 23 20 20 20 20 17 14 14 Part 149 Aviation Recreation Organisation 9 9 9 7 8 8 8 8 8 8 Part 171 Aeronautical Telecommunication Service Organisation 2 2 2 2 2 2 2 2 2 1 Part 172 Air Traffic Service 1 1 1 1 1 1 1 1 1 1 Part 173 Instrument Flight Procedure Service Organisation 3 3 3 3 4 2 2 2 2 2 Part 174 Meteorological Service Organisation 2 2 2 2 2 2 2 2 2 3 Part 175 Aeronautical Information Service Organisation 2 1 1 1 1 2 2 2 2 2 Part 19 Supply Organisation Certificate of Approval 61 58 60 58 57 60 54 46 36 30 Part 92 Dangerous Goods Packaging Approval 56 65 57 62 52 57 59 61 55 58 Part 129/108 Security Programme 26 25 21 23 22 20 28 37 41 44 Part 119/108 Security Programme 19 17 18 19 18 16 18 16 6 14 Part 121 Large Aeroplanes 10 9 9 9 9 7 8 6 13 5 Part 125 Medium Aeroplanes 15 15 15 16 14 13 15 13 12 11 Part 135 Helicopters and Small Aeroplanes 174 174 171 173 168 163 162 166 167 160 Part 119 Pacific/108 Security Programme 0 0 0 0 0 0 0 0 0 0 Pacific - Part 121 Large Aeroplanes 0 0 0 0 0 0 0 0 0 0 Pacific - Part 125 Medium Aeroplanes 0 0 0 0 0 0 0 0 0 0 Pacific - Part 135 Helicopters and Small Aeroplanes 0 0 0 0 0 0 0 0 0 0 Australian AOC Operating with ANZA Privileges 2 2 1 2 2 2 4 4 5 5 Synthetic Training Device (Airlines) 10 10 9 9 11 14 12 11 11 8 Synthetic Training Device (General Aviation) 28 27 33 32 28 30 28 29 38 38 Pilotless Aircraft Authorisation 0 0 0 7 5 1 0 0 0 0 Part 102 Unmanned Aircraft Operator Certificate 0 0 0 0 0 0 45 89 105 110 Total 988 980 992 1030 976 970 1023 1070 1075 1065
* Note:
For organisations with Part 92 and for those with Part 172 certificates the figures show the total number of services that are certificated. This does not necessarily equate to the number of organisations that hold the certificate.
Occurrence Analysis Page 20
Copyright Civil Aviation Authority
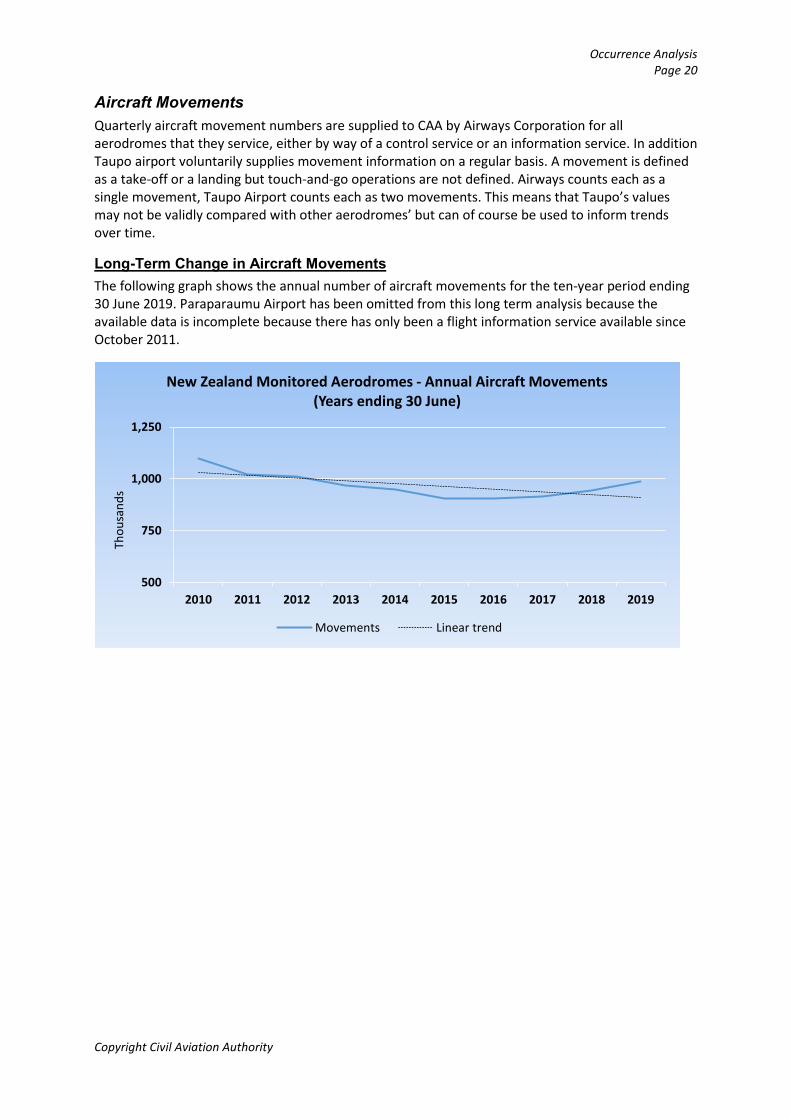
Aircraft Movements Quarterly aircraft movement numbers are supplied to CAA by Airways Corporation for all aerodromes that they service, either by way of a control service or an information service. In addition Taupo airport voluntarily supplies movement information on a regular basis. A movement is defined as a take-off or a landing but touch-and-go operations are not defined. Airways counts each as a single movement, Taupo Airport counts each as two movements. This means that Taupo’s values may not be validly compared with other aerodromes’ but can of course be used to inform trends over time.
Long-Term Change in Aircraft Movements The following graph shows the annual number of aircraft movements for the ten-year period ending 30 June 2019. Paraparaumu Airport has been omitted from this long term analysis because the available data is incomplete because there has only been a flight information service available since October 2011.
500
750
1,000
1,250
2010 2011 2012 2013 2014 2015 2016 2017 2018 2019
Thou
sand
s
New Zealand Monitored Aerodromes - Annual Aircraft Movements (Years ending 30 June)
Movements Linear trend
Occurrence Analysis Page 21
Published 24 December 2019
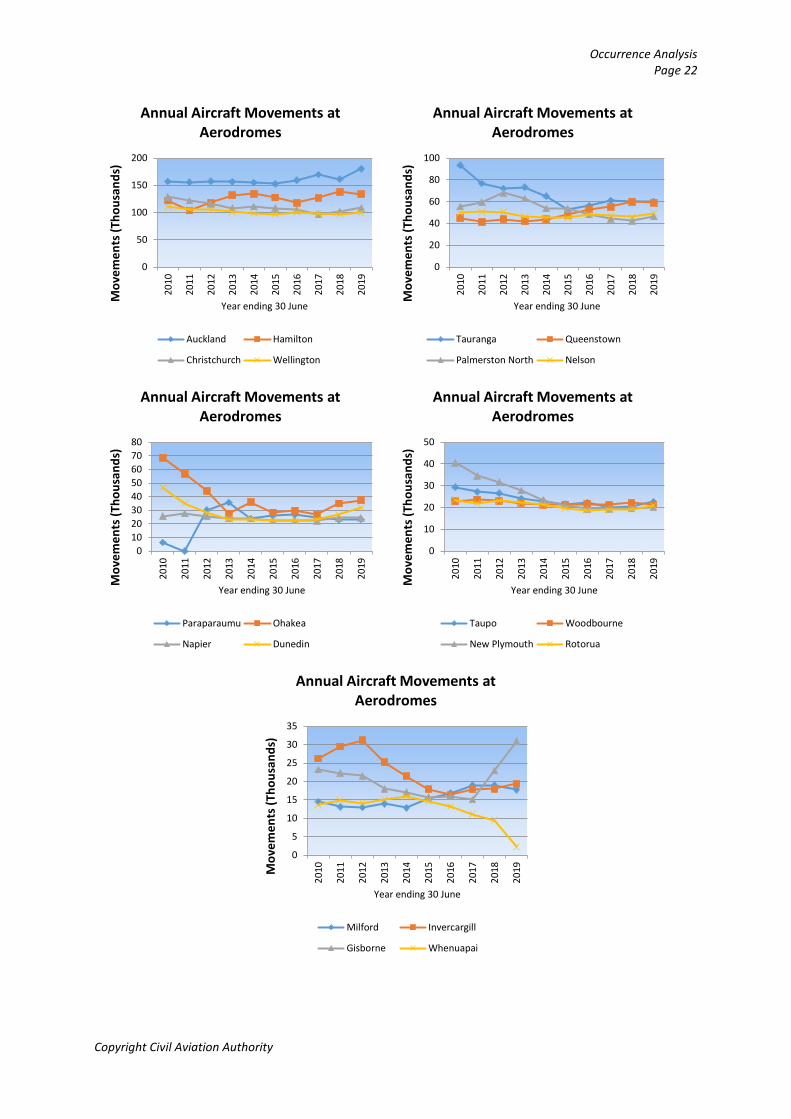
Breakdown by Aerodrome
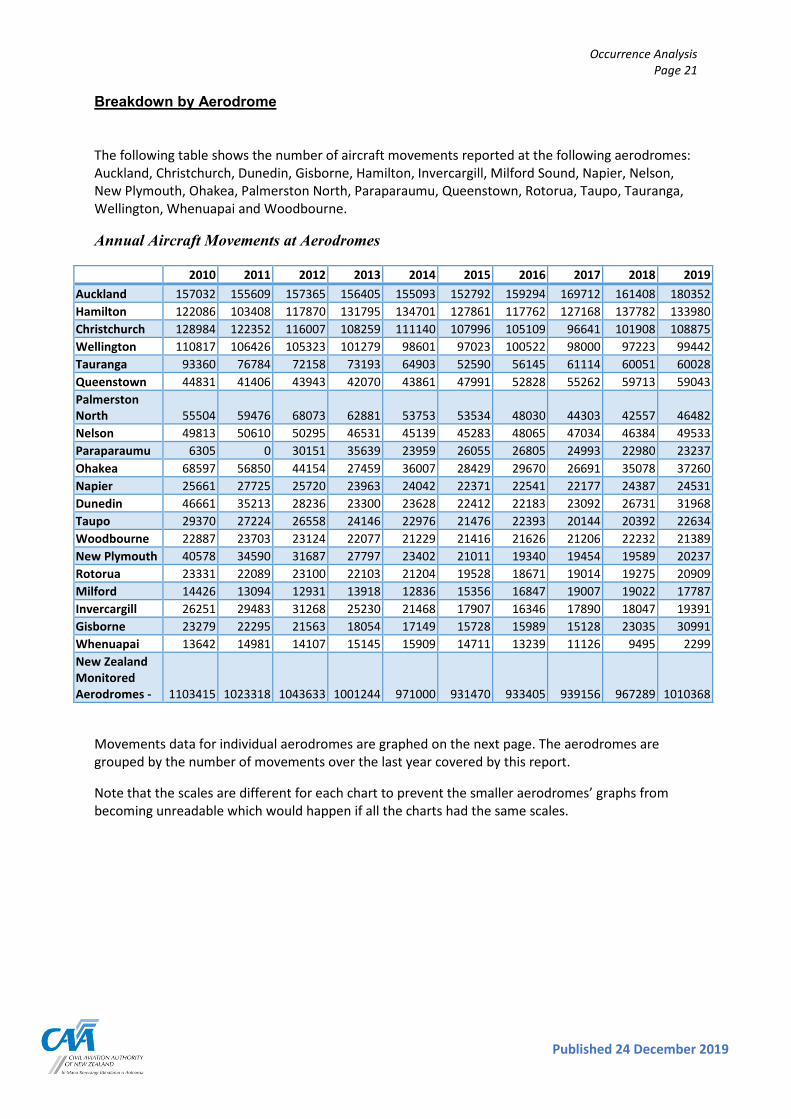
The following table shows the number of aircraft movements reported at the following aerodromes: Auckland, Christchurch, Dunedin, Gisborne, Hamilton, Invercargill, Milford Sound, Napier, Nelson, New Plymouth, Ohakea, Palmerston North, Paraparaumu, Queenstown, Rotorua, Taupo, Tauranga, Wellington, Whenuapai and Woodbourne.
Annual Aircraft Movements at Aerodromes
2010 2011 2012 2013 2014 2015 2016 2017 2018 2019 Auckland 157032 155609 157365 156405 155093 152792 159294 169712 161408 180352 Hamilton 122086 103408 117870 131795 134701 127861 117762 127168 137782 133980 Christchurch 128984 122352 116007 108259 111140 107996 105109 96641 101908 108875 Wellington 110817 106426 105323 101279 98601 97023 100522 98000 97223 99442 Tauranga 93360 76784 72158 73193 64903 52590 56145 61114 60051 60028 Queenstown 44831 41406 43943 42070 43861 47991 52828 55262 59713 59043 Palmerston North 55504 59476 68073 62881 53753 53534 48030 44303 42557 46482 Nelson 49813 50610 50295 46531 45139 45283 48065 47034 46384 49533 Paraparaumu 6305 0 30151 35639 23959 26055 26805 24993 22980 23237 Ohakea 68597 56850 44154 27459 36007 28429 29670 26691 35078 37260 Napier 25661 27725 25720 23963 24042 22371 22541 22177 24387 24531 Dunedin 46661 35213 28236 23300 23628 22412 22183 23092 26731 31968 Taupo 29370 27224 26558 24146 22976 21476 22393 20144 20392 22634 Woodbourne 22887 23703 23124 22077 21229 21416 21626 21206 22232 21389 New Plymouth 40578 34590 31687 27797 23402 21011 19340 19454 19589 20237 Rotorua 23331 22089 23100 22103 21204 19528 18671 19014 19275 20909 Milford 14426 13094 12931 13918 12836 15356 16847 19007 19022 17787 Invercargill 26251 29483 31268 25230 21468 17907 16346 17890 18047 19391 Gisborne 23279 22295 21563 18054 17149 15728 15989 15128 23035 30991 Whenuapai 13642 14981 14107 15145 15909 14711 13239 11126 9495 2299 New Zealand Monitored Aerodromes - 1103415 1023318 1043633 1001244 971000 931470 933405 939156 967289 1010368
Movements data for individual aerodromes are graphed on the next page. The aerodromes are grouped by the number of movements over the last year covered by this report.
Note that the scales are different for each chart to prevent the smaller aerodromes’ graphs from becoming unreadable which would happen if all the charts had the same scales.
Occurrence Analysis Page 22
Copyright Civil Aviation Authority
0
50
100
150
20020
10
2011
2012
2013
2014
2015
2016
2017
2018
2019
Mov
emen
ts (T
hous
ands
)
Year ending 30 June
Annual Aircraft Movements at Aerodromes
Auckland Hamilton
Christchurch Wellington
0
20
40
60
80
100
2010
2011
2012
2013
2014
2015
2016
2017
2018
2019
Mov
emen
ts (T
hous
ands
)
Year ending 30 June
Annual Aircraft Movements at Aerodromes
Tauranga Queenstown
Palmerston North Nelson
01020304050607080
2010
2011
2012
2013
2014
2015
2016
2017
2018
2019
Mov
emen
ts (T
hous
ands
)
Year ending 30 June
Annual Aircraft Movements at Aerodromes
Paraparaumu Ohakea
Napier Dunedin
0
10
20
30
40
5020
10
2011
2012
2013
2014
2015
2016
2017
2018
2019
Mov
emen
ts (T
hous
ands
)
Year ending 30 June
Annual Aircraft Movements at Aerodromes
Taupo Woodbourne
New Plymouth Rotorua
0
5
10
15
20
25
30
35
2010
2011
2012
2013
2014
2015
2016
2017
2018
2019M
ovem
ents
(Tho
usan
ds)
Year ending 30 June
Annual Aircraft Movements at Aerodromes
Milford Invercargill
Gisborne Whenuapai
Occurrence Analysis Page 23
Published 24 December 2019
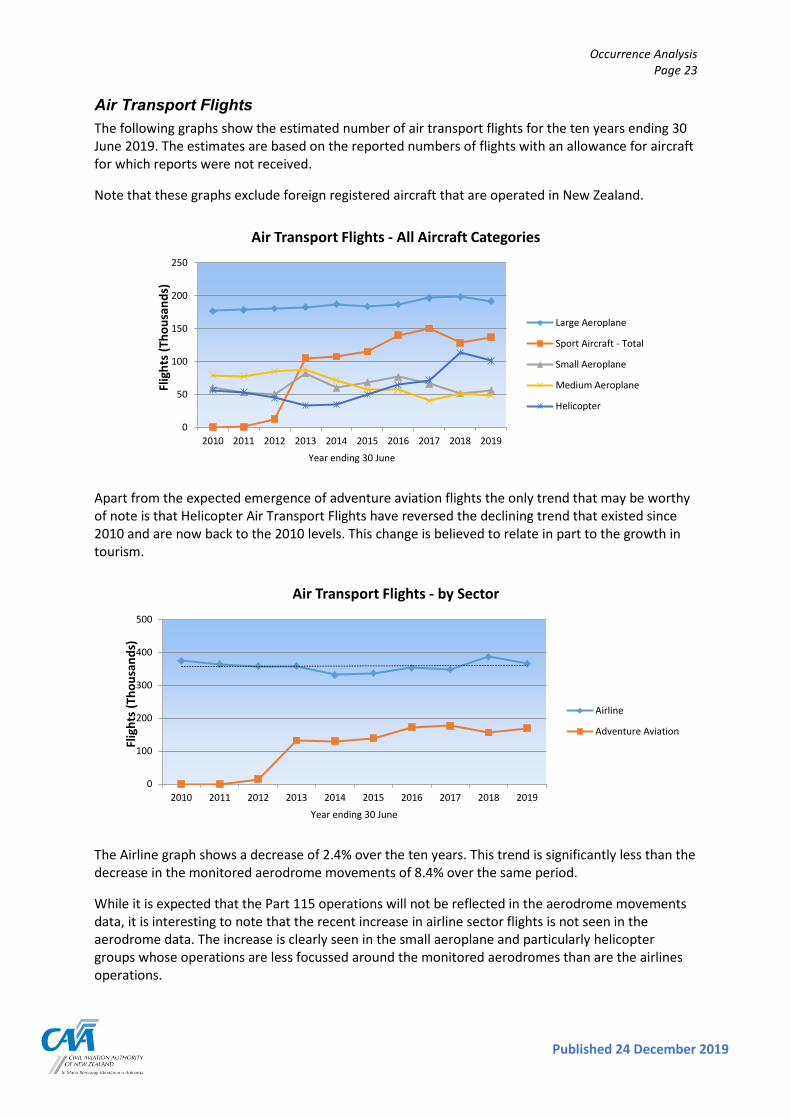
Air Transport Flights The following graphs show the estimated number of air transport flights for the ten years ending 30 June 2019. The estimates are based on the reported numbers of flights with an allowance for aircraft for which reports were not received.
Note that these graphs exclude foreign registered aircraft that are operated in New Zealand.
Apart from the expected emergence of adventure aviation flights the only trend that may be worthy of note is that Helicopter Air Transport Flights have reversed the declining trend that existed since 2010 and are now back to the 2010 levels. This change is believed to relate in part to the growth in tourism.
The Airline graph shows a decrease of 2.4% over the ten years. This trend is significantly less than the decrease in the monitored aerodrome movements of 8.4% over the same period.
While it is expected that the Part 115 operations will not be reflected in the aerodrome movements data, it is interesting to note that the recent increase in airline sector flights is not seen in the aerodrome data. The increase is clearly seen in the small aeroplane and particularly helicopter groups whose operations are less focussed around the monitored aerodromes than are the airlines operations.
0
50
100
150
200
250
2010 2011 2012 2013 2014 2015 2016 2017 2018 2019
Flig
hts
(Tho
usan
ds)
Year ending 30 June
Air Transport Flights - All Aircraft Categories
Large Aeroplane
Sport Aircraft - Total
Small Aeroplane
Medium Aeroplane
Helicopter
0
100
200
300
400
500
2010 2011 2012 2013 2014 2015 2016 2017 2018 2019
Flig
hts
(Tho
usan
ds)
Year ending 30 June
Air Transport Flights - by Sector
Airline
Adventure Aviation
Occurrence Analysis Page 24
Copyright Civil Aviation Authority
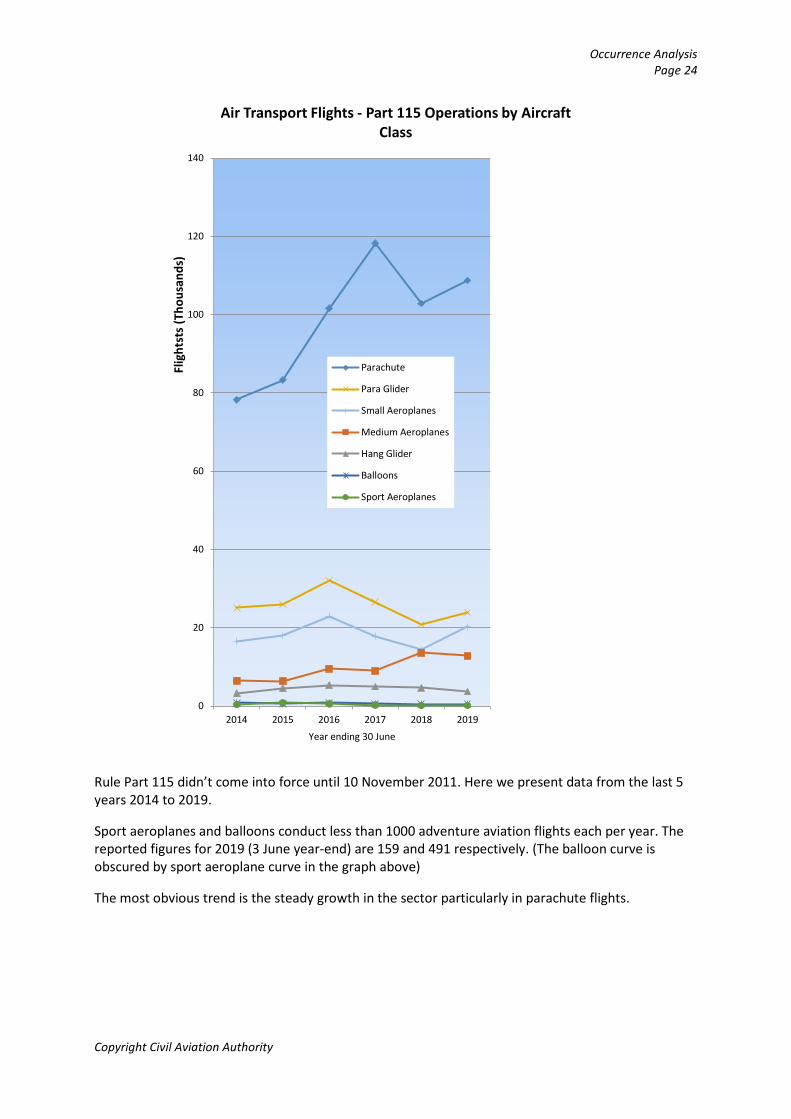
Rule Part 115 didn’t come into force until 10 November 2011. Here we present data from the last 5 years 2014 to 2019.
Sport aeroplanes and balloons conduct less than 1000 adventure aviation flights each per year. The reported figures for 2019 (3 June year-end) are 159 and 491 respectively. (The balloon curve is obscured by sport aeroplane curve in the graph above)
The most obvious trend is the steady growth in the sector particularly in parachute flights.
0
20
40
60
80
100
120
140
2014 2015 2016 2017 2018 2019
Flig
htst
s (T
hous
ands
)
Year ending 30 June
Air Transport Flights - Part 115 Operations by Aircraft Class
Parachute
Para Glider
Small Aeroplanes
Medium Aeroplanes
Hang Glider
Balloons
Sport Aeroplanes
Occurrence Analysis Page 25
Published 24 December 2019
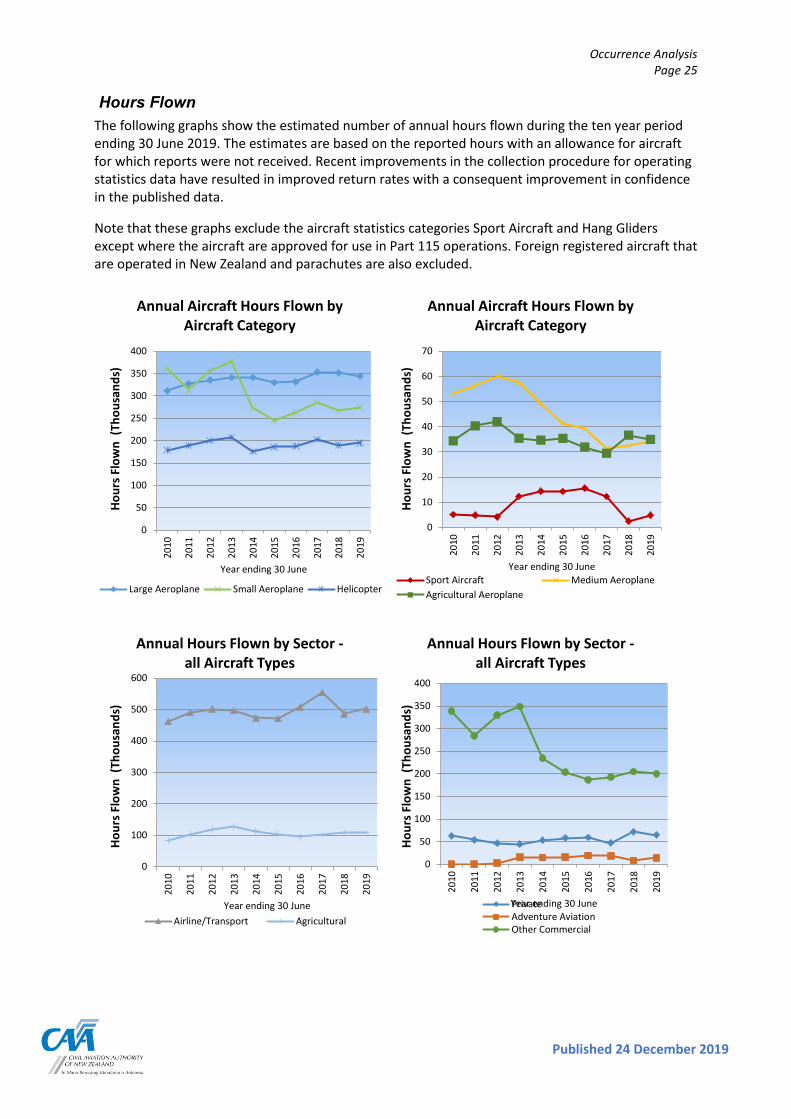
Hours Flown The following graphs show the estimated number of annual hours flown during the ten year period ending 30 June 2019. The estimates are based on the reported hours with an allowance for aircraft for which reports were not received. Recent improvements in the collection procedure for operating statistics data have resulted in improved return rates with a consequent improvement in confidence in the published data.
Note that these graphs exclude the aircraft statistics categories Sport Aircraft and Hang Gliders except where the aircraft are approved for use in Part 115 operations. Foreign registered aircraft that are operated in New Zealand and parachutes are also excluded.
0
50
100
150
200
250
300
350
400
2010
2011
2012
2013
2014
2015
2016
2017
2018
2019
Hour
s Flo
wn
(Tho
usan
ds)
Year ending 30 June
Annual Aircraft Hours Flown by Aircraft Category
Large Aeroplane Small Aeroplane Helicopter
0
10
20
30
40
50
60
70
2010
2011
2012
2013
2014
2015
2016
2017
2018
2019
Hour
s Flo
wn
(Tho
usan
ds)
Year ending 30 June
Annual Aircraft Hours Flown by Aircraft Category
Sport Aircraft Medium AeroplaneAgricultural Aeroplane
0
100
200
300
400
500
600
2010
2011
2012
2013
2014
2015
2016
2017
2018
2019
Hour
s Flo
wn
(Tho
usan
ds)
Year ending 30 June
Annual Hours Flown by Sector -all Aircraft Types
Airline/Transport Agricultural
0
50
100
150
200
250
300
350
400
2010
2011
2012
2013
2014
2015
2016
2017
2018
2019
Hour
s Flo
wn
(Tho
usan
ds)
Year ending 30 June
Annual Hours Flown by Sector -all Aircraft Types
PrivateAdventure AviationOther Commercial
Occurrence Analysis Page 26
Copyright Civil Aviation Authority
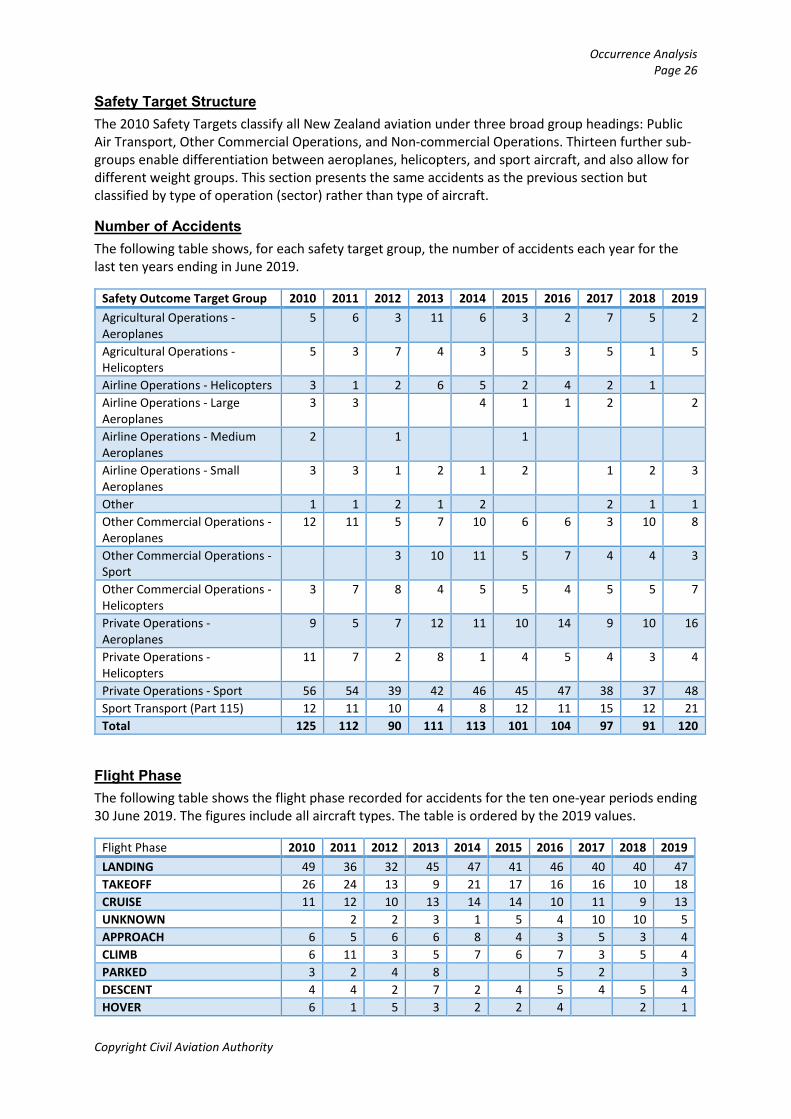
Safety Target Structure The 2010 Safety Targets classify all New Zealand aviation under three broad group headings: Public Air Transport, Other Commercial Operations, and Non-commercial Operations. Thirteen further sub-groups enable differentiation between aeroplanes, helicopters, and sport aircraft, and also allow for different weight groups. This section presents the same accidents as the previous section but classified by type of operation (sector) rather than type of aircraft.
Number of Accidents The following table shows, for each safety target group, the number of accidents each year for the last ten years ending in June 2019.
Safety Outcome Target Group 2010 2011 2012 2013 2014 2015 2016 2017 2018 2019 Agricultural Operations - Aeroplanes
5 6 3 11 6 3 2 7 5 2
Agricultural Operations - Helicopters
5 3 7 4 3 5 3 5 1 5
Airline Operations - Helicopters 3 1 2 6 5 2 4 2 1
Airline Operations - Large Aeroplanes
3 3 4 1 1 2
2
Airline Operations - Medium Aeroplanes
2
1
1
Airline Operations - Small Aeroplanes
3 3 1 2 1 2
1 2 3
Other 1 1 2 1 2 2 1 1 Other Commercial Operations - Aeroplanes
12 11 5 7 10 6 6 3 10 8
Other Commercial Operations - Sport
3 10 11 5 7 4 4 3
Other Commercial Operations -Helicopters
3 7 8 4 5 5 4 5 5 7
Private Operations - Aeroplanes
9 5 7 12 11 10 14 9 10 16
Private Operations - Helicopters
11 7 2 8 1 4 5 4 3 4
Private Operations - Sport 56 54 39 42 46 45 47 38 37 48 Sport Transport (Part 115) 12 11 10 4 8 12 11 15 12 21 Total 125 112 90 111 113 101 104 97 91 120
Flight Phase The following table shows the flight phase recorded for accidents for the ten one-year periods ending 30 June 2019. The figures include all aircraft types. The table is ordered by the 2019 values.
Flight Phase 2010 2011 2012 2013 2014 2015 2016 2017 2018 2019 LANDING 49 36 32 45 47 41 46 40 40 47 TAKEOFF 26 24 13 9 21 17 16 16 10 18 CRUISE 11 12 10 13 14 14 10 11 9 13 UNKNOWN 2 2 3 1 5 4 10 10 5 APPROACH 6 5 6 6 8 4 3 5 3 4 CLIMB 6 11 3 5 7 6 7 3 5 4 PARKED 3 2 4 8 5 2 3 DESCENT 4 4 2 7 2 4 5 4 5 4 HOVER 6 1 5 3 2 2 4 2 1
Occurrence Analysis Page 27
Published 24 December 2019
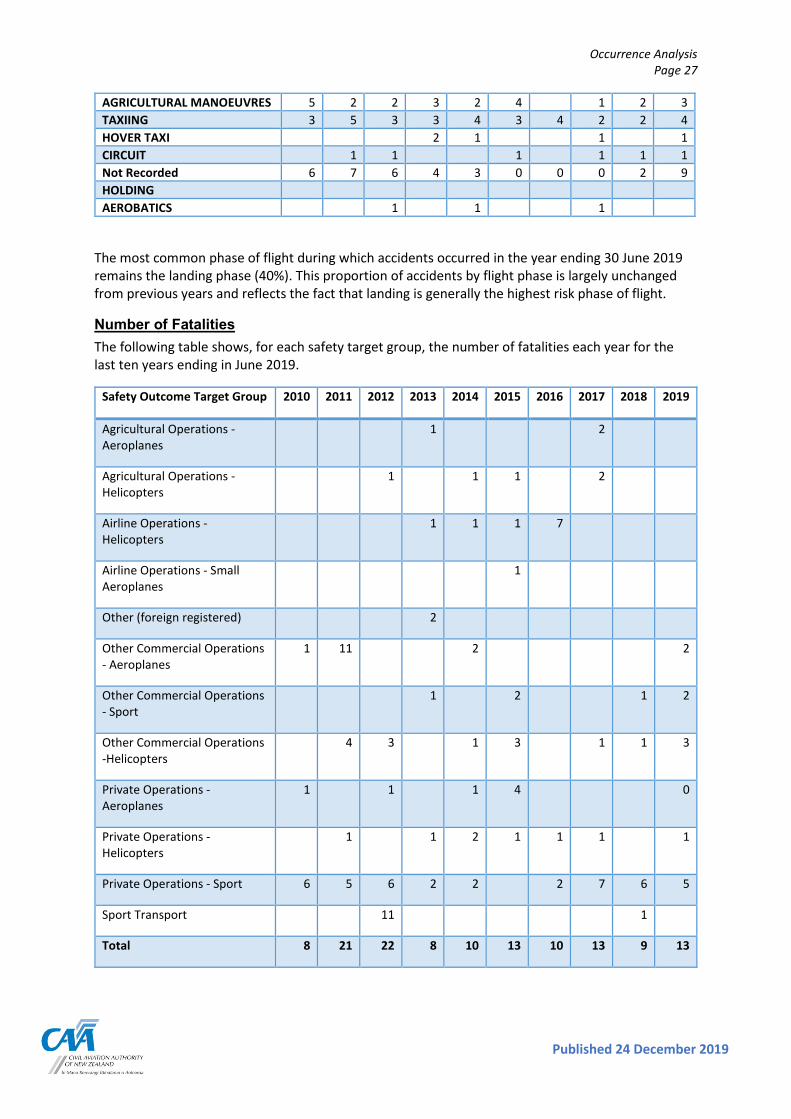
AGRICULTURAL MANOEUVRES 5 2 2 3 2 4 1 2 3 TAXIING 3 5 3 3 4 3 4 2 2 4 HOVER TAXI 2 1 1 1 CIRCUIT 1 1 1 1 1 1 Not Recorded 6 7 6 4 3 0 0 0 2 9 HOLDING AEROBATICS 1 1 1
The most common phase of flight during which accidents occurred in the year ending 30 June 2019 remains the landing phase (40%). This proportion of accidents by flight phase is largely unchanged from previous years and reflects the fact that landing is generally the highest risk phase of flight.
Number of Fatalities The following table shows, for each safety target group, the number of fatalities each year for the last ten years ending in June 2019.
Safety Outcome Target Group 2010 2011 2012 2013 2014 2015 2016 2017 2018 2019
Agricultural Operations - Aeroplanes
1 2
Agricultural Operations - Helicopters
1
1 1
2
Airline Operations - Helicopters
1 1 1 7
Airline Operations - Small Aeroplanes
1
Other (foreign registered) 2
Other Commercial Operations - Aeroplanes
1 11 2 2
Other Commercial Operations - Sport
1
2 1 2
Other Commercial Operations -Helicopters
4 3
1 3
1 1 3
Private Operations - Aeroplanes
1
1
1 4 0
Private Operations - Helicopters
1
1 2 1 1 1
1
Private Operations - Sport 6 5 6 2 2
2 7 6 5
Sport Transport 11 1
Total 8 21 22 8 10 13 10 13 9 13
Occurrence Analysis Page 28
Copyright Civil Aviation Authority
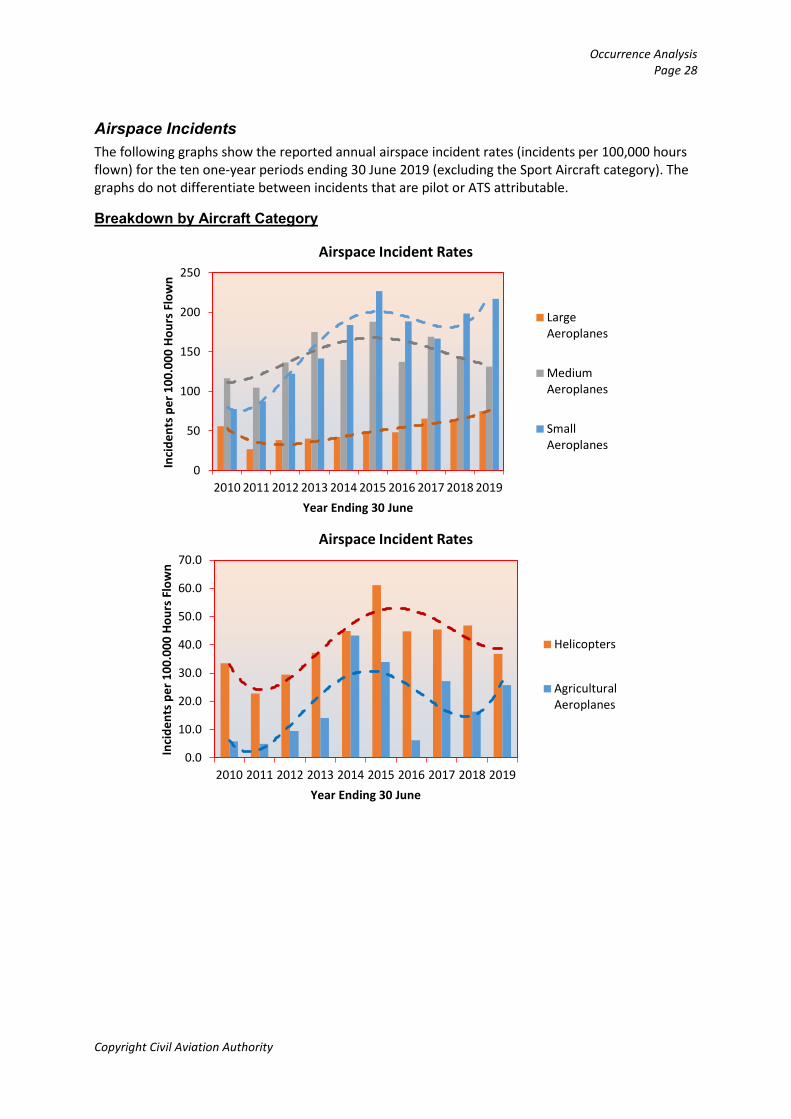
Airspace Incidents The following graphs show the reported annual airspace incident rates (incidents per 100,000 hours flown) for the ten one-year periods ending 30 June 2019 (excluding the Sport Aircraft category). The graphs do not differentiate between incidents that are pilot or ATS attributable.
Breakdown by Aircraft Category
0
50
100
150
200
250
2010 2011 2012 2013 2014 2015 2016 2017 2018 2019
Inci
dent
s per
100
.000
Hou
rs F
low
n
Year Ending 30 June
Airspace Incident Rates
LargeAeroplanes
MediumAeroplanes
SmallAeroplanes
0.0
10.0
20.0
30.0
40.0
50.0
60.0
70.0
2010 2011 2012 2013 2014 2015 2016 2017 2018 2019
Inci
dent
s per
100
.000
Hou
rs F
low
n
Year Ending 30 June
Airspace Incident Rates
Helicopters
AgriculturalAeroplanes
Occurrence Analysis Page 29
Published 24 December 2019
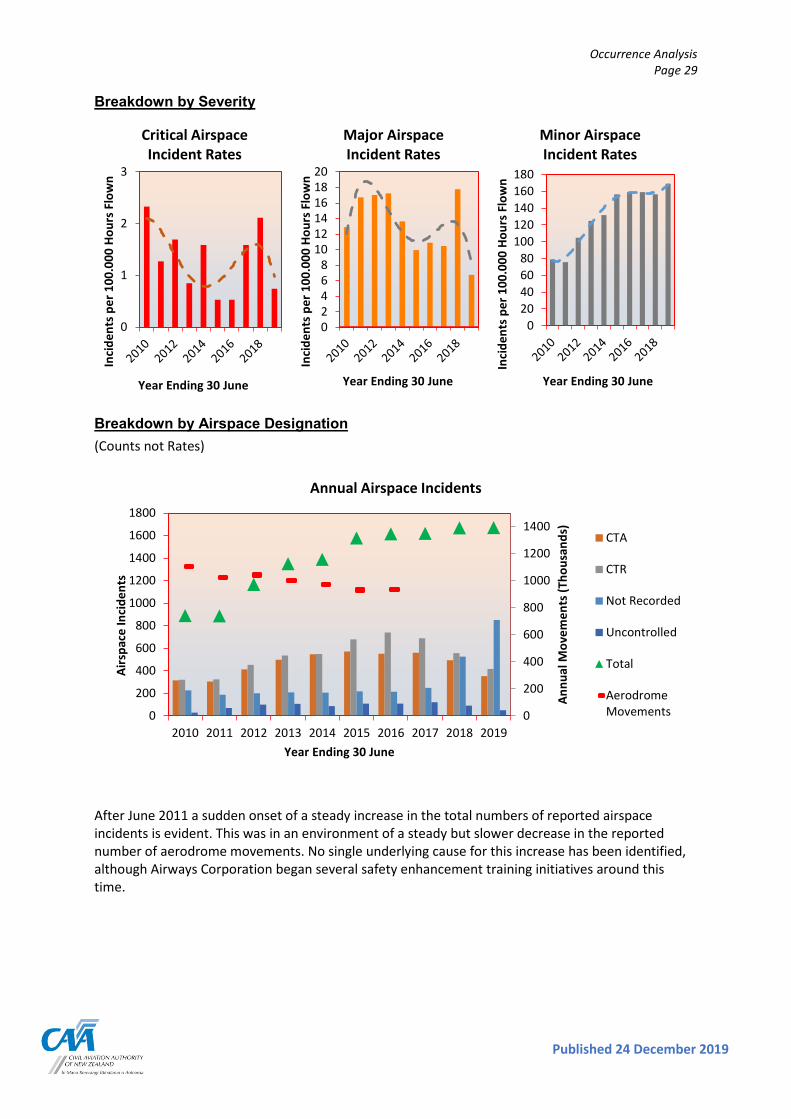
Breakdown by Severity
Breakdown by Airspace Designation (Counts not Rates)
After June 2011 a sudden onset of a steady increase in the total numbers of reported airspace incidents is evident. This was in an environment of a steady but slower decrease in the reported number of aerodrome movements. No single underlying cause for this increase has been identified, although Airways Corporation began several safety enhancement training initiatives around this time.
0
1
2
3
Inci
dent
s per
100
.000
Hou
rs F
low
n
Year Ending 30 June
Critical Airspace Incident Rates
02468
101214161820
Inci
dent
s per
100
.000
Hou
rs F
low
n
Year Ending 30 June
Major Airspace Incident Rates
020406080
100120140160180
Inci
dent
s per
100
.000
Hou
rs F
low
n
Year Ending 30 June
Minor Airspace Incident Rates
0
200
400
600
800
1000
1200
1400
0
200
400
600
800
1000
1200
1400
1600
1800
2010 2011 2012 2013 2014 2015 2016 2017 2018 2019
Annu
al M
ovem
ents
(Tho
usan
ds)
Airs
pace
Inci
dent
s
Year Ending 30 June
Annual Airspace Incidents
CTA
CTR
Not Recorded
Uncontrolled
Total
AerodromeMovements
Occurrence Analysis Page 30
Copyright Civil Aviation Authority
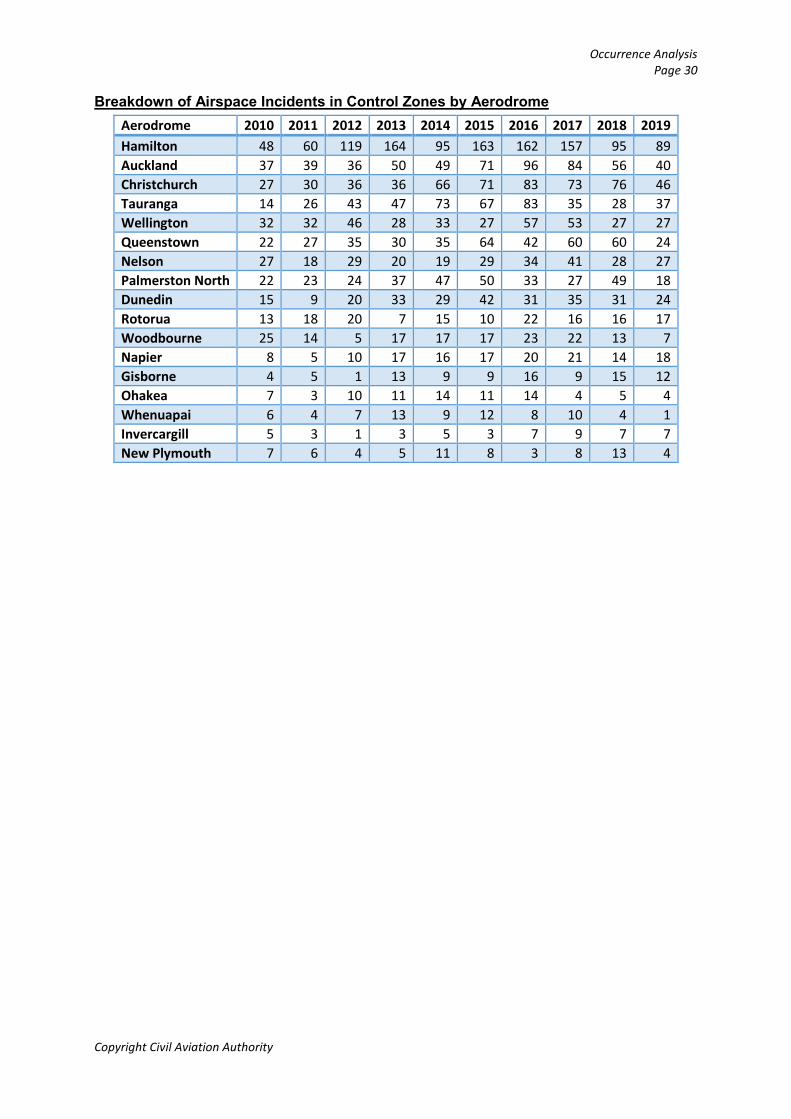
Breakdown of Airspace Incidents in Control Zones by Aerodrome Aerodrome 2010 2011 2012 2013 2014 2015 2016 2017 2018 2019 Hamilton 48 60 119 164 95 163 162 157 95 89 Auckland 37 39 36 50 49 71 96 84 56 40 Christchurch 27 30 36 36 66 71 83 73 76 46 Tauranga 14 26 43 47 73 67 83 35 28 37 Wellington 32 32 46 28 33 27 57 53 27 27 Queenstown 22 27 35 30 35 64 42 60 60 24 Nelson 27 18 29 20 19 29 34 41 28 27 Palmerston North 22 23 24 37 47 50 33 27 49 18 Dunedin 15 9 20 33 29 42 31 35 31 24 Rotorua 13 18 20 7 15 10 22 16 16 17 Woodbourne 25 14 5 17 17 17 23 22 13 7 Napier 8 5 10 17 16 17 20 21 14 18 Gisborne 4 5 1 13 9 9 16 9 15 12 Ohakea 7 3 10 11 14 11 14 4 5 4 Whenuapai 6 4 7 13 9 12 8 10 4 1 Invercargill 5 3 1 3 5 3 7 9 7 7 New Plymouth 7 6 4 5 11 8 3 8 13 4
Occurrence Analysis Page 31
Published 24 December 2019
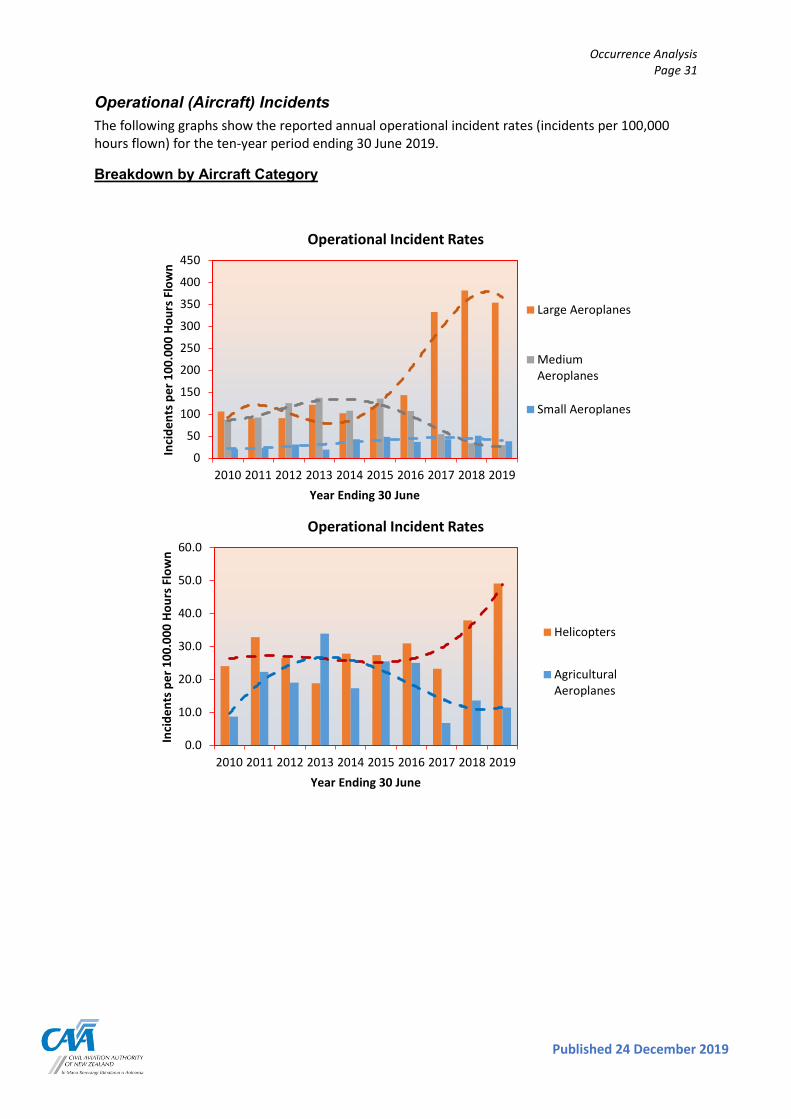
Operational (Aircraft) Incidents The following graphs show the reported annual operational incident rates (incidents per 100,000 hours flown) for the ten-year period ending 30 June 2019.
Breakdown by Aircraft Category
0
50
100
150
200
250
300
350
400
450
2010 2011 2012 2013 2014 2015 2016 2017 2018 2019
Inci
dent
s per
100
.000
Hou
rs F
low
n
Year Ending 30 June
Operational Incident Rates
Large Aeroplanes
MediumAeroplanes
Small Aeroplanes
0.0
10.0
20.0
30.0
40.0
50.0
60.0
2010 2011 2012 2013 2014 2015 2016 2017 2018 2019
Inci
dent
s per
100
.000
Hou
rs F
low
n
Year Ending 30 June
Operational Incident Rates
Helicopters
AgriculturalAeroplanes
Occurrence Analysis Page 32
Copyright Civil Aviation Authority
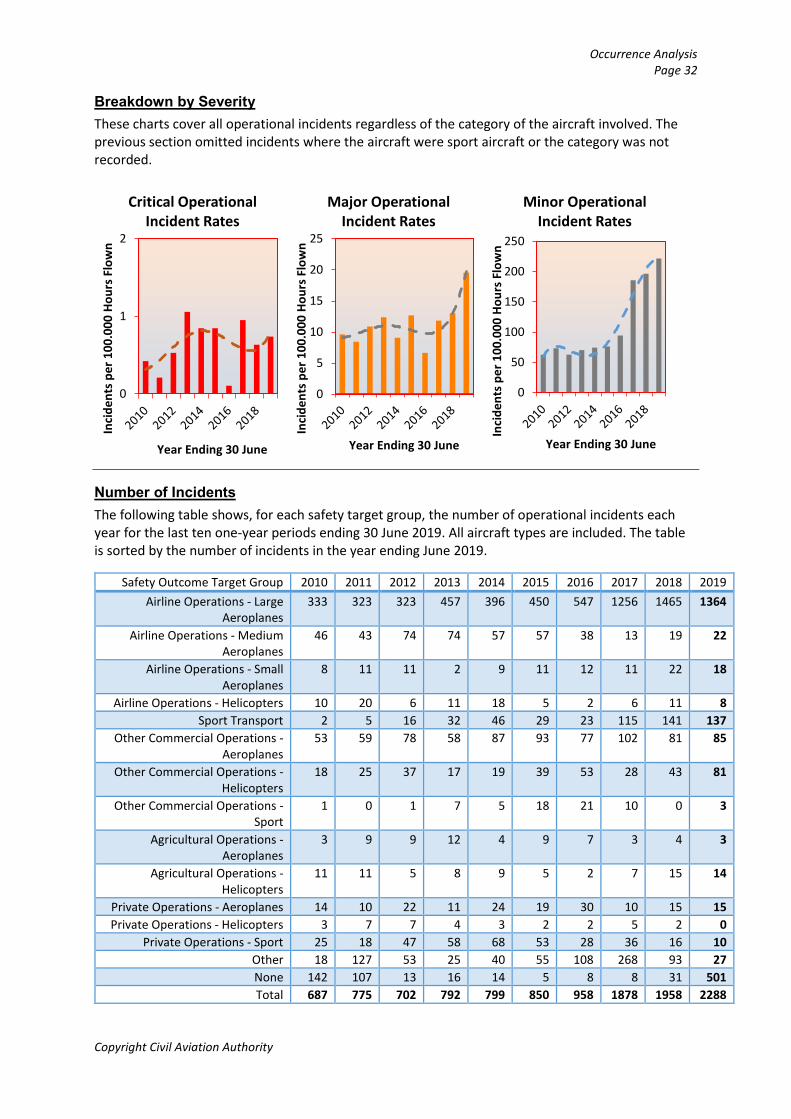
Breakdown by Severity These charts cover all operational incidents regardless of the category of the aircraft involved. The previous section omitted incidents where the aircraft were sport aircraft or the category was not recorded.
Number of Incidents The following table shows, for each safety target group, the number of operational incidents each year for the last ten one-year periods ending 30 June 2019. All aircraft types are included. The table is sorted by the number of incidents in the year ending June 2019.
Safety Outcome Target Group 2010 2011 2012 2013 2014 2015 2016 2017 2018 2019 Airline Operations - Large
Aeroplanes 333 323 323 457 396 450 547 1256 1465 1364
Airline Operations - Medium Aeroplanes
46 43 74 74 57 57 38 13 19 22
Airline Operations - Small Aeroplanes
8 11 11 2 9 11 12 11 22 18
Airline Operations - Helicopters 10 20 6 11 18 5 2 6 11 8 Sport Transport 2 5 16 32 46 29 23 115 141 137
Other Commercial Operations - Aeroplanes
53 59 78 58 87 93 77 102 81 85
Other Commercial Operations -Helicopters
18 25 37 17 19 39 53 28 43 81
Other Commercial Operations - Sport
1 0 1 7 5 18 21 10 0 3
Agricultural Operations - Aeroplanes
3 9 9 12 4 9 7 3 4 3
Agricultural Operations - Helicopters
11 11 5 8 9 5 2 7 15 14
Private Operations - Aeroplanes 14 10 22 11 24 19 30 10 15 15 Private Operations - Helicopters 3 7 7 4 3 2 2 5 2 0
Private Operations - Sport 25 18 47 58 68 53 28 36 16 10 Other 18 127 53 25 40 55 108 268 93 27 None 142 107 13 16 14 5 8 8 31 501 Total 687 775 702 792 799 850 958 1878 1958 2288
0
1
2
Inci
dent
s per
100
.000
Hou
rs F
low
n
Year Ending 30 June
Critical Operational Incident Rates
0
5
10
15
20
25
Inci
dent
s per
100
.000
Hou
rs F
low
n
Year Ending 30 June
Major Operational Incident Rates
0
50
100
150
200
250
Inci
dent
s per
100
.000
Hou
rs F
low
n
Year Ending 30 June
Minor Operational Incident Rates
Occurrence Analysis Page 33
Published 24 December 2019
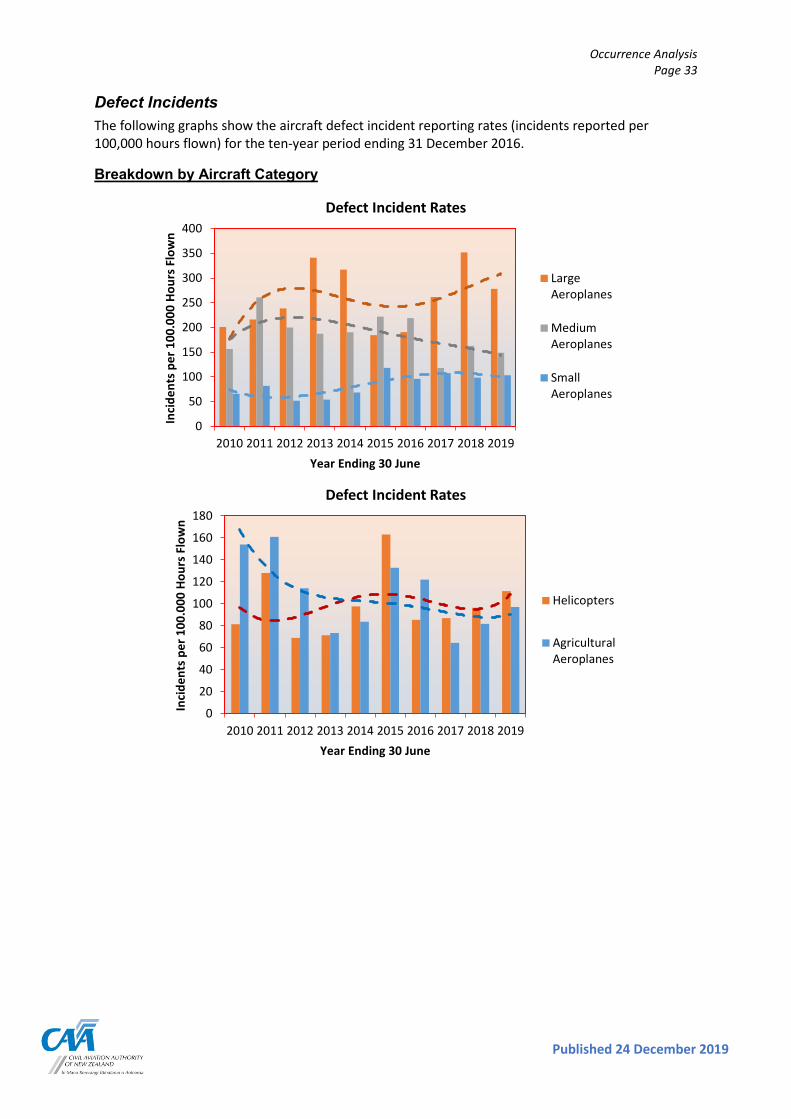
Defect Incidents The following graphs show the aircraft defect incident reporting rates (incidents reported per 100,000 hours flown) for the ten-year period ending 31 December 2016.
Breakdown by Aircraft Category
0
50
100
150
200
250
300
350
400
2010 2011 2012 2013 2014 2015 2016 2017 2018 2019
Inci
dent
s per
100
.000
Hou
rs F
low
n
Year Ending 30 June
Defect Incident Rates
LargeAeroplanes
MediumAeroplanes
SmallAeroplanes
0
20
40
60
80
100
120
140
160
180
2010 2011 2012 2013 2014 2015 2016 2017 2018 2019
Inci
dent
s per
100
.000
Hou
rs F
low
n
Year Ending 30 June
Defect Incident Rates
Helicopters
AgriculturalAeroplanes
Occurrence Analysis Page 34
Copyright Civil Aviation Authority
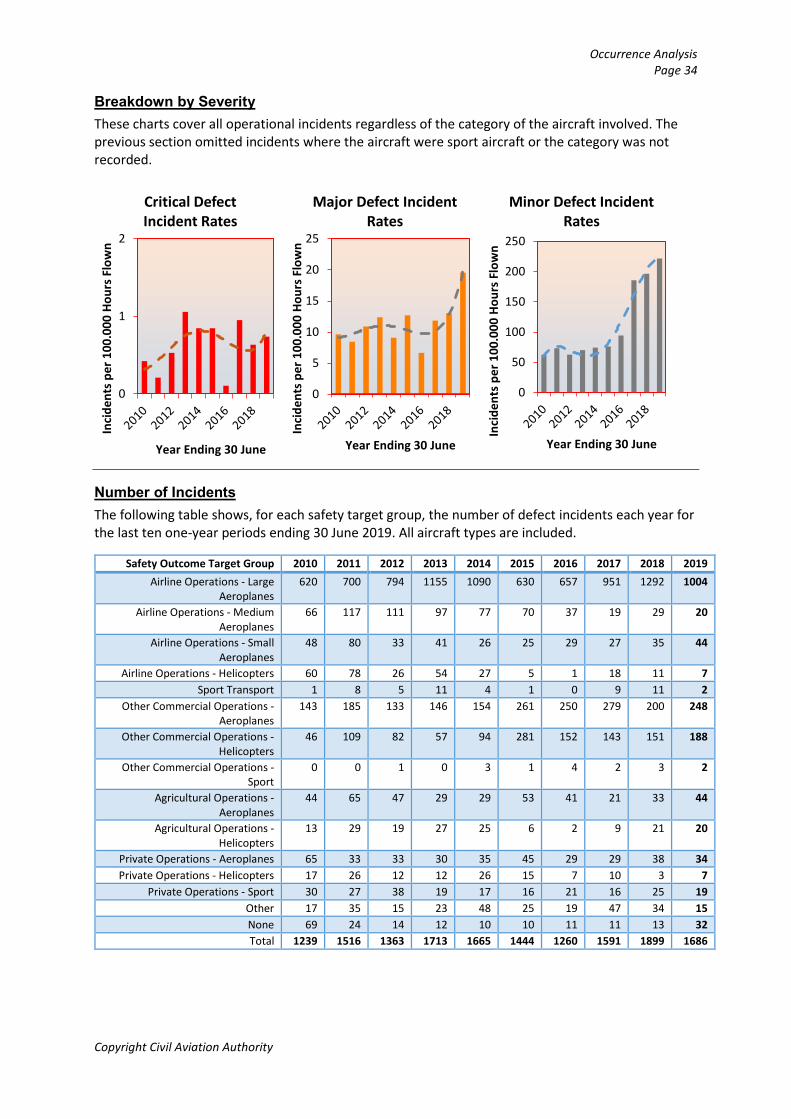
Breakdown by Severity These charts cover all operational incidents regardless of the category of the aircraft involved. The previous section omitted incidents where the aircraft were sport aircraft or the category was not recorded.
Number of Incidents The following table shows, for each safety target group, the number of defect incidents each year for the last ten one-year periods ending 30 June 2019. All aircraft types are included.
Safety Outcome Target Group 2010 2011 2012 2013 2014 2015 2016 2017 2018 2019 Airline Operations - Large
Aeroplanes 620 700 794 1155 1090 630 657 951 1292 1004
Airline Operations - Medium Aeroplanes
66 117 111 97 77 70 37 19 29 20
Airline Operations - Small Aeroplanes
48 80 33 41 26 25 29 27 35 44
Airline Operations - Helicopters 60 78 26 54 27 5 1 18 11 7 Sport Transport 1 8 5 11 4 1 0 9 11 2
Other Commercial Operations - Aeroplanes
143 185 133 146 154 261 250 279 200 248
Other Commercial Operations -Helicopters
46 109 82 57 94 281 152 143 151 188
Other Commercial Operations - Sport
0 0 1 0 3 1 4 2 3 2
Agricultural Operations - Aeroplanes
44 65 47 29 29 53 41 21 33 44
Agricultural Operations - Helicopters
13 29 19 27 25 6 2 9 21 20
Private Operations - Aeroplanes 65 33 33 30 35 45 29 29 38 34 Private Operations - Helicopters 17 26 12 12 26 15 7 10 3 7
Private Operations - Sport 30 27 38 19 17 16 21 16 25 19 Other 17 35 15 23 48 25 19 47 34 15 None 69 24 14 12 10 10 11 11 13 32 Total 1239 1516 1363 1713 1665 1444 1260 1591 1899 1686
0
1
2
Inci
dent
s per
100
.000
Hou
rs F
low
n
Year Ending 30 June
Critical Defect Incident Rates
0
5
10
15
20
25
Inci
dent
s per
100
.000
Hou
rs F
low
n
Year Ending 30 June
Major Defect Incident Rates
0
50
100
150
200
250
Inci
dent
s per
100
.000
Hou
rs F
low
n
Year Ending 30 June
Minor Defect Incident Rates
Occurrence Analysis Page 35
Published 24 December 2019
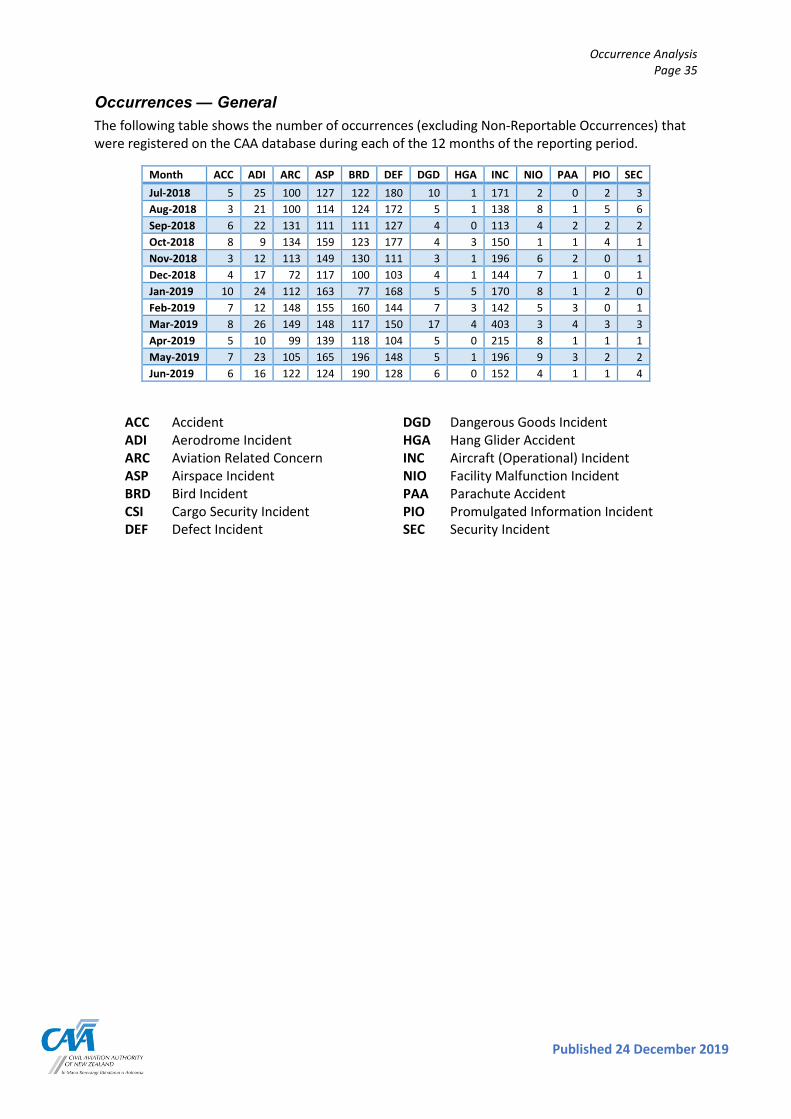
Occurrences — General The following table shows the number of occurrences (excluding Non-Reportable Occurrences) that were registered on the CAA database during each of the 12 months of the reporting period.
Month ACC ADI ARC ASP BRD DEF DGD HGA INC NIO PAA PIO SEC Jul-2018 5 25 100 127 122 180 10 1 171 2 0 2 3 Aug-2018 3 21 100 114 124 172 5 1 138 8 1 5 6 Sep-2018 6 22 131 111 111 127 4 0 113 4 2 2 2 Oct-2018 8 9 134 159 123 177 4 3 150 1 1 4 1 Nov-2018 3 12 113 149 130 111 3 1 196 6 2 0 1 Dec-2018 4 17 72 117 100 103 4 1 144 7 1 0 1 Jan-2019 10 24 112 163 77 168 5 5 170 8 1 2 0 Feb-2019 7 12 148 155 160 144 7 3 142 5 3 0 1 Mar-2019 8 26 149 148 117 150 17 4 403 3 4 3 3 Apr-2019 5 10 99 139 118 104 5 0 215 8 1 1 1 May-2019 7 23 105 165 196 148 5 1 196 9 3 2 2 Jun-2019 6 16 122 124 190 128 6 0 152 4 1 1 4
ACC Accident ADI Aerodrome Incident ARC Aviation Related Concern ASP Airspace Incident BRD Bird Incident CSI Cargo Security Incident DEF Defect Incident
DGD Dangerous Goods Incident HGA Hang Glider Accident INC Aircraft (Operational) Incident NIO Facility Malfunction Incident PAA Parachute Accident PIO Promulgated Information Incident SEC Security Incident
Appendix Page 36
Copyright Civil Aviation Authority
Appendix — Definitions General Accident [ACC] — means an occurrence that is associated with the operation of an aircraft and takes place between the time any person boards the aircraft with the intention of flight and such time as all such persons have disembarked and the engine or any propellers or rotors come to rest, being an occurrence in which–
(1) a person is fatally or seriously injured as a result of–
(i) being in the aircraft; or
(ii) direct contact with any part of the aircraft, including any part that has become detached from the aircraft; or
(iii) direct exposure to jet blast–
except when the injuries are self-inflicted or inflicted by other persons, or when the injuries are to stowaways hiding outside the areas normally available to passengers and crew; or
(2) the aircraft sustains damage or structural failure that–
(i) adversely affects the structural strength, performance or flight characteristics of the aircraft; and
(ii) would normally require major repair or replacement of the affected component–
except engine failure or damage that is limited to the engine, its cowlings, or accessories, or damage limited to propellers, wing tips, antennas, tyres, brakes, fairings, small dents, or puncture holes in the aircraft skin; or
(3) the aircraft is missing or is completely inaccessible.
Aerodrome incident [ADI] — means an incident involving an aircraft operation and–
(1) an obstruction either on the aerodrome operational area or protruding into the aerodrome obstacle limitation surfaces; or
(2) a defective visual aid; or
(3) a defective surface of a manoeuvring area; or
(4) any other defective aerodrome facility.
Aircraft incident [INC] — means any incident, not otherwise classified, associated with the operation of an aircraft.
Appendix Page 37
Published 24 December 2019
Airspace incident [ASP] — means an incident involving deviation from, or shortcomings of, the procedures or rules for–
(1) avoiding a collision between aircraft; or
(2) avoiding a collision between aircraft and other obstacles when an aircraft is being provided with an Air Traffic Service.
Bird incident [BRD] — means an incident where–
(1) there is a collision between an aircraft and one or more birds; or
(2) when one or more birds pass sufficiently close to an aircraft in flight to cause alarm to the pilot.
Cargo security incident [CSI] — means an incident involving cargo or mail that is carried, or has been accepted by a regulated air cargo agent or an air operator for carriage, by air on an aircraft conducting an international regular air transport operation passenger service, and–
(1) there is evidence of tampering or suspected tampering with the cargo or mail which could be an act or an attempted act of unlawful interference; or
(2) a weapon, explosive, or other dangerous device, article or substance, that may be used to commit an act of unlawful interference is detected in the cargo or mail.
Dangerous goods incident [DGD] — means an incident associated with and related to the carriage of dangerous goods by air after acceptance by the operator, that–
(1) results in injury to a person, property damage, fire, breakage, spillage, leakage of fluid or radiation, or other evidence that the integrity of the packaging has not been maintained; or
(2) involves dangerous goods incorrectly declared, packaged, labelled, marked, or documented.
Defect incident [DEF] — means an incident that involves failure or malfunction of an aircraft or aircraft component, whether found in flight or on the ground.
Facility malfunction incident [NIO] — means an incident that involves an aeronautical facility.
Fatal Injury — means any injury which results in death within 30 days of the accident.
Incident — means any occurrence, other than an accident, that is associated with the operation of an aircraft and affects or could affect the safety of operation. Note: Incident has many sub-categories.
Occurrence — means an accident or incident.
Appendix Page 38
Copyright Civil Aviation Authority
Promulgated information incident [PIO] — means an incident that involves significantly incorrect, inadequate, or misleading information or aeronautical data promulgated in an aeronautical information publication, map, chart, or otherwise provided for the operation of an aircraft.
Security incident [SEC] — means an incident that involves unlawful interference.
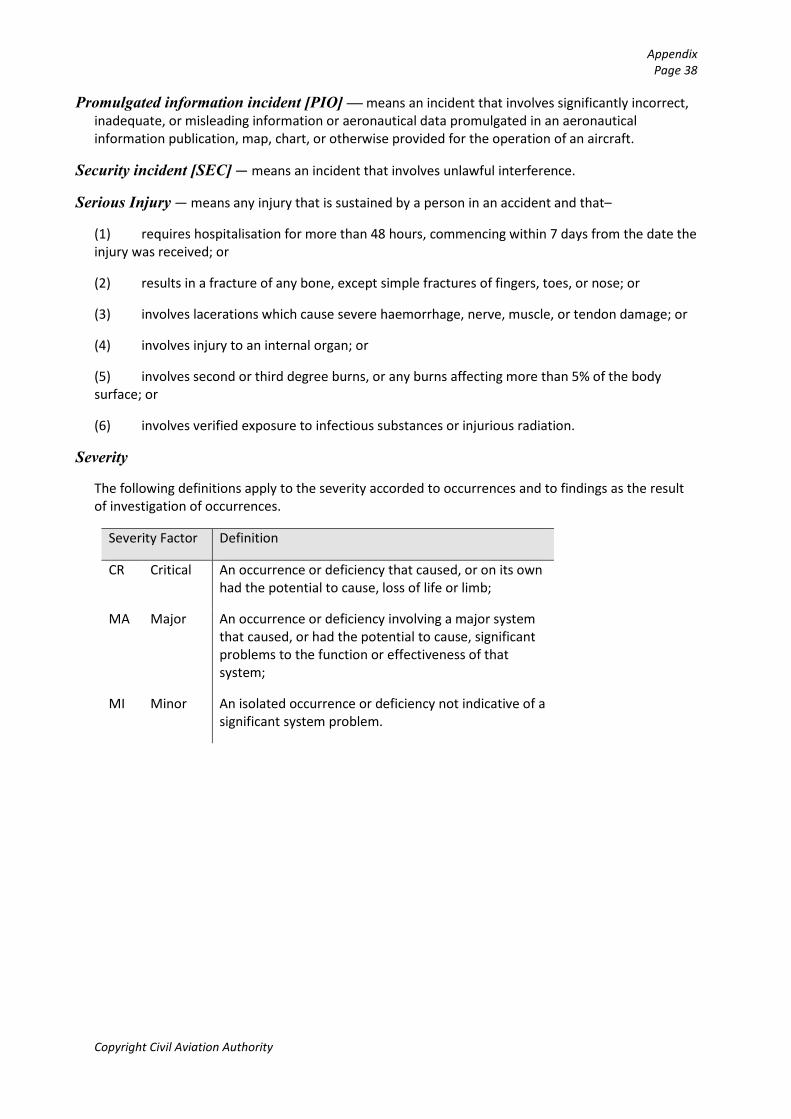
Serious Injury — means any injury that is sustained by a person in an accident and that–
(1) requires hospitalisation for more than 48 hours, commencing within 7 days from the date the injury was received; or
(2) results in a fracture of any bone, except simple fractures of fingers, toes, or nose; or
(3) involves lacerations which cause severe haemorrhage, nerve, muscle, or tendon damage; or
(4) involves injury to an internal organ; or
(5) involves second or third degree burns, or any burns affecting more than 5% of the body surface; or
(6) involves verified exposure to infectious substances or injurious radiation.
Severity
The following definitions apply to the severity accorded to occurrences and to findings as the result of investigation of occurrences.
Severity Factor Definition
CR Critical An occurrence or deficiency that caused, or on its own had the potential to cause, loss of life or limb;
MA Major An occurrence or deficiency involving a major system that caused, or had the potential to cause, significant problems to the function or effectiveness of that system;
MI Minor An isolated occurrence or deficiency not indicative of a significant system problem.
Appendix Page 39
Published 24 December 2019
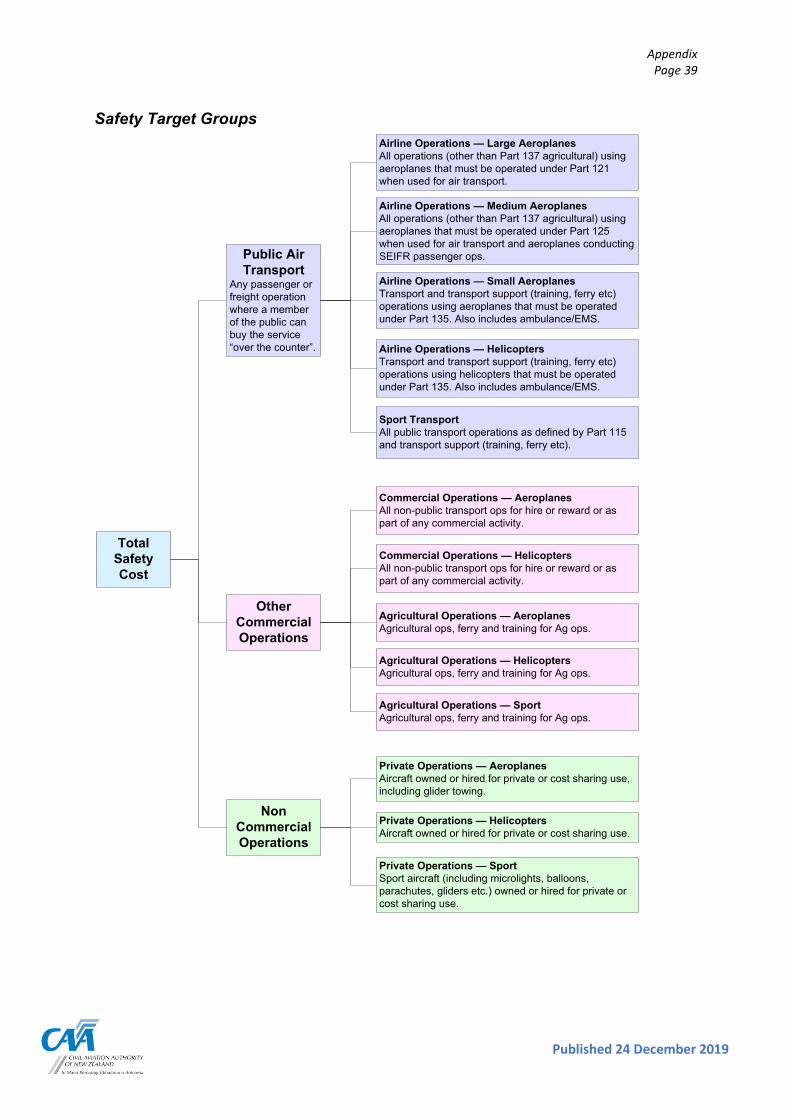
Safety Target Groups
Total Safety Cost
Public Air Transport
Any passenger or freight operation where a member of the public can buy the service “over the counter”.
Other Commercial Operations
Non Commercial Operations
Airline Operations — Large AeroplanesAll operations (other than Part 137 agricultural) using aeroplanes that must be operated under Part 121 when used for air transport.
Airline Operations — Medium AeroplanesAll operations (other than Part 137 agricultural) using aeroplanes that must be operated under Part 125 when used for air transport and aeroplanes conducting SEIFR passenger ops.
Airline Operations — Small AeroplanesTransport and transport support (training, ferry etc) operations using aeroplanes that must be operated under Part 135. Also includes ambulance/EMS.
Airline Operations — HelicoptersTransport and transport support (training, ferry etc) operations using helicopters that must be operated under Part 135. Also includes ambulance/EMS.
Sport TransportAll public transport operations as defined by Part 115 and transport support (training, ferry etc).
Commercial Operations — AeroplanesAll non-public transport ops for hire or reward or as part of any commercial activity.
Commercial Operations — HelicoptersAll non-public transport ops for hire or reward or as part of any commercial activity.
Agricultural Operations — AeroplanesAgricultural ops, ferry and training for Ag ops.
Agricultural Operations — HelicoptersAgricultural ops, ferry and training for Ag ops.
Agricultural Operations — SportAgricultural ops, ferry and training for Ag ops.
Private Operations — AeroplanesAircraft owned or hired for private or cost sharing use, including glider towing.
Private Operations — HelicoptersAircraft owned or hired for private or cost sharing use.
Private Operations — SportSport aircraft (including microlights, balloons, parachutes, gliders etc.) owned or hired for private or cost sharing use.
Appendix Page 40
Copyright Civil Aviation Authority
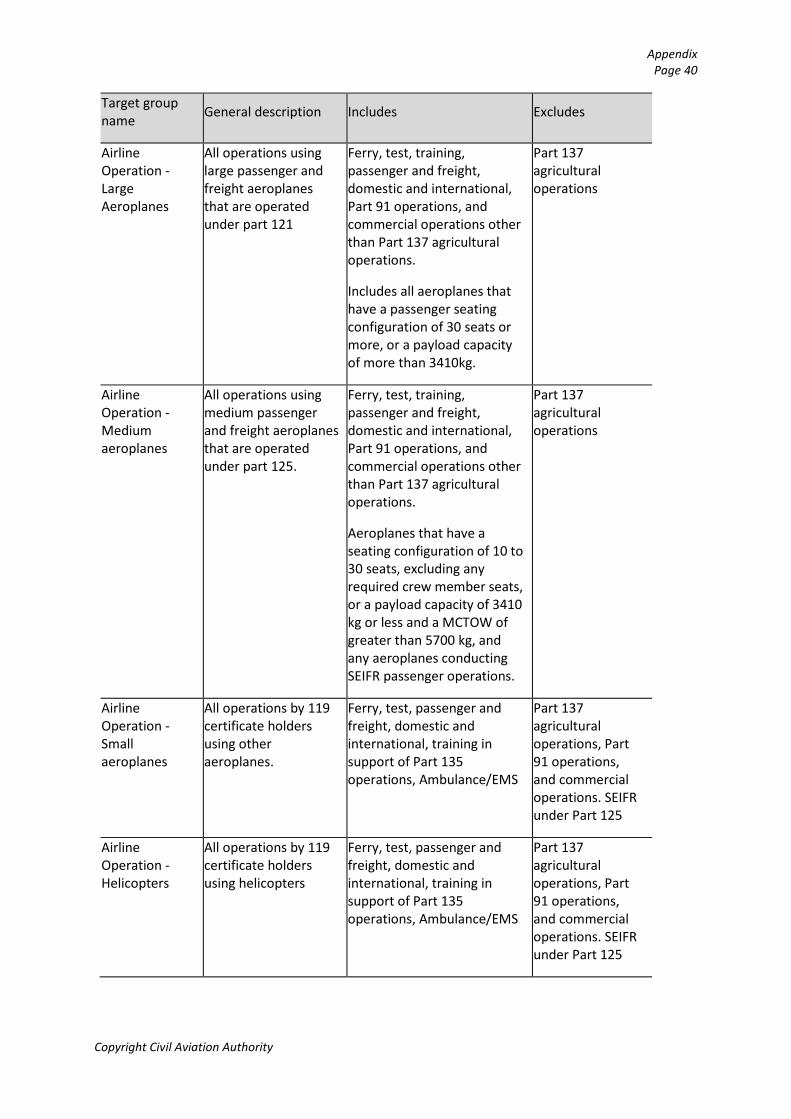
Target group name General description Includes Excludes
Airline Operation - Large Aeroplanes
All operations using large passenger and freight aeroplanes that are operated under part 121
Ferry, test, training, passenger and freight, domestic and international, Part 91 operations, and commercial operations other than Part 137 agricultural operations.
Includes all aeroplanes that have a passenger seating configuration of 30 seats or more, or a payload capacity of more than 3410kg.
Part 137 agricultural operations
Airline Operation - Medium aeroplanes
All operations using medium passenger and freight aeroplanes that are operated under part 125.
Ferry, test, training, passenger and freight, domestic and international, Part 91 operations, and commercial operations other than Part 137 agricultural operations.
Aeroplanes that have a seating configuration of 10 to 30 seats, excluding any required crew member seats, or a payload capacity of 3410 kg or less and a MCTOW of greater than 5700 kg, and any aeroplanes conducting SEIFR passenger operations.
Part 137 agricultural operations
Airline Operation - Small aeroplanes
All operations by 119 certificate holders using other aeroplanes.
Ferry, test, passenger and freight, domestic and international, training in support of Part 135 operations, Ambulance/EMS
Part 137 agricultural operations, Part 91 operations, and commercial operations. SEIFR under Part 125
Airline Operation - Helicopters
All operations by 119 certificate holders using helicopters
Ferry, test, passenger and freight, domestic and international, training in support of Part 135 operations, Ambulance/EMS
Part 137 agricultural operations, Part 91 operations, and commercial operations. SEIFR under Part 125
Appendix Page 41
Published 24 December 2019
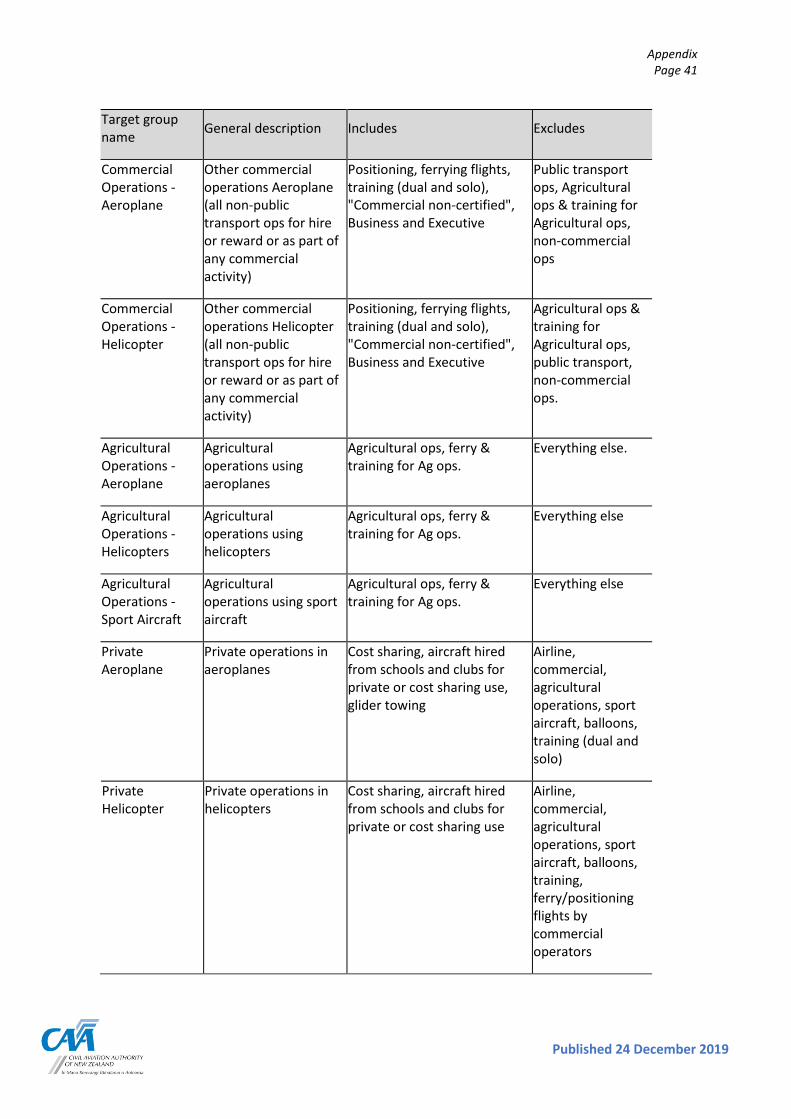
Target group name General description Includes Excludes
Commercial Operations - Aeroplane
Other commercial operations Aeroplane (all non-public transport ops for hire or reward or as part of any commercial activity)
Positioning, ferrying flights, training (dual and solo), "Commercial non-certified", Business and Executive
Public transport ops, Agricultural ops & training for Agricultural ops, non-commercial ops
Commercial Operations - Helicopter
Other commercial operations Helicopter (all non-public transport ops for hire or reward or as part of any commercial activity)
Positioning, ferrying flights, training (dual and solo), "Commercial non-certified", Business and Executive
Agricultural ops & training for Agricultural ops, public transport, non-commercial ops.
Agricultural Operations - Aeroplane
Agricultural operations using aeroplanes
Agricultural ops, ferry & training for Ag ops.
Everything else.
Agricultural Operations - Helicopters
Agricultural operations using helicopters
Agricultural ops, ferry & training for Ag ops.
Everything else
Agricultural Operations - Sport Aircraft
Agricultural operations using sport aircraft
Agricultural ops, ferry & training for Ag ops.
Everything else
Private Aeroplane
Private operations in aeroplanes
Cost sharing, aircraft hired from schools and clubs for private or cost sharing use, glider towing
Airline, commercial, agricultural operations, sport aircraft, balloons, training (dual and solo)
Private Helicopter
Private operations in helicopters
Cost sharing, aircraft hired from schools and clubs for private or cost sharing use
Airline, commercial, agricultural operations, sport aircraft, balloons, training, ferry/positioning flights by commercial operators
Appendix Page 42
Copyright Civil Aviation Authority
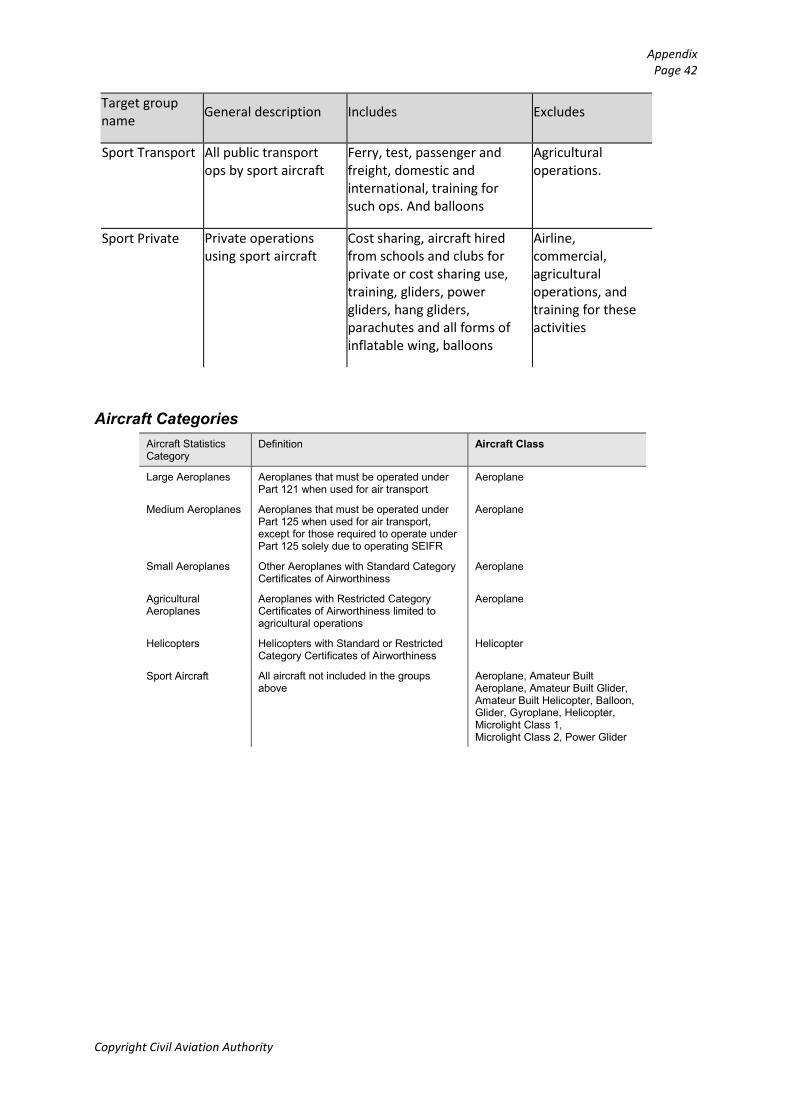
Target group name General description Includes Excludes
Sport Transport All public transport ops by sport aircraft
Ferry, test, passenger and freight, domestic and international, training for such ops. And balloons
Agricultural operations.
Sport Private Private operations using sport aircraft
Cost sharing, aircraft hired from schools and clubs for private or cost sharing use, training, gliders, power gliders, hang gliders, parachutes and all forms of inflatable wing, balloons
Airline, commercial, agricultural operations, and training for these activities
Aircraft Categories Aircraft Statistics Category
Definition Aircraft Class
Large Aeroplanes Aeroplanes that must be operated under Part 121 when used for air transport
Aeroplane
Medium Aeroplanes Aeroplanes that must be operated under Part 125 when used for air transport, except for those required to operate under Part 125 solely due to operating SEIFR
Aeroplane
Small Aeroplanes Other Aeroplanes with Standard Category Certificates of Airworthiness
Aeroplane
Agricultural Aeroplanes
Aeroplanes with Restricted Category Certificates of Airworthiness limited to agricultural operations
Aeroplane
Helicopters Helicopters with Standard or Restricted Category Certificates of Airworthiness
Helicopter
Sport Aircraft All aircraft not included in the groups above
Aeroplane, Amateur Built Aeroplane, Amateur Built Glider, Amateur Built Helicopter, Balloon, Glider, Gyroplane, Helicopter, Microlight Class 1, Microlight Class 2, Power Glider
Appendix Page 43
Published 24 December 2019
Significant Events The following text is taken from the procedure SI - 0.0 Occurrence Management, 0.08 - Occurrence completion:
To facilitate in deciding whether or not your investigation file should be “tagged” as a “Significant Event” here are some occurrences that substantially meet the criteria.
Occurrences that are investigated by TAIC unless it is known that the TAIC are using the event for their own training purposes and would not otherwise be investigating.
Critical air transport occurrences resulting in Near Collision (provided one of the aircraft involved is airborne, nearly airborne, or has just landed). In cases where an aircraft is landing or taking off the event would not be significant unless the aircraft’s speed was in excess of 10 kts.
Critical air transport occurrences resulting in Loss of Control
Critical air transport occurrences where a Distress or Urgency call was (or should have been) made
Air transport occurrences where the last in a series of “redundant” systems failed in flight or during take off or landing
SEIFR air transport occurrences involving loss of engine power to the extent that an unscheduled landing is required
Fatal accidents
Occurrences that are relevant to a current (group) of safety concerns. For example in 1999/2000 aircraft electrical wiring was a significant international concern therefore occurrences in the New Zealand fleet of electrical wiring problems may warrant them being tagged as significant.
Occurrences that are relevant to the current CAA (Business) Safety Plan. For the 1999/2000-year collision with terrain, obstacles, and water; controlled flight into terrain and loss of control in flight were relevant for aircraft with a MCTOW of 5,670 kg and above.
Engine failure in 2-plus engined air transport aircraft at critical phases of flight or failures of a nature that may have a fleet impact or significantly affect safe operations or are subject to media scrutiny.
Significant structural or engine failure of a private GA aircraft/helicopter that may have implications for the fleet type, particularly where that type is used for air transport operations.
Appendix Page 44
Copyright Civil Aviation Authority
Serious Events The following text is taken from the procedure SI - 2.0 Safety Investigation - Appendices, 2.02 Appendix B - Aviation Occurrence Notification Checklist:
“Serious incident” means an incident involving circumstances indicating that an accident nearly occurred. The difference between an accident and serious incident lies only in the result (ICAO Annex 13 definition). The serious incidents listed below are extracted from ICAO Annex 13 attachment D. The list is not exhaustive and only serves as guidance to the definition of serious incident.
(a) Near collisions requiring an avoidance manoeuvre to avoid a collision or an unsafe situation or when an avoidance action would have been appropriate.
(b) Controlled flight into terrain only marginally avoided.
(c) Aborted take-off on a closed or engaged runway.
(d) Take-off from a closed or engaged runway with marginal separation from obstacle(s).
(e) Landings or attempted landings on a closed or engaged runway.
(f) Gross failures to achieve predicated performance during take-off or initial climb.
(g) Fires and smoke in the passenger compartment, in cargo compartments or engine fires, even though such fires were extinguished by the use of extinguishing agents.
(h) Events requiring the emergency use of oxygen by the flight crew.
(i) Aircraft structural failures or engine disintegration’s not classified as an accident.
(j) Multiple malfunctions of one or more aircraft systems seriously affecting the operation of the aircraft.
(k) Flight crew incapacitation in flight.
(l) Fuel quantity requiring the declaration of an emergency by the pilot.
(m) Take-off or landing incidents. Incidents such as undershooting, overrunning or running off the side of runways.
(n) System failures, weather phenomena, operations outside the approved flight envelope or other occurrences, which could have caused difficulties controlling the aircraft.
(o) Failures of more than one system in a redundancy system mandatory for flight guidance and navigation.
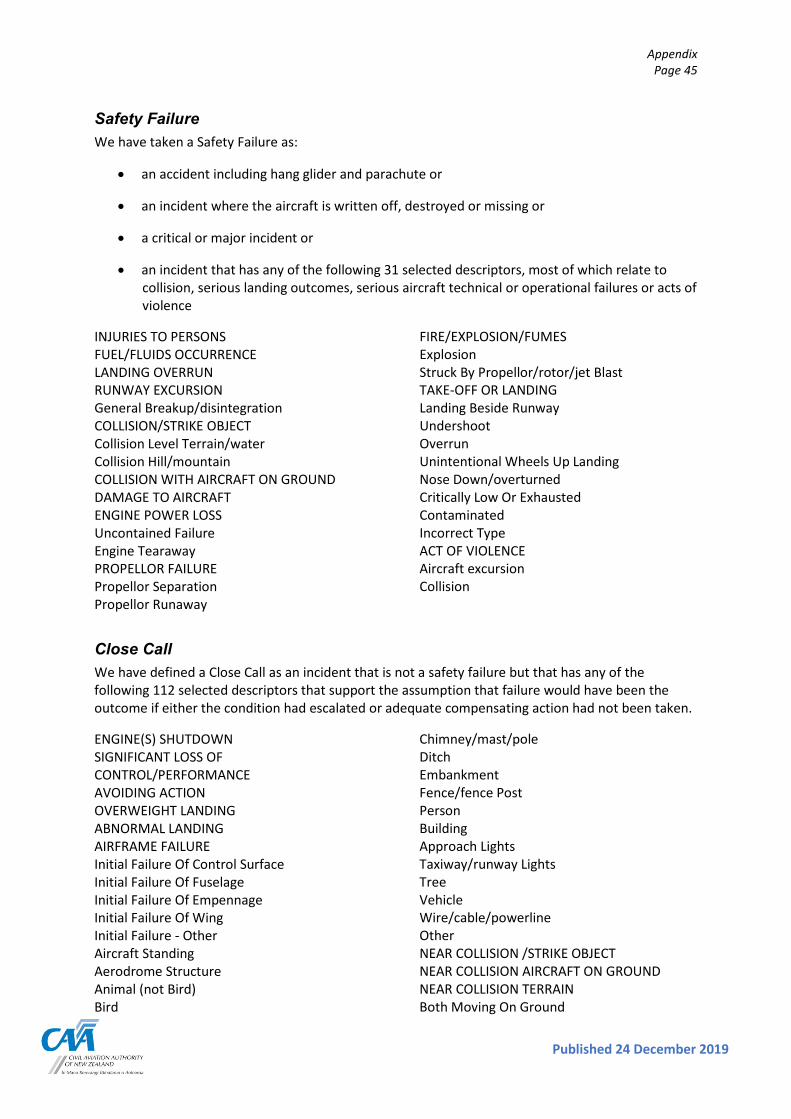
Appendix Page 45
Published 24 December 2019
Safety Failure We have taken a Safety Failure as:
• an accident including hang glider and parachute or
• an incident where the aircraft is written off, destroyed or missing or
• a critical or major incident or
• an incident that has any of the following 31 selected descriptors, most of which relate to collision, serious landing outcomes, serious aircraft technical or operational failures or acts of violence
INJURIES TO PERSONS FUEL/FLUIDS OCCURRENCE LANDING OVERRUN RUNWAY EXCURSION General Breakup/disintegration COLLISION/STRIKE OBJECT Collision Level Terrain/water Collision Hill/mountain COLLISION WITH AIRCRAFT ON GROUND DAMAGE TO AIRCRAFT ENGINE POWER LOSS Uncontained Failure Engine Tearaway PROPELLOR FAILURE Propellor Separation Propellor Runaway
FIRE/EXPLOSION/FUMES Explosion Struck By Propellor/rotor/jet Blast TAKE-OFF OR LANDING Landing Beside Runway Undershoot Overrun Unintentional Wheels Up Landing Nose Down/overturned Critically Low Or Exhausted Contaminated Incorrect Type ACT OF VIOLENCE Aircraft excursion Collision
Close Call We have defined a Close Call as an incident that is not a safety failure but that has any of the following 112 selected descriptors that support the assumption that failure would have been the outcome if either the condition had escalated or adequate compensating action had not been taken.
ENGINE(S) SHUTDOWN SIGNIFICANT LOSS OF CONTROL/PERFORMANCE AVOIDING ACTION OVERWEIGHT LANDING ABNORMAL LANDING AIRFRAME FAILURE Initial Failure Of Control Surface Initial Failure Of Fuselage Initial Failure Of Empennage Initial Failure Of Wing Initial Failure - Other Aircraft Standing Aerodrome Structure Animal (not Bird) Bird
Chimney/mast/pole Ditch Embankment Fence/fence Post Person Building Approach Lights Taxiway/runway Lights Tree Vehicle Wire/cable/powerline Other NEAR COLLISION /STRIKE OBJECT NEAR COLLISION AIRCRAFT ON GROUND NEAR COLLISION TERRAIN Both Moving On Ground
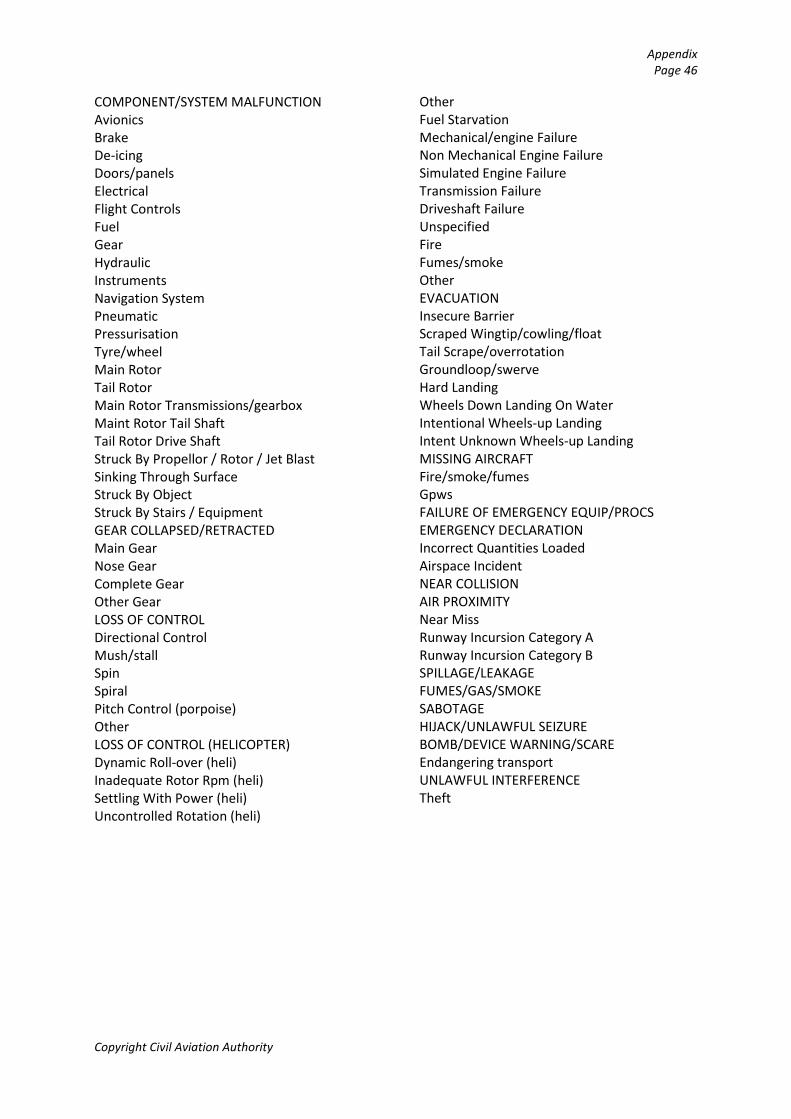
Appendix Page 46
Copyright Civil Aviation Authority
COMPONENT/SYSTEM MALFUNCTION Avionics Brake De-icing Doors/panels Electrical Flight Controls Fuel Gear Hydraulic Instruments Navigation System Pneumatic Pressurisation Tyre/wheel Main Rotor Tail Rotor Main Rotor Transmissions/gearbox Maint Rotor Tail Shaft Tail Rotor Drive Shaft Struck By Propellor / Rotor / Jet Blast Sinking Through Surface Struck By Object Struck By Stairs / Equipment GEAR COLLAPSED/RETRACTED Main Gear Nose Gear Complete Gear Other Gear LOSS OF CONTROL Directional Control Mush/stall Spin Spiral Pitch Control (porpoise) Other LOSS OF CONTROL (HELICOPTER) Dynamic Roll-over (heli) Inadequate Rotor Rpm (heli) Settling With Power (heli) Uncontrolled Rotation (heli)
Other Fuel Starvation Mechanical/engine Failure Non Mechanical Engine Failure Simulated Engine Failure Transmission Failure Driveshaft Failure Unspecified Fire Fumes/smoke Other EVACUATION Insecure Barrier Scraped Wingtip/cowling/float Tail Scrape/overrotation Groundloop/swerve Hard Landing Wheels Down Landing On Water Intentional Wheels-up Landing Intent Unknown Wheels-up Landing MISSING AIRCRAFT Fire/smoke/fumes Gpws FAILURE OF EMERGENCY EQUIP/PROCS EMERGENCY DECLARATION Incorrect Quantities Loaded Airspace Incident NEAR COLLISION AIR PROXIMITY Near Miss Runway Incursion Category A Runway Incursion Category B SPILLAGE/LEAKAGE FUMES/GAS/SMOKE SABOTAGE HIJACK/UNLAWFUL SEIZURE BOMB/DEVICE WARNING/SCARE Endangering transport UNLAWFUL INTERFERENCE Theft

Appendix Page 47
Published 24 December 2019