Embed Size (px)
Citation preview

Averting Obesity and Type 2 Diabetes in India throughSugar-Sweetened Beverage Taxation: An Economic-Epidemiologic Modeling StudySanjay Basu1,2*, Sukumar Vellakkal3, Sutapa Agrawal3, David Stuckler2,4, Barry Popkin5, Shah Ebrahim3,6
1 Prevention Research Center; Centers for Health Policy, Primary Care and Outcomes Research; Center on Poverty and Inequality; and Cardiovascular Institute, Stanford
University, Stanford, California, United States of America, 2 Department of Public Health and Policy, London School of Hygiene & Tropical Medicine, London, United
Kingdom, 3 South Asia Network for Chronic Disease, Public Health Foundation of India, New Delhi, India, 4 Department of Sociology, Oxford University, Oxford, United
Kingdom, 5 School of Public Health, University of North Carolina at Chapel Hill and the Carolina Population Center, Chapel Hill, North Carolina, United States of America,
6 Department of Non-Communicable Disease Epidemiology, London School of Hygiene & Tropical Medicine, London, United Kingdom
Abstract
Background: Taxing sugar-sweetened beverages (SSBs) has been proposed in high-income countries to reduce obesity andtype 2 diabetes. We sought to estimate the potential health effects of such a fiscal strategy in the middle-income country ofIndia, where there is heterogeneity in SSB consumption, patterns of substitution between SSBs and other beverages aftertax increases, and vast differences in chronic disease risk within the population.
Methods and Findings: Using consumption and price variations data from a nationally representative survey of 100,855Indian households, we first calculated how changes in SSB price alter per capita consumption of SSBs and substitution withother beverages. We then incorporated SSB sales trends, body mass index (BMI), and diabetes incidence data stratified byage, sex, income, and urban/rural residence into a validated microsimulation of caloric consumption, glycemic load,overweight/obesity prevalence, and type 2 diabetes incidence among Indian subpopulations facing a 20% SSB excise tax.The 20% SSB tax was anticipated to reduce overweight and obesity prevalence by 3.0% (95% CI 1.6%–5.9%) and type 2diabetes incidence by 1.6% (95% CI 1.2%–1.9%) among various Indian subpopulations over the period 2014–2023, if SSBconsumption continued to increase linearly in accordance with secular trends. However, acceleration in SSB consumptiontrends consistent with industry marketing models would be expected to increase the impact efficacy of taxation, averting4.2% of prevalent overweight/obesity (95% CI 2.5–10.0%) and 2.5% (95% CI 1.0–2.8%) of incident type 2 diabetes from2014–2023. Given current consumption and BMI distributions, our results suggest the largest relative effect would beexpected among young rural men, refuting our a priori hypothesis that urban populations would be isolated beneficiaries ofSSB taxation. Key limitations of this estimation approach include the assumption that consumer expenditure behavior fromprior years, captured in price elasticities, will reflect future behavior among consumers, and potential underreporting ofconsumption in dietary recall data used to inform our calculations.
Conclusion: Sustained SSB taxation at a high tax rate could mitigate rising obesity and type 2 diabetes in India among bothurban and rural subpopulations.
Please see later in the article for the Editors’ Summary.
Citation: Basu S, Vellakkal S, Agrawal S, Stuckler D, Popkin B, et al. (2014) Averting Obesity and Type 2 Diabetes in India through Sugar-Sweetened BeverageTaxation: An Economic-Epidemiologic Modeling Study. PLoS Med 11(1): e1001582. doi:10.1371/journal.pmed.1001582
Academic Editor: Tony Blakely, University of Otago, Wellington, New Zealand
Received August 1, 2013; Accepted November 19, 2013; Published January 7, 2014
Copyright: � 2014 Basu et al. This is an open-access article distributed under the terms of the Creative Commons Attribution License, which permits unrestricteduse, distribution, and reproduction in any medium, provided the original author and source are credited.
Funding: Funded by the National Institute on Aging (P30 AG017253, SB), the International Development Research Center (SB, SV, DS, SE), Wellcome Trust (SE),and the Stanford University Department of Medicine (SB). DS is funded by an ERC investigator award 313590-HRES. The funders had no role in study design, datacollection and analysis, decision to publish, or preparation of the manuscript.
Competing Interests: BP spoke on hydration at a symposium sponsored by Danome Water at The Nutrition Society (British), assisted colleagues at the NationalInstitute of Public Health in Mexico with a grant on SSBs vs. water funded by Danome Water, and was a coinvestigator on another RCT of water vs. diet beveragesvs. SSB funded by Nestle. DS is a member of the Editorial Board of PLOS Medicine.
Abbreviations: BMI, body mass index; SSB, sugar-sweetened beverage.
* E-mail: [email protected]
PLOS Medicine | www.plosmedicine.org 1 January 2014 | Volume 11 | Issue 1 | e1001582

Introduction
Sugar-sweetened beverage (SSB) consumption is established as a
major risk factor for overweight and obesity, as well as an array of
cardio-metabolic conditions, especially type 2 diabetes [1,2]. The
individual risk of type 2 diabetes attributable to SSB consumption
remains statistically significant after adjustment for total energy
consumption and body mass index (BMI) [3,4]. While taxes on SSBs
have been proposed in high-income countries to lower obesity and
type 2 diabetes risks given limited success from other population
measures and individual-level interventions [5], recent assessments
reveal a majority of SSB sales now occur outside the US and
Europe, where marketing efforts appear most focused [6–8]. SSB
sales in India, for example, have increased by 13% year-on-year
since 1998, exceeding 11 liters per capita per year (Figure 1) [9]. At
the population level, the acceleration of SSB consumption among
middle-income country populations has been statistically associated
with increased obesity, overweight, and type 2 diabetes prevalence
rates, independent of concurrent changes in other caloric
consumption, physical inactivity, and aging [6,10,11].
While econometric and modeling studies suggest the potential
effectiveness of large (e.g., penny-per-ounce, or 20%–25%) but not
smaller excise taxes on SSBs in the United States [12–15], and UK
[16], a key unknown is whether such fiscal strategies will be wise to
implement in middle-income nations like India and China, where
several aspects of SSB consumption and disease risk are uniquely
different from Western populations [17]. Asian countries’ popula-
tions appear to be internally heterogeneous in their ‘‘nutrition
transition’’ towards Western dietary patterns high in salt, sugar, and
fat content [17,18]. This implies that nationwide taxation may be
perverse if benefits accrue among only select populations while
monetary penalties apply universally, especially if the tax burden
but not the tax benefit falls disproportionately on the poor. In India,
processed foods make up a substantial portion of dietary consump-
tion overall, but with marked variations between men and women
and among age groups, income classes, and urban versus rural
populations [19,20]. Type 2 diabetes is similarly more prevalent
among urban, higher-income men, but lower-income groups and
women increasingly face a heightened burden of obesity and low
diagnosis rates associated with poor health care access [21–23].
Furthermore, the beverages that people consume apart from SSBs
also contain high caloric and glycemic loads in India and much of
Asia [6], indicating that if a tax were to induce substitutions from
SSBs to other beverages, the net health impacts on obesity and type
2 diabetes may be limited and, possibly, perverse [24].
We sought to characterize the influence of an SSB tax on
overweight, obesity, and type 2 diabetes trajectories among multiple
demographic groups in India. To perform the analysis, we first used
a standard microeconomic approach to calculate how changes in
SSB price relate to changes in SSB consumption (‘‘own-price
elasticity’’) and substitution of SSBs for other beverages (‘‘cross-price
elasticity’’), using per capita consumption and price variations data
from a nationally representative household survey [25]. We then
estimated how changes in overall calories and glycemic load
induced by a 20% excise tax on SSBs would be expected to alter
overweight, obesity, and type 2 diabetes incidence over the period
2014–2024. We chose the 20% rate for comparability against tax
simulations in Western populations, where a penny-per-ounce tax
amounts to an ,20%–25% price increase [15]; the 20% change is
also within the 35% SSB price variation range in the survey data
employed for our assessment. We nevertheless varied the tax rate
from 10% to 30% in sensitivity analyses to explore alternative
forecasts. We constructed and validated a microsimulation model to
estimate changes in weight and diabetes risk from the tax,
examining how changes in modeled outcomes resulted from a
variety of alternative assumptions. Our a priori hypothesis was that
urban populations would be the primary beneficiaries of SSB
taxation, given their high SSB exposure as well as elevated obesity
and type 2 diabetes prevalence rates [9,26].
Methods
Our analysis proceeded in three steps. First, we calculated
changes to overall beverage expenditure as well as own-price and
cross-price elasticities between SSBs and the other major beverage
types consumed in India (milk, fresh fruit juices, coffee, and tea)
using survey data relating price to consumption. We next used
these elasticity estimates to calculate per capita kilocalorie and
glycemic load changes expected from a 20% excise tax on SSBs.
Finally, constructing a discrete-time microsimulation model, we
simulated changes in overweight, obesity, and type 2 diabetes
incidence and prevalence over the period 2014–2023 given
changes in caloric intake and glycemic load. Each component of
our analysis was stratified by age-band, sex, income, and urban/
rural residence, in order to analyze disparities between demo-
graphic subpopulations in India.
Data SourcesElasticity calculations. The Indian National Sample Survey
(NSS), wave 2009/2010 (the most recent data available), was used
to calculate own- and cross-price elasticities corresponding to
changes in SSB price in each demographic subgroup, controlling
for changes in SSB availability [25]. The NSS Consumer
Expenditure module is a widely used repeated quinquennial
cross-sectional survey of household food consumption data from a
nationally representative sample in terms of age and income
distribution [25]. NSS data include beverage amount consumed
and prices paid for each of the beverage categories, based on
surveys of 100,855 households interviewed through a validated
interviewer-assisted questionnaire with district-level validation of
reported prices and oversampling of low-income, rural, and
female-headed households. Our power calculations estimated that
we could detect the odds ratio equivalent of a 10 kcal/person/day
change with .80% power in each subgroup given a survey design
effect of two [27]. We converted grams of consumption per capita
into kilocalories per capita (mean and 95% confidence intervals)
using a standard nutrient tables [28,29]. Kilocalorie and glycemic
load conversions included both mean and 95% confidence
intervals reflecting the distribution of milk among whole, skim,
and toned varieties [20]; the available fresh fruit juices on the
Indian market [9]; and typical added sugar content to consumer-
brewed coffee and tea [28]. Price was expressed in 2010 Indian
rupees, adjusted through GDP price deflators [30].
BMI distribution and type 2 diabetes status. While the
NSS provides data on consumption and price, it does not provide
data on health parameters such as BMI and type 2 diabetes status.
To analyze the covariance of SSB consumption with BMI and
type 2 diabetes status, we used data from the Public Health
Foundation of India’s Indian Migration Study (IMS) 2007–2010, a
national sample of 7,049 men and women from all three income
tertiles and both urban and rural residency status (Figure 2). These
individuals were evaluated through interviewer-administered food
frequency questionnaires and anthropometric and medical assess-
ments published previously [20,31]. The dietary assessment was
validated against independent surveys and a subsample analysis of
418 participants subjected to three 24-hour dietary recalls [20].
Soda Tax in India
PLOS Medicine | www.plosmedicine.org 2 January 2014 | Volume 11 | Issue 1 | e1001582

Elasticity Calculation DetailsGiven the absence of a suitable instrumental variable to link
with SSB prices, we calculated elasticities among the beverages
using the classical Quadratic Almost Ideal Demand System [32], a
standardized microeconomic system of equations that estimate
how price variations affect expenditure, substitution between
goods, and overall consumption (the inflationary effects of
taxation). The equations are detailed in Text S1, and complete
elasticity results are presented for each demographic subgroup in
Table 1. A standard two-step procedure was also used to first
estimate the probability of consumption, to account for censoring
and zero consumption, and then estimate the share of expendi-
tures spent on each beverage, controlling for availability and a
series of socioeconomic variables detailed in Text S1 [33–35]. The
system allows us to estimate shifting out of the purchased beverage
market in the context of prices (e.g., to tap water), versus the
degree of substitution between beverage classes following a price
change in each beverage. The demand system was estimated in
Stata version MP12.1 (StataCorp). The face validity of own-price
SSB elasticity was compared against an international systematic
review of elasticities [36]; our demand system revealed an own-
price elasticity of SSBs of 20.94 (95% CI 20.90 to 20.98), within
Figure 1. SSB consumption in liters per capita per year in India, 1998–2012 [9]. The Latin American average consumption is plotted forcomparison, reflecting the population-weighted average per capita consumption from 13 countries (Argentina, Bolivia, Brazil, Chile, Colombia, CostaRica, Dominican Republic, Ecuador, Guatemala, Mexico, Peru, Uruguay, and Venezuela).doi:10.1371/journal.pmed.1001582.g001
Soda Tax in India
PLOS Medicine | www.plosmedicine.org 3 January 2014 | Volume 11 | Issue 1 | e1001582

the review-based 95% confidence interval of 20.33 to 21.24.
Cross-elasticities, as tabulated in Text S1, were also similar to
published estimates, although the published estimates available
have not included India [37].
Tax Effect EstimatesTo examine the kilocalorie changes attributable to a 20% SSB
tax, the price elasticity for each beverage (percent change in
consumption for each 1% change in SSB price) was multiplied by
the change in SSB price (20% in the baseline case) and multiplied
by baseline daily kilocalorie intake among multiple Indian
subpopulations to estimate the change in individual daily intake
for each beverage (Table 2).
To estimate the potential effects of the tax on overweight and
obesity prevalence (BMI$25 kg/m2) and type 2 diabetes
incidence, we constructed a microsimulation model, which
simulates 10,000 adults for each cohort defined by every
combination of: age (25–44, 45–65 years old), sex, income (low,
middle, and high Standard of Living Index [SLI], a household-
level asset-based scale devised for Indian surveys [38]), and
urban/rural status (using the World Bank definition of urban
residence [39]). Model details are itemized here according to
ISPOR reporting guidelines [40], and the model flow diagram is
depicted in Figure 2.
Sampling from the joint distribution of weight, height,
consumption of each beverage type, and type 2 diabetes status
from the IMS study, the model assigns simulated individuals a
baseline profile of these factors, updating the estimates for secular
trends (Table 2) [31,41,42]. Unlike a typical Markov model, the
microsimulation approach can capture the impact of interventions
on individual risk factor profiles, not just the average population
effect of an intervention—allowing for complex relationships
among multiple co-morbid risk factors to be incorporated into the
experiment. This is important because reducing SSB consumption
in an individual who has a high baseline intake of SSBs but also a
high consumption of other beverages may have different outcomes
than reducing SSB consumption for someone with less consump-
tion of other beverages. The model was validated by comparing
historical projections of 2000–2010 obesity and type 2 diabetes
prevalence in India given year 2000 input values against
independent World Health Organization survey-based estimates
(Figure S1) [26].
Figure 2. Body mass index (BMI) distributions among cohorts (kg/m2), 2010 [31].doi:10.1371/journal.pmed.1001582.g002
Table 1. Elasticity given 1% change in SSB price, calculated from [25].
Beverage Income Level Residential SectorOverall Population(95% CI)
Low (95% CI) Mid (95% CI) High (95% CI) Urban (95% CI) Rural (95% CI)
n 28,207 50,989 21,659 59,119 41,736 100,855
Milk 0.055 (0.013–0.096)* 0.046 (0.010–0.083)* 0.046 (0.010–0.083)* 0.049 (0.010–0.087)* 0.049 (0.012–0.087)* 0.049 (0.011–0.087)*
SSBs 20.90(20.86 to 20.93)*
20.96(20.92 to 21.00)*
20.96(20.92 to 21.00)*
20.94(20.90 to 20.98)*
20.94(20.90 to 20.98)*
20.94(20.90 to 20.98)*
Fresh fruitjuice
0.32 (0.31–0.36)* 0.30 (0.25–0.35)* 0.30 (0.25–0.35)* 0.31 (0.27–0.35)* 0.31 (0.27–0.35)* 0.31 (0.27–0.35)*
Coffee 0.0016(20.077 to 0.051)
0.0054 (20.058 to0.084)
0.0054(20.058 to 0.084)
0.0041(20.064 to 20.073)
0.0041(20.064 to 0.073)
0.0041(20.064 to 0.073)
Tea 0.10 (0.062–0.131)* 0.14 (0.12–0.18)* 0.14 (0.12–0.18)* 0.13 (0.098–0.16)* 0.13 (0.098–0.16)* 0.13 (0.098–0.16)*
*p,0.05.doi:10.1371/journal.pmed.1001582.t001
Soda Tax in India
PLOS Medicine | www.plosmedicine.org 4 January 2014 | Volume 11 | Issue 1 | e1001582
We first simulated a baseline (no tax) case in which secular
trends in kilocalorie consumption, glycemic load intake, and
associated BMI and type 2 diabetes incidence changes were
estimated. Two baseline scenarios were modeled: (1) a linear rise
in SSB consumption of 13% per annum, fitting the secular trend
from 1998–2012 (the longest time series available), and (2) a
nonlinear rise predicted by a Bass marketing model used
commonly by industry for projecting sales growth [43] (both
shown in Figure 1; Bass model equation in Text S1). The model
also incorporated secular trends in non-beverage calorie intake
given by UN Food and Agricultural Organization estimates, to
account for other caloric changes; linear trends in non-SSB
beverage consumption were not statistically significant (Text S1)
[9,44]. Consumption changes were also converted into changes in
glycemic load using standard glycemic index tables (Table 3) [45].
Note that these estimates include the typical distribution of sugars
added by consumers to coffee and tea.
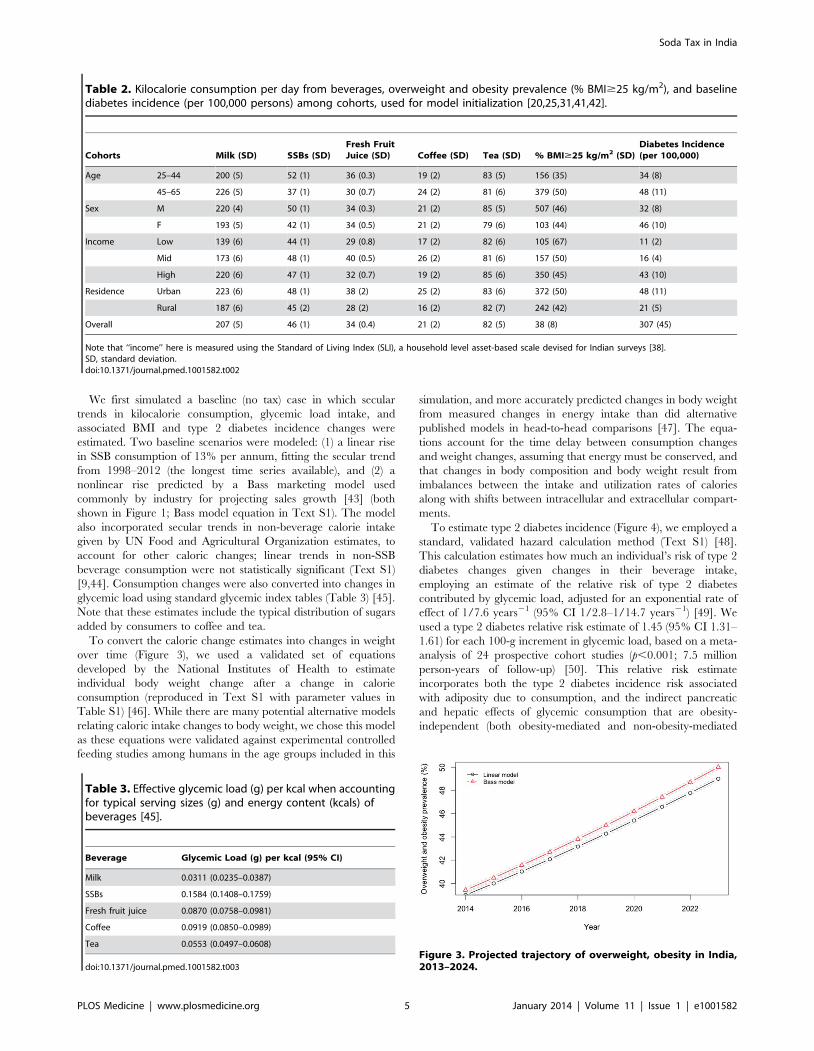
To convert the calorie change estimates into changes in weight
over time (Figure 3), we used a validated set of equations
developed by the National Institutes of Health to estimate
individual body weight change after a change in calorie
consumption (reproduced in Text S1 with parameter values in
Table S1) [46]. While there are many potential alternative models
relating caloric intake changes to body weight, we chose this model
as these equations were validated against experimental controlled
feeding studies among humans in the age groups included in this
simulation, and more accurately predicted changes in body weight
from measured changes in energy intake than did alternative
published models in head-to-head comparisons [47]. The equa-
tions account for the time delay between consumption changes
and weight changes, assuming that energy must be conserved, and
that changes in body composition and body weight result from
imbalances between the intake and utilization rates of calories
along with shifts between intracellular and extracellular compart-
ments.
To estimate type 2 diabetes incidence (Figure 4), we employed a
standard, validated hazard calculation method (Text S1) [48].
This calculation estimates how much an individual’s risk of type 2
diabetes changes given changes in their beverage intake,
employing an estimate of the relative risk of type 2 diabetes
contributed by glycemic load, adjusted for an exponential rate of
effect of 1/7.6 years21 (95% CI 1/2.8–1/14.7 years21) [49]. We
used a type 2 diabetes relative risk estimate of 1.45 (95% CI 1.31–
1.61) for each 100-g increment in glycemic load, based on a meta-
analysis of 24 prospective cohort studies (p,0.001; 7.5 million
person-years of follow-up) [50]. This relative risk estimate
incorporates both the type 2 diabetes incidence risk associated
with adiposity due to consumption, and the indirect pancreatic
and hepatic effects of glycemic consumption that are obesity-
independent (both obesity-mediated and non-obesity-mediated
Table 2. Kilocalorie consumption per day from beverages, overweight and obesity prevalence (% BMI$25 kg/m2), and baselinediabetes incidence (per 100,000 persons) among cohorts, used for model initialization [20,25,31,41,42].
Cohorts Milk (SD) SSBs (SD)Fresh FruitJuice (SD) Coffee (SD) Tea (SD) % BMI$25 kg/m2 (SD)
Diabetes Incidence(per 100,000)
Age 25–44 200 (5) 52 (1) 36 (0.3) 19 (2) 83 (5) 156 (35) 34 (8)
45–65 226 (5) 37 (1) 30 (0.7) 24 (2) 81 (6) 379 (50) 48 (11)
Sex M 220 (4) 50 (1) 34 (0.3) 21 (2) 85 (5) 507 (46) 32 (8)
F 193 (5) 42 (1) 34 (0.5) 21 (2) 79 (6) 103 (44) 46 (10)
Income Low 139 (6) 44 (1) 29 (0.8) 17 (2) 82 (6) 105 (67) 11 (2)
Mid 173 (6) 48 (1) 40 (0.5) 26 (2) 81 (6) 157 (50) 16 (4)
High 220 (6) 47 (1) 32 (0.7) 19 (2) 85 (6) 350 (45) 43 (10)
Residence Urban 223 (6) 48 (1) 38 (2) 25 (2) 83 (6) 372 (50) 48 (11)
Rural 187 (6) 45 (2) 28 (2) 16 (2) 82 (7) 242 (42) 21 (5)
Overall 207 (5) 46 (1) 34 (0.4) 21 (2) 82 (5) 38 (8) 307 (45)
Note that ‘‘income’’ here is measured using the Standard of Living Index (SLI), a household level asset-based scale devised for Indian surveys [38].SD, standard deviation.doi:10.1371/journal.pmed.1001582.t002
Table 3. Effective glycemic load (g) per kcal when accountingfor typical serving sizes (g) and energy content (kcals) ofbeverages [45].
Beverage Glycemic Load (g) per kcal (95% CI)
Milk 0.0311 (0.0235–0.0387)
SSBs 0.1584 (0.1408–0.1759)
Fresh fruit juice 0.0870 (0.0758–0.0981)
Coffee 0.0919 (0.0850–0.0989)
Tea 0.0553 (0.0497–0.0608)
doi:10.1371/journal.pmed.1001582.t003
Figure 3. Projected trajectory of overweight, obesity in India,2013–2024.
Soda Tax in India
PLOS Medicine | www.plosmedicine.org 5 January 2014 | Volume 11 | Issue 1 | e1001582

pathways) [51,52]. We chose to use glycemic load relative risk
estimates rather than relative risk estimates of diabetes specifically
calculated only for SSBs [3], to account for the metabolic effects of
beverages substituted for SSBs. This would be expected to produce
conservative results from our simulation. Furthermore, the
glycemic load calculation accounts for the fact that the impact
on diabetes of different types of calories is different; that is, because
the glycemic load per calorie is much higher for SSBs than other
beverages (Table 3), a net change in calories alone does not predict
type 2 diabetes risk, and the glycemic load estimate is used to
account for the fact that some calories confer higher risk than
others.
For prospective simulation of the period 2014–2023, 10,000
simulations were performed of the overall model (10,000
simulations each with 10,000 individuals per cohort) in MATLAB
version R2013b (MathWorks), sampling repeatedly from the
probability distributions of the input parameter values to estimate
95% confidence intervals around modeled outcomes (Figure 5). All
model parameters—including kilocalorie consumption, elasticities,
glycemic load, relative risks, and the metabolic parameters—were
included in the uncertainty analysis.
To simulate the 20% excise SSB tax, we simulated full country-
wide tax coverage starting at the beginning of the year 2014. In
sensitivity analyses, we varied the SSB tax rate from 10% to 30%.
In a further sensitivity analysis, SSB consumption trends were
simulated using a standard Bass diffusion model employed by
industry to project sales growth (Figure 1, R2 = 0.98) [43], rather
than the baseline linear trend also shown in Figure 1.
For outcomes analysis, we computed both overweight and
obesity prevalence, because the threshold of 25 kg/m2 has been
the Indian government standard for BMI surveillance [53], given
elevated risk of type 2 diabetes among South Asians at lower BMI
levels (.24 kg/m2) [54] than the international obesity threshold of
30 kg/m2.
Ethics StatementEthics committee approval for the IMS Study that was used to
inform the model was obtained from the All India Institute of
Medical Sciences Ethics Committee, reference number A-60/4/
8/2004; for the overall modeling research, ethics committee
approval was obtained from the Stanford University Institutional
Review Board, reference number eP-28811.
Results
SSB Consumption, Obesity, and Type 2 Diabetes RatesWe observed little variation in SSB consumption levels among
demographic cohorts in India (Table 2). Among the 390 kcal/
person/day typically consumed from beverages among surveyed
Indians, approximately 12% (46 kcal/person/day) were conferred
by SSBs. Consumption varied from 9% (37 kcal) among the older
cohort of 45–65 year olds to 13% (52 kcal) of overall beverage
consumption among the younger 25–44 year old cohort, and was
roughly equal among urban (12%, 48 kcal) and rural populations
(12%, 45 kcal). SSBs composed 14% of beverage calories among
the poorest income tertile and 12% among the wealthiest tertile.
However, overall beverage calories were lowest among the poor
(310 kcal/person/day) versus the wealthiest tertile (404 kcal/
person/day), hence absolute consumption varied insignificantly
by wealth (44 versus 47 kcal/person/day).
Rates of obesity and type 2 diabetes universally increased across
cohorts in our projections over the period 2014–2023. We
observed that if linear secular trends in SSB consumption
continued in the absence of a tax (Figure 1), Indian overweight
and obesity prevalence (percent adults 24–65 with BMI$25 kg/
m2) would be expected to increase from 39% to 49% and type 2
diabetes incidence would be expected to rise in parallel from 319
to 336 per 100,000 per year over the period 2014–2023.
Amplification of these trends to 50% overweight prevalence and
343 per 100,000 type 2 diabetes incidence by year 2023 were
observed in the Bass diffusion scenario, in which SSB consumption
followed the curvilinear rise of marketing model projections
(Figure 1), which forecast consumption increasing from 12.8 l/
person/year in 2014 to 36.3 l/person/year in 2023 (approximate-
ly one-fourth the 2012 rates in Latin American countries [9];
Figure 1).
ElasticitiesMuch of the rise in SSB consumption would be expected to shift
toward other beverage consumption in the context of an SSB tax.
On the basis of microeconomic demand system estimates of
expenditure data, SSB consumption was observed to decline by
0.94% for each 1% increase in SSB price (95% CI, a 0.90%–
0.98% reduction). Substitution among beverages revealed a
0.049% (0.011%–0.087%) increase in milk consumption, 0.31%
(0.27%–0.35%) increase in fresh fruit juice consumption, and a
0.13% (0.098%–0.16%) increase in tea consumption for each 1%
rise in SSB price in the overall population, with small variations
between groups (Table 1), but a non-significant degree of
substitution with coffee (0.004%, 20.064% to 0.073%). Full
elasticity estimate details are provided in Table 1.
Tax EffectsUsing the calculated elasticities to project the effects of a 20%
excise tax on SSBs (Figures S2–S6), we estimated obesity and type
2 diabetes rate changes among demographic cohorts (Figures 6–8).
Overweight and obesity prevalence declined by 1.6% to 5.9% and
type 2 diabetes incidence by 1.2% to 1.9% from the baseline
estimates among the Indian subpopulations under a 20% SSB tax
(Figures 7 and 8; 3.0% overweight/obesity reduction and 1.6%
type 2 diabetes reduction in the overall population). Different
sensitivities to the tax among cohorts were driven primarily by
differences in the distribution of BMI, such that groups with lower
current median BMIs were more easily able to maintain members
of the cohort below the threshold of 25 kg/m2 (Table 2). In the
setting of linear consumption increases in SSBs, younger (25–44
year olds), male, low-income, and rural populations were observed
to experience the largest relative decline in kilocalorie consump-
tion from beverages and associated declines in overweight and
obesity prevalence (Figures 6–8). When differential glycemic load
among beverages and different baseline incidence rates of type 2
diabetes were accounted for, urban rather than rural populations
Figure 4. Projected trajectory of type 2 diabetes incidence inIndia, 2013–2024.
Soda Tax in India
PLOS Medicine | www.plosmedicine.org 6 January 2014 | Volume 11 | Issue 1 | e1001582

experienced the largest relative declines in type 2 diabetes
incidence (Figure 8). As shown in Figures 6, 7, and 8, a large
confidence interval was observed among females and low-income
populations due to imprecision in current diabetes incidence
estimates among these groups, resulting from less robust surveil-
lance quality among these cohorts.
Converting the relative rate declines into absolute numbers of
averted overweight, obesity, and type 2 diabetes cases—accounting for
population size differences and demographic trends in population
growth [55]—revealed large variations among population subgroups.
The largest number of prevalent overweight and obesity cases averted
from 2014–2023 would still be expected among the younger cohort
(3.9 million people avoiding overweight in the 25–44 year group versus
1.1 million in the 45–65 year old group), as well as males (2.9 million
versus 2.1 female), and rural populations (3.1 million versus 1.4 million
urban), but also among the highest income tertile (1.7 million versus 1.4
million in the mid tertile and 1.1 million among the lowest tertile). In
absolute numbers, the most type 2 diabetes cases averted from 2014–
2023 were among the older cohort (573,000 among 45–65 year olds
versus 477,000 in 25–44 year olds over 2014–2023), men (1.6 million
versus 1.2 million women), the highest income tertile (603,000 versus
248,000 in lowest tertile), and rural populations (877,000 versus
741,000 urban). In total, 11.2 million overweight and obesity cases
(23.0%, 95% CI 7.5–15.0 million) and 400,000 type 2 diabetes cases
(21.6%, 95% CI 300,000–500,000) would be averted from 2014–
2023 by a 20% SSB excise tax, according to our model.
Figure 5. Model diagram.doi:10.1371/journal.pmed.1001582.g005
Soda Tax in India
PLOS Medicine | www.plosmedicine.org 7 January 2014 | Volume 11 | Issue 1 | e1001582

Sensitivity AnalysesThe preventive impact of the tax was amplified by 40% to 60%
when we shifted our assumptions from a linear trend in SSB
consumption to a Bass diffusion model of SSB consumption
trends, but qualitative differences between population subgroups
were unaltered (Figures 6–8). Should consumer trends in SSB
Figure 6. Projected changes in kilocalories per person per day consumed from all beverages. Open circles, linear model; red triangles,Bass model of changes in SSB consumption over time.doi:10.1371/journal.pmed.1001582.g006
Figure 7. Change in overweight and obesity prevalence (relative change in percent of adults with body mass index .25 kg/m2).Open circles, linear model; red triangles, Bass model of changes in SSB consumption over time.doi:10.1371/journal.pmed.1001582.g007
Soda Tax in India
PLOS Medicine | www.plosmedicine.org 8 January 2014 | Volume 11 | Issue 1 | e1001582

consumption increase according to the Bass trajectory, the
preventive efficacy of a 20% SSB tax would rise by 40% to
60% over the baseline forecast, reducing overweight and obesity
prevalence by 2.5%–10.0% and averting 1.0%–2.8% of incident
type 2 diabetes (a 4.2% reduction in overweight/obesity
prevalence, or 15.8 million people, 95% CI 10.4–21.1 million,
and 2.5% reduction in type 2 diabetes incidence in the overall
population, or 600,000 people, 95% CI 400,000–800,000;
Figures 7 and 8).
The sensitivity of overweight, obesity, and type 2 diabetes to tax
rate variations was linear in the case of overweight and obesity
rates, but nonlinear for type 2 diabetes incidence, such that
reducing the tax from 20% to 10% reduced the projected impact
of the tax on overweight and obesity by 50% and on type 2
diabetes incidence by 62%. Conversely, increasing the tax from
20% to 30% increased the projected impact of the tax on
overweight and obesity by 50% and on type 2 diabetes incidence
by 33%. The nonlinearity in diabetes rates arose from complex
changes in glycemic load intake when accounting for substitutions
between beverages; increasing the SSB tax, for example, produces
diminishing returns as substituted goods contribute to total
glycemic load consumption to varying degrees, conditional on
their price and total per capita expenditures on beverages.
Discussion
An excise tax on SSBs would be expected to mitigate increases
in overweight, obesity, and type 2 diabetes cases in India under
numerous alternative scenarios and assumptions, even after
accounting for beverage substitution patterns. Under the conser-
vative scenario of a linear rise in SSB consumption, a 20% SSB
excise tax would be expected to prevent 11.2 million new cases of
overweight and obesity (a 3.0% decline), and 400,000 cases of type
2 diabetes (a 1.6% decline) over the decade 2014–2023, according
to a microsimulation model informed by nationally representative
consumer expenditure, price, BMI, and type 2 diabetes incidence
data. Under the case in which consumption follows business
marketing models, which mirror recent SSB sales increases, a 20%
SSB tax would be expected to avert 4.2% of prevalent overweight/
obesity and 2.5% of incident type 2 diabetes from 2014–2023. As
compared to other population-level obesity interventions (e.g.,
nutrition labels and consumer education) that have been studied to
date, which typically result in ,1% reductions in overweight and
obesity and non-significant changes in diabetes rates [56–60], this
implies a comparatively large population-level impact from SSB
taxation. While a number of low- and middle-income countries are
creating an array of large-scale interventions to address increased
obesity and diabetes, to date none have sustained reductions in
BMI [18].
The SSB tax appeared likely to significantly lower both BMI
and type 2 diabetes incidence among all demographic cohorts,
without perverse increases in BMI or type 2 diabetes due to
substitution effects. However, the effect sizes of the tax varied
notably among different demographic groups. Contrary to our a
priori hypothesis, the largest relative declines in overweight and
obesity prevalence were observed among young rural men, as this
group with lower current BMI more easily maintained itself below
the BMI threshold of 25 kg/m2 in scenarios with SSB taxation
than without such taxation. The BMI threshold of 25 kg/m2
corresponds to a critical inflexion point of increasing type 2
diabetes risk among Indians [54].
These findings offer substantial contributions to the existing
literature on non-communicable disease prevention in low- and
middle-income countries. Our assessment is the first to our
knowledge to study the impact of SSB taxation in India, which is
expected to experience more deaths from non-communicable
diseases than any other country in the world over the next decade,
and is considered a policy leader among developing nations
Figure 8. Change in type 2 diabetes incidence (per 100,000) under a 20% excise tax on SSBs. Open circles, linear model; red triangles,Bass model of changes in SSB consumption over time.doi:10.1371/journal.pmed.1001582.g008
Soda Tax in India
PLOS Medicine | www.plosmedicine.org 9 January 2014 | Volume 11 | Issue 1 | e1001582

devising chronic disease interventions [61]. Unlike most assess-
ments of large-scale interventions in developing countries, our
study is based on disaggregated population-representative data
specific to different income groups, urban/rural residence, both
sexes, and both middle-aged and older adults, accounting for
within-country heterogeneity in consumption behavior and disease
risk. Prior policy models have been criticized for either projecting
results from Western populations onto other countries, or
aggregating large, heterogeneous developing country populations
into a single population average, which can produce perverse
outcomes when policies benefit one segment of the population
while potentially risking poor outcomes among others [17,62].
Our results also incorporate the effects of substitution among
beverage classes through a direct estimation method rather than
assumptions alone, an advance over most models of fiscal policy
that have been criticized for ignoring this issue or assuming
arbitrary levels of substitution [63]. The research also lends
insights into the fact that obesity and diabetes impacts of SSB taxes
may not be entirely parallel, in light of the glycemic load effects of
food intake on type 2 diabetes risk. This glycemic load factor
incorporates the differential impact of each calorie of SSBs versus
other beverages on diabetes risk, given that glycemic load per
calorie of SSBs is about 5.3 times that of milk, for example
(Table 3).
The impact of BMI on chronic disease among Indians is notably
different than among other populations. A large literature suggests
that Indians at BMIs ranging from 20–22 kg/m2 have percent
body fats equivalent to non-Hispanic white Americans or British
adults with BMIs of 27–30 kg/m2, and Indians have an increased
risk type 2 diabetes at much lower BMI levels than these other
populations [64–68]. Our estimates therefore relied directly on
both adiposity-related and direct metabolic impact estimates of
type 2 diabetes risk associated with glycemic load consumption
changes. The estimates incorporate the glycemic load impact of
fruit juices as substitutes for SSBs, given the literature suggesting
that fruit juice consumption may have adverse metabolic effects
consistent with glycemic load contributions, even if having lower
calories than SSBs [69].
As with other projections of fiscal policy interventions, our
assessment relies on mathematical modeling, which inherently
requires several assumptions and limitations. First, we employ the
assumption that consumer expenditure behavior from prior years,
captured in price elasticities, will reflect future behavior among
consumers. This abstraction makes it impossible to account for the
potential increased willingness-to-pay for SSBs in the context of
social trends in popularity and income increases. Second, our
metabolic equations calculating weight change in the context of
caloric change does not account for diet beverages (which are
currently ,0.1 l/person/year in India [9]) that have unclear
relationships to metabolic syndrome [70–72], and assumes that
physical activity will not change directly as a result of soda
taxation, even though compensatory activity after substitution may
also occur (e.g., individuals who change their diet may decide to
exercise more or less based on perceptions of the healthfulness of
their dietary change). Third, we abstract from dietary food
frequency questionnaires that are validated against 24-hour
dietary recalls and independent databases [20], but are still
subject to recall bias and underreporting. Fourth, our model
produced wide confidence intervals among the lowest-income
tertile and women due to undersampling of rural low-income
populations. Nevertheless, our purpose in employing this model
was not to predict exact future rates of disease, which is impossible
from any model, but to understand potential demographic
differences in taxation impact and estimate the sensitivity of
forecasts to varying assumptions about future SSB consumption. A
consistent finding among all cohorts was that a rise in SSB
consumption in accordance with recent trends would portend
increasing overweight, obesity, and type 2 diabetes rates, but also
render an excise tax on SSBs differentially more effective as a
preventive population strategy. Finally, we did not account for
safety concerns if SSB taxation shifts to increasing tap water usage
in the context of some populations have unsafe water supplies in
India; however, this is unlikely to produce a true epidemiological
shift in disease burden as populations already exposed to non-
potable water-based pathogens would likely to continue to be
exposed, and unexposed populations are unlikely to be newly
exposed because of an SSB tax given that nearly all populations
drink some tap water in their locality. Similarly, we did not track
the vitamin and mineral-related implications of SSB taxation as it
implies differential consumption of fruit juices that may have other
nutritional benefits but that also contribute to type 2 diabetes risks
[69].
Another limitation of our analysis is that our treatment of the
SSB taxation strategy is unable to quantify the attendant ethical,
political, and social dilemmas presented by taxation strategies.
Sufficient data are not available on changes in beverage intake
behaviors among Indian children, or the long-term metabolic and
cardiovascular consequences of SSB consumption changes among
children aside from weight gain [73]. Hence, we focused on
validated models of adult metabolism, since the cardiovascular and
metabolic disease burden and health care cost would be expected
to accrue most among adults over the near-term policy window
that we simulated here. Excise taxation on foods can also be
viewed as discriminatory, paternal, or regressive (in an economic
sense). An alternate perspective is that preventing obesity and
diabetes among lowest-income populations, who are among the
most affected over time, will produce the greatest social benefit as
low-income populations are also least likely to obtain diagnosis and
treatment for chronic disease [5]. Another unresolved political
issue is the administrative challenge of enforcing taxes on
purchases in informal settings, given that SSBs are often sold by
small vendors, with potential implications for household income,
economic growth, and poverty given the employment impact of
SSB sales. Excise taxes at the manufacturing level would allow
bypassing of some enforcement obstacles, but remain politically
opposed by beverage companies. Studies of existing SSB taxes in
Western populations have highlighted that the taxes imposed have
been generally too small to have meaningful effect size, while
imposing larger taxes at equivalent levels to those simulated here
may confer greater benefits [14,15]. Future research should
replicate the findings observed here in other rapidly developing
middle-income countries where SSB consumption is increasing at
a rapid rate [6].
For policy, our research indicates that SSB price increases are
likely to generate substantial reductions in overweight, obesity, and
type 2 diabetes through pathways affecting caloric intake and
glycemic load. Fiscal strategies could mitigate obesity and type 2
diabetes in India over the next decade, even for more remote and
low-income populations that are less likely to have transitioned to
other components of Western diets in the near term.
Supporting Information
Figure S1 Model-based estimates of prevalence ofoverweight (BMI.25 kg/m2) and type 2 diabetes prev-alence versus WHO estimates [26].
(TIF)
Soda Tax in India
PLOS Medicine | www.plosmedicine.org 10 January 2014 | Volume 11 | Issue 1 | e1001582

Figure S2 Model-based estimates of the probabilitydistributions of change in milk intake after a 20% SSBtax in the baseline scenario (noting no significant changein consumption of coffee). Consumption estimates are in units
of kcals/person/day.
(TIF)
Figure S3 Model-based estimates of the probabilitydistributions of change in SSB intake after a 20% SSBtax in the baseline scenario (noting no significant changein consumption of coffee). Consumption estimates are in units
of kcals/person/day.
(TIF)
Figure S4 Model-based estimates of the probabilitydistributions of change in fresh fruit juice intake aftera 20% SSB tax in the baseline scenario (noting nosignificant change in consumption of coffee). Consump-
tion estimates are in units of kcals/person/day.
(TIF)
Figure S5 Model-based estimates of the probabilitydistributions of change in tea intake after a 20% SSBtax in the baseline scenario (noting no significant change
in consumption of coffee). Consumption estimates are in units
of kcals/person/day.
(TIF)
Figure S6 Joint distributions of consumption changeamong the individual beverage classes in the baselinescenario. Consumption estimates are in units of kcals/person/
day.
(TIF)
Table S1 Energy metabolism parameter values used inthe model.(DOCX)
Text S1 Modeling details.(DOCX)
Author Contributions
Conceived and designed the experiments: SB DS SE. Performed the
experiments: SB SV SA. Analyzed the data: SB SV SA BP. Contributed
reagents/materials/analysis tools: SB SV SA BP. Wrote the first draft of
the manuscript: SB. Contributed to the writing of the manuscript: SB SV
SA DS BP SE. ICMJE criteria for authorship read and met: SB SV SA DS
BP SE. Agree with manuscript results and conclusions: SB SV SA DS BP
SE.
References
1. Malik VS, Schulze MB, Hu FB (2006) Intake of sugar-sweetened beverages and
weight gain: a systematic review. Am J Clin Nutr 84: 274–288.
2. Malik VS, Popkin BM, Bray GA, Despres J-P, Willett WC, et al. (2010) Sugar-sweetened beverages and risk of metabolic syndrome and type 2 diabetes: a
meta-analysis. Diabetes Care 33: 2477–2483.
3. Schulze MB, Manson JAE, Ludwig DS, Colditz GA, Stampfer MJ, et al. (2004)
Sugar-sweetened beverages, weight gain, and incidence of type 2 diabetes inyoung and middle-aged women. JAMA 292: 927–934.
4. The InterAct consortium (2013) Consumption of sweet beverages and type 2
diabetes incidence in European adults: results from EPIC-InterAct. Diabetologia
56: 1520–1530.
5. Brownell KD, Farley T, Willett WC, Popkin BM, Chaloupka FJ, et al. (2009)The public health and economic benefits of taxing sugar-sweetened beverages.
N Engl J Med 361: 1599–1605.
6. Basu S, McKee M, Galea G, Stuckler D (2013) Relationship of soft drink
consumption to global overweight, obesity, and diabetes: a cross-nationalanalysis of 75 countries. Am J Public Health: e1–e7.
7. Kleiman S, Ng SW, Popkin B (2012) Drinking to our health: can beverage
companies cut calories while maintaining profits? Obes Rev Off J Int Assoc
Study Obes 13: 258–274.
8. Barquera S, Hernandez-Barrera L, Tolentino ML, Espinosa J, Ng SW, et al.(2008) Energy intake from beverages is increasing among Mexican adolescents
and adults. J Nutr 138: 2454–2461.
9. Euromonitor International (2013) Passport Global Market Information Data-
base. New York: Euromonitor.
10. Basu S, Stuckler D, McKee M, Galea G (2012) Nutritional determinants ofworldwide diabetes: an econometric study of food markets and diabetes
prevalence in 173 countries. Public Health Nutr 1: 1–8.
11. Basu S, Yoffe P, Hills N, Lustig RH (2013) The relationship of sugar to
population-level diabetes prevalence: an econometric analysis of repeated cross-sectional data. PLoS ONE 8: e57873. doi:10.1371/journal.pone.0057873.
12. Finkelstein EA, Zhen C, Nonnemaker J, Todd JE (2010) Impact of targeted
beverage taxes on higher- and lower-income households. Arch Intern Med 170:2028–2034.
13. Powell LM, Chaloupka FJ (2009) Food prices and obesity: evidence and policyimplications for taxes and subsidies. Milbank Q 87: 229–257.
14. Sturm R, Powell LM, Chriqui JF, Chaloupka FJ (2010) Soda taxes, soft drink
consumption, and children’s body mass index. Health Aff (Millwood) 29: 1052–1058.
15. Wang YC, Coxson P, Shen YM, Goldman L, Bibbins-Domingo K (2012) APenny-per-ounce tax on sugar-sweetened beverages would cut health and cost
burdens of diabetes. Health Aff (Millwood) 31: 199–207.
16. Briggs ADM, Mytton OT, Kehlbacher A, Tiffin R, Rayner M, et al. (2013)Overall and income specific effect on prevalence of overweight and obesity of
20% sugar sweetened drink tax in UK: econometric and comparative risk
assessment modelling study. BMJ 347: f6189.
17. Ebrahim S, Pearce N, Smeeth L, Casas JP, Jaffar S, et al. (2013) Tackling non-communicable diseases in low- and middle-income countries: is the evidence
from high-income countries all we need? PLoS Med 10: e1001377. doi:10.1371/journal.pmed.1001377.
18. Popkin BM, Adair LS, Ng SW (2012) Global nutrition transition and the
pandemic of obesity in developing countries. Nutr Rev 70: 3–21.
19. Reardon T, Timmer CP, Minten B (2012) Supermarket revolution in Asia and
emerging development strategies to include small farmers. Proc Natl Acad
Sci U S A 109: 12332–12337.
20. Bansal D, Satija A, Khandpur N, Bowen L, Kinra S, et al. (2010) Effects of
migration on food consumption patterns in a sample of Indian factory workers
and their families. Public Health Nutr 13: 1982–1989.
21. Subramanian S, Corsi DJ, Subramanyam MA, Davey Smith G (2013) Jumping
the gun: the problematic discourse on socioeconomic status and cardiovascular
health in India. Int J Epidemiol 42: 1410–1426.
22. Vellakkal S, Subramania SV, Millett C, Basu S, Stuckler D, et al. (n.d.)
Socioeconomic inequalities in non-communicable diseases prevalence in India:
disparities between self-reported diagnoses and standardized measures. PLoS
ONE 8: e68219. doi:10.1371/journal.pone.0068219
23. Deepa M, Anjana RM, Manjula D, Narayan KMV, Mohan V (2011)
Convergence of prevalence rates of diabetes and cardiometabolic risk factors
in middle and low income groups in urban India: 10-year follow-up of the
Chennai Urban Population Study. J Diabetes Sci Technol 5: 918–927.
24. Fletcher JM, Frisvold DE, Tefft N (2010) The effects of soft drink taxes on child
and adolescent consumption and weight outcomes. J Public Econ 94: 967–974.
25. Ministry of Statistics and Programme Implementation (2012) National Sample
Survey. Delhi: Government of India.
26. World Health Organization (2012) WHO Global InfoBase.Geneva: WHO.
27. Cohen J (1988) Statistical power analysis for the behavioral sciences. New York:
Routledge Academic.
28. US Department of Agriculture (2013) National Nutrient Database for Standard
Reference. Release 25. Washington (D.C.): National Agricultural Library.
29. Gopalan C, Sastri BVR, Balasubramanian SC (1971) Nutritive value of Indian
foods. Hyderabad: Hyderabad Natl Inst Nutr.
30. OECD (2013) Main Economic Indicators - complete database. Paris:
Organisation for Economic Co-operation and Development. Available:
http://www.oecd-ilibrary.org/content/data/data-00052-en. Accessed 9 June
2013.
31. Ebrahim S, Kinra S, Bowen L, Andersen E, Ben-Shlomo Y, et al. (2010) The
effect of rural-to-urban migration on obesity and diabetes in India: a cross-
sectional study. PLoS Med 7: e1000268. doi:10.1371/journal.pmed.1000268.
32. Banks J, Blundell R, Lewbel A (1997) Quadratic Engel curves and consumer
demand. Rev Econ Stat 79: 527–539.
33. Shonkwiler JS, Yen ST (1999) Two-step estimation of a censored system of
equations. Am J Agric Econ 81: 972–982.
34. Haines PS, Guilkey DK, Popkin BM (1988) Modeling Food Consumption
Decisions as a Two-Step Process. Am J Agric Econ 70: 543–552.
35. Pollak RA, Wales TJ (1978) Estimation of complete demand systems from
household budget data: the linear and quadratic expenditure systems. Am Econ
Rev 68: 348–359.
36. Andreyeva T, Long MW, Brownell KD (2010) The impact of food prices on
consumption: a systematic review of research on the price elasticity of demand
for food. Am J Public Health 100: 216–222.
Soda Tax in India
PLOS Medicine | www.plosmedicine.org 11 January 2014 | Volume 11 | Issue 1 | e1001582

37. Dharmasena S, Capps O (2012) Intended and unintended consequences of a
proposed national tax on sugar-sweetened beverages to combat the US obesityproblem. Health Econ 21: 669–694.
38. International Institute for Population Sciences (IIPS) (2007) National Family
Health Survey (NFHS-3). Mumbai: IIPS.39. World Bank (2012) World Development Indicators. Washington (D.C.): IBRD.
40. Caro JJ, Briggs AH, Siebert U, Kuntz KM (2012) Modeling Good ResearchPractices—Overview A Report of the ISPOR-SMDM Modeling Good Research
Practices Task Force–1. Med Decis Making 32: 667–677.
41. Sadikot SM, Nigam A, Das S, Bajaj S, Zargar AH, et al. (2004) The burden ofdiabetes and impaired glucose tolerance in India using the WHO 1999 criteria:
prevalence of diabetes in India study (PODIS). Diabetes Res Clin Pract 66: 301–307.
42. Danaei G, Finucane MM, Lu Y, Singh GM, Cowan MJ, et al. (2011) National,regional, and global trends in fasting plasma glucose and diabetes prevalence
since 1980: systematic analysis of health examination surveys and epidemiolog-
ical studies with 370 country-years and 2.7 million participants. Lancet 378: 31–40.
43. Bass FM (2004) Comments on ‘‘A New Product Growth for Model ConsumerDurables The Bass Model.’’ Manag Sci 50: 1833–1840.
44. Food and Agricultural Organization (2013) FAOSTAT database. Rome: United
Nations.45. Atkinson FS, Foster-Powell K, Brand-Miller JC (2008) International Tables of
Glycemic Index and Glycemic Load Values: 2008. Diabetes Care 31: 2281–2283.
46. Hall KD, Sacks G, Chandramohan D, Chow CC, Wang YC, et al. (2011)Quantification of the effect of energy imbalance on bodyweight. Lancet 378:
826–837.
47. Hall KD, Jordan PN (2008) Modeling weight-loss maintenance to help preventbody weight regain. Am J Clin Nutr 88: 1495–1503.
48. Lim SS, Gaziano TA, Gakidou E, Reddy KS, Farzadfar F, et al. (2007)Prevention of cardiovascular disease in high-risk individuals in low-income and
middle-income countries: health effects and costs. Lancet 370: 2054–2062.
49. CDC (n.d.) CDC’s Diabetes Program - Data & Trends - Duration of Diabetes -Distribution of Diabetes Duration Among Adults Aged 18–79 Years, United
States, 1997–2009. Available: http://www.cdc.gov/diabetes/statistics/duration/fig2.htm. Accessed 19 December 2012.
50. Livesey G, Taylor R, Livesey H, Liu S (2013) Is there a dose-response relation ofdietary glycemic load to risk of type 2 diabetes? Meta-analysis of prospective
cohort studies. Am J Clin Nutr 97: 584–596.
51. Bremer AA, Mietus-Snyder M, Lustig RH (2012) Toward a unifying hypothesisof metabolic syndrome. Pediatrics 129: 557–570.
52. Teff KL, Grudziak J, Townsend RR, Dunn TN, Grant RW, et al. (2009)Endocrine and metabolic effects of consuming fructose- and glucose-sweetened
beverages with meals in obese men and women: influence of insulin resistance on
plasma triglyceride responses. J Clin Endocrinol Metab 94: 1562–1569.53. Indian Consensus Group (1996) Indian consensus for prevention of hypertension
and coronary heart disease. A joint scientific statement of Indian Society ofHypertension and International College of Nutrition. J Nutr Env Med 6: 309–
318.54. Chiu M, Austin PC, Manuel DG, Shah BR, Tu JV (2011) Deriving ethnic-
specific BMI cutoff points for assessing diabetes risk. Diabetes Care 34: 1741–
1748.55. Registrar General & Census Commissioner (2011) Census of India. Delhi:
Ministry of Home Affairs.
56. Tuah NA, Amiel C, Qureshi S, Car J, Kaur B, et al. (2011) Transtheoretical
model for dietary and physical exercise modification in weight loss management
for overweight and obese adults. Cochrane Database Syst Rev 10: CD008066.
57. Shaw K, O’Rourke P, Del Mar C, Kenardy J (2005) Psychological interventions
for overweight or obesity. Cochrane Database Syst Rev 2: CD003818.
58. Waters E, de Silva Sanigorski A, Hall BJ, Brown T, Campbell KJ, et al. (2012)
Interventions for preventing obesity in children (review). Cochrane Collab: 1–
212.
59. Thomas DE, Elliott EJ, Baur L (2007) Low glycaemic index or low glycaemic
load diets for overweight and obesity. Cochrane Database Syst Rev Online:
CD005105.
60. Prevention I of M (US) C on AP in O, Glickman D (2012) Accelerating Progress
in Obesity Prevention: Solving the Weight of the Nation. Washington (D.C.):
National Academies Press.
61. World Health Organization (2011) United Nations high-level meeting on
noncommunicable disease prevention and control. Geneva: WHO.
62. Basu S, Babiarz KS, Ebrahim S, Vellakkal S, Stuckler D, et al. (2013) Palm oil
taxes and cardiovascular disease mortality in India: economic-epidemiologic
model. BMJ 347: f6048.
63. Eyles H, Mhurchu CN, Nghiem N, Blakely T (2012) Food pricing strategies,
population diets, and non-communicable disease: a systematic review of
simulation studies. PLoS Med 9: e1001353. doi:10.1371/journal.pmed.1001353
64. Misra A, Khurana L (2009) The metabolic syndrome in South Asians:
epidemiology, determinants, and prevention. Metab Syndr Relat Disord 7:
497–514.
65. Misra A, Vikram NK (2004) Insulin resistance syndrome (metabolic syndrome)
and obesity in Asian Indians: evidence and implications. Nutr Burbank Los
Angeles Cty Calif 20: 482–491.
66. Bhat DS, Yajnik CS, Sayyad MG, Raut KN, Lubree HG, et al. (2005) Body fat
measurement in Indian men: comparison of three methods based on a two-
compartment model. Int J Obes 2005 29: 842–848.
67. Deurenberg-Yap M, Schmidt G, van Staveren WA, Deurenberg P (2000) The
paradox of low body mass index and high body fat percentage among Chinese,
Malays and Indians in Singapore. Int J Obes Relat Metab Disord J Int Assoc
Study Obes 24: 1011–1017.
68. Kesavachandran CN, Bihari V, Mathur N (2012) The normal range of body
mass index with high body fat percentage among male residents of Lucknow city
in north India. Indian J Med Res 135: 72–77.
69. Bazzano LA, Li TY, Joshipura KJ, Hu FB (2008) Intake of fruit, vegetables, and
fruit juices and risk of diabetes in women. Diabetes Care 31: 1311–1317.
70. De Koning L, Malik VS, Kellogg MD, Rimm EB, Willett WC, et al. (2012)
Sweetened beverage consumption, incident coronary heart disease, and
biomarkers of risk in men. Circulation 125: 1735–1741, S1.
71. De Koning L, Malik VS, Rimm EB, Willett WC, Hu FB (2011) Sugar-sweetened
and artificially sweetened beverage consumption and risk of type 2 diabetes in
men. Am J Clin Nutr 93: 1321–1327.
72. Duffey KJ, Steffen LM, Van Horn L, Jacobs DR Jr, Popkin BM (2012) Dietary
patterns matter: diet beverages and cardiometabolic risks in the longitudinal
Coronary Artery Risk Development in Young Adults (CARDIA) Study.
Am J Clin Nutr 95: 909–915.
73. De Ruyter JC, Olthof MR, Seidell JC, Katan MB (2012) A trial of sugar-free or
sugar-sweetened beverages and body weight in children. N Engl J Med 367:
1397–1406.
Soda Tax in India
PLOS Medicine | www.plosmedicine.org 12 January 2014 | Volume 11 | Issue 1 | e1001582

Editors’ Summary
Background. Non-communicable diseases (NCDs) andobesity (excessive body mass) are major threats to globalhealth. Each year NCDs kill 36 million people (including 29million people in low- and middle-income countries),thereby accounting for nearly two-thirds of the world’sannual deaths. Cardiovascular diseases, cancers, respiratorydiseases, and diabetes (a condition characterized by raisedblood sugar levels) are responsible for most NCD-relateddeaths. Worldwide, diabetes alone affects about 360 millionpeople and causes nearly 5 million deaths annually. And thenumber of people affected by NCDs is likely to rise over thenext few decades. It is estimated, for example, that 101.2million people in India will have diabetes by 2030, nearlydouble the current number. In Asia and other low- andmiddle-income countries overweight as well as obesityrepresent a risk factor for NCDs and the global prevalenceof obesity (the proportion of the world’s population that isobese) has nearly doubled since 1980. Worldwide, around 0.5billion people are now classified as obese and about 1.5billion more overweight. That is, they have a body massindex (BMI) of 30 kg/m2 or more (25–30 for overweight); BMIis calculated by dividing a person’s weight in kilograms bythe square of their height in meters. In India individuals witha BMI of 25 or more (overweight/obese) are at very high riskof diabetes.
Why Was This Study Done? The consumption of sugar-sweetened beverages (SSBs, soft drinks sweetened with canesugar or other caloric sweeteners) is a major risk factor foroverweight/obesity and, independent of total energy con-sumption and BMI, for type 2 diabetes (the commonest formof diabetes). In high-income countries, SSB taxation has beenproposed as a way to lower the risk of obesity and type 2diabetes, however it is unknown if this approach will work inlow- and middle-income countries. Here, in an economic-epidemiologic modeling study, researchers estimate thepotential health effects of SSB taxation in India, a middle-income country in which total SSB consumption is rapidlyincreasing, but where SSB consumption and chronic diseaserisk vary greatly within the population and where people arelikely to turn to other sugar-rich beverages (for example,fresh fruit juices) if SSBs are taxed.
What Did the Researchers Do and Find? The researchersused survey data relating SSB consumption to pricevariations to calculate how changes in the price of SSBsaffect the demand for SSBs (own-price elasticity) and forother beverages (cross-price elasticity) in India. They com-bined these elasticities and data on SSB sales trends, BMIs,and diabetes incidence (the frequency of new diabetescases) into a mathematical microsimulation model toestimate the effect of a 20% tax on SSBs on caloric (energy)consumption, glycemic load (an estimate of how much afood or drink raises blood sugar levels after consumption;low glycemic load diets lower diabetes risk), the prevalenceof overweight/obesity, and the incidence of diabetes amongIndian subpopulations. According to the model, if SSB sales
continue to increase at the current rate, compared to no tax,a 20% SSB tax would reduce overweight/obesity across Indiaby 3.0% and the incidence of type 2 diabetes by 1.6% overthe period 2014–2023. In absolute figures, a 20% SSB taxwould avert 11.2 million cases of overweight/obesity and400,000 cases of type 2 diabetes between 2014 and 2023.Notably, if SSB sales increase more steeply as predicted bydrinks industry marketing models, the tax would avert 15.8million cases of overweight/obesity and 600,000 cases ofdiabetes. Finally, the model predicted that the largestrelative effect of an SSB tax would be among young menin rural areas.
What Do These Findings Mean? The accuracy of thesefindings is likely to be affected by the assumptionsincorporated in the model and by the data fed into it. Inparticular, the accuracy of the estimates of the health effectsof a 20% tax on SSBs is limited by the assumption that futureconsumer behavior will reflect historic behavior and bypotential underreporting of SSB consumption in surveys.Nevertheless, these findings suggest that a sustained highrate of tax on SSBs could mitigate the rising prevalence ofobesity and the rising incidence of diabetes in India in bothurban and rural populations by affecting both caloric intakeand glycemic load. Thus, SSB taxation might be a way tocontrol obesity and diabetes in India and other low- andmiddle-income countries where, to date, large-scale inter-ventions designed to address these threats to global healthhave had no sustained effects.
Additional Information. Please access these websites viathe online version of this summary at http://dx.doi.org/10.1371/journal.pmed.1001582.
N The World Health Organization provides information aboutnon-communicable diseases, obesity, and diabetes aroundthe world (in several languages)
N The US Centers for Disease Control and Preventionprovides information on non-communicable diseasesaround the world and on overweight and obesity anddiabetes (including some information in Spanish)
N The US National Diabetes Information Clearinghouseprovides information about diabetes for patients, health-care professionals, and the general public, includingdetailed information on weight control (in English andSpanish)
N The UK National Health Service Choices website providesinformation for patients and carers about type 2 diabetesand about obesity; it includes personal stories aboutdiabetes and about obesity
N MedlinePlus provides links to further resources and adviceabout diabetes and diabetes prevention and about obesity(in English and Spanish)
N A 2012 Policy brief from the Yale Rudd Center for foodpolicy and obesity provides information about SSB taxes
Soda Tax in India
PLOS Medicine | www.plosmedicine.org 13 January 2014 | Volume 11 | Issue 1 | e1001582


![Obesity and diabetes [autosaved]](https://img.dokumen.tips/doc/110x75/5a669cdb7f8b9a0c768b4a7b/obesity-and-diabetes-autosaved.jpg)