Embed Size (px)
Citation preview


AVERT Overview and Step-by-Step InstructionsU.S. Environmental Protection Agency State
Climate and Energy Program Updated April 2016

2
Overview of AVERT Development for Energy Efficiency and Renewable Energy (EE/RE) Programs • AVERT (AVoided Emissions and geneRation Tool) translates
the energy impacts of EE/RE policies and programs into emission reductions (NOx, SO2, and CO2). – It aims to address a key reason states have not implemented
previous EE/RE State Implementation Plan (SIP) guidance.• AVERT has been thoroughly reviewed, well documented and
tested. EPA has:– Conducted external and internal peer reviews.– Benchmarked AVERT against industry standard electric power
sector model – PROSYM. – Worked with states to beta-tested tool for functionality,
appropriate uses, and clarity of user manual.• AVERT was built to be:
– user friendly– transparent– credible
For more information on EPA’s EE/RE SIP Roadmap visit: http://www.epa.gov/airquality/eere/manual.html.

Emission Quantification Methods Basic to Sophisticated
3
Basic MethodeGRID region non-baseload
emission rates
Sophisticated MethodEnergy Modeling
End use demand
Energy Model
User defined constraints
Technology data
Fuel data
Emission factors
Environmental regulations
Economic parameters
Intermediate Method
Historical hourly emission rates

4
Applications for AVERT-Calculated Emissions• SIP credit in a state’s National Ambient Air
Quality Standard Clean Air Act Plan • Identify cohort of electric generating units
(EGU) “on the margin” compared to baseline• Compare emission impacts of different EE/RE
programs• Understand emission reductions during High
Electric Demand Days• This is not a projection tool, not intended for
analysis more than 5 yrs from baseline4

5
Examples Using AVERT
• The Clean Air Benefits of Wind Energy (AWEA, May 2014)
• Maine Distributed Solar Valuation Study (Maine PUC, March 2015)
• CarbonCountTM Green Bonds Scores (Alliance to Save Energy, March 2015)
• Assessing Emission Benefits of Renewable Energy and Energy Efficiency Programs (U.S. EPA, April 2015)
• U.S. EPA’s Ozone Advance Program - Clark County, NV’s Paths Forward
• DOE’s Online Smart Grid Calculator (PNNL, Fall 2015)• Renewable Portfolio Standard (RPS) Benefits Report
(LBNL and NREL, January 2016)

6
How AVERT Works• AVERT’s Main Module simulates the hourly changes in
generation and air emissions (NOx, SO2, and CO2) atEGU resulting from EE/RE policies and programs.
• User input: MWhs saved from EE programs, or windand solar generation (MW)– Multiple options are built into the tool– EPA provides hourly profiles for some states with on-the-
books EE programs not included in Energy InformationAdministration's Annual Energy Outlook (2013)
• User can retire, add and change emission rates of EGUand re-run simulation using AVERT’s Future YearScenario Template and Statistical Module.

AVERT’s Modules and Data Files
7
Raw Hourly Generation and
Emissions Data from Air Markets Program
(AMP) Dataset
Future Year Scenario Template
User interface for retirements, additions, and
retrofits
Text files
Excel workbook
AVERT: Statistical Module
Inputs AMP data, performs
statistical analysis, outputs
new Regional Data Files
MATLAB Code
Regional Data Files
Contains annual hourly load data
and unit-level statistics on
generation and emissions data
Text files
AVERT Main Module
User interface for creating EE/RE load
curves, performs displaced emissions
analysis, creates output charts
and tables
Excel workbook
Most users will only need to use the Regional Data Files and AVERT Main Module to calculate emissions

8
AVERT’s Data Driven Analysis• AVERT uses a data-driven analysis to distinguish
which EGU respond to marginal changes in load reduction.– AVERT analyzes EGU datasets from EPA’s Air Markets
and Program Data (hourly, unit-by-unit generation & emissions).
• Dataset includes EGUs with capacity of 25 MWs or greater.
– AVERT’s Statistical Module gathers statistics on EGU operations under specific load conditions, and then replicates changes through a Monte Carlo analysis.
– AVERT’s Regional Data Files contain hourly and unit-level emissions and generation data.

9
Part IAVERT Main Module

10
AVERT Main ModuleStep-by-Step Overview
• Enabling Macros• Using AVERT• Step 1. Load Regional Data File• Step 2. Set Energy Efficiency and Renewable
Energy Data• Step 3. Run Displacement• Step 4. Display Outputs

11
AVERT Main ModuleEnabling Macros
• In Windows, AVERT is compatible with Excel 2007 or newer versions.
• On a Mac, AVERT is compatible with Excel 2011.– Only the Main Module has been optimized for Mac.
Other components (e.g., the Statistical Module) require Windows.
• You may want to revert to the default macro settings after using the model. Enabling macros in other Excel files may allow potentially dangerous code to run.
12
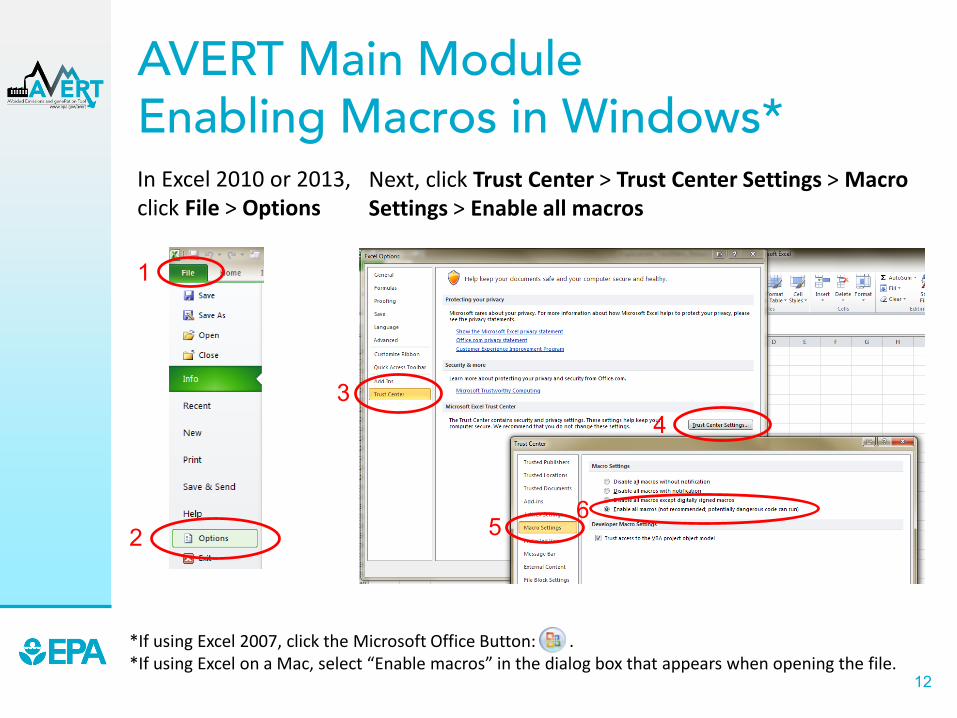
AVERT Main ModuleEnabling Macros in Windows*In Excel 2010 or 2013, click File > Options
Next, click Trust Center > Trust Center Settings > Macro Settings > Enable all macros
*If using Excel 2007, click the Microsoft Office Button: .*If using Excel on a Mac, select “Enable macros” in the dialog box that appears when opening the file.
1
2
34
56

13
AVERT Main Module Using AVERT• Add details about the user, the date, and the EE/RE
program for which displacements are to be estimated. • Click on the button labeled “Click here to begin”.

14
AVERT Main ModuleStep 1. Load Regional Data File
Regions represent relatively autonomous electricity production zones, and are based on electricity market module regions.
Regions include• California• Great Lakes/Mid-Atlantic• Lower Midwest• Northeast• Northwest• Rocky Mountains• Southeast• Southwest• Texas• Upper Midwest

15
AVERT Main ModuleStep 1. Load Regional Data File• Select a region for analysis by either using the
dropdown or clicking the map.– Selecting a region loads
region-specific data for wind and solar capacity factors, and dynamically creates a hyperlink to that region’s data on EPA’s website.
• After selecting a region, click the link under the map to download it from EPA’s website.

16
AVERT Main ModuleStep 1. Load Regional Data File
• In the box labeled “Enter filepath,” double-clickthe blue area to navigate to the location of thedownloaded regional data file.

17
AVERT Main ModuleStep 1. Load Regional Data File
• Click the button under “Load data” entitled:
Clicking this button loads the following information from the regional data file:
– Hourly fossil load– EGU information (e.g., location, fuel type)– Typical EGU performance for generation and emissions at a
given regional load

18
AVERT Main ModuleStep 1. Load Regional Data File• A popup will indicate when the file has finished loading and remind
you how to handle states that are split across multiple AVERT regions.

19
AVERT Main ModuleStep 2. Set EE and RE Data• This page leads you through the process of creating a
load impact profile depicting the load reductions expected from an EE/RE program.

20
AVERT Main ModuleStep 2. Set EE and RE Data• If the hourly load reductions expected from a particular EE/RE
policy, program, or measure are known, a manual stream of load reduction values can be entered for every hour of the year by clicking the “Enter hourly data manually” button.

21
AVERT Main ModuleStep 2. Set EE and RE Data
This page also allows you to estimate a load reduction from basic characteristics:• Reduce fossil-fuel
generation by a percent in some or all hours
• Reduce fossil-fuel generation by total GWh
• Reduce each hour by a constant MW
• Renewable energy proxy• Combination of EE/RE
programs including combining pre-set options with manual entry

22
AVERT Main ModuleStep 3. Run Displacement• Run displacement by selecting the button entitled “Click
here to calculate displaced generation and emissions.”

23
AVERT Main ModuleStep 3. Run Displacement
• This step calculates hourly displaced generation and emissions (SO2, NOX, CO2) for each fossil EGU within the selected region.
• Note that this is a processor-intensive step. When using an older computer, or when analyzing regions with many fossil EGU, this step may take up to ten minutes.

24
AVERT Main ModuleStep 4. Display Outputs
• The data generated in Step 3 are aggregated in two groups of charts and tables in Step 4.

25
AVERT Main ModuleStep 4. Display Outputs
Annual regional displacements• This table displays the total annual generation and emissions as reported for the region
in the base year (“Original”) and as calculated by AVERT’s Main Module after the EE/RE reduction (“Post-EERE”).

26
AVERT Main ModuleStep 4. Display Outputs
Annual displacement data by county• This table presents a summary of the displaced generation and emissions for each of
the counties from each of the states contained within the region. A line for each county containing an EGU is displayed.
For each county, annualoutput statistics are given for:• Peak Gross Generation Post-
EE/RE • Annual Gross Generation Post-
EE/RE • Capacity Factor • Annual Change in Generation • Annual Change in Heat Input/
SO2/NOX/CO2• Ozone Season Change in
SO2/NOX • Ozone Season, 10 Peak Days
Change in SO2/NOX

27
AVERT Main ModuleStep 4. Display Outputs
Displacement data for top ten peak days• This table displays a summary of the ten days in the region featuring the highest level of
fossil fuel load.

28
AVERT Main ModuleStep 4. Display Outputs
Displaced generation and emissions map• This dynamic map allows the user to view where emissions have been displaced within
the selected region. Users can view changes in generation, heat input, SO2, NOX, and CO2.

29
AVERT Main ModuleStep 4. Display Outputs
Displacement data by monthMonthly output can be viewed over the entire region, or a specific state or
, county within the region. • First select region, state
or county in the top dropdown menu.
• If selecting a state, choose the state in the next dropdown menu.
• If selecting a county, choose both the state and the county in the next two dropdown menus.

30
AVERT Main ModuleStep 4. Display Outputs
Hourly displacements by week• This graph displays a dynamic representation of hourly displacement from each EGU in
a region. Individual plants are stacked as gradated bar plots.

31
AVERT Main ModuleStep 4. Display Outputs
Hourly displacements by week• The second figure shows the same week-long load impact profile, but presents the
displaced load in reference to the total fossil-fuel load to illustrate the degree of change represented by the EE/RE program relative to the baseline.

32
AVERT Main ModuleStep 4. Display Outputs
Signal-to-noise diagnostic• This chart is a scatterplot of
every hour of the year, showing calculated total generation reduction in each hour (y-axis) against the user-input EE/RE load reduction in each hour (x-axis).
• Ideally, AVERT perfectly matches unit generation reductions to the amount of EE/RE load reduction requested by the user.
• This graphic shows where that assumption holds, where it does not hold, and to what extent.

33
Part IIAVERT Statistical Module
Operation

AVERT Statistical ModuleOverview• Purpose
– Basis of AVERT analysis– Processes raw CAMD
data to determine behavioral characteristics of fossil-fired EGU
– Returns expected generation and emissions behavior to AVERT Main Module
– Allows users to alter EGU characteristics, retire and add EGU with Future Year Template
• Advanced use of AVERT– Most users will not
require the Statistical Module
– Based in MATLAB– Executable version
available for public use– Requires MATLAB
Compiler Runtime (MCR) to be installed (free from Mathworks)
– Requires Windows• Output file can be used
directly in Main Module
34

AVERT Statistical ModuleObtain Correct Version• AVERT Statistical Module
requires is sensitive to PC specifications.
• 32-bit and 64-bit operating system versions available.
• Obtain correct version of AVERT Statistical Module.
• Obtain correct version of MCR from Mathworks.
• Determine if your Windows system operates in a 32-bit or 64-bit environment.– Find this information in
“properties” of “My Computer” in Windows XP, or “Computer” in Windows Vista, Windows 7, or Windows 8.
– Follow these instructions: http://windows.microsoft.com/en-us/windows7/find-out-32-or-64-bit.
35

36
AVERT Statistical ModuleUnpacking and Startup
• Download the AVERT Statistical Module package.
• Run the executable to decompress the package to three files and three subfolders.
To obtain historic base years, visit http://epa.gov/statelocalclimate/resources/avert-download.html and obtain both the CAMD input file and the Future Year Scenario Template for that same year.

37
AVERT Statistical ModuleFile Structure• AVERT Future Year
Scenarios– Excel-based input files for
altering EGU
• AVERT Output– Statistical Module output
files– These become Main Module
input files
• CAMD Input Files– Processed CAMD data files – New versions expected 2nd
quarter annually
• AVERT_StatMod_2012_v1_64bit– Executable
38
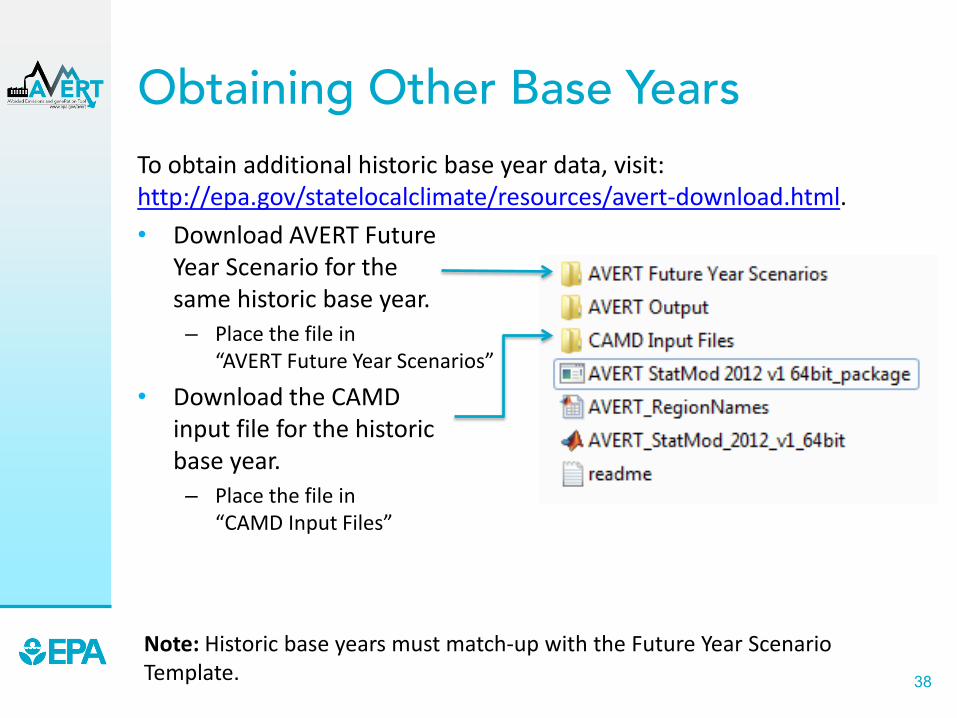
Obtaining Other Base YearsTo obtain additional historic base year data, visit:http://epa.gov/statelocalclimate/resources/avert-download.html.• Download AVERT Future
Year Scenario for the same historic base year.– Place the file in
“AVERT Future Year Scenarios”
• Download the CAMD input file for the historic base year.– Place the file in
“CAMD Input Files”
Note: Historic base years must match-up with the Future Year Scenario Template.

AVERT Statistical ModuleInput Parameters• Higher number of
Monte Carlo (MC) runs reduces noise. – For test runs, use a low
number of MC runs (10) and generation-only MC runs (5).
– For final runs, use a high number of MC runs (1,000) and generation-only MC runs (500).
• Select “Y” to write output and save runs.
Use letters and numbers only. No special characters and no spaces.
39

40
AVERT Statistical ModuleChoose Data File
• Choose base year for analysis.– Data from 2007 through 2015
are available.– New data will be ready by the
second quarter of the next year.• Requires data to be vetted
by EPA and post-processed.

41
AVERT Statistical ModuleChoose Future Year Scenario
• Select either– Saved future year scenario (see slide 41)– Present year analysis
Present year analysis makes no modificationsto the AVERT dataset.– Uses EGU that exist in data year– No changes in emissions rates

AVERT Statistical ModuleChoose Region(s) of Interest
• Choose region (or multiple regions) of interest.
• Same regions as in AVERT Main Module
• Once you hit “OK”, the program will run uninterrupted until completion.– Program returns updated run status on a
regular basis.– Output graphic and file indicate
successful completion.

43
Part IIIAVERT Future Year Scenario Template

AVERT Future Year ScenarioOverview• Purpose
– AVERT is not forward-looking: cannot predict EGU retirements, new additions, or emissions modifications.
– Future Year Scenarios allow users to
• Remove EGU from analysis.
• Include additional proxy EGU.
• Modify emissions characteristics.
• Advanced use of AVERT– Excel spreadsheet– Read into AVERT
Statistical Module• Each spreadsheet
becomes a scenario.– Spreadsheet becomes
input file for AVERT Statistical Module.
– Each future year scenario template is specifically designed to match the same historic base year.
44

45
Use AVERT Future Year Scenarioin Statistical Module
• Obtain Future Year Scenario Template (slides 33-36).
• Modify Future Year Scenario Template (slides 44-46).
• Save Future Year Scenario Template with a meaningful name.
• Run Statistical Module (slides 37-40).– Provide a unique name for the statistical module run
(slide 37).– Choose saved future year scenario (slide 39).

46
AVERT Future Year ScenarioRetires and Modifications
• Find EGU of interest, or filter by state or region.• To retire, select “Yes” in the “Retire?” column.• To change emissions rate, select “Yes” in the “Revise Emissions Rates?” column and
enter new rate(s) in columns I, J, or K.

47
AVERT Future Year ScenarioAdditions
In order1. Select region2. Select fuel type3. Select generator type
4. Select specific EGU (unit)Description will appear about EGU type automatically.

48
AVERT Future Year ScenarioAdditions
• Choose proxy unit capacity (will scale all other factors)• Choose state (within region)• Choose county (within region)• Save file

Use AVERT Future Year Scenarioin Statistical Module
• Run Statistical Module (slides 37-40).
• Provide a unique name for the statistical module run (slide 37).
• Choose saved future year scenario (slide 39).
49

50
For More Information
• Visit the AVERT website at www.epa.gov/avert. • Contact EPA’s State and Local Climate and
Energy Program at [email protected].