Embed Size (px)
Citation preview

AVANTI MINING INC.
KITSAULT MINE
February 2012

2
This presentation contains certain forward-looking information concerning the business of Avanti Mining Inc. (the “Corporation”). All statements, other than statements of historical fact, included herein including, without limitation; anticipated dates for receipt of permits and approvals, construction and production, and other milestones; anticipated mine design or life of mine; anticipated results of drilling programs, feasibility studies and other analyses; estimated timing and amounts of future expenditures, and the Corporation’s future production, operating and capital costs, internal rate of return, tax rates, anticipated timing to pay back capital investments, operating or financial performance, potential taxes to be paid and potential jobs created are forward-looking statements. These forward-looking statements are based on the opinions of management at the date the statements are made and are based on assumptions and subject to a variety of risks and uncertainties and other factors that could cause actual events to differ materially from those projected in forward-looking statements. Important factors that could cause actual results to differ materially from the Corporation’s expectations include fluctuations in commodity prices and currency exchange rates; uncertainties relating to interpretation of drill results and the geology, continuity and grade of mineral deposits; uncertainty of estimates of capital and operating costs, recovery rates, production estimates and estimated economic return; the need for cooperation of government agencies and native groups in the exploration and development of properties and the issuance of required permits; the need to obtain additional financing to develop properties and uncertainty as to the availability and terms of future financing; the possibility of delay in exploration or development programs or in construction projects and uncertainty of meeting anticipated program milestones; uncertainty as to timely availability of permits and other governmental approvals; and other risks and uncertainties disclosed in the Corporation’s Annual Information Form dated July 2, 2010, which is available at www. Sedar.com. The Corporation is under no obligation to update forward-looking statements if circumstances or management’s opinions should change, except as required by applicable securities laws. The viewer is cautioned not to place undue reliance on forward-looking statements. This presentation may also contain future-oriented financial information (“FOFI”) and information which could be considered to be in the nature of a “financial outlook”. Such FOFI or financial outlook was approved by Management as of the date of presentation for the purpose of providing Management’s reasonable estimate of what return investors might expect to earn based on the assumptions set forth in such estimates and the information may not be appropriate for other purposes. Management cautions that such FOFI or financial outlook reflects the Corporation’s current beliefs and are based on information currently available to the Corporation and on assumptions the Corporation believes are reasonable. Actual results and developments may differ materially from results and developments discussed in the FOFI or financial outlook as they are subject to a number of significant risks and uncertainties. Certain of these risks and uncertainties are beyond the Corporation’s control. Consequently, all of the FOFI or financial outlook are qualified by these cautionary statements, and there can be no assurances that the actual results or developments will be realized or, even if substantially realized, that they will have the expected consequences to, or effect on, the Corporation. This presentation uses the terms “proven and probable reserves”, “measured resources”, “indicated resources” and “inferred resources”. The Company advises readers that although these terms are recognized and required by Canadian regulations (under National Instrument 43-101 Standards of Disclosure for Mineral Projects (“NI 43-101”)), the United States Securities and Exchange Commission does not recognize resources. Readers are cautioned not to assume that any part or all of the mineral deposits in these categories will ever be converted into reserves. In addition, “inferred resources” have a great amount of uncertainty as to their existence, and economic and legal feasibility. It cannot be assumed that all or any part of an inferred mineral resource will ever be upgraded to a higher category. Under Canadian rules, estimates of inferred mineral resources may not form the basis of feasibility or pre-feasibility studies, or economic studies, except for a Preliminary Assessment as defined under NI 43-101. Investors are cautioned not to assume that part or all of an inferred resource exists, or is economically or legally mineable. THIS PRESENTATION IS NOT AN OFFER TO PURCHASE SECURITIES AND DOES NOT CONSTITUTE AN OFFERING DOCUMENT UNDER SECURITIES LEGISLATION. ANY UNAUTHORIZED DISSEMINATION OR USE OF THIS PRESENTATION IS STRICTLY PROHIBITED.
CAUTIONARY STATEMENT REGARDING FORWARD-LOOKING INFORMATION

Management of Avanti
3
• 32 years exploration and development experience • Previously executive positions with Gold Fields, Metallica Resources and Lac Minerals • Director of New Gold and Golden Star
• 35 years mining financial experience • Previously with Denison Mines, Vista Gold, EuroZinc and Centenario Copper • Director of Explorator
AJ Ali CFO
• Former COO of Thompson Creek Mining • 30 years experience in operations and project development with Rio Algoma Ltd. and Coeur d’Alene Mines
Kenneth Collison SVP Project Development
• Registered Professional Biologist in British Columbia • 15 years experience in environmental assessment • Current VP Environment and Permitting Copper Fox Metals Inc.
Shane Uren VP Environ & Permitting
• 23 years in construction & project management in Canada, Australia , Africa, Peru & Bolivia • Managed projects for Pan Am Silver, Vale Inco, Placer Dome, Kinross Falconbridge and most recently for Thompson Creek
Joe Sangiuliano Project Director
Directors & Strategic Advisors Board of Directors
Strategic Advisors
James Arnold Peter Barnes Ryan T Bennett Robert Cross Craig J Nelsen Mark A Smith
30 years exploration and development experience
Previously with Gold Fields, Metallica Resources, Lac Minerals
Director of New Gold and Golden Star
Former President and CEO of Silver Wheaton Corp
Previously Exec VP and CFO of Goldcorp and CFO Silver Wheaton Minerals
Founder, Chairman of Bankers Petroleum Ltd
Ex-Chairman of Northern Orion Resources Inc
Director of B2 Gold
Partner, Resource Capital Fund
Previously with NM Rothschild & Sons
Presently CEO and Director of Molycorp Minerals LLP
Previously President of Chevron Mining Inc and Unocal with long association to the Questa Mo mine
SVP and COO Romarco Minerals Inc
Previously VP Colorado Operations with Freeport McMoRan in charge of Henderson Mine and Climax Project
Pierre Lassonde
Chairman Franco-Nevada
Former Vice-Chairman Newmont Mining, Chairman of the WGC;
Former President Newmont Mining Corp, Co-CEO of Franco-Nevada, President & CEO of Euro-Nevada Mining and Director of Normandy Mining
Chris Thompson
Director of Teck-Cominco and Golden Star
Former Chairman & CEO of Gold Fields and Chairman of the WGC
Founder of Castle Group and Ventures Trident and Emerging Markets Gold Funds
4
Ed Flood
Chairman of Western Uranium Corporation, Director of Asian Gold Corp, and Director of Jinshan Gold Mines
Former Deputy Chairman and President of Ivanhoe Mines and Director of Ivanhoe Energy

One of the top five primary moly development assets in the world
Kitsault Highlights
5
High-Grade Resource
Existing Infrastructure Past Producer
Advanced Discussions with
Local Communities
Rapid Development Plan
Over 30 Years of Environmental and Reclamation Data

Location of Kitsault Mine
6
Terrace
Stewart
Prince
Rupert
Smithers
Ketchikan
Shortest Ocean route to Asia
Nisga’a
Lands

Kitsault Mine – Current view

Kitsault Land Map
8

Mineral Claims and Leases
9
X Hoan North
X Hoan South
X Nimble

Kitsault Reserves
10
Contained Mo(MLb)
Proven 69.7 0.097 148.5Probable 162.8 0.075 267.3Total Proven and Probable 232.5 0.081 415.8
Category Tonnage (Mt) Mo (%)
Notes:
1. Mineral ReservesThe Kitsault mine Mineral Reserves have been prepared in accordance with NI 43-101 standards and CIM Definition Standard (2010). This statement has been prepared by Mr. Ryan W. Ulansky (P.Eng.) of AMEC, a QP as defined in NI 43-101.
2. Mineral Reserves are defined within a mine plan, with pit phase designs guided by Lerchs–Grossmann (LG) pit shells, and reported at a 0.026% Mo cut-off grade, after dilution and mining loss adjustments. The LG shell generation was performed on measured and indicated materials only, using a molybdenum price of Cdn$13.58/Lb, an average mining cost of Cdn$1.94/t mined a combined ore based cost of Cdn$5.84/t milled, and a selling cost of $1.24 /lb of Mo sold. Metallurgical recovery used was a function of the head grade, defined as Recovery =7.5808*Ln (Mo %) +108.63 with a cap applied at 95%. Overall pit slopes varied from 42 to 48 degrees.
3. Dilution and Mining loss have been accounted for based on a waste neighbour analysis. 1.5Mt of measured and indicated material above cut-off was routed as waste. 1.9Mt of measured and indicated material below cut-off has been included as dilution material. An additional 0.2Mt of inferred dilution material with grades set to zero is included in the mine plan as mill feed.
4. Tonnages are rounded to the nearest 1,000 tonnes, grades are rounded to three decimal places for Mo. 5. Rounding as required by reporting guidelines may result in apparent summation differences between tonnes, grade and contained metal
content. 6. Tonnage and grade measurements are in metric units; contained molybdenum is in imperial pounds. 7. The life of mine strip ratio is 0.77.

Resources
Kitsault Deposit 43-101 Compliant Resources* – November 8, 2010
Historical Resources Grade Contained Metal
Mo Mo mm tonnes % mm lbs
Kitsault Mine Proven and Probable Reserve 104.3 0.120% 275.4 Amax 1985 10K and BC Minfile Report Bell Moly Unclassified Amax Resource 96.4 0.054% 115.1 Amax Jan 1979 report
Roundy Creek Unclassified Resource 7.0 0.066% 16.9 Woodstock and Carter, CIM Sp 15, 1976
Sunlight Zone 0.04 0.401% 0.3 Woodstock and Carter, CIM Sp 15, 1976
Sunshine Zone 1.35 0.208% 6.2 Woodstock and Carter, CIM Sp 15, 1976
Source
Included in Roundy Creek
Deposit Ore Resource Classification
Note: Historic resource estimates do not comply with the CIM terminology under Canadian Securities Administrators NI 43-101 guidelines. The reader is cautioned that these estimates are not mineral reserves and should not be relied upon. Avanti considers these resources as relevant and they were reported by Dr. Roger C. Steininger, CPG an independent qualified person (QP) under 43-101, in the above report. Dr. Steininger is responsible for the technical aspects of these historical resources and all other information excluding resources in the Aug 5, 2008 43-101 Technical Report on Resources.
11
Category Volume Density Tonnage Mo** Mo Ag AgMm3 g/cm3 Mt % MLb Ppm Moz
Measured 27.6 2.65 73 0.093 150.3 4.28 10Indicated 84.9 2.66 225.8 0.065 322.2 4.17 30.3Measured + Indicated 112.4 2.66 298.8 0.072 472.5 4.2 40.3Inferred 58.8 2.66 157.1 0.05 172.2 3.65 18.4
*Mineral resources are inclusive of mineral reserves. Mineral resources are not mineral reserves and do not have demonstrated economic viability. All figures have been rounded to reflect the relative accuracy of the estimates. The cut-off grades are based on metal price assumptions of CND$15.62/lb of molybdenum, and a metallurgical recovery of eighty-nine percent of molybdenum. Silver was not used in the pit optimization. The resource estimate was prepared under the supervision of Greg Kulla, P.Geo, an independent Qualified Person (QP), as this term is defined in NI 43-101.
**Reported as a cut-off grade of 0.021% Molybdenum contained within a potentially economically mineable open pit. Cost for this pit included Process cost of CND$5.84/t and selling cost of CND$1.24/lb

Feasibility Study Results
12
High-grade mine with a 16
year life
232.5 million tonnes of Reserves
Grading 0.081% Mo (First five years averages 0.101% Mo)
374 million pounds of Molybdenum produced (23.4 million pounds/yr) (First five years average 29.6 m lb/yr)
Strip Ratio of 0.77:1
Averaging 40,000 tpd
Metallurgical Recovery average 89.9%

Feasibility Study Financial Results
13
Positive Economics at
an average LOM moly price of
$16.76/lb
Capital Costs of US$795 million (CND$837 million)
Operating Costs (Mine Site) of US$4.76/lb of payable Mo – Total Cost of US$5.47/lb
After tax NPV (8%) = US$774 million
IRR of 26.3%
After tax net cash flow of US $1.94 billion
Pay back in 2.7 years
300 direct jobs during operations Up to 700 jobs during 2 year construction

14
Benefits to Canada
At FS price assumptions generates $6.3 billion of export credit to Canada
Pays over $1.2 billion in federal and provincial taxes
Provides 300 full time, high paying jobs for 16 year mine life – project has the potential to grow
Provides 700 full time high paying construction jobs for 2 years
Using estimated multiplier would create about 700 additional jobs in region

TMF Design Site Water Balance
Reclamation ARD Assessment Pit Geotechnical
Strategic Planning First Nations Consultation
Indigenuity Consulting
Group Incorporated
) EA Working Group Treaty Consultation
Environmental Assessment
EA Participants
Lead Engineer & EA
15
Lenders Independent Engineer
Debt Advisor/ Arranger

Site Arrangement
16
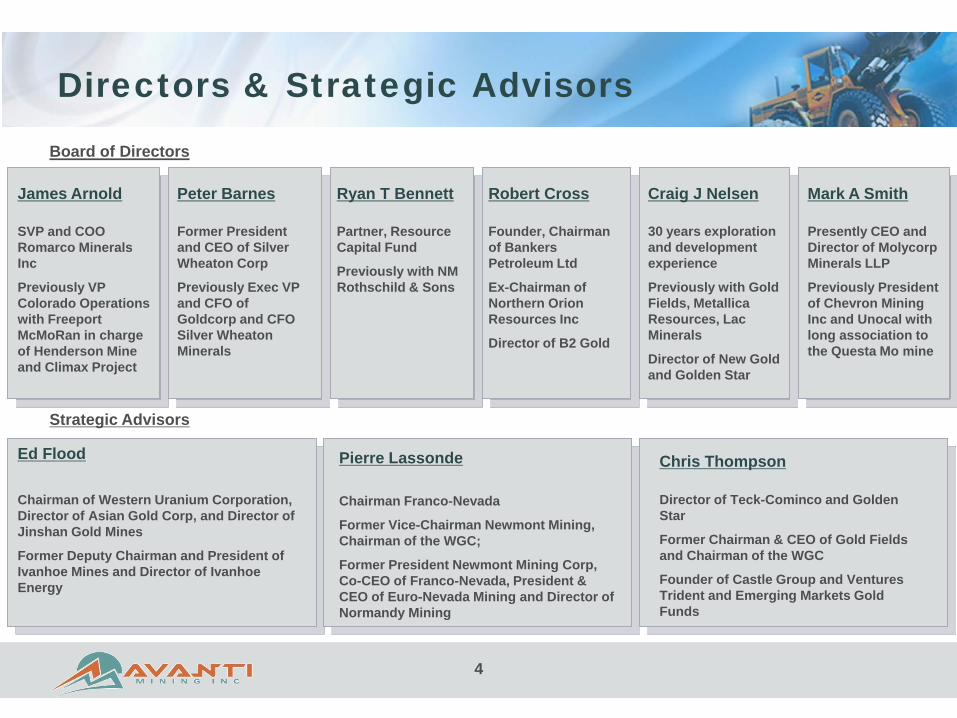
3-D View at Completion of Mining
17

POST FEASIBILITY STUDY UPSIDE Silver bi-product revenue - test work completion in Q1, 2012 Kitsault deposit:
• Potential resource extension – 10,000 meters Drilling in 2011 • Convert inferred material - Long term
Roundy Creek deposit: • Historical high grade resource • 2010 drilling very encouraging – 81 meters @ 0.38% Mo from surface – confirmed by 2011
drilling • 2,400 meters additional drilling completed for potential upgrading to 43-101 level resource
Bell Moly • Historical medium grade resource • In 2010 recovered old core and re-sampled 20% of core during year • Average grade at 0.05% Mo is similar to Endako Mine. • Drilling planned for 2016 with additional environmental work required because Clary Creek
drainage basin is fish bearing
18

2010 2011 2012 2013
Estimated Project Timeline
Env Baseline Data
Feasibility Study
EA Process/Permitting
Financing – Detail Eng
Construction
Start-Up
19
EA App EA Cert
Began in 2008 – data back to 1980
2014
Construction Permits

Kitsault Financing Strategy
Require $800 million total funding Debt target 70% or $560 million - West LB arranger:
• Six financial institutions contacted by West LB • All six expressed interest in participating in the project finance • Lending proposals aggregate $800 million • Cost over run standby facility of $80 million
Equity target 30% or $240 million. Sourced from: • Strategic partnership discussions with Asian Industrial companies • Another Asian Steel maker interested in 10% off take • Public equity if necessary
20
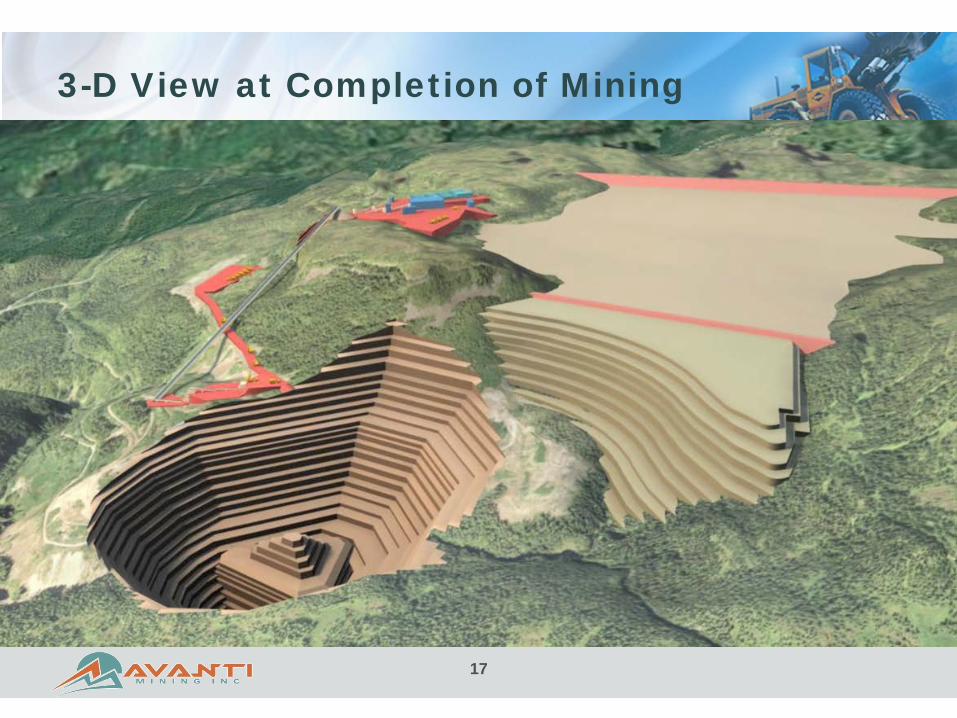
1 Projected cash costs as of January 2007 Freeport Press release2 Based off of November 2009 Preliminary Economic Assessment. TMO output is reported in molybdenum metal content. 3 On hold awaiting higher prices; Based off of 2008 feasibility study.
8 Based off of the December 2010 Feasibility Study on Kitsault9 Data based on 2008 scoping study of Dala Mining's parameters of the south site only. Soviet era-drill estimates.10 Based on December 2007 bankable feasibility study
Source: MEG, company documents and CPM Group
Note: Does not include sustaining capital.
4 Based off of the December 2010 Preliminary Economic Assessment on El Creston
7 Life of mine production. Costs during the first five years are $5.29, based on $80 per barrel oil. LOM Costs in the August 2007 Feasibility Study were $6.05, however this was based on $120 per barrel oil. Low grade material between the mill cutoff and a breakeven cutoff is stockpiled for later processing in years 32 through 44.
5 Based on April 2008 Feasibility. Life of mine data. Low grade material between the mill cutoff and a breakeven cutoff is stockpiled for later processing in years 24 through 33.6 Includes company's estimated initial capital cost reduction from the acquisition of the Osborne complex. Exchange rates for initial capital costs as 26 July 2011.
11 Based on Updated Technical Report, August 2009. The average operating cost LOM, before royalties and netbacks (logistical & roasting costs), and after crediting by-product credits, is estimated at US$8.30/lb for the 10 Mt/a Case.
Estimate of Long Term Molybdenum Prices for Select Primary Development Projects
21
Project
Cash Cost (Net By-product Credits
US$/lb Mo) Initial Capital Cost (M US$)
Mine life (Years)
Annual Mo Production
(M lbs.)
Long-term Mo price needed for 15% IRR
(US$/lb) Climax1 3.50 700 20 30.0 7.22 Cumo2 7.41 2,200 40 25.0 20.66 Davidson3 9.46 107 10 4.5 14.19 El Creston4 4.12 656 13 23.9 9.03 Liberty5 7.15 492 33 15.8 13.34 Merlin6 3.16 240 9 11.7 7.45 Mount Hope7 5.29 1,039 44 25.5 11.41 Kitsault8 4.76 770 16 23.4 10.26 Koktenkol9 4.40 598 26 26.9 7.82 Ruby Creek10 9.75 549 21 10.0 18.44 Spinifex11 8.30 720 24 10.8 18.65
0
4
8
12
16
20
24
Long-term Mo price needed for 15% IRR (US$/lb)
CPM Group
Development Project Comparison

Moly and Steel Consumption
22
0
50
100
150
200
250
300
350
400
450
500
550
0
200
400
600
800
1,000
1,200
1,400
1,600
1,800
2,000
1900 1912 1924 1936 1948 1960 1972 1984 1996 2008
Steel Demand (LHS)
Molybdenum Mine Production (RHS)
Million mt Million lbs.
Post War Industrialization / Japan
Emerging Economies/ China
Apparent Steel Consumption and Molybdenum Mine Production
1900 - 2012p
CPM Group

Moly Market Supply
23
0
100
200
300
400
500
600
700
800
900
0
100
200
300
400
500
600
700
800
900
1985 1990 1995 2000 2005 2010 2015p 2020p
Primary
By-Product
Million Lbs. Million Lbs.
Mine Production of Molybdenum
Annual, Projected through 2020p
Actual Production Projected Production
Other
CPM Group

Moly Market Supply-Demand
24
0
7
14
21
28
35
42
-40
-20
0
20
40
60
80
1995 1998 2001 2004 2007 2010 2013p 2016p 2019p
US$/Lb. Million Pounds
Real Molybdenum Prices (RHS)
Deficit (LHS)
Surplus (LHS)
Actual Projections
Real Molybdenum Prices and World Supply and Demand Balance Annual, Projected through 2020p
CPM Group

China’s declining future Moly supply
0%
20%
40%
60%
80%
100%
Avg (1986 - 1990) Avg (1991 - 1995) Avg (1996 - 2000) Avg (2001 - 2005) Avg (2006 - 2010) Avg (2011p - 2015p)
Chinese Share of Total Growth
Contribution to Growth in Total Mo Supply from China is Declining
CPM Group
25

RCF36%
MAN & BOARD8%
PUBLIC43%
SeAH13%
Capital Structure of “AVT” (TSX-V)
26
425.8 million shares outstanding 524.3 million fully diluted (excluding convert)
─ 19.9 million options at C$0.10 to C$0.56 ─ 78.4 million warrants at C$0.20 to C$0.27
US $5 million convertible debenture ─ converts into units (1 share + ½ warrant) at C$0.20 ─ warrant strike price C$0.27 ─ payable any time but matures on June 15, 2012 ─ would result in 37.5 million additional share at C$ at par ─ 561.5 million post convertible debenture
C$5 million bridge loan maturing April 15, 2012 C$ 4.8 million Cash on hand at December 31, 2011 C$ 19.7 million Cash from ITM Options and Warrants

Conclusion
High-quality, world class deposit that can be quickly developed
Catching up to major projects that have been curtailed
Robust economics
Well known mining jurisdiction
Advanced discussions with local communities
Proven management and board of directors
27

www.avantimining.com
TSX-V: AVT