Embed Size (px)
Citation preview

www.parliament.uk/commons-library | intranet.parliament.uk/commons-library | [email protected] | @commonslibrary
BRIEFING PAPER
Number CBP-8422, 23 October 2018
Autumn Budget 2018 By Matthew Keep Philip Brien Daniel Harari Steven Kennedy Andy Powell
Contents: 1. Economic situation 2. The outlook for the public
finances 3. Public spending from 2020/21 4. Developments since Spring
Statement 2018 5. Other issues 6. Next steps

2 Autumn Budget 2018
Contents Summary 4
1. Economic situation 6 1.1 Recent growth performance 6 1.2 Consumer spending growth has slowed 8 1.3 Net trade boosted growth in 2017, but export growth has slowed in 2018 9 1.4 Investment has fallen in 2018 10 1.5 Inflation remains at over 2%. Interest rates rose in August 12 1.6 Employment is historically high 14 1.7 Productivity growth has been weak over the past decade 16 1.8 Most forecasters expect growth of between 1.3% and 1.5% in 2018 17
2. The outlook for the public finances 20 2.1 Borrowing is at relatively normal levels… 20
…and is forecast to fall further… 20 …largely through relative falls in public spending 21 Borrowing so far in 2018/19 has been relatively low 21
2.2 The current budget has reached a surplus 24 2.3 Public sector net debt remains high…. 25
…and higher than the EU average, but lower than four G7 nations 25 2.4 The Government has targets for the public finances 26
3. Public spending from 2020/21 30 3.1 The Chancellor will set out total public spending for 2020 and beyond… 30 3.2 …and allocate spending to departments in the 2019 Spending Review 30 3.3 What’s the current outlook for spending? 31
The end of austerity? 34
4. Developments since Spring Statement 2018 36 4.1 Government has announced more funding for NHS England 36
How could it be paid for? 37 4.2 Fuel duty will be frozen in April 2019 for the ninth year 40 4.3 Councils will be able to borrow more to build homes 40 4.4 A change to National Insurance contributions for the self-employed has been
cancelled 41 4.5 ONS classification changes will have a small impact on the public finances 41 4.6 Government asset sales have reduced debt a little 42
5. Other issues 43 5.1 Universal Credit 43 5.2 The Government’s pledge to increase income tax thresholds by April 2020 46 5.3 Off-payroll working in the private sector may be addressed 47 5.4 A report on planning permissions and buildings is expected 48 5.5 Consultation on taxes and tourism in Northern Ireland: outcome expected 48 5.6 The Chancellor may address how the digital economy is taxed 48 5.7 Fourth year of working-age benefits freeze 48
6. Next steps 50
Appendix 1: Sources of further information 52
Appendix 2: Economic and public finance data 1979-2022 53

3 Commons Library Briefing, 23 October 2018
Contributing Authors: Philip Brien, public spending Daniel Harari, economic situation Steven Kennedy, Universal Credit Andy Powell, labour market
Attribution: Autumn colours at Westminster by Manish Prabhune. Licensed by CC BY 2.0 / image cropped.

4 Autumn Budget 2018
Summary This briefing sets out the background to Autumn Budget 2018 which will take place on Monday 29 October. The Office for Budget Responsibility (OBR) will publish revised forecasts for the economy and public finances on the same day.
Economic situation (section 1) Economic growth recovered over the summer following a below-par start to the year. Severe winter weather had resulted in lower construction sector output and weaker retail sales, while the hot summer weather was a factor in the growth rebound. The underlying economic performance is less positive – annual GDP growth rates of between 1% and 1.5% remain below those of recent years and lower than in many other large advanced economies.
Recent economic growth mostly reflects the subdued performance of consumer spending, traditionally the main driver of UK economic activity. The squeeze in household budgets following last year’s rise in inflation, principally due to the fall in the pound after the EU referendum, continues to dampen the spending outlook. Other parts of the economy are not providing much support to growth, with investment stalling and export growth slowing sharply in 2018 after a robust performance in 2017.
Tentative signs of accelerating wage growth in recent months, combined with forecasts of lower inflation heading into 2019, could boost household incomes. The labour market remains strong with the unemployment rate at a 40+-year low and the proportion of the working-age population in work near record highs.
The outlook is marked by uncertainty over Brexit negotiations. Most economic forecasts, including those of the Office for Budget Responsibility, are premised on a withdrawal deal between the UK and EU being agreed. This would result in a transition period after Brexit whereby the UK remains in the EU single market and customs union. Should the UK leave the EU without a deal, economic conditions may be very different, with the OBR warning that a disorderly Brexit “could have a severe short-term impact” on the economy.
Public finances Borrowing and debt (section 2)
Government borrowing – the difference between public spending and income raised from taxes and other sources – is at a relatively normal level, having decreased from the peaks reached following the financial crisis. At 1.9% of GDP, borrowing in 2017/18 was below the average for the past 70 years. The OBR expects borrowing to fall further over the next five years, largely from government controls over day-to-day public spending.
Borrowing over the first half of 2018/19 has been lower than expected which may lead the OBR to lower its underlying borrowing forecast. If the OBR believes that some of the improvement in borrowing is permanent, and not due to temporary factors, it will also lower its forecast for future years.
While the situation for government borrowing looks positive, government debt – broadly speaking, the stock of past borrowing – remains high at 85% of GDP. The debt-to-GDP ratio was last above 85% in the mid-to-late 1960s, when it was still recovering from reaching over 200% of GDP during World War II. The OBR has forecast gradual falls in the debt-to-GDP ratio over the coming years, but by 2022/23 it expects the debt-to-GDP ratio to still be not far under 80%.

5 Commons Library Briefing, 23 October 2018
The OBR’s forecasts assume that Brexit negotiations lead to an orderly transition to a new long-term relationship with the EU. A less orderly outcome will likely have a negative impact on the public finances.
Public spending plans (section 3)
In the Budget, the Chancellor is expected to set out his plans for total public spending in 2020 and beyond. This spending will then be divided amongst departments at the 2019 Spending Review.
Current spending plans, pencilled in at Autumn Budget 2017, see total public spending increasing in real terms (ie adjusted for inflation) a little year-on-year until 2022/23. However, not all areas of public spending are forecast to follow the same trend. While departments’ capital spending and demand-driven spending, such as welfare, are set to increase or remain flat, departments’ day-to-day spending on public services is forecast to decrease in most years to 2022/23.
In her recent speech to the Conservative Party Conference, the Prime Minister signalled that austerity is to be brought to an end, with details to be set out at the 2019 Spending Review. There is no single definition of austerity, but the term is often used to describe recent reductions in day-to-day spending on public services. The Chancellor will have to increase day-to-day spending, compared with current plans, to prevent future real terms (adjusted for inflation) falls in such spending. However, this may not be enough to end austerity on other definitions of the term.
If the Government were to accept that additional spending is required to end austerity, this may conflict with its targets for reducing and eventually eliminating the deficit, and its pledge to keep taxes as low as possible.
Developments since Spring Statement 2018 (section 4) Since Spring Statement 2018, for the public finances the most significant Government announcement has been additional funding for NHS England. The NHS is to receive a funding increase worth around £20 billion in real terms by 2023/24 and the Chancellor is expected to set out how this will be paid for in the Budget. Respected think tanks are expecting the funding pledge to be met through a mix of borrowing and higher taxes. Indeed, both the Prime Minister and the Chancellor have hinted that the Budget is likely to feature some tax rises. However, it seems likely that the OBR will lower its underlying forecasts for borrowing, potentially giving the Chancellor more scope to borrow to fund the increased NHS spending.
In a move that will lower tax revenues by around £900 million, the Prime Minister announced that fuel duty will be frozen, for the ninth year, in April 2019.
Other things: Universal Credit (section 5) The Chancellor has been coming under pressure to provide additional funding for Universal Credit. As the roll-out of the new system – which is replacing means-tested benefits and tax credits for working-age households – continues, concerns have been raised about the substantial losses some families could experience on moving from legacy benefits to Universal Credit.
Further information The Library will publish its summary of UK Economic Indicators before the Budget.
Look out for Autumn Budget 2018 related ‘Insights’ on the Library’s website.

6 Autumn Budget 2018
1. Economic situation
Summary
Economic growth recovered over the summer following a below-par start to the year. Severe winter weather had resulted in lower construction sector output and weaker retail sales, while the hot summer weather was a factor in the growth rebound. The underlying economic performance is less positive – annual GDP growth rates of between 1% and 1.5% remain below those of recent years and lower than in many other large advanced economies.
Recent economic growth mostly reflects the subdued performance of consumer spending, traditionally the main driver of UK economic activity. The squeeze in household budgets following last year’s rise in inflation, principally due to the fall in the pound after the EU referendum, continues to dampen the spending outlook. Other parts of the economy are not providing much support to growth, with investment stalling and export growth slowing sharply in 2018 after a robust performance in 2017.
Tentative signs of accelerating wage growth in recent months, combined with forecasts of lower inflation heading into 2019, could boost household incomes. The labour market remains strong with the unemployment rate at a 40+-year low and the proportion of the working-age population in work near record highs.
The outlook is marked by uncertainty over Brexit negotiations. Most economic forecasts, including those of the Office for Budget Responsibility, are premised on a withdrawal deal between the UK and EU being agreed. This would result in a transition period after Brexit whereby the UK remains in the EU single market and customs union. Should the UK leave the EU without a deal, economic conditions may be very different, with the OBR warning that a disorderly Brexit “could have a severe short-term impact” on the economy.
1.1 Recent growth performance Economic growth so far in 2018 can be divided into two parts. Over the first few months of the year economic activity was weak. This was partly due to severe winter weather and the negative impact this had, in particular on the retail and construction sectors. The result was GDP growth of only 0.1% in the three months to March 2018 compared with the previous three-month period.1
Strong recoveries in the retail and construction sectors subsequently supported a pick-up in GDP growth in the spring and summer. A combination of the hot and sunny weather and the football World Cup boosted spending on food and drink, while the construction sector posted robust gains. In addition, the information and communications sector provided a strong contribution to overall growth, as did manufacturing (although its underlying performance is not as strong).
GDP growth was 0.4% in the three months to June and accelerated to 0.7% in the three months to August (based on new monthly estimates of GDP).2 This most recent figure is somewhat flattered by the period of 1 ONS, GDP monthly estimate, UK: August 2018, 10 October 2018 2 The ONS introduced a new monthly GDP estimate in July 2018. Previously GDP had
only been published quarterly. For more on this change see Library briefing paper, How GDP statistics are changing from July 2018
Economic growth was weak over the beginning of 2018, but picked up in the spring and summer.

7 Commons Library Briefing, 23 October 2018
comparison, which includes the snow-hit months of February and March.
Despite the improved short-term picture in recent months, the underlying growth performance is not as strong. GDP growth rates compared with the year before have been slowing in recent years. After a post-2008/09 recession peak of around 3% in 2014, growth subsided to around 2% in 2016 and then further to 1½% by the end of 2017.3 It has slowed a little further in 2018: it was 1.2% in the second quarter (Q2) of 2018.4
It’s worth noting that the slowdown since 2016 came at a time when comparable large advanced economies were seeing growth accelerate. For instance GDP growth in the Eurozone picked up in 2017 supported by improved global economic conditions and steps taken by the European Central Bank to stimulate the economy. Growth in the Eurozone has slowed a little in 2018 and was 2.2% higher in Q2 2018 compared with a year before. Growth in the US has accelerated over the past two years reaching 2.9% in Q2 2018.5
3 ONS, year-on-year percentage change in real GDP (quarterly series), series IHYR 4 These figures are based on the quarterly national accounts estimates of GDP, which
are calculated slightly differently to the monthly GDP release 5 OECDstat, GDP growth [accessed 19 Oct 2018]
0.0
0.2
0.4
0.6
0.8
Q1 Q2 Q3 Q4 Q1 Q2 Q3 Q4 Q1 Q2 Jun-Aug*
Source: ONS, series IHYR and ED3H *rolling three-month growth estimate
2017 20182016
2018 GDP growth recovered after weak start to year% change in GDP compared with previous quarter
0
1
2
3
4
2013 2014 2015 2016 2017 2018Source: ONS, series IHYR, quarterly national accounts series
GDP growth has slowed in recent years% change in GDP compared with previous year
Underlying growth rates have been slowing in recent years.
Growth has slowed at a time when other advanced economies have seen faster growth.

8 Autumn Budget 2018
1.2 Consumer spending growth has slowed The growth slowdown in the past couple of years has largely been a result of weaker consumer spending, which accounts for nearly two-thirds of GDP and is traditionally the main driver of UK economic growth. Consumers have been hit by rising inflation and subdued pay rises.
Rising import prices caused by declines in the value of the pound, most notably after the result of the 2016 EU referendum, helped push inflation higher. This squeezed household budgets and led to consumer spending growth slowing markedly over the course of 2017 and into 2018, from annual growth of around 3% to 1.6% in the second quarter of 2018.6
Despite this summer’s slightly more upbeat performance, the overall consumer environment remains subdued. The squeeze on budgets has alleviated somewhat compared with a year ago, as average wage growth picks up and inflation subsides gradually, but household income growth is still modest at present.
Other sources that have in the past provided support to consumer spending seem less likely to do so in the near future. The savings rate –
6 ONS, year-on-year percentage change in household expenditure, series KGZ7
0.0
1.0
2.0
3.0
2016Q1
Q2 Q3 Q4 2017Q1
Q2 Q3 Q4 2018Q1
Q2
Source: OECDstat
UK GDP growth has fallen behind the Eurozone and USYear-on-year % change in GDP
UK
Eurozone
US
0
1
2
3
4
2013 2014 2015 2016 2017 2018Source: ONS, series KGZ7
Consumer spending growth slowed sharply in 2017% change on previous year
Household budgets have been squeezed and consumer spending growth – normally a key driver of economic growth – has slowed.

9 Commons Library Briefing, 23 October 2018
the proportion of income not spent – fell sharply during 2016 and 2017 from 10% to 4%, propping up spending.7 It seems unlikely that at such low levels – among the lowest on record – consumers would reduce savings rates much further.
Another source is borrowing. Consumer credit has in recent years seen double-digit growth as low interest rates (making borrowing cheap) and the surge in popularity of car finance increased demand for loans. (Growth in the vastly larger mortgage lending market was and remains much more modest.) More recently, however, growth in consumer credit has slowed. In addition, the Bank of England has raised interest rates (see section 1.5). The moves so far have been limited, but the Bank has communicated that rates are likely to go up gradually.8
Average wage growth has shown tentative signs of improvement in recent months. With most forecasters expecting inflation to ease heading into next year (more on both earnings and inflation below), this could provide a boost to household incomes in 2019.9
Another issue to consider is the potential impact of uncertainty related to how the UK leaves the EU on 29 March 2019. Consumers may become more cautious should uncertainties continue in the run up to Brexit day. These could be amplified should the UK exit the EU without a withdrawal agreement. However, predicting consumer sentiment is difficult at the best of times and even more so given the complexities of the Brexit negotiations.
1.3 Net trade boosted growth in 2017, but export growth has slowed in 2018
The impact of weaker consumer spending on GDP growth was mitigated to some extent by a positive contribution from net trade. This means that the increase in exports was greater than the increase in imports. In 2017, net trade boosted GDP growth by 0.7 percentage points – a rare event for the UK economy and its first positive impact since 2011.10 Overall GDP growth was 1.7%.
The improvement in net trade in 2017 was a result of strong growth in exports, supported by a resurgent world economy and past declines in the value of the pound (which made UK exports more price competitive internationally), particularly after the EU referendum. In 2017, exports rose by 5.7% in volume terms (accounting for price changes), the largest annual increase since 2011.11 As well as seeing a rise in demand for their goods and services, evidence points towards exporters increasing their profit margins.12 Imports rose by 3.2% in 2017.
7 ONS, Quarterly sector accounts, UK: April to June 2018, 28 September 2018 8 Bank of England, “Bank Rate maintained at 0.75% - September 2018”,
13 September 2018 9 HM Treasury, Forecasts for the UK economy: October 2018, 17 October 2018 [to be
clear, these are not Treasury forecasts] 10 ONS, GDP quarterly national accounts, UK: April to June 2018, 28 September 2018,
table AB, series ZZ6U 11 ONS, Annual growth rate in total export volumes, series KH2U. 12 Bank of England, Inflation Report: February 2018, p14
In 2017, net trade boosted GDP growth for the first time since 2011.

10 Autumn Budget 2018
This positive picture has frayed in 2018. Export growth has slowed – it was up by only 0.8% in the three months to June 2018 compared with a year earlier – as the impact of weaker sterling fades (the value of sterling against the UK’s main trading partners has remained fairly stable this year13) and the global growth and trade environment becomes less favourable.14
While the global economy is still growing at a healthy rate, the growth picture is not as positive as it was earlier this year (see box 1.1 below/page 17). For example, GDP growth in the Eurozone has eased during 2018 from a post-financial crisis peak in 2017. In addition, trade tensions have increased, most notably – but not restricted to – the US and China.
The result of all this is that net trade’s positive contribution to UK growth is fading, with most forecasters expecting it to make little contribution to overall GDP growth in 2018. The consensus among forecasts collected by the Treasury in early October was for net trade to contribute only 0.1 percentage point to GDP growth in 2018.15
1.4 Investment has fallen in 2018 Investment declined over the first half of 2018, following modest growth in 2017. Investment fell by 1.0% in Q1 2018 (the three months to March 2018) compared with the previous quarter, and by 0.5% in
13 Bank of England data, Sterling effective exchange rate index, series XUDLBK67 14 The degree to which a lower exchange rate helps boost exports is a hotly-debated
issue among economists. While at face value it may lead to improved price competitiveness, other factors may limit the ultimate effect on export growth: (i) the use of international supply chains (many imports can be used in an exported product); (ii) the degree to which exporters boost profit margins instead of lowering prices in foreign currency, e.g. raise prices in £ but keep them the same in $; (iii) the prevalence of exporters’ pricing in a foreign currency (e.g. euros or dollars); and (iv) how sensitive to price movements potential customers are.
15 HM Treasury, Forecasts for the UK economy: October 2018, 17 October 2018 [to be clear, these are not Treasury forecasts]
-5
0
5
10
2013 2014 2015 2016 2017 2018Source: ONS, series KH2U
Export growth falling back after strong 2017Volume, % change on previous year
During 2018, economic growth in the Eurozone has eased and there have been trade tensions elsewhere – notably between the US and China.

11 Commons Library Briefing, 23 October 2018
Q2 (the three months to June).16 These figures include investment by businesses and government, including in housing.
Business investment also fell on a quarterly basis, by 0.5% in Q1 and 0.7% in Q2.17 Investment data are prone to large revisions so one needs to be careful about reading too much into short-term movements. Nevertheless, the overall trend shows that business investment levels – the actual amount invested – are around those of 2015.18 This is despite generally favourable fundamentals, such as good profitability and the availability of still-cheap credit.19
One factor that could be holding back business investment is Brexit. Many, including the Bank of England’s Monetary Policy Committee, believe that business investment has been weaker following the vote to leave the EU than it would have been if Remain had won. Some companies may be wary of investing given the uncertainty surrounding the future trade and investment relationship between the UK and EU.20
The Bank of England’s agents, who collect information on business conditions around the UK, reported in their regular survey that investment decisions of larger firms and those with an international focus were more likely to be affected by Brexit uncertainty than smaller domestic companies:
Brexit uncertainty was weighing down discretionary or expansionary investment for some medium to larger-sized businesses, or those with a greater international focus. SMEs and domestic-facing businesses were more likely to maintain a business as usual approach to investment as potential Brexit effects remained unclear.21
With negotiations continuing and a ‘no-deal’ departure from the EU a possibility, some companies may defer decisions on investment. Even if a withdrawal agreement is signed and the UK enters a transition period,
16 ONS, gross fixed capital formation, series KG7N (annual) and KG7Q (quarterly) 17 ONS, business investment, series KG7P 18 ONS, business investment real-terms level, series NPEL 19 Oxford Economics, UK Macro Economic Outlook, October 2018 20 For example, see analysis by Bank of England in “Agents’ summary of business
conditions and results from the Decision Maker Panel Survey”, Q2 2018, p8 21 Bank of England, Agents’ summary of business conditions and results from the
Decision Maker Panel Survey, Q2 2018, 28 June 2018, p8
50
60
70
80
90
100
110
2010 2011 2012 2013 2014 2015 2016 2017 2018
Source: ONS, series NPEL (rebased), quarterly data
UK investment has been flat in recent yearsTotal investment (GFCF), index where Q4 2015 level = 100
Business investment levels are similar to 2015, despite generally favourable fundamentals, such as good profitability and the availability of still-cheap credit.
Brexit uncertainty may be impacting on businesses investment decisions.

12 Autumn Budget 2018
future longer-term trading arrangements with the EU (and other countries) will still need to be negotiated. This uncertainty could dampen investment among larger firms who trade with the EU.22 On the other hand, there may be some pent-up investment that has already been deferred and may be signed off in the event of the UK and EU agreeing a withdrawal deal.23
1.5 Inflation remains at over 2%. Interest rates rose in August
Annual consumer price inflation has eased somewhat since the beginning of the year, when it was 3.0%.24 It fell to 2.4% in April and has mostly remained at this rate since then, barring a temporary increase in July (2.5%) and August (2.7%). The latest figure for September was 2.4%.25
The effects of the pound’s fall from late 2015, and more noticeably after the EU referendum in June 2016, resulted in higher import prices which fed through into higher inflation. This effect is fading, meaning that its impact on the annual inflation rate is easing. Higher oil prices and rising utility bills have been exerting upward pressure of late.
Overall, most economists expect the inflation rate to fall a little over the next year or so, with forecasters on average expecting it to fall to 2.0% on average in the final three months of 2019.26 The Bank of England’s Monetary Policy Committee (MPC) in its August Inflation Report (the most recent available) forecast inflation of 2.2% for the same period.27
22 Oxford Economics, UK Macro Economic Outlook, October 2018 23 IFS, Green Budget 2018: Chapter 2 UK Outlook, p71 (written by Citi research) 24 This section refers to the CPI measure of consumer price inflation 25 ONS, Consumer price inflation, UK: September 2018, 17 October 2018 26 HM Treasury, Forecasts for the UK economy: October 2018, 17 October 2018 [to be
clear, these are not Treasury forecasts] 27 Bank of England, Inflation Report: August 2018, p.37, table 5.G
Consumer price inflation expected to ease a little in 2019Annual % change in CPI, monthly data and quarterly forecasts
-1
0
1
2
3
4
2013 2014 2015 2016 2017 2018 2019 2020Source: ONS, series D7G7 and Bank of England projections from Aug 2018 Inflation Report: mode forecasts based on market interest rate expectations and other policy as announced
Bank of England Aug'18 forecasts
Inflation remains over 2%, but has eased since the beginning of the year.
13 Commons Library Briefing, 23 October 2018
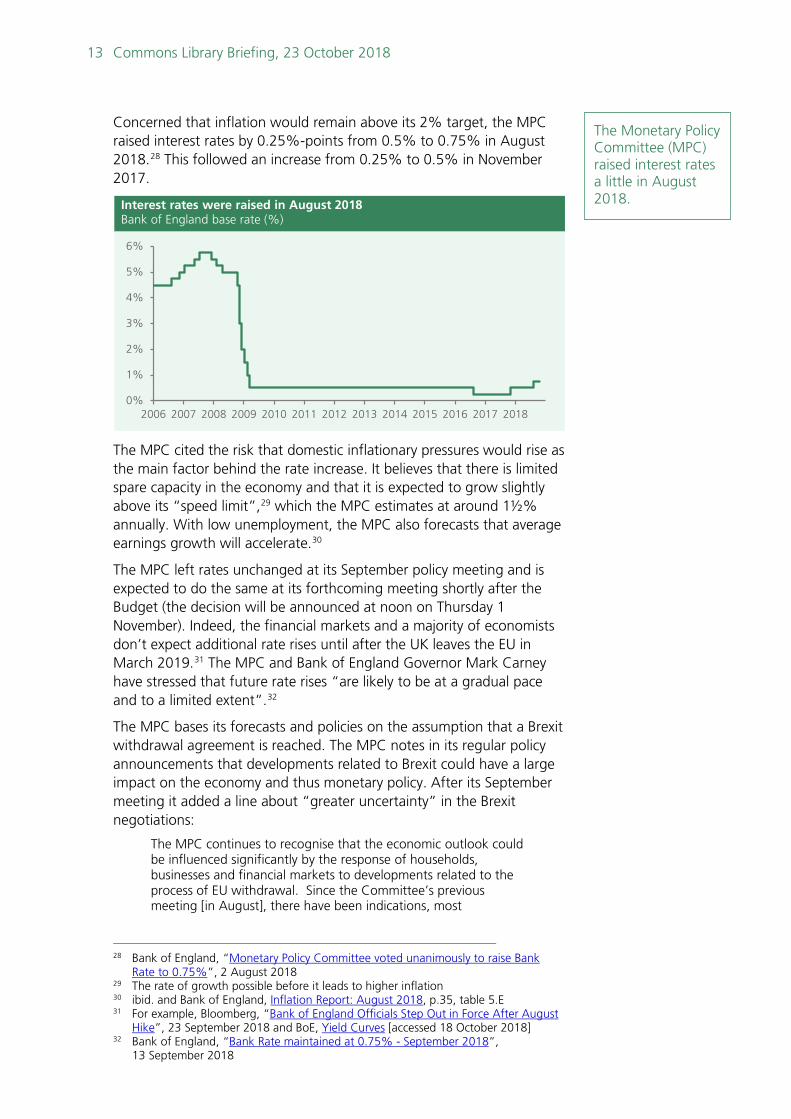
Concerned that inflation would remain above its 2% target, the MPC raised interest rates by 0.25%-points from 0.5% to 0.75% in August 2018.28 This followed an increase from 0.25% to 0.5% in November 2017.
The MPC cited the risk that domestic inflationary pressures would rise as the main factor behind the rate increase. It believes that there is limited spare capacity in the economy and that it is expected to grow slightly above its “speed limit”,29 which the MPC estimates at around 1½% annually. With low unemployment, the MPC also forecasts that average earnings growth will accelerate.30
The MPC left rates unchanged at its September policy meeting and is expected to do the same at its forthcoming meeting shortly after the Budget (the decision will be announced at noon on Thursday 1 November). Indeed, the financial markets and a majority of economists don’t expect additional rate rises until after the UK leaves the EU in March 2019.31 The MPC and Bank of England Governor Mark Carney have stressed that future rate rises “are likely to be at a gradual pace and to a limited extent”.32
The MPC bases its forecasts and policies on the assumption that a Brexit withdrawal agreement is reached. The MPC notes in its regular policy announcements that developments related to Brexit could have a large impact on the economy and thus monetary policy. After its September meeting it added a line about “greater uncertainty” in the Brexit negotiations:
The MPC continues to recognise that the economic outlook could be influenced significantly by the response of households, businesses and financial markets to developments related to the process of EU withdrawal. Since the Committee’s previous meeting [in August], there have been indications, most
28 Bank of England, “Monetary Policy Committee voted unanimously to raise Bank
Rate to 0.75%”, 2 August 2018 29 The rate of growth possible before it leads to higher inflation 30 ibid. and Bank of England, Inflation Report: August 2018, p.35, table 5.E 31 For example, Bloomberg, “Bank of England Officials Step Out in Force After August
Hike”, 23 September 2018 and BoE, Yield Curves [accessed 18 October 2018] 32 Bank of England, “Bank Rate maintained at 0.75% - September 2018”,
13 September 2018
Interest rates were raised in August 2018Bank of England base rate (%)
0%
1%
2%
3%
4%
5%
6%
2006 2007 2008 2009 2010 2011 2012 2013 2014 2015 2016 2017 2018
The Monetary Policy Committee (MPC) raised interest rates a little in August 2018.

14 Autumn Budget 2018
prominently in financial markets, of greater uncertainty about future developments in the withdrawal process.33
Mark Carney has agreed to extend his term as Governor of the Bank of England by seven months. He was due to leave the Bank in June 2019, but will now remain until end January 2020. The Chancellor, Philip Hammond, stated that the move was in order to, “support a smooth exit of the UK from the EU.”34
1.6 Employment is historically high The number of people aged 16 and over in employment and the employment rate are both very high by historical standards.35
In the three months to August 2018, there were 32.4 million people in work, an increase of almost 300,000 from the year before. The employment rate was 75.5%, and has recently been at its highest level since comparable records began in 1971.36
The increase in employment over recent years has been driven by people in full-time work. Indeed, the entirety of the increase over the last year has been due to an increase in the number of full-time employees, with the number of part-time employees, full or part-time self-employed workers and temporary workers all falling.
Unemployment levels and rates are currently at very low levels by historical standards.
There were almost 80,000 fewer unemployed people in the UK in the three months to August 2018 than a year previously, with 1.36 million people unemployed. The unemployment rate was 4.0%, which is the joint lowest it has been since c1975.37
33 Bank of England, “Bank Rate maintained at 0.75% - September 2018”,
13 September 2018 34 Letter from Philip Hammond to Mark Carney, 11 September 2018 35 The employment rate is the percentage of the population aged 16-64 who are in
work. 36 ONS, UK Labour Market, October 2018, 16 October 2018 37 The unemployment rate is the percentage of the economically active population
who are unemployed.
The unemployment rate is currently at its joint lowest level since 1975%, economically active people aged 16+, seasonally adjusted
0
2
4
6
8
10
2008 2010 2012 2014 2016 2018
Employment is very high by historical standards.
Unemployment is very low by historical standards.

15 Commons Library Briefing, 23 October 2018
The Bank of England has reported that spare capacity in the labour market has now largely been absorbed.38 This has led to an increase in the number of job vacancies, which have recently been at their highest level since comparable records began in 2001. In the three months to September 2018 there were 832,000 job vacancies, up 35,000 from a year ago.
Only slight changes in unemployment are expected over coming years. The Bank of England has suggested it may fall slightly, while other forecasters expect it to rise a little.39 Either way, unemployment levels are expected to remain close to historic lows.
Recent signs of earnings growth picking up Although there have recently been signs that earnings growth is beginning to pick up, overall growth over the last year has been subdued. Throughout the second half of 2017 earnings growth was below the rate of CPI inflation and although earnings have grown faster than inflation for much of 2018, it has only been to a limited extent.
The Bank of England has forecast that earnings will start to grow at a faster rate as a result of the tight labour market, and the earnings data from recent months suggest that this growth is already apparent.40 In the three months to August 2018, average pay excluding bonuses increased by 3.1% compared with the year before. This is the largest increase in average pay since January 2009.
Despite this, after taking inflation into account the growth in earnings was smaller at 0.5%. This is below the levels seen before the 2008 recession, with, for example, real earnings averaging 2.6% in 2007. After adjusting for inflation, average earnings are below the levels seen before the 2008 downturn.
38 Bank of England, Inflation Report: August 2018, The labour market and pay, 2
August 2018 39 ibid. and HM Treasury, Forecasts for the UK economy: October 2018, 17 October
2018 [to be clear, these are not Treasury forecasts] 40 Bank of England, Inflation Report: August 2018, The labour market and pay, 2
August 2018
Note: 'average earnings' means average weekly earnings excluding bonuses for employees in Great Britain. Source: ONS series D7BT, KAI9
-1%
0%
1%
2%
3%
4%
5%
2008 2009 2010 2011 2012 2013 2014 2015 2016 2017 2018
Earnings growth has been subdued over the last yearEmployees in Great Britain; three month average
CPI inflationGrowth inaverage earnings
After adjusting for inflation, average earnings are below the levels seen before the 2008 downturn.
There have been recent signs that earnings growth is beginning to pick up.

16 Autumn Budget 2018
1.7 Productivity growth has been weak over the past decade
Economic growth since the 2008/09 recession has mostly been attained by a large increase in employment rather than via improvements in productivity.41
Productivity – the amount that is produced for a given input – has been very weak over the past decade. Instead of growing at its historical average rate of around 2% per year, economic output per hour has increased only very slowly.42 Productivity levels are only 1.9% higher than at their pre-recession peak of late 2007.
Over the long-term, productivity growth is essential for increases in living standards. The more productive an economy is, the more can be produced in a sustainable fashion. In other words, productivity is crucial in determining long-term growth rates. This, in turn, increases tax revenues and lowers government budget deficits. Of course, lower productivity growth results in the opposite: lower GDP growth and higher budget deficits.
The persistent weakness in productivity growth has led many forecasters to downgrade their expectations of the productivity growth rates that the economy can achieve consistently to around 1%, or slightly above 1%, per year. This includes the Bank of England and the Office for Budget Responsibility (OBR). In November 2017, the OBR lowered its productivity growth forecasts, noting its persistent weakness since the 2008/09 recession. This, in turn, led it to cut its forecasts for GDP growth.43
Recently, however, there have been some signs that productivity growth is recovering somewhat. Productivity grew by 0.5% in the three months to June 2018 compared with the previous three months. Compared with a year before, productivity increased by 1.4%, up from 0.8% in
41 IFS, Green Budget 2018: Chapter 2 UK Outlook, fig 2.2 (produced by Citi research) 42 ONS, Labour productivity, UK: April to June 2018, 5 October 2018 43 For more see Commons Library briefing paper, Autumn Budget 2017: A summary
75
80
85
90
95
100
105
2000 2002 2004 2006 2008 2010 2012 2014 2016 2018
Source: ONS, series LZVB (rebased), quarterly data
UK productivity level has not grown much over past decadeEconomic output per hour, index where Q4 2007 level = 100
Productivity growth – which is essential for increasing living standards – has been very weak over the past decade.

17 Commons Library Briefing, 23 October 2018
the previous period.44 Figures tend to be volatile, so whether this is the start of a long-awaited sustained turnaround is still too early to say.
1.8 Most forecasters expect growth of between 1.3% and 1.5% in 2018
After a weak start to the year, economic growth recovered over the spring and summer. The underlying growth rate is, however, still modest. This reflects the more subdued consumer spending environment since rising inflation squeezed household budgets in 2017.
This slowdown was partly mitigated last year by modest investment growth and a strong contribution from net trade, as exports grew robustly. Investment and exports have performed less well in the first half of 2018, suggesting that support for growth from these sources will be more limited over the course of the full year.
The average among forecasters surveyed in early October was for GDP growth of 1.3% for 2018 as a whole.45 The Bank of England’s Monetary Policy Committee in early August forecast growth of 1.4%.46 Latest forecasts from the OECD and IMF are similar at 1.3% and 1.4% respectively.47 In March, the Office for Budget Responsibility (OBR) forecast GDP growth of 1.5% for 2018.48
Looking ahead to 2019, similar rates of growth are forecast. The consensus of forecasters is for GDP to rise by 1.5%, the same as the IMF forecast, but below the Bank of England’s forecast of 1.8%. In March, the OBR forecast growth of 1.3% for 2019.
44 ONS, Labour productivity, UK: April to June 2018, 5 October 2018 45 HM Treasury, Forecasts for the UK economy: October 2018, 17 October 2018 [to be
clear, these are not Treasury forecasts] 46 Bank of England, Inflation Report: August 2018, p.37, table 5.F 47 A summary of international forecasts is available in Library briefing paper, GDP -
International Comparisons 48 OBR, Economic and fiscal outlook –March 2018, 13 March 2018
1.41.3 1.3
1.5 1.61.5
1.3 1.3 1.41.5
0.0
0.5
1.0
1.5
2.0
2018 2019 2020 2021 2022
November 2017 March 2018
Source: OBR, Economic and fiscal outlook, Nov'17 and Mar'18
Previous OBR forecasts for GDP growth Annual % change in GDP; OBR forecasts from Nov 17 and Mar 18
In March, the Office for Budget Responsibility forecast GDP growth of 1.5% for 2018.

18 Autumn Budget 2018
Box 1.1: Global economic conditions and international comparisons
The world economy continues to expand at a healthy pace. A stronger US economy – supported by tax cuts – has provided support while growth in China remains robust. There are, however, some less positive signals for the global environment. US interest rates have been rising (they are currently in the range 2.0-2.25%) putting pressure on some emerging economies such as Argentina and Turkey. Higher US interest rates make it relatively less attractive to invest in other countries, leading to some movement in capital away from these countries. It also makes servicing debt taken out in US dollars more expensive; a large amount of dollar-denominated debt has been built up around the world in recent years. This year has also seen a number of trade disputes, most notably involving the US. Tensions between the US and China have seen billions of dollars of trade subject to higher tariffs and a revised trade agreement has been negotiated between the US, Canada and Mexico (replacing NAFTA). Global trade growth has on the whole proved resilient so far, although there are early indications from business surveys of a slowdown. The IMF, in its latest forecasts released in early October, projected that “global growth will remain steady over 2018–19 at last year’s rate of 3.7%.”49 It did warn about clouds on the horizon – the risks to global financial stability and trade mentioned above – and stated that “[g]rowth has proven to be less balanced than hoped”. The IMF forecast UK GDP growth of 1.4% in 2018 and 1.5% in 2019. This compares with growth forecasts of 2.9% and 2.5%, respectively, for the US, and 2.0% and 1.9% for the Eurozone.50
The outlook, however, is marked by uncertainty, particularly surrounding the ongoing Brexit negotiations. Most economic forecasters, including the Bank of England and the OBR, assume that there will be a withdrawal agreement and therefore a transition period – where the UK remains in the EU single market and customs union – after the UK leaves the EU on 29 March 2019.
In a ‘no-deal’ scenario where the UK leaves the EU with no transition period, economic conditions may be very different. Under this scenario the way trade between the UK and EU is conducted would change overnight. Implications wouldn’t be limited to just those who import and export goods and services. From the transportation to the financial services sectors, ‘no deal’ would have implications for businesses.51
49 IMF, World Economic Outlook, October 2018 50 IMF, World Economic Outlook database, October 2018 and included in the Library
briefing paper, GDP - International Comparisons 51 UK in a changing Europe, Cost of No Deal Revisited, 3 September 2018
2.9 2.1 1.9 1.6 1.4 1.2 1.10.0
0.5
1.0
1.5
2.0
2.5
3.0
US Can. Ger. Fra. UK Ita. Jap.
Source: IMF, World Economic Outlook, Oct 2018
IMF 2018 GDP growth (%) forecasts for G7 countries
IMF 2019 GDP growth (%) forecasts for G7 countries
2.5 2.0 1.9 1.6 1.5 1.0 0.90.0
0.5
1.0
1.5
2.0
2.5
3.0
US Can. Ger. Fra. UK Ita. Jap.
Source: IMF, World Economic Outlook, Oct 2018
There is uncertainty in the economy, particularly surrounding the ongoing Brexit negotiations.

19 Commons Library Briefing, 23 October 2018
The reactions of financial and foreign exchange markets could also affect the economy, as crucially will those of businesses and consumers.52 The OBR has noted that a disorderly Brexit “could have a severe short-term impact on demand and supply in the economy and on the public finances”.53 Needless to say, as the OBR points out, there is a large degree of uncertainty associated with any of these scenarios.
52 For more on the potential economic impact of ‘no deal’ see section 5 of the Library
briefing paper, What if there's no Brexit deal?, 12 October 2018 53 OBR Discussion paper no.3, Brexit and the OBR's forecasts, October 2018, para 5.15

20 Autumn Budget 2018
2. The outlook for the public finances
Summary
Government borrowing has decreased from the peaks reached following the 2007-2008 financial crisis to a relatively normal level. Government borrowed £40 billion in 2017/18 to make up the difference between its spending and income raised from taxes and other sources. At 1.9% of GDP, borrowing in 2017/18 was below the average for the past 70 years.
The Office for Budget Responsibility (OBR) forecast that borrowing will fall further over the next five years, largely as a result of the Government controlling day-to-day public spending.
Following positive data for the first half of 2018/19, it seems likely that the OBR will lower its underlying borrowing forecast for 2018/19 and potentially its forecast for subsequent years.
The Government’s current budget – which excludes investment spending – was in surplus in 2017/18 for the first time since 2001/02. This means that government day-to-day spending was lower than its income from taxes and other sources.
While the Government’s borrowing situation has improved, its debt – broadly speaking the stock of past borrowing – remains high. Public sector net debt increased sharply following the financial crisis and at the end of 2017/18 was equal to 85% of GDP. The debt-to-GDP ratio was last above 85% in the mid-to-late 1960s, when it was still recovering from reaching over 200% of GDP during World War II. The debt-to-GDP ratio is forecast to fall gradually.
The document the OBR publishes alongside the Budget will include its first forecasts for 2023/24 and will assess the Government’s progress against its targets for borrowing and debt.
There remains a great deal of uncertainty about Brexit and the future UK-EU relationship. The OBR’s forecasts assume that negotiations lead to an orderly transition to a new long-term relationship. A less orderly outcome will likely have a negative impact on the public finances.
2.1 Borrowing is at relatively normal levels… When government spends more than it receives in taxes and other revenues, it needs to borrow to cover the difference. This borrowing is known as ‘public sector net borrowing’, but is often referred to as the deficit. Borrowing has fallen considerably since the high levels it reached during the financial crisis.
Borrowing has decreased from a peak of £153 billion in 2009/10 to £40 billion in 2017/18.54 Borrowing in 2017/18 is equivalent to 1.9% of GDP, which is below the average for the past 70 years and the lowest level since 2001/02.
…and is forecast to fall further… In March 2018, the OBR forecast that borrowing would decrease in each year of its five-year forecast. The OBR forecast than in 2022/23 borrowing will be around £21 billion or 0.9% of GDP.
54 Figures in this section exclude public sector banks and are from: ONS public sector
finances, OBR EFO – March 2018; OBR. public finances databank.
Public sector net borrowing, often referred to as the deficit, was £40 billion in 2017/18, equivalent to 1.9% of GDP, which is the lowest level since 2001/02.

21 Commons Library Briefing, 23 October 2018
…largely through relative falls in public spending The OBR attributes much of the forecast fall in borrowing between 2018/19 and 2022/23 to departments’ day-to-day spending on public services falling relative to the size of the economy.55 Relative falls in welfare spending are also expected to lower borrowing, but to a lesser extent. Capital spending56 increases are forecast to increase borrowing.
Borrowing so far in 2018/19 has been relatively low The Office for National Statistics (ONS) has published provisional borrowing data for the first half of 2018/19.57 Borrowing in the first half of 2018/19 is lower than in any year since 2002/03 and 35% lower than during the first half of 2017/18, which is a significantly larger decrease than the OBR forecast for the full 2018/19 financial year in 55 More correctly this is resource departmental expenditure limits (RDEL). 56 More correctly this is capital departmental expenditure limits (CDEL). 57 ONS. Public sector finances: Sep 2018, 19 October 2018
-40
0
40
80
120
160
'90/91 '94/95 '98/99 '02/03 '06/07 '10/11 '14/15 '18/19 '22/23
OBR March 2018forecasts
Public sector net borrowing
0
200
400
600
800
1,000
'90/91 '94/95 '98/99 '02/03 '06/07 '10/11 '14/15 '18/19 '22/23
Borrowing/deficit
SurplusSpending
Revenues
OBR March 2018forecasts
When total spending is higher than revenues, government has a deficit and must borrow, £ billion
0%
1%
2%
3%
PSNB(2018/19)
Capitalspending
Otherspending
Debtinterest
Welfare Publicservices
spending
Receipts PSNB(22/23)
Additional borrowing Lower borrowing Total borrowing
The OBR forecasts that decreases in the deficit will largely be a resultof spending falling (relative to the size of the economy)Sources of deficit reduction between 2018/19 and 2022/23, % GDP

22 Autumn Budget 2018
March 2018. However, these figures are provisional and should be treated with caution. There are still six months of data to come and significant uncertainty around areas of government spending and revenue.
The OBR may revise its forecast for this year’s borrowing in light of the data published so far. If the OBR lowers its 2018/19 borrowing forecast and believes that some of the improvement in borrowing is permanent, and not due to temporary factors, this will feed through to its underlying forecast for future years. In the past the OBR has tended to assume that some of the strength continues but some does not.
The Institute for Fiscal Studies estimate that the OBR’s underlying borrowing forecast for 2018/19 may be reduced by around £5 billion, with similar reductions in subsequent years.58 More recently, the FT reported that the 2018/19 forecast could come down by as much as £13 billion.59
The UK’s borrowing is in the middle of G7 nations In April 2018, the IMF – which uses a slightly different measure of government borrowing – forecast UK government borrowing of 1.8% of GDP in 2018, which places the UK in the middle of the advanced economies of the G7. France, Japan and the US are expected to borrow more, as a % of GDP, than the UK; Canada, Italy and Germany are expected to borrow less.
58 This estimate was made after 5 months of 2018/19 data had been published. IFS.
Green budget 2018, Chapter 3: Risks to the UK public finances, 16 October 2018 59 “Hammond set for £13bn a year windfall to ease NHS pressure”, FT, 23 Oct 2018
0
10
20
30
40
50
60
Apr May Jun Jul Aug Sep Oct Nov Dec Jan Feb Mar
2017/18
2018/19
OBR's forecast1 for
2018/19
1 OBR's March 2018 forecast
Borrowing in the first half of 2018/19 has been 35% lower than during the same period of 2017/18Cumulative public sector net borrowing, £ billion
-2%
0%
2%
4%
6%
Germany Canada Italy UK France Japan US
IMF forecasts place the UK in the middle of G7 countries for borrowing in 2018General government borrowing, G7 economies , 2018, % GDP

23 Commons Library Briefing, 23 October 2018
Box 2.1: How has the OBR included Brexit in its forecast?
Assumptions about Brexit negotiations60 Since the referendum, the OBR has assumed that the UK-EU negotiations “lead to an orderly transition to a new long-term relationship, whatever that relationship may be. This implies reaching a Withdrawal Agreement in time for it to be ratified by the UK and European Parliaments before the UK is due to leave the EU at 11pm on 29 March 2019.” If the UK’s exit turns out to be less orderly than assumed – perhaps in the instance of no deal being reached on the withdrawal agreement – then it seems likely that the OBR’s outlook for the economy and public finances would become more pessimistic than it currently is. As discussed in section 1.8, the OBR has said that a disorderly exit “could have a severe short-term impact on demand and supply in the economy and on the public finances.”61 While the OBR has set out how it has have taken the impact of Brexit into account in its forecasts, it acknowledges that there is “significant uncertainty about the effects of Brexit on the UK economy, especially since no major country has left the EU or a similar trading bloc”.
Forecasting the economy and public finances62 After the EU referendum the OBR downgraded its economic forecasts. In the short to medium term, the downgrade was based on the OBR’s judgement that Brexit related uncertainty will lead firms to delay investment and consumers will be squeezed by higher import prices, following the post-referendum fall in the pound. The OBR has made some broad-brush judgements – consistent with most external studies – about the period after Brexit. It assumes that over the time horizon of tits forecast any likely Brexit outcome will lead to: lower trade flows; lower business investment; and lower net inward migration than would otherwise have been seen. Taken together these result in lower economic growth. In the longer term the OBR says that decisions made by UK Governments in areas such as trade and regulation will determine whether future economic growth is enhanced or impeded.
Forecasting UK payments to the EU63 The OBR’s public spending forecast includes an estimate of the UK’s EU membership payments. While the UK remains a member of the EU these payments will continue as normal. The OBR assumes that after Brexit the spending – which it continues to forecast throughout the five-year forecast period on a ‘no-referendum’ counterfactual basis– will be recycled into other spending, including new spending commitments arising from Brexit and the withdrawal negotiations. For the first time, in their March 2018, the OBR included an estimate of one of these spending items: the financial settlement the Government has agreed with the EU (described in the media as the divorce bill/Brexit bill/exit bill: there is more in the Library briefing Brexit: the exit bill). The OBR has estimated the annual cost of the settlement and included them in their forecast.
60 OBR. Brexit and the OBR’s forecasts, October 2018 61 ibid 62 For more detail see section 4.1 of the Library briefing Autumn Budget 2017:
Background briefing, 63 For more detail see section 4.1 of the Library briefing Autumn Budget 2017:
Background briefing,
0
2
4
6
8
10
12
14
16
2017-18 2018-19 2019-20 2020-21 2021-22 2022-23
The OBR have continued to forecast the UK's EU membership payments after Brexit, but have diverted the spending to other areas£ billion
Payments to EUinstitutions
Estimated payments from UK to EU for the Brexit financial settlement
Recycled spending in lieu of EU membership payments

24 Autumn Budget 2018
2.2 The current budget has reached a surplus The current budget deficit is the difference between government current spending – day-to-day spending on running public services, grants and administration – and government income from taxes and other sources. Unlike public sector net borrowing, the current budget deficit doesn’t include investment spending and therefore is said to measure the degree to which taxpayers meet the cost of paying for the services provided to them.
The current budget was in surplus in 2017/18 by £1.4 billion, equivalent to 0.1% of GDP. This means that the Government’s current spending – on the day-to-day spending on running public services, grants and administration – was smaller than the taxes and other revenues it received. The current budget has fallen significantly since its peak of £100 billion in 2009/10 and the surplus reached is the first since 2001/02.
The OBR’s forecast suggests that the current budget surplus will grow annually over the forecast period, reaching £34 billion, or 1.4% of GDP, by 2022/23.
Opposition parties have proposed targets for the public finances that focus on the current budget,64 rather than public sector net borrowing – which is the Government’s preferred measure (see section 3.4).
64 Labour Party Manifesto 2017; Liberal Democrat Manifesto 2017; SNP, What do the
SNP propose as an alternative to austerity?
-40
0
40
80
120
160
'90/91 '94/95 '98/99 '02/03 '06/07 '10/11 '14/15 '18/19 22/23
March 2018forecasts
* current spending including depreciation
Current budget defict
0
200
400
600
800
1,000
'90/91 '94/95 '98/99 '02/03 '06/07 '10/11 '14/15 '18/19 22/23
Current budget deficit
Current budget surplus
Current spending*
Revenues
OBR March 2018forecasts
When current spending is higher than revenues, the government has a current budget deficit, £ billion
In 2017/18, government raised more in taxes and other revenues than it spent on the day-to-day running of public services, grants and administration. In other words, the current budget was in surplus.

25 Commons Library Briefing, 23 October 2018
Focusing on the current budget would allow borrowing for investment purposes.
2.3 Public sector net debt remains high…. Public sector net debt is the overall level of government indebtedness, built up over many years. Broadly speaking, it is the stock of borrowing arising from past deficits.
Before the financial crisis, public sector net debt was around 34-35% of GDP. As a result of the crisis, debt increased sharply. Public sector net debt was 85% of GDP at the end of 2017/18. Debt was last higher than 85% in the mid-to-late 1960s, when it was still recovering from reaching over 200% of GDP during World War II.65
In March 2018, the OBR forecast that the debt-to-GDP ratio will fall gradually to just under 78% of GDP by 2022/23.
Public sector net debt includes the impact of some temporary measures taken by the Bank of England following the EU referendum result. As the impact is largely temporary, the ONS and OBR have published a measure of public sector net debt that excludes the Bank of England. On this measure the path of public sector net debt is smoother.
…and higher than the EU average, but lower than four G7 nations The IMF – which uses a slightly different measure of government debt – forecast that the UK’s net debt in 2018 is set to be 77% of GDP.
The UK’s debt is lower than four of the G7 economies. However, by European standards the UK’s debt-to-GDP ratio is relatively large. The IMF forecasts that the UK’s net debt in 2018 will be higher than the EU average of 67%.66
65 OBR. Public finances databank, March 2018 66 IMF. World Economic Outlook Database, October 2017
0%10%20%30%40%50%60%70%80%90%
'90/91 '94/95 '98/99 '02/03 '06/07 '10/11 '14/15 '18/19 '22/23
PSND(excluding Bank of England)
PSND
Public sector net debt is forecast to fall over the forecast periodPublic sector net debt (PSND), % GDP
Public sector net debt – broadly speaking the stock of borrowing from past deficits – was 85% of GDP at the end of 2017/18. Public sector net debt is high relative to the past 50 years.

26 Autumn Budget 2018
2.4 The Government has targets for the public finances
The OBR’s forecast will included assessments of the Government’s progress against its public finance targets. The targets support the Government’s overall objective for the public finances, which is reaching a budget surplus in the middle of the next decade. A surplus would see government spending be less than government income from taxes and other sources.
Eliminating the deficit by the mid-2020s The Government’s objective for fiscal policy is to return the ‘public finances to balance at the earliest date in the next Parliament’. The objective aims to provide sustainable public finances, ensure confidence in the economy, and support the effectiveness of monetary policy. If the public finances are in balance government spending is no more than government income.
Box 2.2: There is some ambiguity about when the Government’s objective for the public finances should be met
The targets for the public finances are set out in the Charter for Budget Responsibility (the Charter). When the objective for the public finances was introduced in autumn 2016, its wording suggested the deficit would be eliminated by 2025 at the latest. Its interpretation now is questionable, given the early election in 2017, but the Conservative Manifesto suggests the Government is still aiming at the ‘middle of the next decade’.67 The Treasury Committee recommended that the Government should clear up this ambiguity at Spring Statement 2018.68 No change was made at Spring Statement. The IFS has recently recommended that the targets in the Charter should be assessed and updated.69 If the Government did wish to change its objective for the public finances – or any of its public finance targets – it would do so by altering it in the Charter for Budget Responsibility. The House of Commons would then have to vote to approve the updated Charter. The Library briefing The Office for Budget Responsibility and Charter for Budget Responsibility discusses the Charter and previous changes made to the public finance targets.
67 2017 Conservative Manifesto, page 14 68 Treasury Committee, Autumn Budget 2017, 17 January 2018, HC600 2017-19, para
55 69 IFS. Green budget 2018, Box 3.1, 16 October 2018
0%
40%
80%
120%
160%
Canada Germany UnitedKingdom
UnitedStates
France Italy Japan
IMF forecast that the UK will have lower government debt than fourG7 nations in 2018General government net debt, G7 economies, 2018 forecasts, % GDP
The UK’s government net debt-to-GDP ratio in 2018 is forecast to be lower than Japan’s, Italy’s, France’s and the US’.

27 Commons Library Briefing, 23 October 2018
What was the OBR’s judgement in March 2018?
Given the ambiguity over the final date for the objective (see box 2.2), in March 2018 the OBR considered whether the Government was on course to balance the budget in either 2022/23 or 2025/26.
The OBR’s forecast doesn’t yet cover 2025/26 – the five-year forecast-horizon extends to 2022/23. However, with the OBR’s forecast for 2022/23 showing a budget deficit, it judged that achieving a budget balance in 2025/26 “appears challenging from a variety of perspectives”.70
In March 2018, the OBR forecast a deficit of £21.4 billion, or 0.9% of GDP, in 2022/23. Therefore, against this target date the Government’s objective for the public finances would be missed.
Having structural borrowing at less than 2% of GDP in 2020/21 The Government has targets to support it achieve its overall fiscal objective of eliminating the deficit. Chief amongst these is the fiscal mandate, a target for controlling the level of borrowing. The fiscal mandate focuses on an adjusted version of borrowing. The fiscal mandate is to reduce cyclically adjusted public sector net borrowing to below 2% of GDP by 2020/21.
The adjustment means the target focuses on structural borrowing, or the element that remains once borrowing related to the ups and downs of the economy are removed. This is what is meant by ‘cyclically adjusted’: removing the parts of borrowing related to the economic cycle (see box 2.3).
What was the OBR’s judgement in March 2018?
The OBR forecasts that the Government is on course to meet the fiscal mandate. The OBR forecasts that in 2020/21 cyclically adjusted net borrowing would be 1.3% of GDP, so the target is on track to be achieved with a margin of 0.7% of GDP, or £15.4 billion.
Box 2.3: Structural borrowing, cyclical elements and the output gap
Structural borrowing Structural borrowing is the level of borrowing we would expect to remain if the economy was running at a sustainable level of employment and activity. Structural elements are the underlying or persistent part of government borrowing, which are unrelated to the economic cycle. The OBR never knows what the economy’s normal level is, so it estimates it through the output gap (see below). Cyclical elements of borrowing Cyclical elements of borrowing refer to the effect of the economic cycle on the level of government borrowing. In a recession, government borrowing tends to increase as tax receipts are reduced and spending on benefits increases. The reverse happens when the economy is growing strongly. These effects are sometimes known as the economy’s ‘automatic stabilisers’. The output gap The difference between the actual level of economic output and what could be achieved if the economy was operating at full potential is known as the ‘output gap’. A negative output gap suggests that the economy is operating below its potential level and has idle resources. A positive output gap suggests that the economy is operating above potential, or overheating.
70 OBR. Economic and fiscal outlook – March 2018, para 5.17

28 Autumn Budget 2018
A big problem for policymakers is that the level of potential output cannot be directly measured and consequently neither can the output gap. Therefore, economists must estimate what the output gap is. March 2018 estimates The OBR estimates that the economy was operating just above its potential in 2017/18, with a small output gap of 0.2%. As the economy was thought to be running above capacity, the OBR judged that structural borrowing was a little larger than public sector net borrowing. This means that there was no cyclical element of borrowing that could be eliminated through economic growth. In contrast, in 2009/10 the OBR estimated that the output gap was -3.5%; that is the economy was thought to be running 3.5% below capacity. As the economy was thought to be running below capacity the OBR judged structural borrowing to be lower than overall borrowing. This meant that the remaining part of overall borrowing was thought to be cyclical – related to the economic cycle – which would disappear as the economy returned to capacity.
The debt-to-GDP ratio to be falling in 2020/21 The fiscal mandate is supplemented with a debt target. The supplementary target is for public sector net debt as a percentage of GDP – the debt-to-GDP ratio – to be falling in 2020/21.
The IFS has pointed out that the timing of the debt target makes it “particularly easy to meet given temporary factors that are likely to reduce PSND [public sector net debt] in that year.”71 The temporary factors mentioned refer to a Bank of England scheme, the loans for which are expected to begin being repaid to the Bank in 2020/21.72 The loans are part of the public sector’s debt, so when they are repaid they decrease debt. The IFS estimates that this effect means that in order for the supplementary debt target not to be met the budget deficit would have to be around or over 4% of GDP in 2020/21.73
What was the OBR’s judgement in March 2018?
The Government was forecast to be on course to meet the debt target. The OBR expects the debt-to-GDP ratio to be broadly stable up to 2018/19 after which it is expected to fall in each year.
Welfare spending to be below a cap level The Government has a further target for controlling spending on around 55% of welfare spending – the welfare cap. The target is for relevant welfare spending to be within the cap level. The main areas of
71 IFS. The IFS Green Budget: February 2017, page 78 72 The scheme is the Term Funding Scheme, under which up to £100 billion of loans
are to be made available to UK banks and building societies until the end of February 2018, with the loans to be repaid within four years of being taken out
73 IFS. The IFS Green Budget: February 2017, page 78
0%
4%
8%
12%
09/10 11/12 13/14 15/16 17/18 19/20 21/22
Cyclicalelement ofborrowing
Public sectornet borrowing
Structuralborrowing
Borrowing and structural borrowing% of GDP
OBR forecasts
-4%
-3%
-2%
-1%
0%
1%
09/10 11/12 13/14 15/16 17/18 19/20 21/22
OBR output gap estimates% of GDP
Estimatedoutturns
forecasts
Supplementary debt target: a target for public sector net debt as a percentage of GDP to be falling in 2020/21.
29 Commons Library Briefing, 23 October 2018
welfare spending excluded from the cap are pensions and Jobseekers Allowance payments.
The Charter for Budget Responsibility requires the Government to set a new welfare cap at the first Budget of a new Parliament. The Government did so at Autumn Budget 2017. The cap is for 2022/23 and will be formally judged by the OBR in the first Budget of the next Parliament. In the interim years the OBR will monitor progress against the cap.
The Charter has not yet been updated with the new welfare cap, so it currently includes the target set at Autumn Statement 2016. The Government may choose to publish an update of the Charter. Any revisions will only take effect once approved by a vote in the House of Commons.
The Library briefing The welfare cap goes into further detail on the cap.
What will OBR judge in October 2018 forecast?
The OBR will monitor progress against the cap. The OBR will not make a formal assessment of the welfare cap – this will only happen in the first Budget of the next Parliament.
What was the OBR’s judgement in March 2018?
The OBR judged that the terms of the cap are being met.

30 Autumn Budget 2018
3. Public spending from 2020/21
Summary
The Chancellor is expected to set out plans for public spending for 2020 and beyond. This spending will then be divided amongst departments at the 2019 Spending Review.
Current spending plans, pencilled in at Autumn Budget 2017, suggest that total spending will grow annually by about 0.5% to 1.5% in real terms (ie adjusted for inflation) until 2022/23. However, not all areas of public spending are forecast to follow the same trend. While departments’ capital spending is set to increase, and demand-driven spending – such as on welfare – is set to remain fairly flat, departments’ day-to-day spending on public services is set to decrease in most years to 2022/23.
The Prime Minsters’ recent speech to the Conservative Party Conference, signalled that austerity is to be brought to an end, with details to be set out at the 2019 Spending Review. There is no single definition of austerity, but it is often used to describe recent reductions in day-to-day spending on public services. The Chancellor will have to increase day-to-day spending, compared to current plans, to prevent future real terms falls in such spending. However, this may not be enough to end austerity on other definitions of the term.
If the Government were to accept that additional spending is required to end austerity, this may conflict with its targets for reducing and eventually eliminating the deficit and its pledge to keep taxes as low as possible.
3.1 The Chancellor will set out total public spending for 2020 and beyond…
In his 2018 Spring Statement, the Chancellor said “at this year’s Budget I will set an overall path for public spending for 2020 and beyond, with a detailed Spending Review to take place in 2019 to allocate funding between Departments”.74 This implies that in the Budget the Chancellor will set out the overall envelope of spending (that is, the total amount of money that the Government intends to spend) over the forthcoming Spending Review period, and that the Government will have a Spending Review in 2019 to fill in the details of each department’s allocation.
3.2 …and allocate spending to departments in the 2019 Spending Review
Since 1998, public spending in the UK has been planned in multi-year cycles, each one started by a Spending Review.75 These Reviews are a chance for the Government to divide its spending up between its various departments. This planning is important for the departments themselves, but also for Parliament’s financial scrutiny of the Government. Traditionally, Spending Reviews have largely focused on the area of public spending that the Government has most control over,
74 HM Treasury, Spring Statement 2018: Philip Hammond's speech, 13 March 2018 75 The lengths of these cycles are not consistent – gaps between Spending Reviews
have varied from two to four years, and the number of years planned by each has ranged from one to four.
The Chancellor is set to unveil his plans for spending from 2020/21

31 Commons Library Briefing, 23 October 2018
which is known as ‘departmental expenditure limits’ (DEL). There is more on DEL and the different types of public spending below.
The most recent Spending Review took place in 2015 (at the same time as Autumn Statement 2015), and set out the plans for spending up to the end of 2019/20.76 As we are now approaching the end of this period, the Government intends to hold another Spending Review in 2019.
It is not yet clear how long the forthcoming Spending Review period will be. It is open to the Chancellor to set it to any length, and some commentators77 have suggested that the current uncertainty in economic forecasts, which is largely the result of ongoing Brexit negotiations, means that it may be sensible to limit it to a single year.78
3.3 What’s the current outlook for spending? How does total public spending breakdown? Government is set to spend over £800 billion in 2018/19. Over half of public spending will be on areas that are often demand driven or volatile and less amenable to multi-year planning, such as welfare spending and debt interest. Collectively these are known as ‘annually managed expenditure’ (AME).
The remaining 45% or so of public spending in 2018/19 will be spent on items that can be planned and controlled by government, which are collectively known as ‘departmental expenditure limits’ (DEL). DEL is often split between the day-to-day running of public services, grants and administration (collectively termed ‘resource DEL’) and investment (‘capital DEL’). The resource element makes up the majority of DEL spending.
76 The Library briefing Spending Review and Autumn Statement 2015: a summary has
further information. 77 Such as the Institute for Government and public sector leaders interviewed by
Deloitte. 78 There is some precedent for this – the 2013 Spending Round added only a single
year to the existing plans, although it did take place with two years left to run from the previous Spending Review.
0
100
200
300
400
500
600
700
800
900
07/08 09/10 11/12 13/14 15/16 17/18 19/20 21/22
Annually managed expenditure (AME)
Resource departmental expenditure limts (rDEL)
Capital departmental expenditure limts (cDEL)
46% of publicspending
54% of publicspending
The greatest proportion of public spending goes on the largely demand-driven areas included in AMEPublic spending, £ billion, real terms (2017/18 prices), forecasts from 2017/18
Areas of public spending that are demand driven or volatile and less amenable to multi-year planning are collectively known as annually managed expenditure (AME). Departmental expenditure limits (DEL) cover spending that can be planned or controlled by government.

32 Autumn Budget 2018
How does the OBR forecast public spending? DEL spending is largely at the discretion of the Treasury, so the OBR doesn’t produce forecasts for this type of spending. Instead, it uses the allocations announced by the Government at the most recent Spending Review. For years outside of the Spending Review (such as from 2020/21) the OBR asks the Government for some provisional totals. The OBR may make some adjustments for any likely underspending.
The DEL figures featured in the OBR’s current forecast up to 2019/20 are covered by the current Spending Review period. From 2020/21 onwards the DEL figures in the OBR’s current forecast were pencilled in by the Government at Autumn Budget 2017.79 These figures will be replaced in the OBR’s forecast by whatever the Chancellor announces in the Budget.
AME cannot be reasonably contained within fixed limits, because it is volatile, or demand-driven, and the OBR therefore forecasts such spending based on relevant economic determinants such as inflation, unemployment, interest rates and average earnings.
While AME cannot be kept within fixed limits the Government can take steps to control it. For instance, recent governments have introduced various policies to control spending on welfare. There are many examples of such policies; this briefing discusses two: the welfare cap (see section 2.4) and the four-year freeze on working-age benefits (see section 5.7).
What are the current spending forecasts? The OBR’s most recent forecasts show that total public spending is expected to grow by about 0.5% to 1.5% in real terms in each of the years up to 2022-23.80 This follows recent years in which total spending either grew a little or decreased. Once population growth is taken into account, total spending growth in the coming years is set to be fairly flat.
79 OBR. Economic and fiscal outlook – March 2018, para 4.94 80 OBR, Public finances databank, 25 September 2018
-3%-2%-1%0%1%2%3%4%5%6%
08/09 10/11 12/13 14/15 16/17 18/19 20/21 22/23
Source: OBR, Public finances databank, 25 September 2018
Total public spending is forecast to grow modestly% change in real terms public spending per person, relative to previous year
The OBR’s most recent forecast expects total public spending to grow a little in real terms in the coming years. But, not all areas of public spending are forecast to follow the same trend.

33 Commons Library Briefing, 23 October 2018
Not all areas of public spending are forecast to follow the same trend. The Government’s provisional figures for capital DEL (planned investment spending)81 see it increasing in three of the four years up to 2022/23, even after adjusting for population growth, while the OBR’s forecast for (the harder to control) AME is fairly flat.
The Governments provisional plans would see resource DEL82 per head (that is, planned spending on day-to-day costs) decrease in real terms in most years to 2022/23. (Please note that the axis on the below chart is different to that above.)
Some have questioned how feasible it is for day-to-day spending to decrease further in the coming years, particularly if some of the Government’s priority areas continue to be protected.
Since 2010, successive governments have given some areas of public spending – such as health, defence, education and overseas aid – relative protection from spending reductions. This has meant additional spending pressures on other ‘unprotected’ areas.83 The budgets of some departments – such as the Ministry for Housing, Communities and Local Government and the Ministry of Justice – have reduced by over 40% in
81 Capital DEL figures are adjusted to remove historical discontinuities, thus allowing
for comparable comparisons between years 82 Resource DEL figures have been adjusted to remove historical discontinuities, thus
allowing for comparable comparisons between years 83 Box 3 of the Library briefing Public spending: a brief introduction has more detail on
protected budgets.
-3%
0%
3%
6%
9%
12%
16/17 17/18 18/19 19/20 20/21 21/22 22/23
cDEL AME
Source: OBR, March 2018 Economic and fiscal outlook – supplementary fiscal tables, March 18
Capital DEL per head is expected to grow in the coming years, while AME is forecast to remain fairly flat% change in real terms CDEL and AME per person, relative to previous year
-3%
-2%
-1%
0%
1%
16/17 17/18 18/19 19/20 20/21 21/22 22/23
Source: OBR, March 2018 Economic and fiscal outlook – supplementary fiscal tables: March 18
Resource DEL per head is set to decrease in most years until 2022-23% change in real terms RDEL per person, relative to previous year

34 Autumn Budget 2018
real terms since 2010/11, while spending by English councils fell by 19% in the eight years since 2009/10.84
The Institute for Government says that for those departments who have already faced budget reductions, finding further ways to reduce spending “without damaging frontline services is likely to prove more challenging, as many of the short-term ‘belt-tightening’ options, such as wage freezes and staff cuts, have been exhausted”.85 They point to serious concerns about certain services, such as prisons, adult social care and neighbourhood services (for example bin collections and libraries).86
Even for those areas of public spending that have been relatively protected, such as health, there are other factors putting pressure on their future spending. In the case of health there are financial pressures from a growing and ageing population, and cost pressures associated with new technologies and pay.
The end of austerity? In her speech to the Conservative Party Conference on 3 October 2018, the Prime Minister suggested that public spending would start to increase again, signalling an end to austerity:
…when we've secured a good Brexit deal for Britain, at the Spending Review next year we will set out our approach for the future.
Debt as a share of the economy will continue to go down, support for public services will go up.
Because, a decade after the financial crash, people need to know that the austerity it led to is over and that their hard work has paid off […] So that is our Conservative answer.
Fixing markets not destroying them.
Helping with the cost of living.
Ending austerity.87
What is meant by ‘austerity’?
There is no single definition of austerity but, broadly speaking, it is often thought to mean bringing the deficit down largely through controlling public spending. For some, austerity has been about the reductions seen in day-to-day spending on public services, particularly those services and departments where the Government has not offered any spending protection. Austerity has also been associated with steps taken by the Government to control welfare spending (such as the four year working-benefits freeze, see section 5.7).
The above definitions are by no means exhaustive, and in truth austerity is a subjective term that people will often associate with their experiences of stretched public services and other government spending.
84 IFS. Trade-offs for the forthcoming Spending Review presentation, 16 October 2018 85 Institute for Government, Whitehall Monitor 2018, January 2018 86 Institute for Government, Performance Tracker 2018, October 2018 87 Telegraph.co.uk, Theresa May's Conservative party conference speech - full
transcript, 3 October 2018
There is no single definition of austerity.

35 Commons Library Briefing, 23 October 2018
What do current plans reveal about ending austerity?
Here our discussion of austerity is limited to day-to-day spending on public services (resource DEL). We also consider areas of spending that have not been protected by recent governments, which have already experienced relatively large decreases in their spending.
The charts above suggest that under current plans, resource DEL (which largely represents day-to-day spending on public services) will continue to decrease to 2022/23. If ending austerity is defined as meaning no further falls in real (inflation adjusted) day-to-day spending then the Chancellor will need to increase spending in the plans he presents in the Budget. To keep day-to-day spending at its 2019/20 level would require spending in 2022/23 to be £2 billion higher in real terms than its current forecast. To keep it at its per capita 2019/20 level would require it to be £7 billion higher.
However, if ending austerity is defined as meaning no decreases in unprotected departments’ spending then more money will be required, especially once spending commitments to protected departments made by the Government – like that on additional NHS funding – since Spring Statement 2018 are factored in. The IFS estimates that under current plans, spending that is not currently protected will be around £15 billion lower in 2022/23 than in 2019/20.88
With austerity being such a subjective term, it is unlikely that increasing spending as discussed above will be considered as an end to austerity in all eyes. For instance, the figures above say nothing about spending on welfare, nor would the increased spending discussed reverse the falls in spending already experienced by some public services.
How does ending austerity fit in with eliminating the deficit?
If the Government were to accept that additional spending is required to end austerity, this may lead to conflicts with its targets for reducing and eventually eliminating the deficit and its pledge to keep taxes as low as possible. The OBR already judges that the Government’s aim of eliminating the deficit by the mid-2020s is challenging; increasing spending without raising taxes would make it even more so. The IFS’ conclusion is that “Without much higher [economic] growth than forecast or substantial tax rises, ‘ending austerity’ is not compatible with eliminating the deficit by the mid 2020s’.89
88 Institute for Fiscal Studies, The IFS Green Budget, October 2018 89 ibid
Increasing public spending to ‘end austerity’ may conflict with the Government’s targets for reducing and eventually eliminating the deficit.
What is required to end austerity depends on the definition used.

36 Autumn Budget 2018
4. Developments since Spring Statement 2018
4.1 Government has announced more funding for NHS England
In June, the Government announced that the NHS in England will receive real terms (adjusted for inflation) funding increases over the five years to 2023/24.90 NHS England will receive an annual increase of around £4 billion over the period. The extra funding will also lead to increased funding for the devolved administrations, through the Barnett formula.
90 HM Government Press Release. Prime Minister sets out 5-year NHS funding plan, 18
June 2018
0
5
10
15
20
25
2019/20 2020/21 2021/22 2022/23 2023/24
Day-to-day NHS spending in England will be around £20 billion higher in 2023/24 than it is in 2018/19Cumulative increase in NHS England's resource budget, £ billion, real terms (2018/19 prices)
Summary
Since Spring Statement 2018, the Government has announced policies that have implications for the public finances. Reclassification decisions taken by the ONS will also impact on borrowing and public sector net debt, while government asset sales have lowered debt a little.
• The Government’s most significant announcement will see the NHS in England receive a funding increase worth around £20 billion (inflation-adjusted) by 2023/24. The Chancellor is expected to explain how the spending will be funded in the Budget. Respected think tanks expect that the funding will come from a mixture of extra borrowing and tax increases. Both the Prime Minister and the Chancellor have hinted that the Budget is likely to feature some tax rises. However, it seems likely that the OBR will lower its underlying forecasts for borrowing, potentially giving the Chancellor more scope for additional borrowing.
• Fuel duty will be frozen in April 2019 for the ninth year, at a cost of around £900 million a year. Previous years of the freeze now cost over £6 billion a year.
• Councils are going to be allowed to borrow more to build homes, potentially costing £1 billion a year.
• A planned change to self-employed NICs has been abandoned, potentially saving the Government around £400 million a year.
The Government has announced extra funding for the NHS. The Budget is expected to show how the additional funding will be paid for.

37 Commons Library Briefing, 23 October 2018
The Government has indicated that it will fund at least some of the commitment by increasing taxes and/or reducing other spending. More borrowing is also an option. The Chancellor is expected to set out further detail in the Budget.91
How could it be paid for?
More borrowing? The Resolution Foundation – an economic think tank – believes that the Government will have to borrow to fund at least part of increased NHS funding. The Resolution Foundation say that the Government’s lack of an outright majority – potentially making it difficult to get significant tax changes through Parliament – and there being less immediate pressure on reducing the deficit, makes it almost certain that borrowing will be required.92
The Government’s targets for the public finances currently place some constraint on its ability to borrow to meet the NHS funding commitment. As shown in section 3, the Government aims to reduce the structural deficit to 2% of GDP in 2020/21 and eliminate the deficit entirely by the mid-2020s. It also has a target to reduce debt as a percentage of GDP.
The OBR’s latest forecast suggests that the Government could borrow a little more whilst still meeting its 2020/21 deficit target. The OBR forecasts that the Government is on course to meet its 2020/21 deficit target with a margin of £15 billion. Borrowing to fund the full NHS commitment would more than halve this margin. However, what really matters for the Chancellor is the forecasts that OBR produces for the Budget, not the previous set of forecasts. If the OBR thinks the outlook for the economy and public finances has improved since March 2018 then a lower borrowing forecast is likely, increasing the amount the Chancellor can borrow while still meeting his 2020/21 target. Of course, the opposite would be true if the OBR’s view on the outlook has worsened. As we saw in section 2.1, it appears likely that the OBR may lower its borrowing forecasts for 2018/19 and future years, potentially giving the Chancellor more scope for additional borrowing.
The Government’s overall target for the public finances – eliminating the deficit by the mid-2020s – looks like offering less scope for additional borrowing. Reaching a budget balance or surplus already appeared ‘challenging’ to the OBR, even before the additional £20 billion funding for the NHS had been announced.93 Eliminating the deficit is likely to become more of a challenge if significant extra borrowing is required to pay for the additional NHS funding.
91 WQ 156632 NHS: Finance 92 Resolution Foundation, Health finances? Options for funding an NHS spending
increase, June 2018, summary. 93 OBR. Economic and fiscal outlook – March 2018, para 1.48
It seems likely that the Government will borrow to pay for part of increased NHS funding, but its targets for the public finances may constrain how much it can borrow.
The OBR’s updated outlook for the economy and public finances will be key to determining the extent to which the Chancellor can borrow to fund additional NHS funding.

38 Autumn Budget 2018
Reducing other spending? Both the IFS and the Resolution Foundation agree that there isn’t much scope for reducing spending on other public services to fund the NHS commitment. The IFS says that funding the NHS commitment through spending less on other services looks difficult “not least given the very sharp cuts in many areas of public spending seen over the last eight years.” If the Government were to pursue this approach, the detail is likely to come in the 2019 Spending Review (see section 3) where departments’ future budgets will be set.
The Resolution Foundation also suggest that there is little room to lower welfare spending. They point out that the Government has already promised “no new cuts” to welfare and that getting Parliament’s approval for any new reductions to welfare may be difficult.
The Brexit dividend
When the Government announced the additional NHS funding, it claimed that the ‘Brexit dividend’ – money that previously covered the cost of the UK’s EU membership – could be used to pay for part of it. The OBR suggests that there may not be much of a medium-term ‘Brexit dividend’ once the UK’s financial settlement to the EU and other Brexit-related spending commitments are taken into account:
It [the Government] has also said that the [NHS funding] announcement will be funded in part by a ‘Brexit dividend’, although our provisional analysis suggests Brexit is more likely to weaken than strengthen the public finances overall. There will be direct savings from the net contributions to the EU budget that the UK will no longer have to make, but it is unclear how much will be available after payments towards the agreed withdrawal settlement and other Brexit-related spending commitments.94
Taxing more? With borrowing constrained and spending pressures on other public services, the IFS believes that higher taxes are “probably the main source of additional money for the NHS in the medium term”.95 Similarly, the Resolution Foundation say that, alongside additional borrowing, tax rises appear inevitable. Most significantly, the Prime Minister has said that “across the nation taxpayers will have to contribute a bit more in a fair and balanced way to support the NHS we all use” and the Chancellor has said “We may have to raise a little more tax in order to support the NHS and deliver on our pledge”.9697
Clearly, a range of options is available for increasing tax revenues.98 For purely illustrative purposes, the chart below lays out the potential revenues raised from some possible tax changes. Changes to VAT rates aren’t included below – the 2017 Conservative Party Manifesto ruled out increases to the level of VAT.99
94 OBR. Fiscal sustainability report – July 2018, para 19 95 IFS. Does the NHS need more money and how could we pay for it?, page 10 96 PM speech on the NHS: 18 June 2018 97 ‘Hammond: Any Budget tax rises ‘will be absolute minimum’, BBC, 12 October 2018 98 Chapter 5 of the IFS’ Green Budget 2018 discusses options for raising taxes 99 2017 Conservative Manifesto, page 14
Respected think tanks agree that there isn’t much scope for reducing other public spending.
Both the Prime Minister and Chancellor have both suggested that some of the NHS’ additional funding could come from raising more tax.

39 Commons Library Briefing, 23 October 2018
In addition to making direct changes to tax rates and allowances, the Chancellor could raise revenues by altering other areas of the tax system, such as reliefs. There has been some discussion in the press that the Chancellor may introduce some changes to pension tax relief,100 but the Government recently stated – in response to a Treasury Committee report into household income, saving and debt – that it isn’t planning any reforms to pension tax relief.101 See the Library briefing Reform of pension tax for more.
Cancelling corporation tax rate reduction
The Government has legislated to reduce the main corporation tax rate to 17% in April 2020. This was a commitment in the 2017 Conservative Party Manifesto.102 It has been suggested that this policy could be reversed to raise some of the funding committed to the NHS. The Resolution Foundation estimates that reversing the rate reduction would improve the public finances by around £5.2 billion in 2020/21 and £5.7 billion by 2022/23.103 These are short-run estimates, and, as the IFS points out, the revenue raised in the long run may be less. This is because short-run estimates don’t take account of the longer-run impact of corporation tax rates on UK investment.104
100 ‘Will Philip Hammond’s Budget raid pensions tax relief?’, FT, 12 October 2018 101 Treasury Committee, 7th Special Report - Household finances: income, saving and
debt: Government Response to the Committee’s Nineteenth Report, 12 October 2018
102 op cit 103 Resolution Foundation. Healthy finances? Options for funding an NHS spending
increase, June 2018, page 27 104 IFS. Green Budget 2018, Chapter 5: Options for raising tax, 16 October 2018
0 2 4 6 8
Raise all stamp duty land tax rates by 1%point
Increase insurance premium standardrate by 1% point
Increase main employee rate by 1% point
Increase additional rate by 1% point
Increase employer rate by 1% point
Lower personal allowance by 1% (around£120)
Lower personal allowance by 10%(around £1,200)
Increase basic rate by 1p
Increase higher rate by 1p
Increase additional rate by 1p
Larger revenues can be raised from making changes to the biggesttaxes, such as income tax and National Insurance contributions (NICs)Potential revenue raised in 2019/20 from Illustrative tax changes, £billion
Income tax
NICs
Other taxes
source: HMRC. Direct effects of illustrative tax changes, April 2018
The Government has legislated to lower the corporation tax rate to 17% in April 2020. It has been estimated that cancelling this change could increase revenues by around £5.2 billion.

40 Autumn Budget 2018
4.2 Fuel duty will be frozen in April 2019 for the ninth year
In her speech to the 2018 Conservative Party Conference, the Prime Minister announced that fuel duty would be frozen in April 2019. This will be the ninth year that fuel duty has been frozen. The freeze will cost around £900 million a year.105
The previous eight years of the freeze now costs the Government over £6 billion a year.106
4.3 Councils will be able to borrow more to build homes
At the 2018 Conservative Party Conference, the Prime Minister announced that borrowing caps for councils will be lifted, allowing them to build more homes. How much the policy costs will depend on the extent to which councils take advantage of the extra borrowing capacity – the FT suggest the cost could be around £1 billion per year.107
Local authorities with housing stock are required to record all income and expenditure in relation to these dwellings in their Housing Revenue Account (HRA).108 The borrowing caps were introduced alongside the introduction of self-financing for local housing authorities’ HRAs in April 2012.
Since their inception, the caps have proved controversial. Local authorities argue that they are already subject to the Prudential Code for Capital Finance and can demonstrate a good track record which should be viewed as a sufficient safeguard against imprudent borrowing.109 The Treasury Committee has – in its report into Autumn
105 HMRC. Direct effects of illustrative changes (April 2018); ONS. Consumer price
inflation, UK: August 2018 106 IFS. Autumn Budget 2017, Tax and benefit measures, 15 November 2017 107 ‘Philip Hammond eyes tax swoop to pay for Budget promises’, FT, 8 October 2018 108 The Library briefing Local housing authorities - the self-financing regime: progress
and issues has more on the reforms. 109 HC Library. Local housing authorities – the self-financing regime: progress and
issues, February 2015
45
50
55
60
65
70
75
80
2009/10 2011/12 2013/14 2015/16 2017/18 2019/20 2021/22
Main rate of fuel duty: 57.95 per litre
March 2018policy plan
Successive policy plans at Budget/Autumn Statement
Government policy to increase fuel duty by inflation has not been implemented for the past eight yearsMain fuel duty rate (pence per litre)
source: OBR. Tax by tax, spend by spend, fuel duties
Freezing fuel duty in April 2019 could cost in the region of £900 million a year.
Councils are going to be allowed to borrow more to build homes.

41 Commons Library Briefing, 23 October 2018
Budget 2017 which had raised the cap for authorities in areas of high housing demand – recommended that the cap be removed for all local authorities.110
4.4 A change to National Insurance contributions for the self-employed has been cancelled
The Government recently cancelled a planned change to the National Insurance contributions (NICs) paid by the self-employed. The change – which would have abolished Class 2 NICs – was set to cost the Exchequer around £400 million a year, so reversing the policy will improve the public finances to a similar extent.111
Individuals who are self-employed are liable to pay Class 2 NICs, which is a weekly flat-rate charge. The proposed change – previously expected in April 2019 – was intended to simplify the tax system for the self-employed. On 6 September, the Government announced that it was cancelling the abolition of Class 2 NICs, citing the potential problems it would bring for some self-employed individuals on the lowest profits.112 The Library briefing National Insurance Contributions (NICs) and the self-employed has further information.
4.5 ONS classification changes will have a small impact on the public finances
The ONS has reclassified Welsh and English housing associations as private sector organisations for the purpose of its economic statistics, such as the public sector finances. The reclassification moves the providers out of the public sector, which reduces public sector net debt and lowers borrowing.
Housing associations in Wales and Scotland had previously – since a decision taken by the ONS in 2016 – been considered part of the public sector.113 The Welsh and Scottish governments have brought through legislation that addresses the factors that had seen the ONS move their housing associations to the public sector,114 allowing the ONS to reclassify them as private sector bodies.
For Wales, the change is effective from 13 June 2018 and reduces public sector net debt by £2.7 billion and public sector net borrowing by around £0.2 billion a year.115 For Scotland, the change is effective from 19 September 2018 and reduces public sector net debt by £3.4 billion and public sector net borrowing by around £0.2 billion a year.
110 Treasury Committee, Autumn Budget 2017, 22 January 2018, HC 600 2017-19,
para 100 111 HM Treasury. Autumn Budget 2017, Table 2.2 112 National Insurance Contributions: Written statement HCWS944, 6 September 2018 113 ONS. Statistical classification of registered providers of social housing in Scotland,
Wales and Northern Ireland: September 2016, 29 September 2016 114 The Regulation of Registered Social Landlords (Wales) Act 2018 and the Housing
(Amendment) (Scotland) Act 2018 and The Regulation of Social Housing (Influence of Local Authorities) (Scotland) Regulations 2018.
115 ONS. Public sector finances, UK: June 2018, July 2018
The ONS now class housing associations in Wales and Scotland as being in the private sector. This has a positive, but relatively small, impact on the public finances.

42 Autumn Budget 2018
4.6 Government asset sales have reduced debt a little
During recent months the government has carried out some sales that lower public sector net debt:
• On 5 April 2018, Ofcom announced the sale of two bands of 4G and 5G spectrum to the owners of the UK’s main mobile operators. The sale reduces public sector net debt by £1.4 billion and has a small impact on the deficit over the 20 year life of the sale agreement;116
• On 4 June 2018, UK Government Investments Limited (UKGI) announced the successful completion of the disposal of 7.7% of HM Treasury's shareholding in RBS. The sale reduces public sector net debt by £2.5 billion
• On 26 April 2018, the government announced the £5.3 billion sale of Bradford & Bingley (B&B) mortgages. The sale reduces public sector net debt by £5.3 billion.
How much these sales change the OBR’s forecast of public sector net debt depends on the extent to which it expected them in its March 2018 forecast. The mobile phone spectrum sale raised more than the OBR expected,117 but it seems that the other sales were broadly in line with expectations.
116 The approach to borrowing is pending a formal classification decision 117 OBR. Economic and fiscal outlook – March 2017, para 4.174

43 Commons Library Briefing, 23 October 2018
5. Other issues
Summary
There have been calls on the Chancellor to announce additional funding for Universal Credit (UC) in the Budget. Concerns have been voiced about substantial losses some families could experience on moving from legacy benefits to Universal Credit.
Conservative Party Manifesto 2017 pledged to increase income tax thresholds, which would benefit income taxpayers, by April 2020. The Government has not yet set out the path for achieving the pledged levels. The Chancellor may take the opportunity to do so in the Budget.
The Government has been considering tax issues including off-payroll working in the private sector, the impact of taxes on tourism in Northern Ireland and taxing the digital economy. Some of these may be addressed in the Budget.
A final report is expected from Sir Oliver Letwin following his review into the gap between the number of planning permissions being granted against those built, in areas of high demand.
5.1 Universal Credit Concerns about substantial losses some families could experience on moving from legacy benefits to Universal Credit (UC) has led to calls on the Chancellor to announce additional funding for UC in the Budget.
What is Universal Credit and how is it being rolled-out? UC is replacing means-tested benefits and tax credits for working-age households. When fully introduced, around 7 million households are expected to receive payments totalling more than £60 billion a year.118
The Department for Work and Pensions originally envisaged that Universal Credit would be fully introduced by 2017, but roll-out has been pushed back several times.119 The Full Service – the final, digital version of UC, available for all claimant groups – is now expected to be operational throughout all parts of the United Kingdom by the end of 2018. Where the Full Service has been introduced, new claims for “legacy” benefits – the benefits and tax credits UC is replacing – cannot be made (with limited exceptions). Legacy benefit claimants do not transfer to UC automatically, but a change in circumstances may trigger a move to UC. The DWP refers to this as “natural migration.”
Legacy benefit and tax credit claimants not experiencing a change in circumstances (an estimated 2 million households, including 745,000 receiving income-related Employment and Support Allowance and around 1 million families on tax credits) will transfer to UC by a process known as “managed migration.” This is expected to begin in July 2019 and be completed in 2023. Claimants moving to Universal Credit at the managed migration stage whose entitlement to UC is less than their existing benefits will receive “transitional protection” so that they do 118 Office for Budget Responsibility, Welfare trends report, Cm 9562, January 2018 119 For the latest plans see Commons Library briefing CBP-8299, Universal Credit roll-
out: 2018-19, 14 June 2018
There have been calls on the Chancellor to announce additional funding for Universal Credit.

44 Autumn Budget 2018
not lose out in cash terms. No such protection is available for claimants who naturally migrate to UC, but in June the Government announced that legacy benefit claimants in receipt of the Severe Disability Premium (SDP) are to be prevented from moving onto UC until the managed migration stage when they can qualify for transitional protection.120
In summer 2018 the Social Security Advisory Committee (SSAC) launched a public consultation on the Government’s plans for managed migration.121 Welfare rights organisations and pressure groups are concerned that DWP’s proposed approach places the burdens of arranging the move to UC, and the financial risks associated with it, almost entirely on claimants themselves. There is also concern that the Government is pressing ahead with managed migration when there is evidence that Universal Credit is causing hardship for various reasons that need to be addressed.122
SSAC has submitted its report to the Secretary of State for Work and Pensions. DWP will then consider any recommendations SSAC has made and issue its response together with the final draft regulations on managed migration, which are expected to be laid before Parliament later this year.
What would some people like the Chancellor to address in the Budget? Concerns about substantial losses some families could experience on moving from legacy benefits to Universal Credit has led to calls on the Chancellor to announce additional funding for UC in the Budget.123 One suggestion is that the Government should reverse the controversial cuts to the “work allowances” – the amounts families can earn each month before their UC award begins to reduce – which took effect from April 2016. Although the impact varies according to household circumstances, the changes were criticised by some commentators as reducing the generosity of UC for working claimants and, for some groups, incentives to enter or progress in work.124 The Government subsequently reduced the UC taper rate – the rate at which UC is withdrawn as earnings increase – from 65% to 63% in April 2017, ultimately benefiting around 3 million working households. The taper rate reduction was welcomed, but for most affected by the work allowance cuts the gain will be insufficient to offset the losses because of that measure and other changes.125
120 Universal Credit: Written statement - HCWS745, 7 June 2018 121 SSAC, Moving claimants to Universal Credit from other working age benefits, 22
June 2018 122 See section 1.6 of Commons Library Debate Pack CDP-2018-0221, Opposition Day
Debate: Universal Credit, 16 October 2018 123 See for example “Universal credit will leave some worse off, Esther McVey admits”,
The Times, 11 October 2018; “Universal Credit: Chancellor pressured over welfare system”, BBC News, 13 October 2018
124 For more detailed analysis of the impact of the work allowance cuts see Commons Library briefing CBP-7446, Universal Credit changes from April 2016, 16 November 2016
125 A Commons Library blog, Universal Credit: jam tomorrow? looks at the combined impact of the work allowance and taper changes on a range of example families.

45 Commons Library Briefing, 23 October 2018
Other organisations calling for the work allowances to be restored include the Child Poverty Action Group126, the Resolution Foundation127, and the Joseph Rowntree Foundation. JRF analysis suggests that using additional spending to increase work allowances would have a greater impact on poverty and give a larger boost to households in lower income deciles compared with spending the same amount reducing the UC taper.128 It argues that the money necessary to meet pledges to increase income tax thresholds129 would be better spent to pay the “lion’s share” of increased work allowances.130
The table below gives the estimated savings/costs resulting from the work allowance cuts and the taper rate reduction.
On 16 October, BBC News reported that it had seen “leaked documents” revealing “plans to spend hundreds of millions of pounds to prevent claimants suffering hardship as they move onto [Universal Credit]”.131 According to the BBC, the documents show that:
• Plans have been drawn up to continue to pay Income Support, ESA and JSA to people moving onto UC for two weeks – in line with the existing Housing Benefit run-on introduced in April 2018. A run-on for Child Tax Credit had however been ruled out, because of the difficulties getting DWP and HMRC systems to work together. The documents acknowledged that this would be presented as unfavourable treatment for lone parents, “who many argue are the most in need of protection of the effects of the move to UC.”
• For people repaying an advance (a payment to people awaiting their first payment of UC), the maximum amount that can be deducted will be reduced from 40% to 30% of their monthly standard allowance.
• More help will be given to the self-employed, “…after warnings they could be left in serious financial trouble because of incorrect assumptions by the Department for Work and Pensions about their earnings.”
126 CPAG Budget representation, September 2018 127 Delaying rollout of Universal Credit is a sensible step – but fundamental reforms still
needed, Resolution Foundation press release, 16 October 2018 128 JRF, Comparing Investment in Universal Credit Work Allowances and Taper Rate,
September 2018 129 See section 5.2. The pledge is not yet official Government policy, so the cost of
meeting it has not been factored into the public finances. 130 JRF, Time to boost living standards for 10 million people living in struggling families
in the Budget, 12 October 2018 131 “Universal Credit rollout delayed again”, BBC News, 16 October 2018
Annual savings/costs resulting from changes to Universal Credit work allowances and taper ratePositive figures are Exchequer savings; negative figures are Exchequer costs£ million, nominalAnnounced at fiscal event: Measure description: 2016-17 2017-18 2018-19 2019-20 2020-21 2021-22 2022-23
Summer Budget 2015 Reduce work allowances in UC 120 1,225 2,225 2,850 3,190 * 3,440 * 3,560
Autumn Statement 2016 Universal Credit: reduce taper to 63% 0 -35 -175 -400 -570 -700 * -770
Total 120 1,190 2,050 2,450 2,620 * 2,740 * 2,790
Source: HM Treasury Budget 2016 table 2.2 line aw & Spring Budget 2017 table 2.2 line a. Figures with an * asterisk are HoC Library calculations based on UC migration profile set out in OBR Welfare Trends report Jan 2018, which assumes completion of UC managed migration in September 2022. The DWP has since revised the completion date of managed migration to the end of the fiscal year 2022-23.
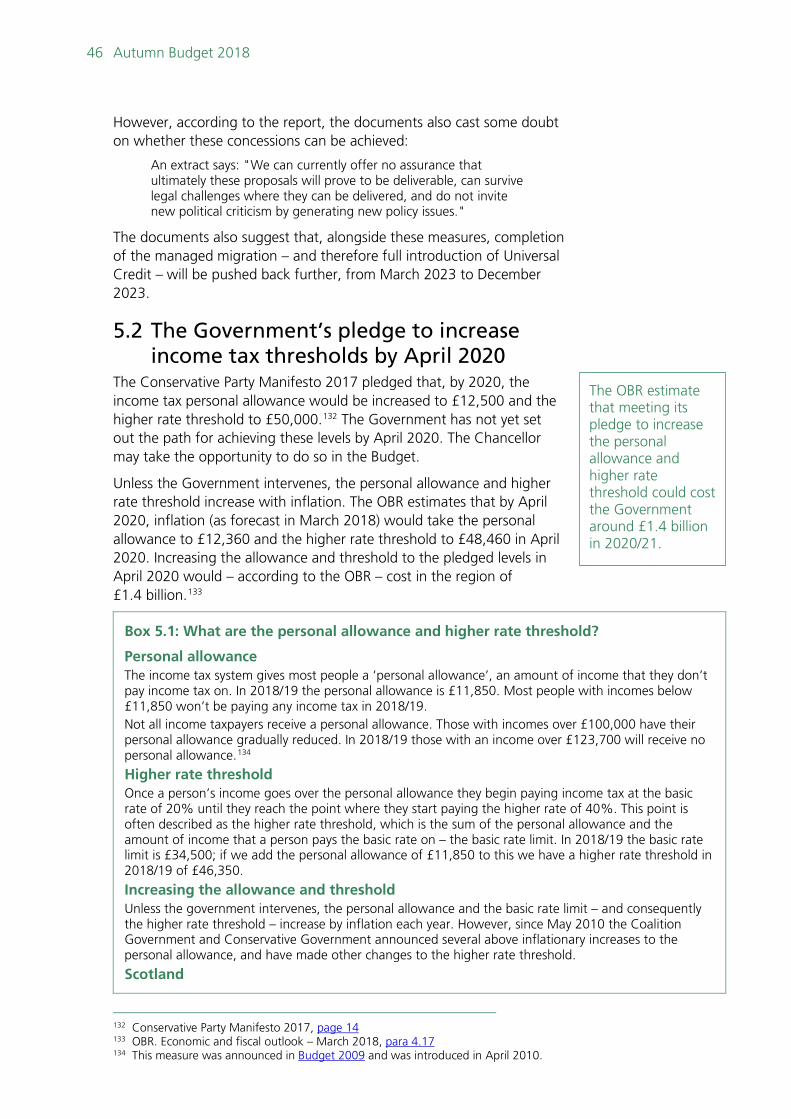
46 Autumn Budget 2018
However, according to the report, the documents also cast some doubt on whether these concessions can be achieved:
An extract says: "We can currently offer no assurance that ultimately these proposals will prove to be deliverable, can survive legal challenges where they can be delivered, and do not invite new political criticism by generating new policy issues."
The documents also suggest that, alongside these measures, completion of the managed migration – and therefore full introduction of Universal Credit – will be pushed back further, from March 2023 to December 2023.
5.2 The Government’s pledge to increase income tax thresholds by April 2020
The Conservative Party Manifesto 2017 pledged that, by 2020, the income tax personal allowance would be increased to £12,500 and the higher rate threshold to £50,000.132 The Government has not yet set out the path for achieving these levels by April 2020. The Chancellor may take the opportunity to do so in the Budget.
Unless the Government intervenes, the personal allowance and higher rate threshold increase with inflation. The OBR estimates that by April 2020, inflation (as forecast in March 2018) would take the personal allowance to £12,360 and the higher rate threshold to £48,460 in April 2020. Increasing the allowance and threshold to the pledged levels in April 2020 would – according to the OBR – cost in the region of £1.4 billion.133
Box 5.1: What are the personal allowance and higher rate threshold?
Personal allowance The income tax system gives most people a ‘personal allowance’, an amount of income that they don’t pay income tax on. In 2018/19 the personal allowance is £11,850. Most people with incomes below £11,850 won’t be paying any income tax in 2018/19. Not all income taxpayers receive a personal allowance. Those with incomes over £100,000 have their personal allowance gradually reduced. In 2018/19 those with an income over £123,700 will receive no personal allowance.134
Higher rate threshold Once a person’s income goes over the personal allowance they begin paying income tax at the basic rate of 20% until they reach the point where they start paying the higher rate of 40%. This point is often described as the higher rate threshold, which is the sum of the personal allowance and the amount of income that a person pays the basic rate on – the basic rate limit. In 2018/19 the basic rate limit is £34,500; if we add the personal allowance of £11,850 to this we have a higher rate threshold in 2018/19 of £46,350.
Increasing the allowance and threshold Unless the government intervenes, the personal allowance and the basic rate limit – and consequently the higher rate threshold – increase by inflation each year. However, since May 2010 the Coalition Government and Conservative Government announced several above inflationary increases to the personal allowance, and have made other changes to the higher rate threshold.
Scotland
132 Conservative Party Manifesto 2017, page 14 133 OBR. Economic and fiscal outlook – March 2018, para 4.17 134 This measure was announced in Budget 2009 and was introduced in April 2010.
The OBR estimate that meeting its pledge to increase the personal allowance and higher rate threshold could cost the Government around £1.4 billion in 2020/21.

47 Commons Library Briefing, 23 October 2018
Income tax bands are different in Scotland. Since April 2017, the Scottish Parliament has been responsible for setting income tax rates and thresholds (except the personal allowance, which remains reserved) for Scottish income taxpayers.135
5.3 Off-payroll working in the private sector may be addressed
Some individuals who work through their own limited company are undertaking jobs that would ordinarily mean they are employees of the business that they are working for. In those circumstances, existing legislation (often referred to as IR35) on off-payroll working requires them to pay broadly the same taxes as employees.
Public sector employers are already responsible for ensuring that contractors working for them pay the correct tax, which in some cases may be broadly the same as employees. Previously, the onus was on the contractor to ensure they were compliant. The Government announced the change in responsibility – which aims to reduce non-compliance – at Autumn Budget 2016. The measure is expected to raise around £100 million in 2019/20.136 The Government may extend this responsibility to private sector employers.137
In May 2018, the Government launched a consultation on IR35 in the private sector – the consultation paper states that extending the public sector reform to the private sector is the Government’s lead option, although it recognises “that public authorities faced challenges in implementing the reform and that this is a concern for businesses and individuals working in the private sector”. The consultation closed on 10 August 2018, and the Government could report on its findings at the Budget.
The Library briefing Personal service companies & IR35 provides further details.
135 These powers are for non-savings and non-dividend income 136 HM Treasury. Budget 2016: policy costings, March 2016, page 42 137 ‘Hammond plans tax crackdown on 'synthetic self-employed'’, BBC, 11 October
2018
Public sector employers are responsible for ensuring that contractors working for them pay the correct tax. The Government has consulted on extending this responsibility to private sector employers.

48 Autumn Budget 2018
5.4 A report on planning permissions and buildings is expected
On 14 January 2018, MHCLG launched an independent review chaired by Sir Oliver Letwin which is looking to “explain the gap between the number of planning permissions being granted against those built in areas of high demand.”
Sir Oliver Letwin published a draft analysis in June 2018. Final recommendations are expected to be presented to the Chancellor and the Housing Secretary at the Budget.
The Library briefing Tackling the under-supply of housing provides further details.
5.5 Consultation on taxes and tourism in Northern Ireland: outcome expected
Between 13 March and 5 June 2018, the Government ran a consultation on the impact of VAT and Air Passenger Duty (APD) on tourism in Northern Ireland. The consultation sought evidence that demonstrates the significance of any impacts that VAT and/or APD have on tourism, or that helps show how VAT and/or APD might be used to support the sector in Northern Ireland. The Government will report on the outcome of this consultation at the Budget.138
5.6 The Chancellor may address how the digital economy is taxed
Digitalisation has brought significant change to the economy, with more transactions and services being provided online. The speed and scale of the changes has forced nations across the world to think about the implications for their tax systems. Countries are working together to reform the international tax system for the digital economy, but the Chancellor said, during his 2018 Conservative Party Conference speech, that the UK may introduce some of Digital Services Tax until international agreements are sorted out.139
The Government’s current position on taxing the digital economy is set out in a position paper, published in March 2018.140 The paper was an update produced after the Government invited responses to a previous position paper, published at Autumn Budget 2017.141
5.7 Fourth year of working-age benefits freeze
Working-age benefits will be frozen in 2019/20. The April 2019 freeze is expected to save the Government £1.5 billion. This will be the final year
138 PQ 155201. Tourism: Northern Ireland 139 Philip Hammond speech to Conservative Party Conference 2018 140 HM Treasury. Corporate tax and the digital economy: position paper update, March
2018 141 HM Treasury. Corporate tax and the digital economy: position paper, Nov 2017
Sir Oliver Letwin has been looking into the gap between planning permissions being granted against those built. A final report is expected at the Budget
49 Commons Library Briefing, 23 October 2018
of the four year freeze that was announced at Summer Budget 2015. The freeze has meant that working-age benefits – such as Jobseeker’s Allowance, Employment and Support Allowance, Income Support, Child Benefit, Tax Credits etc – have not increased in line with inflation.
When the Government introduced the four year freeze, it was expected to save around £3.9 billion by 2019/20.142 The Resolution Foundation estimates that the four-year freeze is actually saving around £4.4 billion in 2019/20.143 The freeze is saving more than originally estimated because inflation in recent years has been higher than was expected when the Government made its original estimate.
142 HM Treasury. Summer Budget 2015, July 2015, Table 2.1 143 Resolution Foundation. Despite ‘the end of austerity’, April promises another deep
benefit cut, 17 October 2018

50 Autumn Budget 2018
6. Next steps What happens after the Budget statement? The Chancellor’s Budget speech and the accompanying Budget report are only the start of the process for raising taxes for the upcoming year. Parliament must give its provisional approval to the tax changes proposed in the Budget and will debate the Budget over four days. Parliament’s provisional approval is given to some measures immediately after the Budget statement with others approved within 10 sitting days of the Budget. The provisional arrangements must then be given permanent effect; this is done later through the Finance Bill.
The Library briefing The Budget and the annual Finance Bill sets out the way that Parliament debates the Budget and scrutinises the Finance Bill.
The Institute for Government recently published an explainer Voting on the Budget.
Parliament’s approval of spending Although the Chancellor may often mention public spending in his Budget speech, the procedure by which Parliament scrutinises and approves of government expenditure is quite separate. This procedure is set out in the following documents:
• House of Commons Library, Main Estimates: Government spending plans for 2018/19, May 2018
• Scrutiny Unit, Financial scrutiny uncovered, November 2017
Box 6.1: Government’s fiscal calendar
The fiscal calendar can change, but the below is a summary of the process and timings for a typical financial year:
• April: Government departments’ spending plans (Main Estimates) are published
• July: Government departments’ spending plans (Main Estimates) are debated in the House – using new procedures
• July: a Supply and Appropriation (Main Estimates) Bill is introduced and, if agreed, receives Royal Assent, formalising Main Estimates as departments’ initial budgets for the year
• July: Government departments lay their Annual Reports and Accounts (for the financial year ending the previous March) before Parliament
• November: the Budget is published. Following the Budget a Finance Bill is introduced. Royal Assent of the Bill should be reached in the spring, before the start of the following financial year.
• November: the OBR publishes its economic and fiscal forecasts.
• February: Government departments’ revised spending plans (Supplementary Estimates) are published, debated in the House – using new procedures
• February: Government requests advance funding for the first four months of the next financial year (Vote on Account) for each department.
• March: a Supply and Appropriation (Anticipations and Adjustments) Bill is introduced and, if agreed, receives Royal Assent, formally agreeing to revise in-year budgets as set out in Supplementary Estimates; and advance money for the new year in the Vote on Account
• March: the OBR’s economic and fiscal forecast is published. The Chancellor makes a formal response to the forecast in the spring statement. The spring statement may also review, and consult on, wider challenges for the economy and public finances.

51 Commons Library Briefing, 23 October 2018
Further information is available in the following Library briefings:
• The Budget and the annual Finance Bill, September 2018
• Main Estimates: Government spending plans for 2018/19, May 2018
• Public spending: New debates in the House, January 2018
• Revised Government spending plans for 2017-18, February 2018

52 Autumn Budget 2018
Appendix 1: Sources of further information Library’s Brexit briefings The Library’s briefings, and other relevant parliamentary material, on Brexit are pulled together in parliament’s Brexit hub.
Section 6 of Productivity in the UK looks at the channels through which Brexit can affect future productivity – and growth – prospects.
Look out for spring statement related blogs on the Library’s blog, Second Reading.
HM Treasury Spring Statement 2018
Autumn Budget 2017
Spring Budget 2017
Autumn Statement 2016
Budget 2016
Office for Budget Responsibility Economic and fiscal outlook, March 2018
Economic and fiscal outlook, November 2017
Economic and fiscal outlook, March 2017
Monthly commentary on the public finances
Public finances databank
Institute for Fiscal Studies Spring Statement 2018
Autumn Budget 2017
Post-Spring Budget 2017 Briefing
Green Budget 2018
Post-Autumn Statement 2016 Briefing
Post-Budget Briefing 2016
Commentary on the January 2018 public finances
House of Commons Library Economic indicators (an edition will be published on 23 October 2018)
Spring Statement 2018: A summary
Autumn Budget 2017: A summary
House of Commons Treasury Select Committee Inquiry into Autumn Budget 2017
Inquiry into Budget 2017

53 Commons Library Briefing, 23 October 2018
Appendix 2: Economic and public finance data 1979-2022
Economic data, 1979-2022
Real GDP Inflation Inflation ILOgrowth RPI CPI Unemployment
% % % Q4, %
1979 3.7% 13.4% .. 5.5%
1980 -2.0% 18.0% .. 8.0%
1981 -0.8% 11.9% .. 10.2%
1982 2.0% 8.6% .. 11.1%
1983 4.2% 4.6% .. 11.7%
1984 2.3% 5.0% .. 11.6%
1985 4.2% 6.1% .. 11.3%
1986 3.1% 3.4% .. 11.3%
1987 5.3% 4.2% .. 9.7%
1988 5.8% 4.9% .. 8.0%
1989 2.6% 7.8% 5.2% 7.0%
1990 0.7% 9.5% 7.0% 7.5%
1991 -1.1% 5.9% 7.5% 9.5%
1992 0.4% 3.7% 4.3% 10.4%
1993 2.5% 1.6% 2.5% 10.3%
1994 3.9% 2.4% 2.0% 9.0%
1995 2.5% 3.5% 2.6% 8.3%
1996 2.5% 2.4% 2.5% 7.8%
1997 4.3% 3.1% 1.8% 6.5%
1998 3.3% 3.4% 1.6% 6.1%
1999 3.2% 1.5% 1.3% 5.8%
2000 3.5% 3.0% 0.8% 5.2%
2001 2.8% 1.8% 1.2% 5.2%
2002 2.5% 1.7% 1.3% 5.1%
2003 3.3% 2.9% 1.4% 4.9%
2004 2.3% 3.0% 1.3% 4.7%
2005 3.1% 2.8% 2.1% 5.1%
2006 2.5% 3.2% 2.3% 5.5%
2007 2.5% 4.3% 2.3% 5.2%
2008 -0.3% 4.0% 3.6% 6.4%
2009 -4.2% -0.5% 2.2% 7.8%
2010 1.7% 4.6% 3.3% 7.9%
2011 1.6% 5.2% 4.5% 8.4%
2012 1.4% 3.2% 2.8% 7.8%
2013 2.0% 3.0% 2.6% 7.2%
2014 2.9% 2.4% 1.5% 5.7%
2015 2.3% 1.0% 0.0% 5.1%
2016 1.8% 1.8% 0.7% 4.8%
2017 1.7% 3.6% 2.7% 4.4%
2018 1.5% 3.7% 2.4% 4.5%
2019 1.3% 3.0% 1.8% 4.5%
2020 1.3% 2.9% 1.9% 4.6%
2021 1.4% 2.9% 2.0% 4.6%2022 1.5% 3.0% 2.0% 4.6%
Sources: ONS (series, IHYP, CZBH, D7G7, MGSX)
OBR, Economic and fiscal outlook, March 2018, Table 3.8, and Economy Supplementary Tables 1.6 & 1.7

54 Autumn Budget 2018
Public finance data 1979/80 to 2022/23
£ billion % GDP £ billion % GDP £ billion % GDP
1979/80 8.5 3.7% 9.2 3.9% 98.2 39.1%
1980/81 11.5 4.3% 7.7 2.9% 113.8 40.4%
1981/82 6.0 2.0% -0.4 -0.1% 125.2 40.1%
1982/83 8.5 2.6% 2.0 0.6% 132.5 38.7%
1983/84 11.8 3.3% 7.2 2.0% 143.6 38.9%
1984/85 12.5 3.3% 10.7 2.8% 157.0 38.7%
1985/86 9.0 2.1% 9.0 2.1% 162.5 37.1%
1986/87 8.4 1.8% 9.1 2.0% 167.8 34.9%
1987/88 4.7 0.9% 10.7 2.1% 167.4 31.0%
1988/89 -6.0 -1.1% 5.8 1.0% 153.7 25.7%
1989/90 -0.6 -0.1% 7.9 1.3% 151.9 23.1%
1990/91 6.2 0.9% 4.7 0.7% 151.1 21.8%
1991/92 23.0 3.2% 13.2 1.8% 165.8 22.9%
1992/93 47.1 6.4% 35.0 4.8% 201.9 26.8%
1993/94 51.6 6.6% 41.8 5.4% 249.8 31.3%
1994/95 43.8 5.4% 37.1 4.5% 290.0 34.7%
1995/96 35.3 4.1% 23.6 2.7% 322.1 36.2%
1996/97 27.7 3.0% 24.1 2.6% 347.0 36.9%
1997/98 9.1 0.9% 21.5 2.2% 358.6 36.7%
1998/99 -1.1 -0.1% 13.8 1.4% 357.8 35.0%
1999/00 -11.0 -1.0% 4.4 0.4% 349.3 32.4%
2000/01 -16.1 -1.5% -3.4 -0.3% 316.7 28.3%
2001/02 4.4 0.4% 11.9 1.0% 323.1 27.7%
2002/03 32.1 2.7% 32.9 2.7% 356.2 28.9%
2003/04 38.8 3.1% 43.2 3.4% 391.0 30.1%
2004/05 46.1 3.5% 55.0 4.1% 446.5 32.7%
2005/06 41.6 2.9% 49.5 3.5% 487.2 33.6%
2006/07 38.0 2.6% 45.0 3.0% 523.6 34.4%
2007/08 42.9 2.8% 59.2 3.8% 557.2 35.2%
2008/09 113.5 7.3% 111.2 7.1% 768.3 49.9%
2009/10 153.1 9.9% 122.7 7.9% 1,011.9 64.3%
2010/11 136.8 8.5% 111.7 7.0% 1,157.6 71.0%
2011/12 116.7 7.1% 97.4 5.9% 1,253.1 74.7%
2012/13 120.8 7.1% 101.8 5.9% 1,363.6 78.2%
2013/14 98.2 5.5% 80.0 4.5% 1,464.4 80.2%
2014/15 90.5 4.9% 84.1 4.5% 1,554.7 82.6%
2015/16 72.5 3.8% 71.9 3.8% 1,602.6 82.3%
2016/17 45.5 2.3% 45.0 2.3% 1,726.7 85.2%
2017/18 39.8 1.9% 41.0 2.0% 1,778.9 85.1%
2018/19 37.1 1.8% 40.2 1.9% 1,835.5 85.5%
2019/20 33.9 1.6% 35.8 1.6% 1,879.6 85.1%
2020/21 28.7 1.3% 29.5 1.3% 1,868.1 82.1%
2021/22 26.0 1.1% 26.1 1.1% 1,840.6 78.3%
2022/23 21.4 0.9% 21.4 0.9% 1,892.5 77.9%
Source: OBR, ONS
Note: figures exclude public sector banks
Structural deficit Public sector net debtPublic sector net borrowing

BRIEFING PAPER Number CBP-8422 23 October 2018
About the Library The House of Commons Library research service provides MPs and their staff with the impartial briefing and evidence base they need to do their work in scrutinising Government, proposing legislation, and supporting constituents.
As well as providing MPs with a confidential service we publish open briefing papers, which are available on the Parliament website.
Every effort is made to ensure that the information contained in these publicly available research briefings is correct at the time of publication. Readers should be aware however that briefings are not necessarily updated or otherwise amended to reflect subsequent changes.
If you have any comments on our briefings please email [email protected]. Authors are available to discuss the content of this briefing only with Members and their staff.
If you have any general questions about the work of the House of Commons you can email [email protected].
Disclaimer This information is provided to Members of Parliament in support of their parliamentary duties. It is a general briefing only and should not be relied on as a substitute for specific advice. The House of Commons or the author(s) shall not be liable for any errors or omissions, or for any loss or damage of any kind arising from its use, and may remove, vary or amend any information at any time without prior notice.
The House of Commons accepts no responsibility for any references or links to, or the content of, information maintained by third parties. This information is provided subject to the conditions of the Open Parliament Licence.