Embed Size (px)
Citation preview
of January 8, 2019.This information is current as
Mobilization in T LymphocytesReticulum Homeostasis and Calcium Autophagy Regulates Endoplasmic
Wei Jia, Heather H. Pua, Qi-Jing Li and You-Wen He
http://www.jimmunol.org/content/186/3/1564doi: 10.4049/jimmunol.1001822December 2010;
2011; 186:1564-1574; Prepublished online 29J Immunol
MaterialSupplementary
2.DC1http://www.jimmunol.org/content/suppl/2010/12/29/jimmunol.100182
Referenceshttp://www.jimmunol.org/content/186/3/1564.full#ref-list-1
, 16 of which you can access for free at: cites 45 articlesThis article
average*
4 weeks from acceptance to publicationFast Publication! •
Every submission reviewed by practicing scientistsNo Triage! •
from submission to initial decisionRapid Reviews! 30 days* •
Submit online. ?The JIWhy
Subscriptionhttp://jimmunol.org/subscription
is online at: The Journal of ImmunologyInformation about subscribing to
Permissionshttp://www.aai.org/About/Publications/JI/copyright.htmlSubmit copyright permission requests at:
Email Alertshttp://jimmunol.org/alertsReceive free email-alerts when new articles cite this article. Sign up at:
Print ISSN: 0022-1767 Online ISSN: 1550-6606. Immunologists, Inc. All rights reserved.Copyright © 2011 by The American Association of1451 Rockville Pike, Suite 650, Rockville, MD 20852The American Association of Immunologists, Inc.,
is published twice each month byThe Journal of Immunology
by guest on January 8, 2019http://w
ww
.jimm
unol.org/D
ownloaded from
by guest on January 8, 2019
http://ww
w.jim
munol.org/
Dow
nloaded from

The Journal of Immunology
Autophagy Regulates Endoplasmic Reticulum Homeostasisand Calcium Mobilization in T Lymphocytes
Wei Jia, Heather H. Pua, Qi-Jing Li, and You-Wen He
Macroautophagy (hereafter referred to as autophagy) is an evolutionarily conserved intracellular bulk degradation pathway that
plays critical roles in eliminating intracellular pathogens, presenting endogenous Ags, and regulating T lymphocyte survival and
proliferation. In this study, we have investigated the role of autophagy in regulating the endoplasmic reticulum (ER) compartment in
T lymphocytes. We found that ER content is expanded in mature autophagy-related protein (Atg) 7-deficient T lymphocytes. Atg7-
deficient T cells stimulated through the TCR display impaired influx, but not efflux, of calcium, and ER calcium stores are increased
in Atg7-deficient T cells. Treatment with the ER sarco/ER Ca2+-ATPase pump inhibitor thapsigargin rescues the calcium influx
defect in Atg7-deficient T lymphocytes, suggesting that this impairment is caused by an intrinsic defect in ER. Furthermore, we
found that the stimulation-induced redistribution of stromal interaction molecule-1, a critical event for the store-operated Ca2+
release-activated Ca2+ channel opening, is impaired in Atg7-deficient T cells. Together, these findings indicate that the expanded
ER compartment in Atg7-deficient T cells contains increased calcium stores, and the inability of these stores to be depleted causes
defective calcium influx in these cells. Our results demonstrate that autophagy plays an important role in maintaining ER and
calcium homeostasis in T lymphocytes. The Journal of Immunology, 2011, 186: 1564–1574.
Autophagy is an evolutionarily conserved intracellularpathway for degradation of long-lived proteins, recyclingof cytoplasmic components, and removal of damaged
organelles (1–5). There are three types of autophagy, as follows:microautophagy, chaperone-mediated autophagy, and macroauto-phagy (6). The process of macroautophagy (hereafter referred to asautophagy) is initiated with the formation of a structure called theisolation membrane. This membrane is elongated to engulf cyto-solic materials, forming a characteristic double-membrane structuretermed the autophagosome. Autophagosomes next fuse with lyso-somes to become autolysosomes, after which the engulfed materialsare degraded. The molecular pathways regulating autophagy arehighly conserved from yeast to higher eukaryotic cells (1). Beclin-1(autophagy-related protein [Atg] 6) (7) forms a complex with theclass III PI3K molecule Vps34 (8) to initiate and promote auto-phagy. Atg proteins direct autophagosome formation through twoubiquitin-like pathways (1, 3, 5). The first of these pathways isthe Atg12 conjugation pathway. During autophagosome formation,Atg12 is activated by the ubiquitin-E1–like molecule Atg7. Acti-vated Atg12 is then transferred to the E2-like molecule Atg10 and
conjugated to Atg5, after which the Atg5–Atg12 conjugate forms alarge complex with Atg16. The second pathway is mediatedthrough the LC3 (Atg8) conjugation system. LC3 is processed bythe protease Atg4 to become LC3-I. LC3-I is activated by Atg7 andtransferred to the E2-like molecule Atg3. Finally, LC-3 is conju-gated to phosphatidylethanolamine (PE) to become LC-3-II. PE isremoved from LC-3-II by Atg4, allowing recycling of LC-3 duringautophagosome formation (3).Recent works have demonstrated that autophagy serves diverse
physiological and pathological functions (3, 9, 10). Autophagyplays a role in elimination of intracellular pathogen infections (3),recognition of ssRNA and IFN-a production in plasmacytoiddendritic cells (11), and presentation of exogenous or endogenousAg onMHC-II molecules (12, 13). In addition, autophagy regulatesintracellular organelle homeostasis by sequesteringmembrane com-partments and organelles in eukaryotic cells. For example, auto-phagy regulates peroxisome turnover in yeast through a processtermed pexophagy (14). Selective removal of mitochondria byautophagy, also termed mitophagy, may be a mechanism thatallows cells to cope with oxidative stress (15). Similarly, the un-folded protein response triggers autophagy to remove damaged orredundant endoplasmic reticulum (ER) (16–18); however, the exactroles of autophagy in regulating ER homeostasis in T lymphocyteshave not yet been defined.In T lymphocytes, ER is involved in the calcium signaling
pathway, and ER calcium store depletion initiates calcium influx.Upon TCR engagement, ZAP-70 and linker for activation of T cellsare sequentially recruited to the TCR/CD3 complex. PhospholipaseCg (PLCg) is phosphorylated and cleaves 4,5-bis-phosphate toproduce diacylglycerol and inositol 1,4,5-trisphosphate (IP3). IP3then binds to its receptor (IP3R), which is expressed on ER. Ligand-bound IP3R opens ER Ca2+ channels, resulting in release of storedCa2+ into the cytosol. After ER Ca2+ store depletion, stromal in-teraction molecule-1 (STIM-1), a Ca2+ sensor expressed on the ER(19–21), is redistributed and accumulates near ER-plasma mem-brane junctions. Redistributed STIM-1 binds to plasma membraneOrai1, which is a pore subunit of the store-operated Ca2+ release-activated Ca2+ channel (CRAC) (22, 23). This results in opening of
Department of Immunology, Duke University Medical Center, Durham, NC 27710
Received for publication June 1, 2010. Accepted for publication November 22, 2010.
This work was supported by National Institutes of Health Grants AI074944 andAI074754 (to Y.-W.H.).
Address correspondence and reprint requests to Dr. You-Wen He, Box 3010, De-partment of Immunology, Duke University Medical Center, Durham, NC 27710.E-mail address: [email protected]
The online version of this article contains supplemental material.
Abbreviations used in this article: 7-AAD, 7-aminoactinomycin D; Atg, autophagy-related protein; [Ca2+]i, cytosolic calcium concentration; CRAC, store-operated Ca2+
release-activated Ca2+; DN, double negative; DP, double positive; DPX, p-xylene-bis-pyridinium bromide; EM, electron microscope; ER, endoplasmic reticulum; f/f, flox/flox; Grp, glucose-regulated protein; IP3, inositol 1,4,5-trisphosphate; IP3R, IP3 re-ceptor; LN, lymph node; MFI, mean fluorescence intensity; PDI, protein disulfideisomerase; PE, phosphatidylethanolamine; PLCg, phospholipase Cg; ROS, reactiveoxygen species; RT, room temperature; SERCA, ER sarco/ER Ca2+-ATPase; SP,single positive; STIM-1, stromal interaction molecule-1; YFP, yellow fluorescentprotein.
Copyright� 2011 by TheAmericanAssociation of Immunologists, Inc. 0022-1767/11/$16.00
www.jimmunol.org/cgi/doi/10.4049/jimmunol.1001822
by guest on January 8, 2019http://w
ww
.jimm
unol.org/D
ownloaded from

the CRAC channel and Ca2+ flux across the plasmamembrane fromthe extracellular environment to the intracellular space (24).Our previous studies have demonstrated that autophagosome
forms in mouse primary T lymphocytes and TCR stimulationpromotes autophagy processing (25). The total cell numbers ofthymocytes and peripheral CD4+ and CD8+ are decreased in Atg5-deficient fetal liver chimeric mice and Atg7 flox/flox (f/f) Lck-Cremice (25, 26). The cell death is significantly increased in Atg5- orAtg7-deficient naive T cells (25, 26). Atg5-deficient T cells cannotefficiently proliferate upon TCR stimulation (25). Our results sug-gest that autophagy regulates T cell homeostasis by promotingT lymphocyte survival and proliferation (25, 27). We and othershave recently found that mitochondrial content is developmentallyregulated in T cells, but not in B cells, and autophagy decreasesthe high mitochondrial content in thymocytes to low mitochon-drial content in mature T cells (26, 28, 29). Autophagy-deficientmature T cells fail to reduce their mitochondrial content in vivo,suggesting that autophagy is essential for mitochondrial clearancein mature T lymphocytes. Given that autophagy is implicated inregulating ER homeostasis under stress conditions in yeast, wewondered whether autophagy also regulates ER homeostasis inT lymphocytes. In this study, we show that autophagy-deficientmature T lymphocytes have increased ER content. Furthermore,stimulation-induced calcium influx and efflux are deregulated inautophagy-deficient T cells. Our results suggest that autophagyregulates calcium mobilization in T lymphocytes through con-trolling ER homeostasis.
Materials and Methods
Mice
Atg7f/f mice were described previously (30). Lck-Cre mice were obtainedfrom The Jackson Laboratory (31). Atg7f/f mice were crossed with Lck-Cre mice to specifically delete Atg7 in T lymphocytes and characterized asreported (26). All mice were housed in a specific pathogen-free facility atDuke University and used at 4–8 wk of age. All animals were used ac-cording to protocols approved by the Duke University Institutional AnimalCare and Use Committee.
ER homeostasis analysis
Splenocytes from Atg7f/f and Atg7f/fLck-Cre mice were incubated withER-Tracker Blue-White p-xylene-bis-pyridinium bromid (DPX) (referredto as ER-Tracker; Invitrogen, Carlsbad, CA) at a final concentration of 1mM in RPMI 1640 medium at 37˚C for 30 min. Cells were washed onceand stained with anti-CD44 FITC and either anti-CD4 PE or anti-CD8 PEAbs in 2.4G2 supernatant (FcR blocker) for 15 min. Thymocytes werestained with anti-CD4 FITC and anti-CD8 PE Abs. Cells were washed andanalyzed by flow cytometry. Expression of calnexin in purified total T cellswas analyzed by Western blot with an Ab against calnexin (Stressgen, AnnArbor, MI). For ER-Tracker images, ER-Tracker–stained cells werewashed and stained on ice with anti-CD4 biotin, followed by streptavidin-Alexa 594 (Invitrogen). Images were obtained with Zeiss ApoTome system(Carl Zeiss, Thornwood, NY) using AxioVision software (Carl Zeiss) witha 363 oil objective. All Abs for flow cytometry were from eBioscience orBiolegend (San Diego, CA).
Sample preparation for electron microscopy and cytosolmembrane structure quantification
Mature lymph node (LN) T cells were enriched using an EasySep-negativemouse T cells selection kit (StemCell Technologies, Vancouver, Canada),stained with anti-TCR FITC and anti-CD4 PE (or with anti-CD8 PE), andfixed in 1% paraformaldehyde for cell sorting. One to two million TCRb+
CD4+ or TCRb+ CD8+ T cells were sorted and fixed in a 4%glutaraldehyde/0.1 M sodium cacodylate buffer overnight. The sampleswere rinsed three times for 15 min in 0.1 M cacodylate buffer containing7.5% sucrose and fixed in 1% osmium in cacodylate buffer for 1 h.Samples were washed three times for 15 min in 0.11 M veronal acetatebuffer and incubated with 0.5% uranyl acetate in veronal acetate buffer for1 h at room temperature (RT). Specimens were then dehydrated in in-creasing concentrations of ethanol (one 10-min incubation each in 35, 70,
and 95% ethanol, followed by two 10-min incubations in 100% ethanol)and incubated twice in propylene oxide (5 min per incubation). Sampleswere next incubated in a 1:1 mixture of 100% resin and propylene oxidefor 1 h and incubated twice in 100% resin (30 min per incubation). Finally,samples were embedded in resin and polymerized at 60˚C overnight. Thicksections (0.5 mm) were cut and stained with toluidine blue and visualizedusing light microscopy to select appropriate areas to use for ultrathinsections. Thin sections (60–90 nm) were then cut, mounted on coppergrids, and poststained with uranyl acetate and lead citrate. Micrographswere taken with a Philips LS 410 electron microscope. Images were an-alyzed using AxioVision software (Carl Zeiss). Each cell in electron mi-croscope (EM) images was divided into 12 equal sections based on the faceof a clock. Membrane scores were defined and counted as the number ofsections per cell containing membrane structure(s).
Analysis of T lymphocyte calcium response
LN cells from Atg7f/f or Atg7f/fLck-Cre mice were incubated with 5 mMIndo-1 (Invitrogen) for 30 min in HBSS buffer (Invitrogen). Cells werestained with 7-aminoactinomycin D (7-AAD), anti-CD44 FITC, and eitheranti-CD4 PE or anti-CD8 PE Abs for 15 min on ice. Cells were thenwashed and resuspended in HBSS buffer containing 1.26 mM CaCl2. Toanalyze calcium influx, 1 3 106 cells were incubated with biotin-labeledanti-CD3 (5 mg/ml) and either biotin-labeled anti-CD4 (1 mg/ml) or biotin-labeled anti-CD8 Abs (1 mg/ml; all above Abs are from eBioscience) for 1min. Baseline levels of fluorescence were detected by flow cytometry, and25 mg/ml streptavidin (Sigma-Aldrich, St. Louis, MO) was then added tocross-link CD3 and either CD4 or CD8 Abs. After cross-linking, the cy-tosolic calcium concentration ([Ca2+]i) was measured by flow cytometry(FACStar; BD Biosciences, San Jose, CA) for 5–7 min. To measure ERCa2+ stores, LN cells were loaded with Indo-1 and resuspended in Ca2+-free HBSS containing 1 mM EGTA. Cells were stimulated with anti-CD3Ab, thapsigargin, or ionomycin (Sigma-Aldrich) in Ca2+-free HBSS buffer.Relative [Ca2+]i was determined by the ratio of emission at 405 nm to thatat 510 nm. Emissions were detected by flow cytometry and plotted usingFlowJo software (Tree Star, Ashland, OR). All analyzed cells were gatedon 7-AAD–negative cells to exclude the dead cells.
Live cell calcium imaging
Atg7f/f or Atg7f/fLck-Cre CD4+ T cells (5 3 106) were incubated with 5mM fura 2 (Invitrogen) and rotated in RPMI 1640 medium containing 10%FCS at RT for 20 min. Fura 2–loaded cells were washed with minimumimage buffer (HBSS containing 2% FCS, 2 mM Ca2+, and 2 mM Mg2+)and resuspended in 1 ml minimum image buffer buffer. Time-lapse imagesof the intracellular calcium response in cells stimulated with 13 nM ion-omycin were obtained using a Zeiss Axio Observer D1-based imagingstation equipped with a CoolSNAP HQ CCD camera (Roper Scientific,Tucson, AZ) and recorded with MetaMorph 7.6 software (Universal Im-aging, West Chester, PA). The filters used in this experiment were 340/26nm and 387/11 nm for excitation and 510/84 nm for emission. Images wererecorded every 10 s for 1 min before and 10 min after stimulation.
Every cell was tracked and analyzed manually frame by frame usingMetaMorph 7.6 software. To determine the total intracellular calcium con-centration, we calculated the integrated calcium flux within the first 5min of stimulation. For each cell, the ratio of fluorescence intensity uponexcitation at 340 nm to that upon excitation at 380 nm was calculated every10 s over a period of 5 min, and the average fluorescence intensity ratio fromthree to four frames of the live image obtained before stimulation was usedas the baseline (background) calcium concentration. The integrated Ca2+
flux within the first 5 min of stimulation was calculated using the followingformula:
integrated Ca2þ flux ¼ +n¼30
n¼0
ð½Rn=R0�2 1Þ;
where + is the summation; R is the ratio of fluorescence intensity uponexcitation at 340 nm to that upon excitation at 380 nm; n is the imageframe number; R0 is the background fluorescence intensity ratio; and Rn isthe fluorescence intensity ratio in frame n.
Western blot
CD44low naive T cells were enriched using an EasySep Mouse T CellEnrichment negative selection kit (StemCell Technologies) according to itsmanual. Biotin anti-CD44 Ab was additionally added to exclude theCD44high cells. The purity of isolated T cells was .90% CD3+CD44low.Equal numbers of T cells were incubated with biotin-labeled anti-CD3 (5
The Journal of Immunology 1565
by guest on January 8, 2019http://w
ww
.jimm
unol.org/D
ownloaded from

mg/ml), biotin-labeled anti-CD4 (1 mg/ml), and biotin-labeled anti-CD8Abs (1 mg/ml) for 1 min and cross-linked with streptavidin (25 mg/ml) for1, 1.5, 3, 5, or 10 min, respectively. Reactions were stopped on ice, andcells were lysed with cell lysis buffer (25 mM Tris-HCl [pH 7.4], 150 mMNaCl, 5 mM EDTA, 1 mM PMSF, 1 mM sodium vanadate, 2 mM sodiumpyrophosphate, 10 mM b-glycerol phosphate, 10 mg/ml leupeptin, 10 mg/ml aprotinin, and 1% Triton X-100). Cell lysates were separated by SDS-PAGE and transferred to polyvinylidene difluoride membrane. Membraneswere probed with primary Ab in PBS containing 3% BSA and 0.5% Tween20 at 4˚C overnight. Membranes were then incubated with Alexa Fluor 680(Invitrogen)- or IRDye 800 (Rockland Immunochemicals, Gilbertsville,PA)-labeled secondary Abs at RT for 1 h. After washing, blots were vi-sualized using an Odyssey Infrared Imaging System and analyzed usingOdyssey software (LI-COR Bioscience, Lincoln, NE). Numbers belowblots represent the ratio of intensity of each target molecule to intensity ofloading control. Sarco/ER Ca2+-ATPase (SERCA) 2 Ab is from Abcam(Cambridge, U.K.). Anti-pERK, anti-pp38, and anti-pPLCg1 Abs are fromCell Signaling Technology (Santa Cruz, CA). Anti-glucose–regulated pro-tein (Grp) 78, anti-Grp94, and anti-protein disulfide isomerase (PDI) Absare from Assay Designs (Ann Arbor, MI). Anti-Orai1 Ab is from Abcam(Cambridge, MA). Anti-actin Ab is from Santa Cruz Biotechnology (SantaCruz, CA).
Retrovirus propagation and primary T cell transduction
Bosc cells were cotransfected with a target retroviral construct (pIB2-ER-probe-yellow fluorescent protein [YFP]) and the packaging vector pCL-Ecoat a 4:1 ratio using LF2000 (Invitrogen) following the manufacturer’sinstructions. Supernatants were harvested 48 h after transfection. Wild-type and Atg7f/fLck-Cre splenocytes were stimulated with anti-CD3(2C11; 5 mg/ml) and anti-CD28 (2 mg/ml; Biolegend, San Diego, CA).A total of 100 U/ml IL-2 was added 1 day after stimulation. Six hours afterIL-2 treatment, stimulated splenocytes were transduced with retroviralsupernatants by spin infection at 2500 rpm for 1.5 h with 1 mg/ml poly-brene (Sigma-Aldrich). Live cell imaging was performed using a ZeissAxio Observer D1-based imaging station equipped with a CoolSNAP HQCCD camera (Roper Scientific) 48 h after retroviral transduction. Imageswere recorded and analyzed with MetaMorph 7.6 software (UniversalImaging).
Analysis of STIM-1 distribution
Glass coverslips were treated with biotin poly-lysine at RT for 1 h, washed,and incubated with 10 mg/ml streptavidin for 1 h. Coverslips were washedagain and incubated with biotin-labeled anti-CD3 (2C11, 5 mg/ml) at RTfor 30 min in HBSS containing 1.26 mM CaCl2 (Invitrogen). For unsti-mulated T cells, the coverslips were coated with anti–H-2kb Ab. PurifiedT cells were stained with anti-CD4 Pacific Blue or anti-CD8 Pacific BlueAb, washed, and added to treated coverslips in 12-well plates. Cells wereincubated on Ab-coated coverslips for 20 min and then fixed with 2%paraformaldehyde for 10 min at RT. For thapsigargin stimulation, LN cellswere stimulated with 100 nM thapsigargin in HBSS containing 1.26 mMCaCl2 for 20 min at 37˚C and then stopped and fixed with 2% para-formaldehyde. Fixed cells were washed and treated with PBS containing0.5% saponin and 0.5% BSA for 10 min at RT. Cells were then incubatedwith anti–STIM-1 Ab (2 mg/ml; Sigma-Aldrich) for 30 min at RT, washed,and incubated with a Cy3-labeled anti-rabbit Ab (Jackson ImmunoR-esearch Laboratories, West Grove, PA) for another 30 min at RT andprotected from light. STIM-1 punctae were detected using 3100 oil ob-jective in a Zeiss Axio Observer D1-based imaging station equipped witha CoolSNAP HQ CCD camera and recorded and analyzed with Meta-Morph 7.6 software. Z-stacks were spaced at 1 mm apart. The 3D de-convolution was processed using AutoQuant X software (Media Cyber-netics, Bethesda, MD). The area and fluorescence intensity of STIM-1punctae were quantitated by using MetaMorph 7.6 software.
IL-2 measurement
CD4+CD44low T cells from Atg7f/f or Atg7f/fLck-Cre mice were enrichedby EasySep Mouse CD4 T Cell Enrichment negative selection kit andstimulated with coated anti-CD3 (5mg/ml) or anti-CD3 plus anti CD28 (2mg/ml) Abs overnight. IL-2 in the cell culture supernatants was measuredby ELISA. The anti–IL-2 capture and detection Abs were from Biolegend.
Statistical analysis
The unpaired and two-tailed Student t test were used to analyze alldata, except Figs. 2B, 4A, and 6G, which were paired and two-tailedStudent t test.
Results
ER is expanded in Atg7-deficient T cells
Recent studies have demonstrated that autophagy plays an essentialrole in maintaining intracellular organelle homeostasis in yeast(14–16, 18). We previously found that mitochondrial content isdevelopmentally regulated in T lymphocytes, and autophagy isrequired for mitochondrial clearance in mature T lymphocytes(26). Given these findings, we examined another important in-tracellular compartment, ER, in wild-type and autophagy-deficientdeveloping T lymphocytes with two goals in mind. First, wewantedto determine whether ER content in T lymphocytes is develop-mentally regulated. Second, we wanted to examine whether auto-phagy regulates ER homeostasis in primary T lymphocytes.To examine the ER compartment in T cells, we first stained
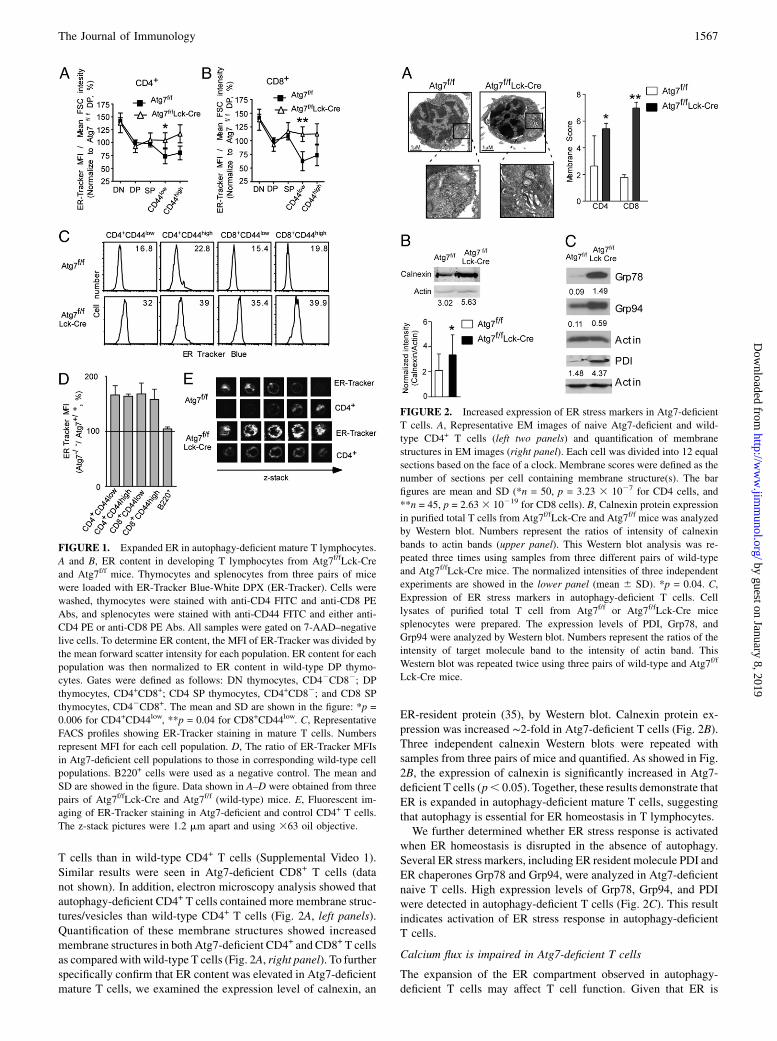
thymocytes and splenic T cells from wild-type and autophagy-deficient Atg7f/fLck-Cre mice with ER-Tracker Blue-White DPX(ER-Tracker) and analyzed the cells by flow cytometry. ER-Tracker, a cell-permeable dye that is not toxic to live cells atlow concentrations, is highly selective for ER and used to visu-alize ER in previous studies (32, 33). To account for the changingsize of developing T cells, the mean fluorescence intensity (MFI)of ER-Tracker was divided by the mean forward scatter intensityfor each cell population. These values were then normalized to theER-Tracker MFI/mean forward scatter intensity value calculatedfor CD4+CD8+ double-positive (DP) thymocytes, which was setto 100%. In wild-type mice, double-negative (DN) thymocytescontain 1.5-fold more ER than DP thymocytes, whereas CD4+
single-positive (SP) thymocytes have similar ER content to thatobserved in DP thymocytes (Fig. 1A). Naive wild-type CD4+
T cells exhibit a slight decrease in their ER content; these cellscontain ∼73% as much ER as DP thymocytes. In contrast, naivewild-type CD8+ T cells exhibit a larger decrease in their ER con-tent, containing∼62% as much ER as DP thymocytes (Fig. 1B). Wenext examined ER content in Atg7-deficient T lymphocytes. DN,DP, and SP thymocytes from Atg7f/fLck-Cre mice all containedlevels of ER comparable to those observed in their wild-typecounterparts (Fig. 1A, 1B); however, ER content in both CD44low
and CD44high peripheral T lymphocytes from Atg7f/fLck-Cre micewas 160–170% of the level observed in wild-type T cells (Fig. 1C,1D) (p , 0.05). These results demonstrate that ER content inT lymphocytes is developmentally regulated, suggesting that auto-phagy regulates ER turnover in mature T lymphocytes.To visualize the spatial distribution of ER in wild-type and
autophagy-deficient T cells, purified CD4+ T cells were stainedwith ER-Tracker dye and surface stained with CD4-biotin andstreptavidin-Alexa 594. Individual cells were examined by fluo-rescent microscopy. In both wild-type and Atg7-deficient T cells,ER-Tracker dye stained a discrete, reticular subcellullar structurewithin the cytoplasmic space. Imaging of wild-type CD4+ T cellsshowed that ER-Tracker staining was largely localized to one poleof each cell. In contrast, imaging of CD4+ T cells from Atg7f/fLck-Cre mice demonstrated abundant staining distributed throughoutthe entire cell (Fig. 1E). This increase in ER-Tracker staining isconsistent with the increase in ER content observed by flowcytometry. To more specifically visualize the morphology of ER inAtg7-deficient T cells, wild-type or Atg7f/fLck-Cre T cells wereinfected with a retrovirus containing an ER probe (ER-probe-YFP). This probe is composed of an N terminus derived fromcalnexin protein, including its transmembrane domain, followedby YFP and a C-terminal ER retrieval sequence (KKSL), whichconfines the probe to ER by blocking its transportation from ER toGolgi (34). Consistent with the above results, more ER-probe-YFP–labeled structures were observed in Atg7-deficient CD4+
1566 AUTOPHAGY REGULATION OF ER AND CALCIUM IN T LYMPHOCYTES
by guest on January 8, 2019http://w
ww
.jimm
unol.org/D
ownloaded from
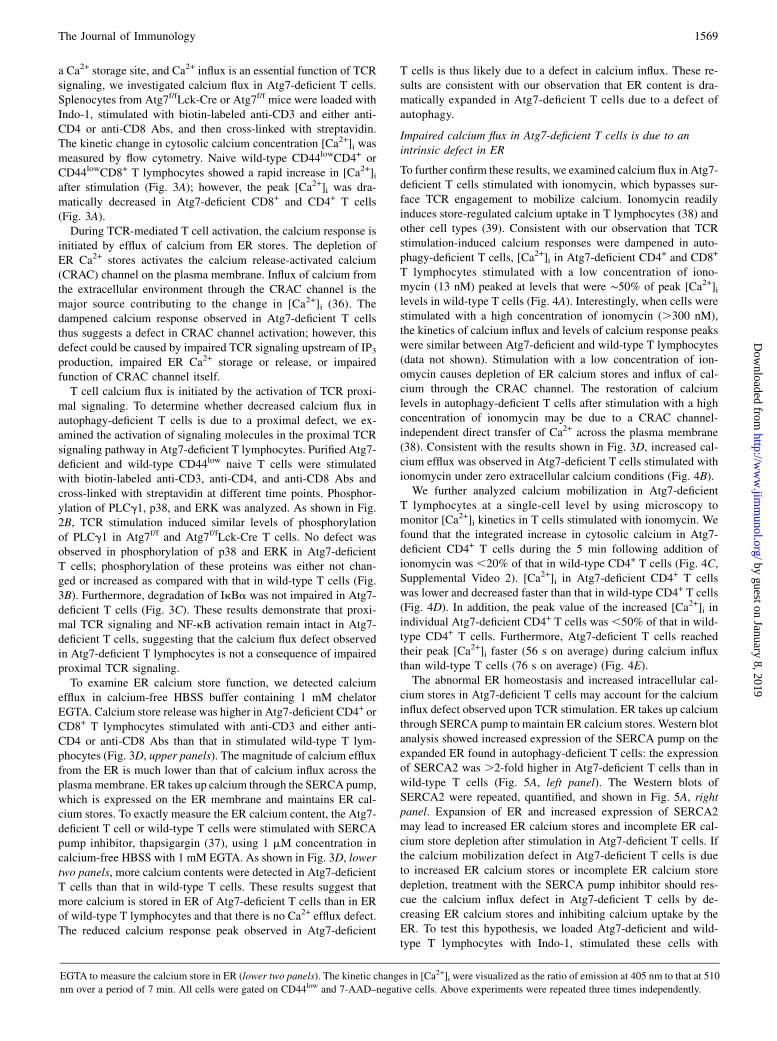
T cells than in wild-type CD4+ T cells (Supplemental Video 1).Similar results were seen in Atg7-deficient CD8+ T cells (datanot shown). In addition, electron microscopy analysis showed thatautophagy-deficient CD4+ T cells contained more membrane struc-tures/vesicles than wild-type CD4+ T cells (Fig. 2A, left panels).Quantification of these membrane structures showed increasedmembrane structures in both Atg7-deficient CD4+ and CD8+ T cellsas compared with wild-type T cells (Fig. 2A, right panel). To furtherspecifically confirm that ER content was elevated in Atg7-deficientmature T cells, we examined the expression level of calnexin, an
ER-resident protein (35), by Western blot. Calnexin protein ex-pression was increased ∼2-fold in Atg7-deficient T cells (Fig. 2B).Three independent calnexin Western blots were repeated withsamples from three pairs of mice and quantified. As showed in Fig.2B, the expression of calnexin is significantly increased in Atg7-deficient T cells (p, 0.05). Together, these results demonstrate thatER is expanded in autophagy-deficient mature T cells, suggestingthat autophagy is essential for ER homeostasis in T lymphocytes.We further determined whether ER stress response is activated
when ER homeostasis is disrupted in the absence of autophagy.Several ER stress markers, including ER resident molecule PDI andER chaperones Grp78 and Grp94, were analyzed in Atg7-deficientnaive T cells. High expression levels of Grp78, Grp94, and PDIwere detected in autophagy-deficient T cells (Fig. 2C). This resultindicates activation of ER stress response in autophagy-deficientT cells.
Calcium flux is impaired in Atg7-deficient T cells
The expansion of the ER compartment observed in autophagy-deficient T cells may affect T cell function. Given that ER is
FIGURE 2. Increased expression of ER stress markers in Atg7-deficient
T cells. A, Representative EM images of naive Atg7-deficient and wild-
type CD4+ T cells (left two panels) and quantification of membrane
structures in EM images (right panel). Each cell was divided into 12 equal
sections based on the face of a clock. Membrane scores were defined as the
number of sections per cell containing membrane structure(s). The bar
figures are mean and SD (*n = 50, p = 3.23 3 1027 for CD4 cells, and
**n = 45, p = 2.63 3 10219 for CD8 cells). B, Calnexin protein expression
in purified total T cells from Atg7f/fLck-Cre and Atg7f/f mice was analyzed
by Western blot. Numbers represent the ratios of intensity of calnexin
bands to actin bands (upper panel). This Western blot analysis was re-
peated three times using samples from three different pairs of wild-type
and Atg7f/fLck-Cre mice. The normalized intensities of three independent
experiments are showed in the lower panel (mean 6 SD). *p = 0.04. C,
Expression of ER stress markers in autophagy-deficient T cells. Cell
lysates of purified total T cell from Atg7f/f or Atg7f/fLck-Cre mice
splenocytes were prepared. The expression levels of PDI, Grp78, and
Grp94 were analyzed by Western blot. Numbers represent the ratios of the
intensity of target molecule band to the intensity of actin band. This
Western blot was repeated twice using three pairs of wild-type and Atg7f/f
Lck-Cre mice.
FIGURE 1. Expanded ER in autophagy-deficient mature T lymphocytes.
A and B, ER content in developing T lymphocytes from Atg7f/fLck-Cre
and Atg7f/f mice. Thymocytes and splenocytes from three pairs of mice
were loaded with ER-Tracker Blue-White DPX (ER-Tracker). Cells were
washed, thymocytes were stained with anti-CD4 FITC and anti-CD8 PE
Abs, and splenocytes were stained with anti-CD44 FITC and either anti-
CD4 PE or anti-CD8 PE Abs. All samples were gated on 7-AAD–negative
live cells. To determine ER content, the MFI of ER-Tracker was divided by
the mean forward scatter intensity for each population. ER content for each
population was then normalized to ER content in wild-type DP thymo-
cytes. Gates were defined as follows: DN thymocytes, CD42CD82; DP
thymocytes, CD4+CD8+; CD4 SP thymocytes, CD4+CD82; and CD8 SP
thymocytes, CD42CD8+. The mean and SD are shown in the figure: *p =
0.006 for CD4+CD44low, **p = 0.04 for CD8+CD44low. C, Representative
FACS profiles showing ER-Tracker staining in mature T cells. Numbers
represent MFI for each cell population. D, The ratio of ER-Tracker MFIs
in Atg7-deficient cell populations to those in corresponding wild-type cell
populations. B220+ cells were used as a negative control. The mean and
SD are showed in the figure. Data shown in A–D were obtained from three
pairs of Atg7f/fLck-Cre and Atg7f/f (wild-type) mice. E, Fluorescent im-
aging of ER-Tracker staining in Atg7-deficient and control CD4+ T cells.
The z-stack pictures were 1.2 mm apart and using 363 oil objective.
The Journal of Immunology 1567
by guest on January 8, 2019http://w
ww
.jimm
unol.org/D
ownloaded from

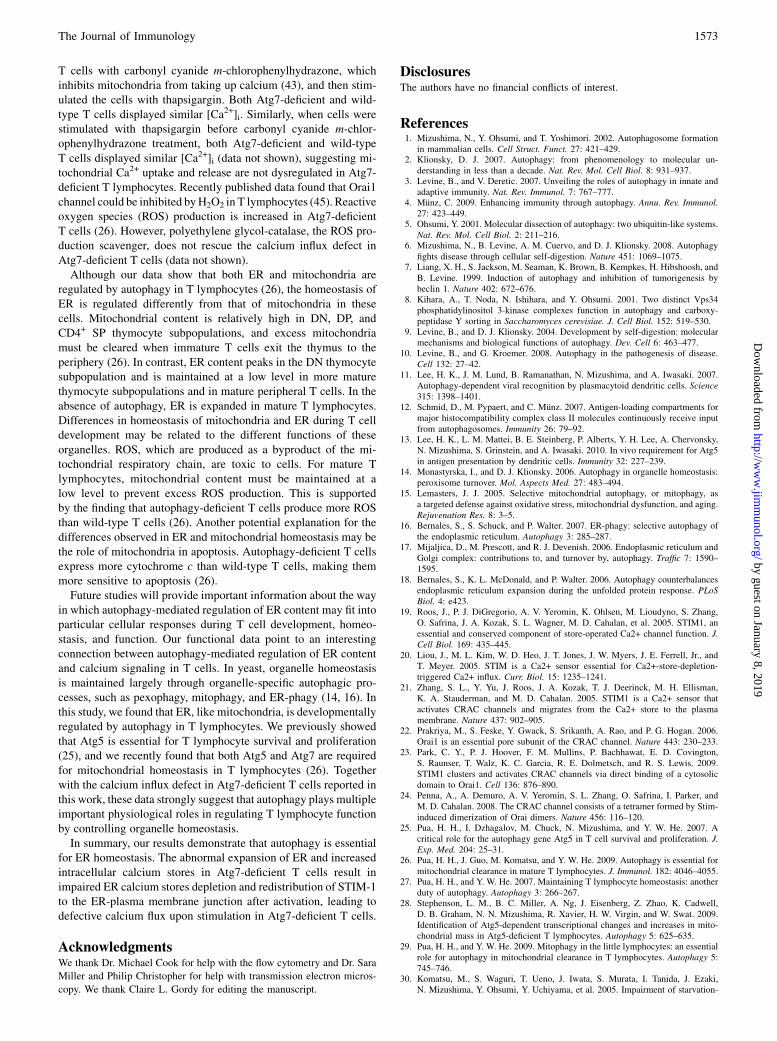
FIGURE 3. Impaired calcium flux in Atg7-deficient T cells. A, Calcium influx in autophagy-deficient T cells upon TCR engagement. LN cells from Atg7f/f
or Atg7f/fLck-Cre mice were loaded with Indo-1 and then stained with7-AAD, anti-CD44 FITC, and either anti-CD4 PE or anti-CD8 PE Abs. Cells were
resuspended in HBSS buffer containing 1.26 mMCaCl2. The Indo-1–loaded cells were stimulated with biotin anti-CD3 (5 mg/ml) and biotin anti-CD4 (1 mg/
ml) Abs for analysis of CD4+ T cells (or biotin anti-CD8 Ab for CD8+ T cells) for 1 min. After establishing a baseline, the cells were cross-linked with 25 mg/
ml streptavidin and the stimulation was indicated by the arrow in the figure (same in other calcium flux figures). Intracellular Ca2+ kinetics were expressed as
the ratio of emission at 405 nm to that at 510 nm. Graphs represent calcium influx in live naive 7-AAD2CD44lowCD4+ or 7-AAD2CD44lowCD8+ cells. This
experiment was repeated three times independently. B, Phosphorylation of p38, ERK, and PLCg1 in autophagy-deficient T cells upon TCR stimulation.
Purified naive CD44low T lymphocytes were stimulated with biotin-labeled anti-CD3 (5 mg/ml), biotin-labeled anti-CD4 (1 mg/ml), and biotin-labeled anti-
CD8 (1 mg/ml) for 1 min and cross-linked with streptavidin (25 mg/ml) for 1, 1.5, 3, 5, or 10 min. Phosphorylated proteins were detected with anti-
phosphorylated p38, ERK, or PLCg1 and visualized using Alexa Fluor 680- or IRDye 800-conjugated anti-species Abs. Numbers represent the ratios of
intensity of the target molecule bands to intensity of actin bands. These Western blot analyses were repeated five times using purified T cells from different
pairs of wild-type and Atg7f/fLck-Cre mice. C, IkBa degradation in autophagy-deficient T cells after CD3/CD28 stimulation. T cells were stimulated with
anti-CD3 (5 mg/ml) and anti-CD28 (2 mg/ml) Abs overnight, and whole-cell lysates were subjected to Western blot analysis. Numbers represent the ratios of
intensity of the IkBa bands to intensity of actin bands.D, Increased calcium store in Atg7-deficient T cells. LN cells fromAtg7f/f or Atg7f/fLck-Cre mice were
loaded with Indo-1 in Ca2+-free HBSS buffer. Cells were stained with anti-CD44 FITC and either anti-CD4 PE or anti-CD8 PE, and resuspended in calcium-
free HBSS containing 1 mM EGTA. A total of 1 3 106 cells was incubated in calcium-free conditions with biotin anti-CD3 and either biotin anti-CD4 or
biotin anti-CD8 Abs for 1 min. After establishing a baseline using flow cytometry, Ca2+-free streptavidin was added to cross-link anti-CD3 and anti-CD4 (or
anti-CD8) Abs (upper two panels). Above, Indo-1–loaded cells were also stimulated with 1 mM thapsigargin (TG) in calcium-free HBSS containing 1 mM
1568 AUTOPHAGY REGULATION OF ER AND CALCIUM IN T LYMPHOCYTES
by guest on January 8, 2019http://w
ww
.jimm
unol.org/D
ownloaded from
a Ca2+ storage site, and Ca2+ influx is an essential function of TCRsignaling, we investigated calcium flux in Atg7-deficient T cells.Splenocytes from Atg7f/fLck-Cre or Atg7f/f mice were loaded withIndo-1, stimulated with biotin-labeled anti-CD3 and either anti-CD4 or anti-CD8 Abs, and then cross-linked with streptavidin.The kinetic change in cytosolic calcium concentration [Ca2+]i wasmeasured by flow cytometry. Naive wild-type CD44lowCD4+ orCD44lowCD8+ T lymphocytes showed a rapid increase in [Ca2+]iafter stimulation (Fig. 3A); however, the peak [Ca2+]i was dra-matically decreased in Atg7-deficient CD8+ and CD4+ T cells(Fig. 3A).During TCR-mediated T cell activation, the calcium response is
initiated by efflux of calcium from ER stores. The depletion ofER Ca2+ stores activates the calcium release-activated calcium(CRAC) channel on the plasma membrane. Influx of calcium fromthe extracellular environment through the CRAC channel is themajor source contributing to the change in [Ca2+]i (36). Thedampened calcium response observed in Atg7-deficient T cellsthus suggests a defect in CRAC channel activation; however, thisdefect could be caused by impaired TCR signaling upstream of IP3production, impaired ER Ca2+ storage or release, or impairedfunction of CRAC channel itself.T cell calcium flux is initiated by the activation of TCR proxi-
mal signaling. To determine whether decreased calcium flux inautophagy-deficient T cells is due to a proximal defect, we ex-amined the activation of signaling molecules in the proximal TCRsignaling pathway in Atg7-deficient T lymphocytes. Purified Atg7-deficient and wild-type CD44low naive T cells were stimulatedwith biotin-labeled anti-CD3, anti-CD4, and anti-CD8 Abs andcross-linked with streptavidin at different time points. Phosphor-ylation of PLCg1, p38, and ERK was analyzed. As shown in Fig.2B, TCR stimulation induced similar levels of phosphorylationof PLCg1 in Atg7f/f and Atg7f/fLck-Cre T cells. No defect wasobserved in phosphorylation of p38 and ERK in Atg7-deficientT cells; phosphorylation of these proteins was either not chan-ged or increased as compared with that in wild-type T cells (Fig.3B). Furthermore, degradation of IkBa was not impaired in Atg7-deficient T cells (Fig. 3C). These results demonstrate that proxi-mal TCR signaling and NF-kB activation remain intact in Atg7-deficient T cells, suggesting that the calcium flux defect observedin Atg7-deficient T lymphocytes is not a consequence of impairedproximal TCR signaling.To examine ER calcium store function, we detected calcium
efflux in calcium-free HBSS buffer containing 1 mM chelatorEGTA. Calcium store release was higher in Atg7-deficient CD4+ orCD8+ T lymphocytes stimulated with anti-CD3 and either anti-CD4 or anti-CD8 Abs than that in stimulated wild-type T lym-phocytes (Fig. 3D, upper panels). The magnitude of calcium effluxfrom the ER is much lower than that of calcium influx across theplasmamembrane. ER takes up calcium through the SERCA pump,which is expressed on the ER membrane and maintains ER cal-cium stores. To exactly measure the ER calcium content, the Atg7-deficient T cell or wild-type T cells were stimulated with SERCApump inhibitor, thapsigargin (37), using 1 mM concentration incalcium-free HBSS with 1 mM EGTA. As shown in Fig. 3D, lowertwo panels, more calcium contents were detected in Atg7-deficientT cells than that in wild-type T cells. These results suggest thatmore calcium is stored in ER of Atg7-deficient T cells than in ERof wild-type T lymphocytes and that there is no Ca2+ efflux defect.The reduced calcium response peak observed in Atg7-deficient
T cells is thus likely due to a defect in calcium influx. These re-sults are consistent with our observation that ER content is dra-matically expanded in Atg7-deficient T cells due to a defect ofautophagy.
Impaired calcium flux in Atg7-deficient T cells is due to anintrinsic defect in ER
To further confirm these results, we examined calcium flux in Atg7-deficient T cells stimulated with ionomycin, which bypasses sur-face TCR engagement to mobilize calcium. Ionomycin readilyinduces store-regulated calcium uptake in T lymphocytes (38) andother cell types (39). Consistent with our observation that TCRstimulation-induced calcium responses were dampened in auto-phagy-deficient T cells, [Ca2+]i in Atg7-deficient CD4+ and CD8+
T lymphocytes stimulated with a low concentration of iono-mycin (13 nM) peaked at levels that were ∼50% of peak [Ca2+]ilevels in wild-type T cells (Fig. 4A). Interestingly, when cells werestimulated with a high concentration of ionomycin (.300 nM),the kinetics of calcium influx and levels of calcium response peakswere similar between Atg7-deficient and wild-type T lymphocytes(data not shown). Stimulation with a low concentration of ion-omycin causes depletion of ER calcium stores and influx of cal-cium through the CRAC channel. The restoration of calciumlevels in autophagy-deficient T cells after stimulation with a highconcentration of ionomycin may be due to a CRAC channel-independent direct transfer of Ca2+ across the plasma membrane(38). Consistent with the results shown in Fig. 3D, increased cal-cium efflux was observed in Atg7-deficient T cells stimulated withionomycin under zero extracellular calcium conditions (Fig. 4B).We further analyzed calcium mobilization in Atg7-deficient
T lymphocytes at a single-cell level by using microscopy tomonitor [Ca2+]i kinetics in T cells stimulated with ionomycin. Wefound that the integrated increase in cytosolic calcium in Atg7-deficient CD4+ T cells during the 5 min following addition ofionomycin was ,20% of that in wild-type CD4+ T cells (Fig. 4C,Supplemental Video 2). [Ca2+]i in Atg7-deficient CD4+ T cellswas lower and decreased faster than that in wild-type CD4+ T cells(Fig. 4D). In addition, the peak value of the increased [Ca2+]i inindividual Atg7-deficient CD4+ T cells was ,50% of that in wild-type CD4+ T cells. Furthermore, Atg7-deficient T cells reachedtheir peak [Ca2+]i faster (56 s on average) during calcium influxthan wild-type T cells (76 s on average) (Fig. 4E).The abnormal ER homeostasis and increased intracellular cal-
cium stores in Atg7-deficient T cells may account for the calciuminflux defect observed upon TCR stimulation. ER takes up calciumthrough SERCA pump to maintain ER calcium stores. Western blotanalysis showed increased expression of the SERCA pump on theexpanded ER found in autophagy-deficient T cells: the expressionof SERCA2 was .2-fold higher in Atg7-deficient T cells than inwild-type T cells (Fig. 5A, left panel). The Western blots ofSERCA2 were repeated, quantified, and shown in Fig. 5A, rightpanel. Expansion of ER and increased expression of SERCA2may lead to increased ER calcium stores and incomplete ER cal-cium store depletion after stimulation in Atg7-deficient T cells. Ifthe calcium mobilization defect in Atg7-deficient T cells is dueto increased ER calcium stores or incomplete ER calcium storedepletion, treatment with the SERCA pump inhibitor should res-cue the calcium influx defect in Atg7-deficient T cells by de-creasing ER calcium stores and inhibiting calcium uptake by theER. To test this hypothesis, we loaded Atg7-deficient and wild-type T lymphocytes with Indo-1, stimulated these cells with
EGTA to measure the calcium store in ER (lower two panels). The kinetic changes in [Ca2+]i were visualized as the ratio of emission at 405 nm to that at 510
nm over a period of 7 min. All cells were gated on CD44low and 7-AAD–negative cells. Above experiments were repeated three times independently.
The Journal of Immunology 1569
by guest on January 8, 2019http://w
ww
.jimm
unol.org/D
ownloaded from

different concentrations of thapsigargin, and examined calcium
influx. The calcium influx profiles of autophagy-deficient and wild-
type T cells were similar during the initial phase of thapsigargin
stimulation (Fig. 5B). Interestingly, calcium influx was enhanced
at later time points in Atg7-deficient T cells stimulated with a low
concentration of thapsigargin (Fig. 5B, left panel). Calcium influx
was comparable between Atg7-deficient and wild-type T cellsstimulated with higher concentrations of thapsigargin (Fig. 5B,middle and right panels). This result suggests there is no intrinsicdefect in CRAC channel function in Atg7-deficient T cells, andthe calcium flux defect in Atg7-deficient T cells is most likelydue to the abnormal expansion of ER and redistribution of calciuminto ER after stimulation.To directly analyze the calcium influx through CRAC channel in
Atg7-deficient T cells, we stimulated Indo-1–loaded Atg7-deficientand wild-type T cells with thapsigargin in Ca2+-free buffer andthen resuspended the cells in HBSS containing 1.26 mM Ca2+
after stimulation. Calcium influx was analyzed by flow cytometry.
FIGURE 4. Impaired calcium flux in Atg7-deficient T cells stimulated
with ionomycin. A, Calcium influx in autophagy-deficient T cells upon
ionomycin stimulation. LN cells from Atg7f/f or Atg7f/fLck-Cre mice were
loaded with Indo-1 and stimulated with 13 nM ionomycin. Samples were
gated on naive CD44lowCD4+7-AAD2 or CD44lowCD8+7-AAD2 cells.
Dashed lines represent Atg7f/f T cells, and solid lines represent Atg7f/fLck-
Cre T cells. This experiment was repeated four times. B, Indo-1–loaded
cells were stimulated with 60 nM ionomycin in calcium-free HBSS con-
taining 1 mM EGTA, and [Ca2+]i were analyzed over a period of 5 min.
Dashed lines represent Atg7f/f cells, and solid lines represent Atg7f/fLck-
Cre cells. This experiment was repeated three times. C, The integrated
increase in Ca2+ in Atg7f/f or Atg7f/fLck-Cre CD4+ T cells over a period of
5 min. Cells were loaded with fura 2 and stimulated with 13 nM ion-
omycin. The integrated Ca2+ increase was calculated, as described in
Materials and Methods, for 60 individual cells. The beginning of calcium
influx was defined as the time point at which the first 5% increase in
fluorescence intensity occurred. Thirty frames were collected over a period
of 5 min after the beginning of calcium influx for calculation of the ab-
solute integrated Ca2+ increase for each individual cell. p = 6.19 3 10246.
D, Kinetics of Ca2+ influx in Atg7-deficient and wild-type T cells. Sixty
cells were synchronized by defining the beginning of calcium flux as the
time point at which the first 5% of cells displayed an increased fluores-
cence intensity ratio. Images obtained during the 5-min period after ini-
tiation of calcium influx were used to analyze kinetic changes in calcium.
E, Length of time to reach the peak level of Ca2+ influx in each individual
cell. Calcium influx was calculated in 60 cells for each group. p = 6.13 31029.
FIGURE 5. SERCA pump inhibitor thapsigargin rescues the calcium
influx defect in Atg7-deficient T cells. A, The expression of SERCA2
was analyzed by Western blot (left panel). Numbers represent ratios of
the intensity of SERCA2 bands to intensity of actin bands. This Western
blot analysis was repeated six times using purified T cells from different
pairs of wild-type and Atg7-deficient mice splenocytes. Normalized
Western blot intensities were quantified and shown in the right panel
(mean 6 SD). *p = 0.006. B, Thapsigargin-induced calcium influx in
Atg7-deficient T cells. LN cells from Atg7f/f and Atg7f/fLck-Cre mice
were loaded with Indo-1, suspended in HBSS containing 1.26 mM
CaCl2, and stimulated with different concentrations of thapsigargin.
Samples were gated on naive CD44lowCD4+7-AAD2 or CD44lowCD8+7-
AAD2 cells. Dashed lines represent Atg7f/f cells, and solid lines repre-
sent Atg7f/fLck-Cre cells. This experiment was repeated three times. C,
Analyzing the calcium influx through CRAC channel in autophagy-
deficient T cells by flow cytometry. LN cells from Atg7f/fLck-Cre and
Atg7f/f mice were loaded with Indo-1, and cell surfaces were stained with
anti-CD4 PE, anti-CD44 FITC, and 7-AAD. The Indo-1–loaded cells
were resuspended in HBSS containing 1 mM EGTA and 1 mM EDTA,
but without Ca2+ and Mg2+. After establishing a base level of fluores-
cence intensity ratio of 405 nm to 510 nm on flow cytometry for 1 min,
the Indo-1–loaded cells were stimulated with 1 mM thapsigargin (TG)
and the events were collected over a period of 7 min. Then the flow
cytometry was paused and thapsigargin-stimulated cells were spun down.
The Ca2+-free buffer was removed and replaced with HBSS containing
1.26 mM Ca2+. The thapsigargin-stimulated cells were washed once and
then resuspended in HBSS with 1.26 mM Ca2+. The flow cytometry was
resumed and more events were recorded for another 7-min period. The
profiles were gated on CD4+CD44low7-AAD2 cell population. This ex-
periment was repeated three times independently.
1570 AUTOPHAGY REGULATION OF ER AND CALCIUM IN T LYMPHOCYTES
by guest on January 8, 2019http://w
ww
.jimm
unol.org/D
ownloaded from

Thapsigargin stimulation induced obvious calcium flux in bothAtg7-deficient and wild-type T cells in Ca2+-free buffer (Fig. 5C).This calcium flux was from the ER calcium store. As expected,after replacing Ca2+-free buffer with buffer containing Ca2+, the[Ca2+]i was readily increased in both Atg7-deficient and wild-typeT cells (Fig. 5C). Similar experiments were performed using fura2–loaded Atg7-deficient T cells and analyzed by calcium liveimages under microscope. The calcium influx from each indi-vidual Atg7-deficient T cell was very similar after switching cal-cium-free buffer to calcium buffer when stimulated with thap-sigargin (data not shown). Together, these results demonstrate thatthe CRAC channel remains intact in Atg7-deficient T cells, sug-gesting that the excess ER and increased ER calcium stores inAtg7-deficient T cells are the cause of impaired calcium influx.These results strongly suggest that autophagy is involved in theregulation of calcium mobilization in T lymphocytes. The calciumflux defect in Atg7-deficient T cells is an ER-intrinsic defectcaused by impaired depletion of ER calcium stores after stimu-lation.
Redistribution of STIM-1 is impaired in Atg7-deficient T cellsupon TCR activation
CRAC channel opening is tightly regulated by the calcium sensorSTIM-1, which is expressed on ER (23). After T cell activation,STIM-1 is triggered by the depletion of ER calcium stores andredistributed to form punctae near ER-plasma membrane junc-tions, allowing STIM-1 to engage Orai1, the CRAC channel pore-forming subunit, resulting in opening of the CRAC channels. Tofurther determine whether defective Ca2+ depletion causes im-paired calcium influx in autophagy-deficient T cells, Atg7-deficientT cells were stimulated with plate-bound anti-CD3 Ab, and STIM-1 distribution was analyzed. As shown in Fig. 6A, the endogenousSTIM-1 is expressed in naive resting Atg7-deficient T cells. Thetotal intensity of STIM-1 in Atg7-deficient T cells is even higherthan that in wild-type T cells (Fig. 6B). STIM-1 punctae could bevisualized in stimulated T cells. STIM-1 was redistributed afterstimulation in both Atg7-deficient and wild-type T cells. The sizeof STIM-1 punctae in Atg7-deficient T cells was comparable to thatin wild-type T cells (Fig. 6C); however, the fluorescence intensityof these punctae was much lower in Atg7-deficient T cells uponTCR stimulation (Fig. 6D). The decreased intensity of STIM-1punctae in Atg7-deficient T cells suggests that fewer CRACchannels are opened in these cells after T cell activation.To further determine that the impairment of STIM-1 redis-
tribution is caused by defective depletion of ER calcium store inAtg7-deficient T cells, the redistribution of STIM-1 under stim-ulation of the SERCA pump inhibitor, thapsigargin, was analyzed.As expected, STIM-1 was redistributed in both Atg7-deficientT cells and wild-type T cells when stimulated by thapsigargin.The area of STIM-1 punctae in Atg7-deficient T cells was sig-nificantly higher (p = 0.03) than that in wild-type cells, and theintensity of STIM-1 punctae was comparable between Atg7-deficient and wild-type T cells (p = 0.16) when stimulated withthapsigargin (Fig. 6E, 6F). These results are consistent with thecalcium influx profiles in Atg7-deficient T cells stimulated withthapsigargin.We further examine the expression levels of STIM-1 and the
CRAC channel pore-forming subunit Orai1 in Atg7-deficientT cells by Western blot. The expression of STIM-1 is higher inAtg7-deficient T cells, whereas Orai1 expression is comparablebetween wild-type and Atg7-deficient T cells (Fig. 6G). The higherexpression of STIM-1 may be due to the expanded ER organelle inautophagy-deficient T cells.
To test whether calcium flux defect affects IL-2 production inautophagy-deficient T cells, both purified wild-type and autophagy-deficient naive CD4+ T cells were stimulated with plate-boundanti-CD3 or anti-CD3 plus anti-CD28. Interestingly, more IL-2were produced from autophagy-deficient T cells stimulated witheither anti-CD3 Ab or anti-CD3 plus anti-CD28 Abs after over-night stimulation. This suggests that the calcium flux defect inautophagy-deficient T cells may not reduce the IL-2 transcriptionand translation. More IL-2 produced in autophagy-deficient CD4+
T cells suggests that autophagy may regulate IL-2 secretion inT lymphocyte, and this needs to be further explored.
DiscussionSeveral important points emerge from this study. First, our datashow that ER content is developmentally regulated in T lym-phocytes, and this regulation is dependent on autophagy. Second,autophagy-deficient T lymphocytes exhibit a dramatic defect incalcium influx upon TCR stimulation. This calcium influx defect isrelated to abnormal expansion of ER and increased intracellularcalcium stores. Consequently, the defect in calcium store depletionresults in a decline in CRAC channel function. To our knowledge,this is the first evidence to illustrate the impact of autophagy oncalcium homeostasis and CRAC channel-related calcium mobili-zation.Rough ER is the site of protein translation, secretory protein
transportation, and protein glycosylation, whereas smooth ER is thesite of steroid synthesis, detoxification of drugs and poisons, andcalcium sequestration. In T lymphocytes, several studies havedemonstrated that ER calcium homeostasis regulates T cell func-tion. For example, T cells lacking both Bax and Bak, two proa-poptotic proteins, exhibit defective calcium signaling and impairedproliferation after TCR stimulation (40). It has also been demon-strated that Bax and Bak control ER calcium release (40). Fur-thermore, the antiapoptotic protein Bcl-2 can inhibit TCR-inducedrelease of calcium from ER by binding to the IP3R (41). Our datasuggest that autophagy is a novel mechanism regulating calciummobilization by maintaining ER homeostasis in mature T lym-phocytes. These findings provide an interesting contrast to aprevious study demonstrating that calcium mobilization regulatesautophagy, in which it was shown that calcium mobilization re-agents increase the cytosolic calcium concentration, inducingautophagy (42). Calcium-dependent induction of autophagy ismediated by Ca2+/calmodulin-dependent kinase kinase-b and AMP-activated protein kinase and inhibited by ectopic expression ofBcl-2 in the ER (42). Together, these results indicate that auto-phagy and calciummobilization are interrelated and can affect eachother.A requirement for regulation of ER content in T cells has not
been previously demonstrated. In yeast, selective sequestration ofER by autophagy is part of the unfolded protein response (16–18).In Atg7-deficient T cells, Grp94, Grp78, and PDI are constitu-tively upregulated, indicating activation of the ER stress response.This suggests that similar to what has been observed in the yeastsystem, ER stress may initiate autophagy to maintain ER ho-meostasis and normal functional responses in T lymphocytes. Thismost likely enables eukaryotic cells to both adapt during periodsof stress and also effectively modify cellular functions, such ascalcium signaling in mature T cells and secretory protein synthesisin developing and mature T cells. Autophagy may not directlyregulate calcium mobilization in T lymphocytes and Atg7 is nota calcium sensor to directly control the calcium flux. Our recentdata showed that autophagy temporarily regulates the organellehomeostasis in T lymphocytes (W. Jia and Y.W. He, submitted forpublication). However, the other functions of ER, such as trans-
The Journal of Immunology 1571
by guest on January 8, 2019http://w
ww
.jimm
unol.org/D
ownloaded from

lation, in Atg7-deficient T cells may not be affected. The Atg7-deficient T cells express similar surface markers as the wild-type T cells, for example, CD4, CD8, and TCRb (26). Atg7-deficient T cells can be activated to express CD25 and CD69comparable to wild-type T cells after anti-CD3 stimulation (datanot shown). Although the calcium influx is impaired in autophagy-deficient T cells, there is still certain level of calcium mobilized inautophagy-deficient T cells after anti-CD3 Ab stimulation. Thismay be the reason that IL-2 production is not defective in auto-phagy-deficient T cells.STIM-1 serves as the calcium sensor in ER, and the interaction
between STIM-1 and Orai1 is required for CRAC channel opening
(20, 22). The size of STIM-1 punctae is similar inAtg7-deficient andwild-type T cells, but the intensities of these punctae aremuch lowerin Atg7-deficient T cells. Our data suggest that the redistribution ofSTIM-1 is essential for CRAC channel opening in T cells. This isconsistent with a previous report that the CRAC channel is consti-tutively activated in Jurkat cells that overexpress wild-type STIM-1or an EF-hand mutant of STIM-1 (21). Calcium influx is also reg-ulated by mitochondria. Mitochondria buffer intracellular calciumand sustain CRAC channel opening in T lymphocytes (43, 44).Although Atg7-deficient T cells contain excess mitochondria (26),the mitochondrial homeostasis defect may not be related to thecalcium influx defect in these cells. We treated Atg7-deficient
FIGURE 6. Impaired redistribution of STIM-1 in Atg7-deficient T cells. Purified T cells were added to glass coverslips coated with anti-CD3 Ab or anti–
H-2Kb Ab, incubated for 20 min, and fixed with 2% paraformaldehyde. Cells were surface stained with anti-CD4 and intracellularly stained with anti–
STIM-1 Ab. Z-stack images were captured at 1-mm intervals using 3100 oil objective. The best focused layers were used to quantitate the fluorescence
intensity of STIM-1 in resting wild-type and Atg7f/fLck-Cre CD4+ cells. More than 30 individual cells were analyzed. For the analysis of STIM-1 punctae,
one layer was selected from three-dimensional deconvolution images, and the layers on either side of the selected layer were subtracted. The size and
intensity of STIM-1 punctae were measured using MetaMorph 7.6 software. Fifty wild-type or Atg7f/fLck-Cre CD4+ cells were randomly selected for
analysis. A, Representative images of endogenous of STIM-1 and STIM-1 punctae in wild-type and Atg7f/fLck-Cre CD4+ cells stimulated by anti-CD3
mAb or thapsigargin. Images were obtained with Zeiss ApoTome system using AxioVision software with a 363 oil objective. B, Fluorescence intensity of
STIM-1 in resting wild-type and Atg7f/fLck-Cre CD4+ cells. C, Area of STIM-1 punctae in anti-CD3 Ab-activated wild-type and Atg7f/fLck-Cre CD4+
cells. p = 0.6. D, Fluorescence intensity of STIM-1 punctae in anti-CD3 Ab-activated CD4 cells. p = 3.5 3 10215. E, Area of STIM-1 punctae in wild-type
and Atg7f/fLck-Cre CD4+ cells stimulated with thapsigargin. p = 0.03. The LN cells from wild-type or Atg7f/fLck-Cre mice were stimulated with 100 nM
thapsigargin for 20 min. The cells were fixed and stained intracellularly with STIM-1 Ab. The images of STIM-1 punctae were captured and quantitated
using the same method as described above. F, Fluorescence intensity of STIM-1 punctae in wild-type and Atg7f/fLck-Cre CD4+ cells stimulated with
thapsigargin. p = 0.16. G, Protein expressions of STIM-1 and Orai1 in Atg7-deficient T cells. The Western blot was repeated three times using purified
T cells from three different pairs of wild-type and Atg7f/fLck-Cre mice. The numbers represent the ratios of intensity of STIM-1 or Orai1 bands to the
intensity of actin bands. Normalized Western blot intensities were quantified and shown in the right panel. STIM-1 (mean6 SD). *p = 0.0069. Orai1 (mean6SD). p = 0.47. H, IL-2 production by autophagy-deficient T cells. Purified naive CD4+ T cells were stimulated with plate-bound anti-CD3 (5 mg/ml) or anti-
CD3 plus anti-CD28 (2 mg/ml) overnight. IL-2 in the cell culture supernatants was measured by ELISA. *p = 0.0057, **p = 0.00049.
1572 AUTOPHAGY REGULATION OF ER AND CALCIUM IN T LYMPHOCYTES
by guest on January 8, 2019http://w
ww
.jimm
unol.org/D
ownloaded from
T cells with carbonyl cyanide m-chlorophenylhydrazone, whichinhibits mitochondria from taking up calcium (43), and then stim-ulated the cells with thapsigargin. Both Atg7-deficient and wild-type T cells displayed similar [Ca2+]i. Similarly, when cells werestimulated with thapsigargin before carbonyl cyanide m-chlor-ophenylhydrazone treatment, both Atg7-deficient and wild-typeT cells displayed similar [Ca2+]i (data not shown), suggesting mi-tochondrial Ca2+ uptake and release are not dysregulated in Atg7-deficient T lymphocytes. Recently published data found that Orai1channel could be inhibited byH2O2 in T lymphocytes (45). Reactiveoxygen species (ROS) production is increased in Atg7-deficientT cells (26). However, polyethylene glycol-catalase, the ROS pro-duction scavenger, does not rescue the calcium influx defect inAtg7-deficient T cells (data not shown).Although our data show that both ER and mitochondria are
regulated by autophagy in T lymphocytes (26), the homeostasis ofER is regulated differently from that of mitochondria in thesecells. Mitochondrial content is relatively high in DN, DP, andCD4+ SP thymocyte subpopulations, and excess mitochondriamust be cleared when immature T cells exit the thymus to theperiphery (26). In contrast, ER content peaks in the DN thymocytesubpopulation and is maintained at a low level in more maturethymocyte subpopulations and in mature peripheral T cells. In theabsence of autophagy, ER is expanded in mature T lymphocytes.Differences in homeostasis of mitochondria and ER during T celldevelopment may be related to the different functions of theseorganelles. ROS, which are produced as a byproduct of the mi-tochondrial respiratory chain, are toxic to cells. For mature Tlymphocytes, mitochondrial content must be maintained at alow level to prevent excess ROS production. This is supportedby the finding that autophagy-deficient T cells produce more ROSthan wild-type T cells (26). Another potential explanation for thedifferences observed in ER and mitochondrial homeostasis may bethe role of mitochondria in apoptosis. Autophagy-deficient T cellsexpress more cytochrome c than wild-type T cells, making themmore sensitive to apoptosis (26).Future studies will provide important information about the way
in which autophagy-mediated regulation of ER content may fit intoparticular cellular responses during T cell development, homeo-stasis, and function. Our functional data point to an interestingconnection between autophagy-mediated regulation of ER contentand calcium signaling in T cells. In yeast, organelle homeostasisis maintained largely through organelle-specific autophagic pro-cesses, such as pexophagy, mitophagy, and ER-phagy (14, 16). Inthis study, we found that ER, like mitochondria, is developmentallyregulated by autophagy in T lymphocytes. We previously showedthat Atg5 is essential for T lymphocyte survival and proliferation(25), and we recently found that both Atg5 and Atg7 are requiredfor mitochondrial homeostasis in T lymphocytes (26). Togetherwith the calcium influx defect in Atg7-deficient T cells reported inthis work, these data strongly suggest that autophagy plays multipleimportant physiological roles in regulating T lymphocyte functionby controlling organelle homeostasis.In summary, our results demonstrate that autophagy is essential
for ER homeostasis. The abnormal expansion of ER and increasedintracellular calcium stores in Atg7-deficient T cells result inimpaired ER calcium stores depletion and redistribution of STIM-1to the ER-plasma membrane junction after activation, leading todefective calcium flux upon stimulation in Atg7-deficient T cells.
AcknowledgmentsWe thank Dr. Michael Cook for help with the flow cytometry and Dr. Sara
Miller and Philip Christopher for help with transmission electron micros-
copy. We thank Claire L. Gordy for editing the manuscript.
DisclosuresThe authors have no financial conflicts of interest.
References1. Mizushima, N., Y. Ohsumi, and T. Yoshimori. 2002. Autophagosome formation
in mammalian cells. Cell Struct. Funct. 27: 421–429.2. Klionsky, D. J. 2007. Autophagy: from phenomenology to molecular un-
derstanding in less than a decade. Nat. Rev. Mol. Cell Biol. 8: 931–937.3. Levine, B., and V. Deretic. 2007. Unveiling the roles of autophagy in innate and
adaptive immunity. Nat. Rev. Immunol. 7: 767–777.4. Munz, C. 2009. Enhancing immunity through autophagy. Annu. Rev. Immunol.
27: 423–449.5. Ohsumi, Y. 2001. Molecular dissection of autophagy: two ubiquitin-like systems.
Nat. Rev. Mol. Cell Biol. 2: 211–216.6. Mizushima, N., B. Levine, A. M. Cuervo, and D. J. Klionsky. 2008. Autophagy
fights disease through cellular self-digestion. Nature 451: 1069–1075.7. Liang, X. H., S. Jackson, M. Seaman, K. Brown, B. Kempkes, H. Hibshoosh, and
B. Levine. 1999. Induction of autophagy and inhibition of tumorigenesis bybeclin 1. Nature 402: 672–676.
8. Kihara, A., T. Noda, N. Ishihara, and Y. Ohsumi. 2001. Two distinct Vps34phosphatidylinositol 3-kinase complexes function in autophagy and carboxy-peptidase Y sorting in Saccharomyces cerevisiae. J. Cell Biol. 152: 519–530.
9. Levine, B., and D. J. Klionsky. 2004. Development by self-digestion: molecularmechanisms and biological functions of autophagy. Dev. Cell 6: 463–477.
10. Levine, B., and G. Kroemer. 2008. Autophagy in the pathogenesis of disease.Cell 132: 27–42.
11. Lee, H. K., J. M. Lund, B. Ramanathan, N. Mizushima, and A. Iwasaki. 2007.Autophagy-dependent viral recognition by plasmacytoid dendritic cells. Science315: 1398–1401.
12. Schmid, D., M. Pypaert, and C. Munz. 2007. Antigen-loading compartments formajor histocompatibility complex class II molecules continuously receive inputfrom autophagosomes. Immunity 26: 79–92.
13. Lee, H. K., L. M. Mattei, B. E. Steinberg, P. Alberts, Y. H. Lee, A. Chervonsky,N. Mizushima, S. Grinstein, and A. Iwasaki. 2010. In vivo requirement for Atg5in antigen presentation by dendritic cells. Immunity 32: 227–239.
14. Monastyrska, I., and D. J. Klionsky. 2006. Autophagy in organelle homeostasis:peroxisome turnover. Mol. Aspects Med. 27: 483–494.
15. Lemasters, J. J. 2005. Selective mitochondrial autophagy, or mitophagy, asa targeted defense against oxidative stress, mitochondrial dysfunction, and aging.Rejuvenation Res. 8: 3–5.
16. Bernales, S., S. Schuck, and P. Walter. 2007. ER-phagy: selective autophagy ofthe endoplasmic reticulum. Autophagy 3: 285–287.
17. Mijaljica, D., M. Prescott, and R. J. Devenish. 2006. Endoplasmic reticulum andGolgi complex: contributions to, and turnover by, autophagy. Traffic 7: 1590–1595.
18. Bernales, S., K. L. McDonald, and P. Walter. 2006. Autophagy counterbalancesendoplasmic reticulum expansion during the unfolded protein response. PLoSBiol. 4: e423.
19. Roos, J., P. J. DiGregorio, A. V. Yeromin, K. Ohlsen, M. Lioudyno, S. Zhang,O. Safrina, J. A. Kozak, S. L. Wagner, M. D. Cahalan, et al. 2005. STIM1, anessential and conserved component of store-operated Ca2+ channel function. J.Cell Biol. 169: 435–445.
20. Liou, J., M. L. Kim, W. D. Heo, J. T. Jones, J. W. Myers, J. E. Ferrell, Jr., andT. Meyer. 2005. STIM is a Ca2+ sensor essential for Ca2+-store-depletion-triggered Ca2+ influx. Curr. Biol. 15: 1235–1241.
21. Zhang, S. L., Y. Yu, J. Roos, J. A. Kozak, T. J. Deerinck, M. H. Ellisman,K. A. Stauderman, and M. D. Cahalan. 2005. STIM1 is a Ca2+ sensor thatactivates CRAC channels and migrates from the Ca2+ store to the plasmamembrane. Nature 437: 902–905.
22. Prakriya, M., S. Feske, Y. Gwack, S. Srikanth, A. Rao, and P. G. Hogan. 2006.Orai1 is an essential pore subunit of the CRAC channel. Nature 443: 230–233.
23. Park, C. Y., P. J. Hoover, F. M. Mullins, P. Bachhawat, E. D. Covington,S. Raunser, T. Walz, K. C. Garcia, R. E. Dolmetsch, and R. S. Lewis. 2009.STIM1 clusters and activates CRAC channels via direct binding of a cytosolicdomain to Orai1. Cell 136: 876–890.
24. Penna, A., A. Demuro, A. V. Yeromin, S. L. Zhang, O. Safrina, I. Parker, andM. D. Cahalan. 2008. The CRAC channel consists of a tetramer formed by Stim-induced dimerization of Orai dimers. Nature 456: 116–120.
25. Pua, H. H., I. Dzhagalov, M. Chuck, N. Mizushima, and Y. W. He. 2007. Acritical role for the autophagy gene Atg5 in T cell survival and proliferation. J.Exp. Med. 204: 25–31.
26. Pua, H. H., J. Guo, M. Komatsu, and Y. W. He. 2009. Autophagy is essential formitochondrial clearance in mature T lymphocytes. J. Immunol. 182: 4046–4055.
27. Pua, H. H., and Y. W. He. 2007. Maintaining T lymphocyte homeostasis: anotherduty of autophagy. Autophagy 3: 266–267.
28. Stephenson, L. M., B. C. Miller, A. Ng, J. Eisenberg, Z. Zhao, K. Cadwell,D. B. Graham, N. N. Mizushima, R. Xavier, H. W. Virgin, and W. Swat. 2009.Identification of Atg5-dependent transcriptional changes and increases in mito-chondrial mass in Atg5-deficient T lymphocytes. Autophagy 5: 625–635.
29. Pua, H. H., and Y. W. He. 2009. Mitophagy in the little lymphocytes: an essentialrole for autophagy in mitochondrial clearance in T lymphocytes. Autophagy 5:745–746.
30. Komatsu, M., S. Waguri, T. Ueno, J. Iwata, S. Murata, I. Tanida, J. Ezaki,N. Mizushima, Y. Ohsumi, Y. Uchiyama, et al. 2005. Impairment of starvation-
The Journal of Immunology 1573
by guest on January 8, 2019http://w
ww
.jimm
unol.org/D
ownloaded from

induced and constitutive autophagy in Atg7-deficient mice. J. Cell Biol. 169:425–434.
31. Hennet, T., F. K. Hagen, L. A. Tabak, and J. D. Marth. 1995. T-cell-specificdeletion of a polypeptide N-acetylgalactosaminyl-transferase gene by site-directed recombination. Proc. Natl. Acad. Sci. USA 92: 12070–12074.
32. Franz, S., K. Herrmann, B. G. Furnrohr, B. Fuhrnrohr, A. Sheriff, B. Frey,U. S. Gaipl, R. E. Voll, J. R. Kalden, H. M. Jack, and M. Herrmann. 2007. Aftershrinkage apoptotic cells expose internal membrane-derived epitopes on theirplasma membranes. Cell Death Differ. 14: 733–742.
33. Paemeleire, K., P. E. Martin, S. L. Coleman, K. E. Fogarty, W. A. Carrington,L. Leybaert, R. A. Tuft, W. H. Evans, and M. J. Sanderson. 2000. Intercellularcalcium waves in HeLa cells expressing GFP-labeled connexin 43, 32, or 26.Mol. Biol. Cell 11: 1815–1827.
34. Jackson, M. R., T. Nilsson, and P. A. Peterson. 1993. Retrieval of transmembraneproteins to the endoplasmic reticulum. J. Cell Biol. 121: 317–333.
35. Williams, D. B. 2006. Beyond lectins: the calnexin/calreticulin chaperone sys-tem of the endoplasmic reticulum. J. Cell Sci. 119: 615–623.
36. Lewis, R. S. 2001. Calcium signaling mechanisms in T lymphocytes. Annu. Rev.Immunol. 19: 497–521.
37. Sagara, Y., and G. Inesi. 1991. Inhibition of the sarcoplasmic reticulum Ca2+transport ATPase by thapsigargin at subnanomolar concentrations. J. Biol. Chem.266: 13503–13506.
38. Mason, M. J., and S. Grinstein. 1993. Ionomycin activates electrogenic Ca2+influx in rat thymic lymphocytes. Biochem. J. 296: 33–39.
39. Morgan, A. J., and R. Jacob. 1994. Ionomycin enhances Ca2+ influx by stim-ulating store-regulated cation entry and not by a direct action at the plasmamembrane. Biochem. J. 300: 665–672.
40. Jones, R. G., T. Bui, C. White, M. Madesh, C. M. Krawczyk, T. Lindsten,B. J. Hawkins, S. Kubek, K. A. Frauwirth, Y. L. Wang, et al. 2007. The proa-poptotic factors Bax and Bak regulate T cell proliferation through control ofendoplasmic reticulum Ca(2+) homeostasis. Immunity 27: 268–280.
41. Rong, Y. P., A. S. Aromolaran, G. Bultynck, F. Zhong, X. Li, K. McColl,S. Matsuyama, S. Herlitze, H. L. Roderick, M. D. Bootman, et al. 2008. Tar-geting Bcl-2-IP3 receptor interaction to reverse Bcl-2’s inhibition of apoptoticcalcium signals. Mol. Cell 31: 255–265.
42. Høyer-Hansen, M., L. Bastholm, P. Szyniarowski, M. Campanella, G. Szabadkai,T. Farkas, K. Bianchi, N. Fehrenbacher, F. Elling, R. Rizzuto, et al. 2007.Control of macroautophagy by calcium, calmodulin-dependent kinase kinase-beta, and Bcl-2. Mol. Cell 25: 193–205.
43. Hoth, M., C. M. Fanger, and R. S. Lewis. 1997. Mitochondrial regulation ofstore-operated calcium signaling in T lymphocytes. J. Cell Biol. 137: 633–648.
44. Quintana, A., E. C. Schwarz, C. Schwindling, P. Lipp, L. Kaestner, and M. Hoth.2006. Sustained activity of calcium release-activated calcium channels requirestranslocation of mitochondria to the plasma membrane. J. Biol. Chem. 281:40302–40309.
45. Bogeski, I., C. Kummerow, D. Al-Ansary, E. C. Schwarz, R. Koehler, D. Kozai,N. Takahashi, C. Peinelt, D. Griesemer, M. Bozem, et al. 2010. Differentialredox regulation of ORAI ion channels: a mechanism to tune cellular calciumsignaling. Sci. Signal. 3: ra24.
1574 AUTOPHAGY REGULATION OF ER AND CALCIUM IN T LYMPHOCYTES
by guest on January 8, 2019http://w
ww
.jimm
unol.org/D
ownloaded from


![Endoplasmic reticulum[1]](https://img.dokumen.tips/doc/110x75/58ed5fc71a28aba1678b4611/endoplasmic-reticulum1.jpg)