Embed Size (px)
Citation preview
AUTOMATION OF COMMON BUILDING ENERGY SIMULATIONWORKFLOWS USING PYTHON
Clayton Miller1, Christian Hersberger1, and Marcus Jones21Architecture & Sustainable Building Technologies (SuAT),Institute of Technology in Architecture (ITA), ETH Zurich
{miller.clayton, hersberger}@arch.ethz.ch2EXERGY Studios s.r.o., Vienna University of Technology, [email protected]
ABSTRACTA valuable skillset for building industry professionalsis proficiency in high-level, scripting languages thatcan automate and perform many common repetitive ortechnically intensive tasks. This application-focusedpaper emphasizes the use of the Python program-ming language in various workflows common to thebuilding performance modeling and simulation pro-cess. Python is an open, powerful, and easy-to-learnscripting language with an emphasis on programmerproductivity. While the highlighted applications them-selves are notably ordinary amongst building simu-lation practitioners, the novelty of this discussion isin the speed and usefulness of new Python librariesand data analysis techniques. Four short examplesare illustrated: simulation input file templating, dataexchange and interoperability, performance curve re-gression, and time-series output data postprocessing.An overview is presented of the growing current andplanned Python libraries, extensions, and projects thatare especially applicable and, in some cases, explicitlydesigned for the building industry.
INTRODUCTIONA majority of professionals in the building analysis in-dustry are trained in the fields of mechanical or elec-trical engineering or architecture. The educationalpath for these disciplines has not traditionally includedextensive training in computer science. A buildingsimulator’s toolkit is often limited to their simulationengine of choice, perhaps a graphical user interface(GUI) to create and manipulate input, and a spread-sheet program such as Microsoft Excel to interpret theraw output data into value. While these tools may beenough for the casual user, more powerful and flexi-ble methods are needed for the dedicated simulationprofessional, especially those in research and devel-opment. Complimentary programs, such as the Ener-gyPlus Auxiliary Program library, are often created inorder to automate certain specific processes, however,these solutions are static in their the ability to adaptto different users’ custom needs (EnergyPlus, 2012).Much of the analysis in the field can be ad-hoc andmore flexible and robust methods would enable a pro-fessional to understand and control how the data is be-ing transformed.
Traditionally, if a building simulation expert were tolearn a programming language, it would be generallya lower level, compiled language like Fortran or C.These languages are designed for application and sys-tem programming and a significant amount of effortand training is required to become proficient. Thenecessity of learning such languages has continueddue to their execution speed in simulation enginesand due to the fact that many legacy simulation pro-grams are written in such languages. In the 1990’s,many professionals also started utilizing spreadsheet-integrated scripting languages like Visual Basic forpost-processing and rudimentary user interfaces forsimplified tools.
Language-centric Solutions Using PythonThe last twenty years of computer science has pro-duced numerous high-level, scripting languages whichwere designed with a focus on human-readable syn-tax and ease of use. These languages may sacrificememory or execution speed; however, the increase incoder productivity is remarkable, especially for entry-level programmers. Python, Ruby, and Lisp are ex-amples of this genre. This paper outlines the use ofthe Python programming language in the building per-formance simulation and analysis context due to itspopularity amongst computational scientists and theresearch community. The goal of this analysis is tooutline the advantages of building simulation profes-sionals in becoming proficient in a high-level scriptinglanguage and to provide guidance on the potential ap-plications of this skill set.
Advantages of PythonPython is an interpreted and dynamically typed pro-gramming language that was first released by Guidovan Rossum in 1990 and has since grown into oneof the most popular programming languages withwidespread use in research, commercial, and onlineenvironments.An interpreted language, contrasting to a compiledlanguage like C, does not create a machine executablecode and is instead executed ”on-the-fly”. Interpretedlanguages often are better for fast code prototypingand platform independence for distribution of code.A dynamically typed language is one in which a vari-able can be reassigned to a different data type later in
Proceedings of BS2013: 13th Conference of International Building Performance Simulation Association, Chambéry, France, August 26-28
- 210 -
the code (such as a string being assigned to a variablename previously used as an integer). Furthermore, thevariable type in Python does not need to be explicitlydeclared beforehand. Languages such as Fortran orC require explicit variable name declarations and andtype assignments. It should be noted that although theadvantages of interpreted and dynamically typed lan-guages are still the subject of debate among compu-tational scientists, it is the opinion of the authors thatthese features can lead to faster learning and imple-mentation for a building simulation expert.Python syntax is generally differentiated through itsuse of white-space, clarity, and expressiveness. Itis a multi-paradigm language that can be used inobject-oriented, functional, or imperative program-ming styles. Python furthermore has a number of gen-eral features which have contributed to its rapid growth(Oliphant, 2007):
• Numerous, well-developed library modules ofscientific, statistics, engineering, and web-related extensions
• A large, enthusiastic Python community whichprovides responsive online support, documenta-tion, and tutorials
• Strong emphasis on clear, human-readable, sim-ple syntax designed to promote coder productiv-ity and enjoyment
• Robust and easy extendability to users who wantto create a domain-specific library module
Python’s adaptability is apparent in its success as botha quick, impromptu scripting language for beginnersand as a complete solution for large, internet compa-nies; much of the systems that power companies likeDropbox, Google, and YouTube are written in Python.It is for the above reasons that the authors advocatethe use of the Python language as an essential tool forbuilding simulation professionals looking to increaserobustness and productivity in their workflow.
Application to Building Performance SimulationBuilding performance modeling and simulation is agrowing scientific field focused in digitally reproduc-ing the physical phenomena occurring in the built en-vironment. As the field has progressed, software toolshave become more complex and detailed and oftenstudies will include hundreds or thousands of sim-ulations. Many variations exist in the way simula-tion studies are conducted, however there is a gen-eral workflow structure that is common amongst moststudies: a collection of characteristic ’meta’ data abouta building is compiled in an input format, this struc-tured data is loaded into a simulation routine or en-gine, and the output results are extracted at the end ofthe process for analysis. This general workflow is il-lustrated in Table 1; it includes various referenced ex-amples of studies that illustrate each general processcategory.
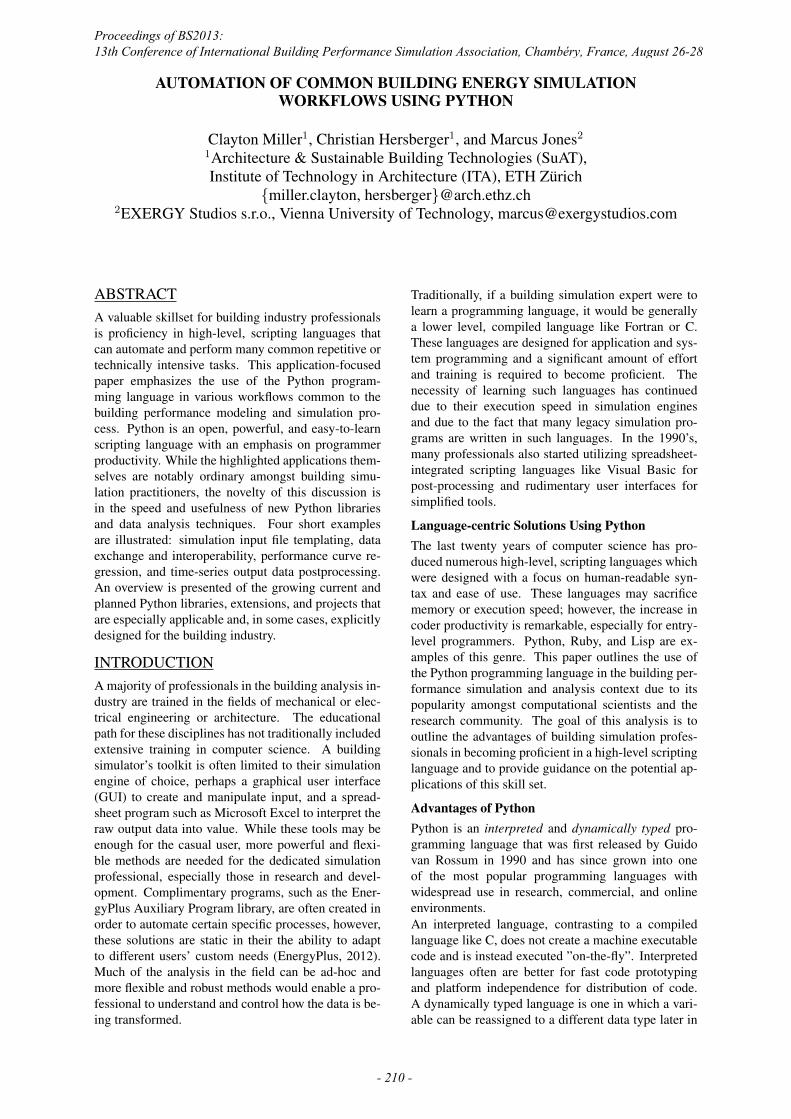
Furthermore, many simulation tools are derived froma research background within a small community, andlack the polish of commercial software. Given thecomplexity of many models and the number of as-sumptions that go into a simulation, the workflow ofenergy modeling and simulation can be described byFigure 1 as an iterative cycle where the model is con-tinuously adjusted to correct errors and test assump-tions.
Figure 1: Wheel of Simulation (Ledinger and Jones,2010)
The iterative nature of the simulation workflow cantherefore further leverage any step which is automatedusing Python scripting, saving time each repetition.Each of the categories from Table 1 will now be illus-trated through four short characteristics examples. Thefirst three topics focus on the pre-processing of input’meta’ of a building into the simulation: input file tem-plating, data exchange, and performance curve devel-opment. The last example outlines the use of Pythondata analytics functions and libraries which empowerfast simulation data output analysis and visualization.
INPUT FILE GENERATIONA fundamental component of the simulation workflowis the structured definition of the input characteristicsof the building scenario to be examined through thecalculation. Most major simulation engines have atleast one graphical user interface in which the userwill specify fields such as geometry, HVAC systems,weather data, and desired output variables.The simulation needs of researchers and some profes-sionals interested in parameterized building design op-timization now also dictate that hundreds or even thou-sands of building simulation scenario inputs need tobe created and organized. Although some GUI’s arestarting to include dedicated features related to para-metric analysis, the setup of parametric studies is stillvery time-consuming and often cumbersome due tothe limited possibilities of the macro languages usedto calculate the values for the different parametrizedsimulation runs and the constraints in their algebraicand logic expressions. In the worst case scenario aprofessional would manually modify each input file.However, an alternative is to use the powerful textquery and manipulation capabilities of the Python lan-
Proceedings of BS2013: 13th Conference of International Building Performance Simulation Association, Chambéry, France, August 26-28
- 211 -
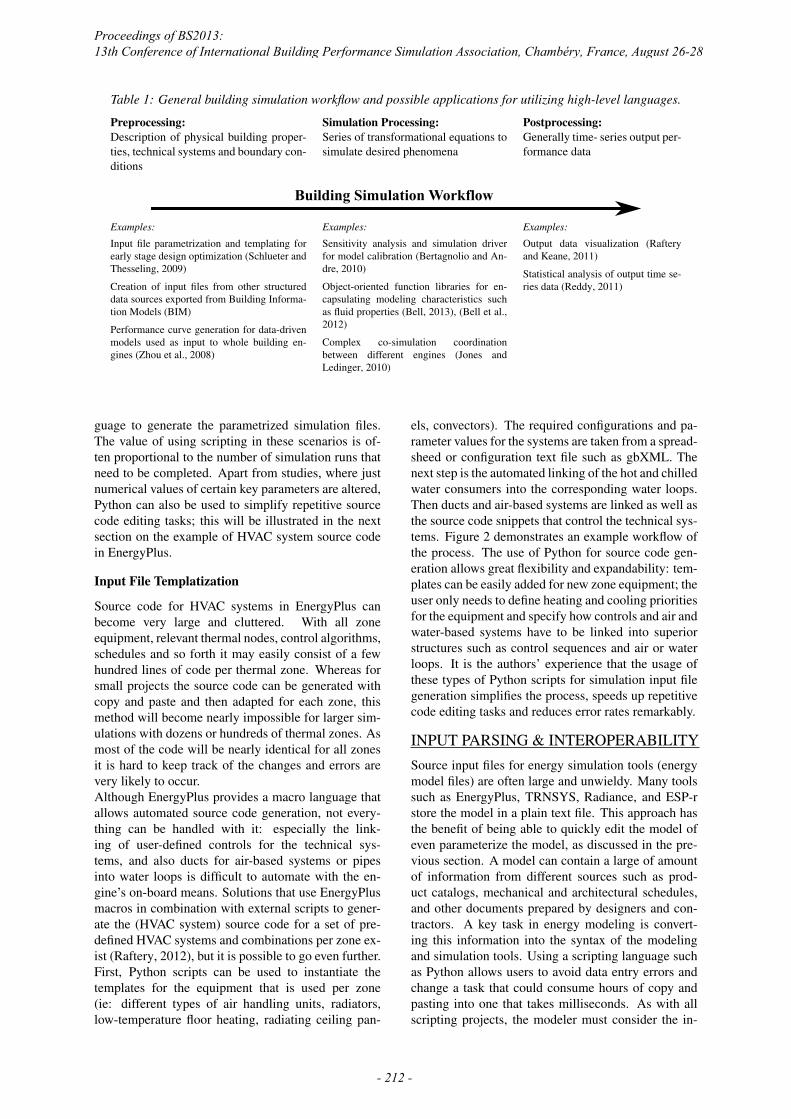
Table 1: General building simulation workflow and possible applications for utilizing high-level languages.
Preprocessing: Simulation Processing: Postprocessing:Description of physical building proper-ties, technical systems and boundary con-ditions
Series of transformational equations tosimulate desired phenomena
Generally time- series output per-formance data
Examples:
Input file parametrization and templating forearly stage design optimization (Schlueter andThesseling, 2009)
Creation of input files from other structureddata sources exported from Building Informa-tion Models (BIM)
Performance curve generation for data-drivenmodels used as input to whole building en-gines (Zhou et al., 2008)
Examples:
Sensitivity analysis and simulation driverfor model calibration (Bertagnolio and An-dre, 2010)
Object-oriented function libraries for en-capsulating modeling characteristics suchas fluid properties (Bell, 2013), (Bell et al.,2012)
Complex co-simulation coordinationbetween different engines (Jones andLedinger, 2010)
Examples:
Output data visualization (Rafteryand Keane, 2011)
Statistical analysis of output time se-ries data (Reddy, 2011)
guage to generate the parametrized simulation files.The value of using scripting in these scenarios is of-ten proportional to the number of simulation runs thatneed to be completed. Apart from studies, where justnumerical values of certain key parameters are altered,Python can also be used to simplify repetitive sourcecode editing tasks; this will be illustrated in the nextsection on the example of HVAC system source codein EnergyPlus.
Input File Templatization
Source code for HVAC systems in EnergyPlus canbecome very large and cluttered. With all zoneequipment, relevant thermal nodes, control algorithms,schedules and so forth it may easily consist of a fewhundred lines of code per thermal zone. Whereas forsmall projects the source code can be generated withcopy and paste and then adapted for each zone, thismethod will become nearly impossible for larger sim-ulations with dozens or hundreds of thermal zones. Asmost of the code will be nearly identical for all zonesit is hard to keep track of the changes and errors arevery likely to occur.Although EnergyPlus provides a macro language thatallows automated source code generation, not every-thing can be handled with it: especially the link-ing of user-defined controls for the technical sys-tems, and also ducts for air-based systems or pipesinto water loops is difficult to automate with the en-gine’s on-board means. Solutions that use EnergyPlusmacros in combination with external scripts to gener-ate the (HVAC system) source code for a set of pre-defined HVAC systems and combinations per zone ex-ist (Raftery, 2012), but it is possible to go even further.First, Python scripts can be used to instantiate thetemplates for the equipment that is used per zone(ie: different types of air handling units, radiators,low-temperature floor heating, radiating ceiling pan-
els, convectors). The required configurations and pa-rameter values for the systems are taken from a spread-sheed or configuration text file such as gbXML. Thenext step is the automated linking of the hot and chilledwater consumers into the corresponding water loops.Then ducts and air-based systems are linked as well asthe source code snippets that control the technical sys-tems. Figure 2 demonstrates an example workflow ofthe process. The use of Python for source code gen-eration allows great flexibility and expandability: tem-plates can be easily added for new zone equipment; theuser only needs to define heating and cooling prioritiesfor the equipment and specify how controls and air andwater-based systems have to be linked into superiorstructures such as control sequences and air or waterloops. It is the authors’ experience that the usage ofthese types of Python scripts for simulation input filegeneration simplifies the process, speeds up repetitivecode editing tasks and reduces error rates remarkably.
INPUT PARSING & INTEROPERABILITYSource input files for energy simulation tools (energymodel files) are often large and unwieldy. Many toolssuch as EnergyPlus, TRNSYS, Radiance, and ESP-rstore the model in a plain text file. This approach hasthe benefit of being able to quickly edit the model ofeven parameterize the model, as discussed in the pre-vious section. A model can contain a large of amountof information from different sources such as prod-uct catalogs, mechanical and architectural schedules,and other documents prepared by designers and con-tractors. A key task in energy modeling is convert-ing this information into the syntax of the modelingand simulation tools. Using a scripting language suchas Python allows users to avoid data entry errors andchange a task that could consume hours of copy andpasting into one that takes milliseconds. As with allscripting projects, the modeler must consider the in-
Proceedings of BS2013: 13th Conference of International Building Performance Simulation Association, Chambéry, France, August 26-28
- 212 -
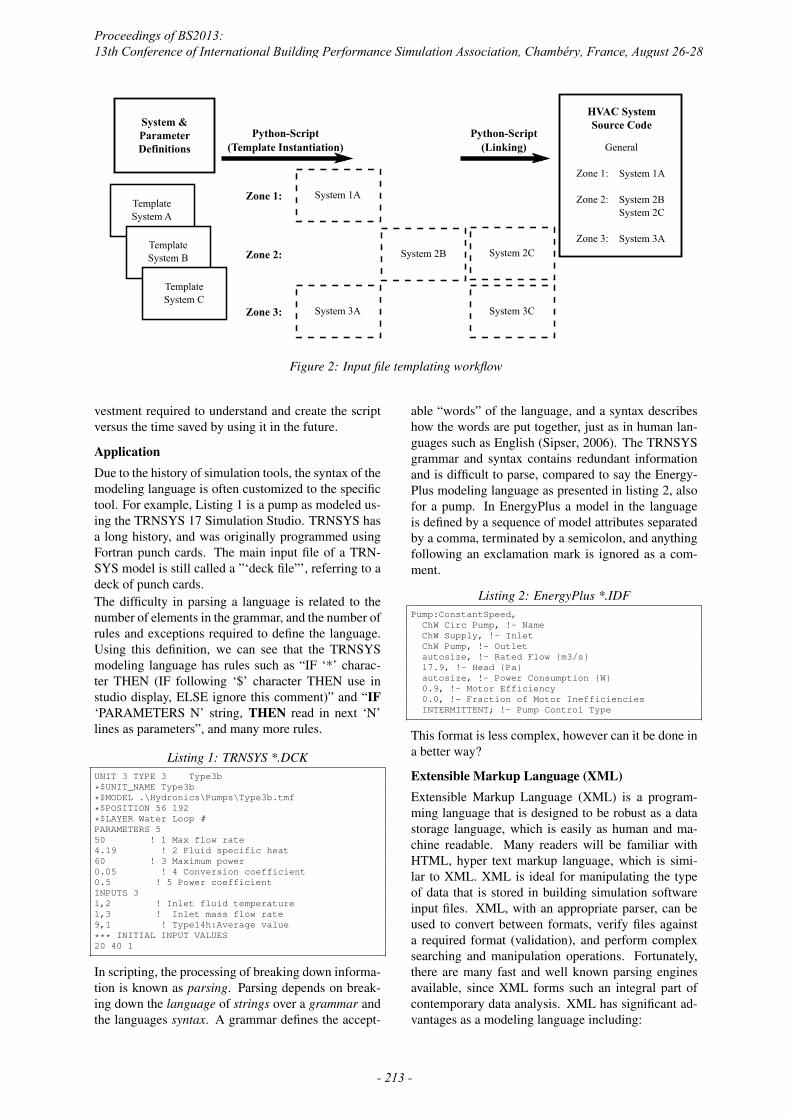
Figure 2: Input file templating workflow
vestment required to understand and create the scriptversus the time saved by using it in the future.
ApplicationDue to the history of simulation tools, the syntax of themodeling language is often customized to the specifictool. For example, Listing 1 is a pump as modeled us-ing the TRNSYS 17 Simulation Studio. TRNSYS hasa long history, and was originally programmed usingFortran punch cards. The main input file of a TRN-SYS model is still called a ”‘deck file”’, referring to adeck of punch cards.The difficulty in parsing a language is related to thenumber of elements in the grammar, and the number ofrules and exceptions required to define the language.Using this definition, we can see that the TRNSYSmodeling language has rules such as “IF ‘*’ charac-ter THEN (IF following ‘$’ character THEN use instudio display, ELSE ignore this comment)” and “IF‘PARAMETERS N’ string, THEN read in next ‘N’lines as parameters”, and many more rules.
Listing 1: TRNSYS *.DCKUNIT 3 TYPE 3 Type3b*$UNIT_NAME Type3b*$MODEL .\Hydronics\Pumps\Type3b.tmf*$POSITION 56 192*$LAYER Water Loop #PARAMETERS 550 ! 1 Max flow rate4.19 ! 2 Fluid specific heat60 ! 3 Maximum power0.05 ! 4 Conversion coefficient0.5 ! 5 Power coefficientINPUTS 31,2 ! Inlet fluid temperature1,3 ! Inlet mass flow rate9,1 ! Type14h:Average value*** INITIAL INPUT VALUES20 40 1
In scripting, the processing of breaking down informa-tion is known as parsing. Parsing depends on break-ing down the language of strings over a grammar andthe languages syntax. A grammar defines the accept-
able “words” of the language, and a syntax describeshow the words are put together, just as in human lan-guages such as English (Sipser, 2006). The TRNSYSgrammar and syntax contains redundant informationand is difficult to parse, compared to say the Energy-Plus modeling language as presented in listing 2, alsofor a pump. In EnergyPlus a model in the languageis defined by a sequence of model attributes separatedby a comma, terminated by a semicolon, and anythingfollowing an exclamation mark is ignored as a com-ment.
Listing 2: EnergyPlus *.IDFPump:ConstantSpeed,ChW Circ Pump, !- NameChW Supply, !- InletChW Pump, !- Outletautosize, !- Rated Flow {m3/s}17.9, !- Head {Pa}autosize, !- Power Consumption {W}0.9, !- Motor Efficiency0.0, !- Fraction of Motor InefficienciesINTERMITTENT; !- Pump Control Type
This format is less complex, however can it be done ina better way?
Extensible Markup Language (XML)Extensible Markup Language (XML) is a program-ming language that is designed to be robust as a datastorage language, which is easily as human and ma-chine readable. Many readers will be familiar withHTML, hyper text markup language, which is simi-lar to XML. XML is ideal for manipulating the typeof data that is stored in building simulation softwareinput files. XML, with an appropriate parser, can beused to convert between formats, verify files againsta required format (validation), and perform complexsearching and manipulation operations. Fortunately,there are many fast and well known parsing enginesavailable, since XML forms such an integral part ofcontemporary data analysis. XML has significant ad-vantages as a modeling language including:
Proceedings of BS2013: 13th Conference of International Building Performance Simulation Association, Chambéry, France, August 26-28
- 213 -
1. Validation is well supported, and could be used tocheck for values in the correct range, units, con-nections, etc.
2. Transformation into different formats is possibleusing the XSLT Stylesheet Language pipeline.
3. Analyzing a model can be achieved elegantly us-ing the XPATH query language.
These benefits also motivate the gbXML initiative(The Open Green Building XML Schema, 2012). Arepresentation of the EnergyPlus pump model, parsedinto XML, is presented in listing 3. Names have beenshortened for display purposes.
Listing 3: EnergyPlus *.XML<OBJECT>
<CLASS>Pump:ConstantSpeed</CLASS><ATTR desc="Name" units="">ChW Circ Pump</ATTR><ATTR desc="Inlet" units="">ChW Supply</ATTR><ATTR desc="Outlet" units="">ChW Pump</ATTR><ATTR desc="Flow" units="m3/s">autosize</ATTR><ATTR desc="Head" units="kPa">17.9</ATTR><ATTR desc="Power" units="W"> autosize</ATTR><ATTR desc="Efficiency" units="-">0.9</ATTR><ATTR desc="Inefficiencies" units="-">0.0</ATTR><ATTR desc="Control" units="">INTERMITTENT</ATTR>
</OBJECT>
In Python, there are many supported modules to addXML parsing, including a standard libary module thatcomes preinstalled as part of Python. In this paper, theauthors employ the ‘lxml’ module (lxml Dev Team,2013). Using the XPATH language in XML, so-phisticated queries can be constructed. Although theXPATH query syntax also requires experience to use, itcan be worth the effort if many more complex queriesare required. In listing 4, a complex operation is car-ried out on an arbitrarily large IDF/XML file using thelxml module and Python. In this code example, allPump:ConstantSpeed objects are selected whichhave INTERMITTENT control. The pump Head ischanged to 9.5 kPa for all of these objects.
Listing 4: Parsing an EnergyPlus XML filefrom lxml import etreemodel = etree.parse('ePlus_model.xml')s = "//CLASS[text()='Pump:ConstantSpeed']/.."constantPumps = model.xpath(s)for pump in constantPumps:
s = "//ATTR[@desc='Control' and " /"text()='INTERMITTENT']"
intermittent = pump.xpath(s)if intermittent:
s = "//ATTR[@desc='Head']"pumpHead = intermittentPump[0].xpath(s)pumpHead[0].text = "9.5"
In this example, the query was broken down into mul-tiple steps to illustrate the process. First the pumps areselected, then filtered for the INTERMITTENT controlattribute, and finally updating the value. However, thisquery can be executed in one step. Another applica-tion could be selecting all exterior surfaces of a certainmaterial facing due north, and updating the exteriorsolar reflectance to determine the effect of a thermalpaint. The applications are limitless, and as the user
gains familiarity with XML, utilities can be created toexpedite the creation of these queries.Using Python and XML, model data can be populated,translated, and analyzed efficiently and robustly.
PERFORMANCE CURVE REGRESSIONMost building simulation engines are considered’grey-box’ models in that they are driven by both phys-ical, equation-based as well as statistical, data-drivencalculation methods. The performance of equipmentsuch as chillers, pumps, and unitary conditioning unitsis often characterized with a performance curve equa-tion that is regresssed from manufacturer-providedperformance data. This curve is an input object to thesimulation and is an example of a data-driven com-ponent of the building simulation model. These co-efficients of these curves are often provided directlyby the manufacturer, however newer systems such asthe variable refrigerant volume (VRV) system must becalculated by the simulation user. A guide for creatingVRV performance curves for the EnergyPlus simula-tion engine is available and this section will describeimplementation using Python and its available scien-tific libraries, Scipy and Numpy.
VRV Performance Curve CalculationThe VRV performance curve guidelines describe theworkflow of extracting the 22 potentially necessaryperformance curves for simulating VRV systems inEnergyPlus (Raustad, 2012). A short, step-by-step ex-ample of regressing the VRV Cooling Capacity RatioModifier Performance Curve (CAPFT) is presented inthis section.The first step is to extract the appropriate manufacturerperformance data for the desired system simulation. Inthis example we will use data from a Daikin VRV sys-tem which was obtained from a local Daikin distrib-utor. The performance documentation is provided ina PDF format; the performance information must becopied manually or an automated PDF to CSV con-verter program may be used. A Python library knownas PDFMiner is applicable to this task. The data nec-essary for the CAPFT regression are the instantaneousCooling Capacity Ratio (CapRatio), Indoor Wet Bulb(IWB), Outdoor Dry Bulb (ODB) for each tested rat-ing condition. The CAPFT function is designed to rep-resent the change in capacity of the system as outdoorand indoor conditions vary:
Qcool,available = Qcool,rated · CAPFTHP,cooling
(1)The CAPFT weighting is calculated by a biquadraticperformance curve that utilizes zone cooling coil inletwet-bulb temperature (Twb,avg) and outdoor air dry-bulb entering the condenser (Tc):
CAPFTHP,cooling = a+ b · Twb,avg + c · (Twb,avg)2
+d · Tc + e · (Tc)2 + f · Twb,avg · Tc
(2)
Proceedings of BS2013: 13th Conference of International Building Performance Simulation Association, Chambéry, France, August 26-28
- 214 -

The performance curve coefficients (a to f ) need to beregressed from the manufacturer’s dataset.
In order to use Python to calculate coefficients, weuse the Numpy and Scipy libraries. Numpy is an ex-tension that adds support for multi-dimensional arraysand Scipy contains modules for optimization, linearalgebra, integration, interpolation, and ordinary differ-ential equation solvers in addition to many other math-ematics and scientific functions (Jones et al., 2001)Given that IWB, ODB, and CapRatio are Python listobjects containing the extracted manufacturer data,the coefficients can be regressed using the followingPython code by first loading Numpy and Scipy li-braries:
from scipy.optimize import leastsqimport numpy as np
Then Numpy arrays are formed with the raw data andan ’inital guess’ list is created for input into the LeastSquare algorithm:
npIWB = np.array(IWB)npODB = np.array(ODB)npCapRatio = np.array(CapRatio)p0=[0,0,0,0,0,0]
The Least Square regression function from the Scipyoptimization library is called and the output is aNumpy array of the regressed coefficients (CAPFT):
CAPFT = leastsq(residualsTwoDimBiquadratic,p0,args=(npCapRatio,npIWB,npODB),full_output=1)
The residualsTwoDimBiquadratic functions used as anargument in the previous code is defined as:
def residualsTwoDimBiquadratic(p,I,A,B):return (I - TwoDimBiquadratic(A,B,p))
def TwoDimBiquadratic(A,B,p):return(p[0] + p[1]*A + p[2]*A**2
+ p[3]*B + p[4]*B**2+ p[5]*A*B)
In this example, the output is a list of the fitted coeffi-cients:
[-1.53742235e+00 1.98712839e-01-3.34991139e-03 1.77684674e-02-5.67708040e-05 -9.27353971e-04]
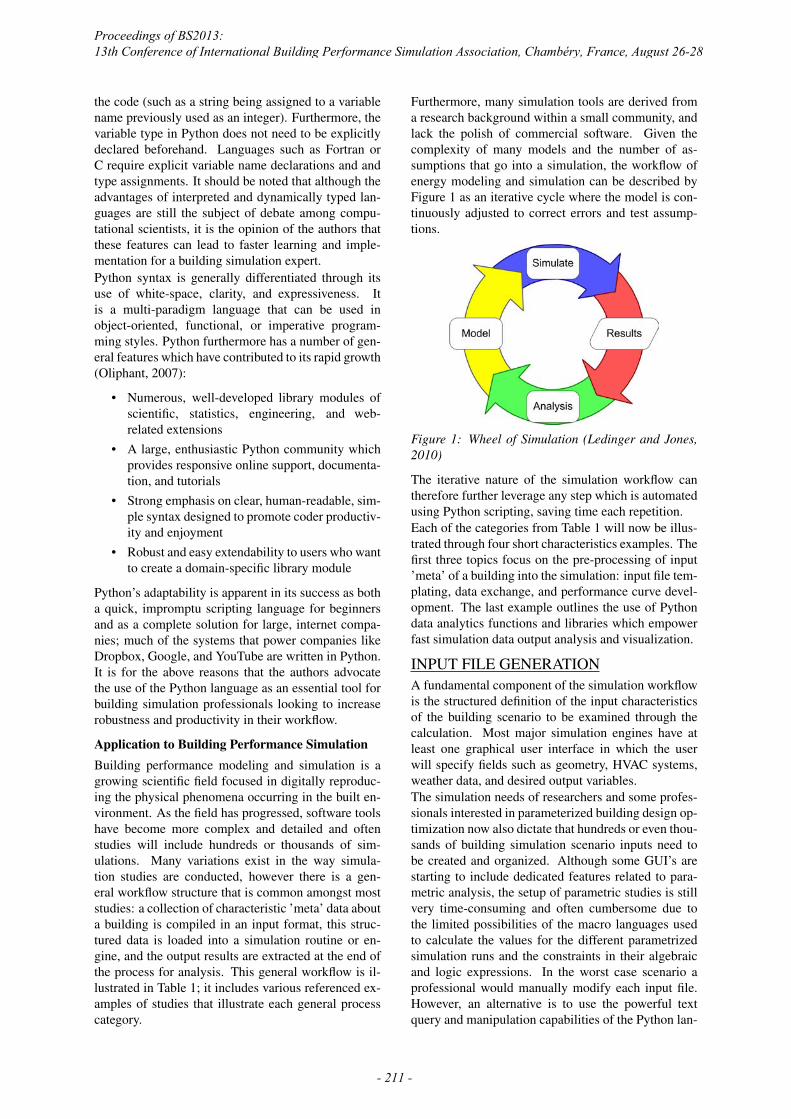
Inserting the calculated coefficients back into the bi-quadratic curve and plotting using the matplotlib li-brary gives us a scatterplot representation of the ca-pacity modifier curve as seen in Figure 3.
Figure 3: 3D Scatterplot of Capacity Modifier Func-tion
POSTPROCESSING APPLICATIONSThe amount of output data generated from a singlesimulation engine can be as little as a single wholebuilding metric to as much as a virtual sensor networkof thousands of simulated measurements down to theseconds level. Processing and utilization of this datadepends primarily on the simulation application; rat-ing systems documentation may simply need a high-level snapshot of specific metrics while more intenseresearch applications could be statistically compar-ing hundreds of simulated time-series datasets simul-taneously. This section will exemplify some simpleyet powerful data analytics and visualization functionsavailable from the Python extension known as Pandas.Pandas is a library that provides data structures andanalysis tools for data loading, preparation, and statis-tical modeling. It is especially useful for time-seriesdata manipulation and analysis (McKinney, 2012).An increasingly common simulation data processingapplication is comparison of simulated and measureddata. The following example will focus on loadingsimulation output from the EnergyPlus simulation en-gine. The first step in this example is to take a typ-ical CSV output file from an EnergyPlus simulationand load it into a Dataframe object using the Pandaslibrary and a Python list (simcolumnlabels) of the out-put fields contained in the file:
import pandas as pd
simcolumnlabels=['timestamp','oadb','solarenergytransmitted','zonemeanairtemp','idealloadsheating','idealloadscooling','idealloadsoutlettemp','zonemechventilation']
simdata = pd.read_csv('energyplusoutput.csv',header=0,names=simcolumnlabels)
Pandas includes an integrated date and time parserwhich can recognize and convert most string typetimestamps to a datetime type. However, the Energy-Plus output is in a form (ie: ’ 08/01 24:00:00’) whichis not standard and must be manually converted. The
Proceedings of BS2013: 13th Conference of International Building Performance Simulation Association, Chambéry, France, August 26-28
- 215 -
main issue is in how Energyplus represents midnightas 24:00:00 as opposed to the standard 00:00:00. Wecan customize a timestamp extraction script to acco-modate for this feature as well as to specify the year:
from datetime import datetime as dtmfrom datetime import timedelta
timestampdict={}for i,row in simdata.T.iteritems():
t = str(2012) + row['timestamp']try:timestampdict[i] = dtm.strptime(t,
'%Y %m/%d %H:%M:%S')except ValueError:tcorr = t.replace(' 24', ' 23')timestampdict[i] = dtm.strptime(tcorr,
'%Y %m/%d %H:%M:%S')timestampdict[i] += timedelta(hours=1)
timestampseries = pd.Series(timestampdict)
The new timestamp is then added to the previously cre-ated dataframe as the index and the old string times-tamp is dropped. At this point, a fully cleaned Pan-das Dataframe object has been created which can beprinted to visualize the attributes and structure of thedataset.
simdata.index = timestampseriessimdata = simdata.drop(['timestamp'],axis=1)print simdata
The output from this script is:
<class 'pandas.core.frame.DataFrame'>DatetimeIndex: 44160 entries, 2012-08-01
00:03:00 to 2012-11-01 00:00:00Data columns:oadb 44160 non-null valuessolarenergytransmitted44160 non-null valueszonemeanairtemp 44160 non-null valuesidealloadsheating 44160 non-null valuesidealloadscooling 44160 non-null valuesidealloadsoutlettemp 44160 non-null valueszonemechventilation 44160 non-null valuesdtypes: float64(7)
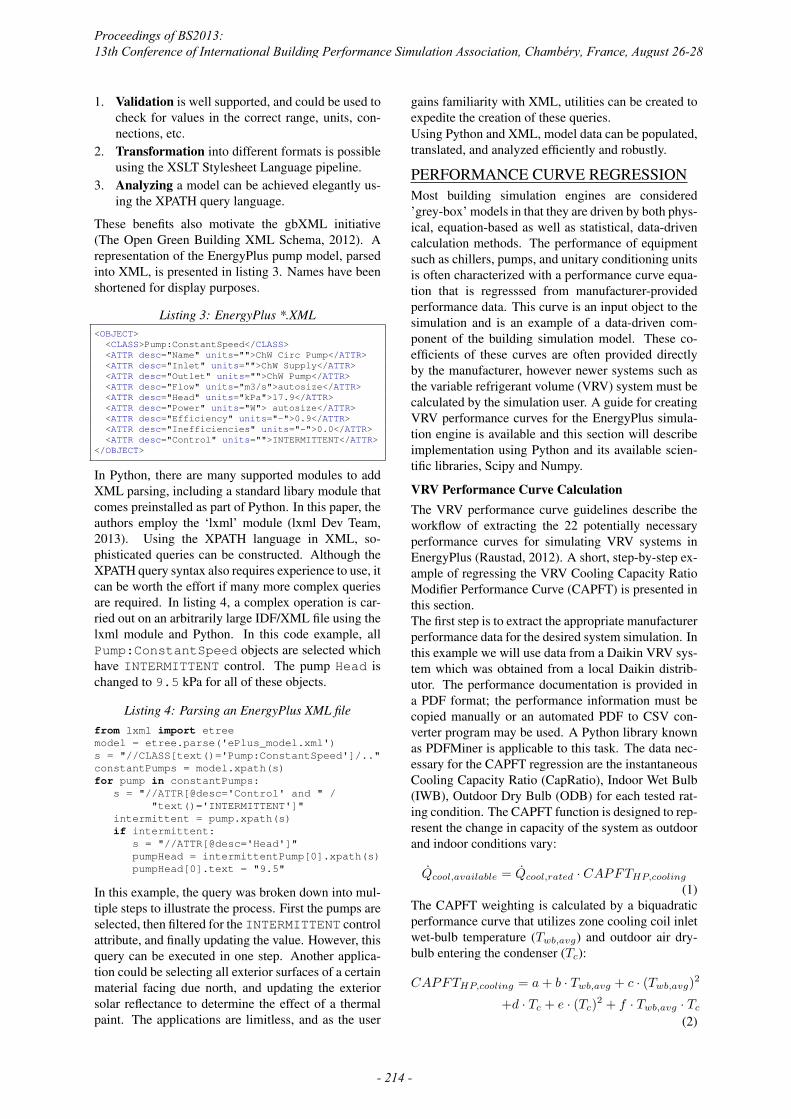
The dataset characterized by the Pandas dataframe ob-ject is now ready for various transformation functionsbased on the data analysis intent. First in terms of vi-sualization, Pandas has integrated easy use of the mat-plotlib visualization library. For example, if a quickvisualization of the transition period between heat-ing and cooling for this simulation is desired, a newdataframe is created from a truncated section of thewhole simulation and a subplot visualization is cre-ated.
transitionsimdata=simdata.truncate(before='09/15/2012', after='10/15/2012')
transitionsimdata.plot(subplots=True,figsize=(6,10))
The results of this script can be seen in Figure 4.
Figure 4: Time-series visualization of simulated data
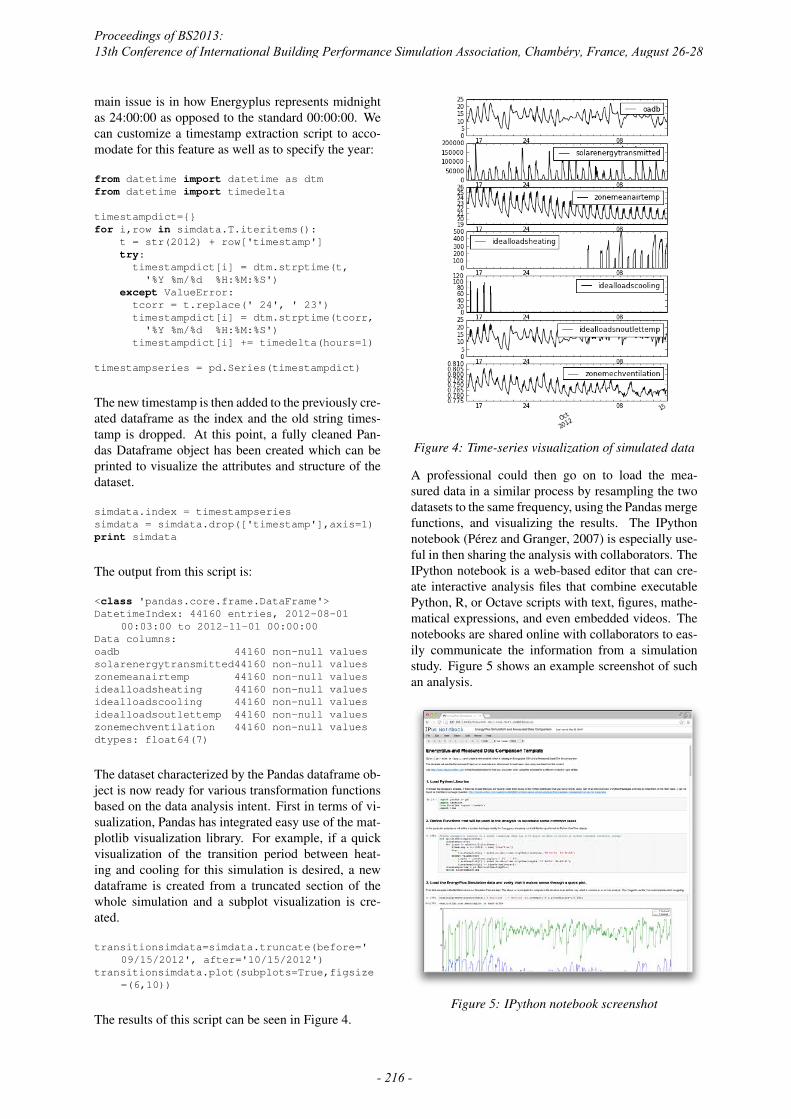
A professional could then go on to load the mea-sured data in a similar process by resampling the twodatasets to the same frequency, using the Pandas mergefunctions, and visualizing the results. The IPythonnotebook (Perez and Granger, 2007) is especially use-ful in then sharing the analysis with collaborators. TheIPython notebook is a web-based editor that can cre-ate interactive analysis files that combine executablePython, R, or Octave scripts with text, figures, mathe-matical expressions, and even embedded videos. Thenotebooks are shared online with collaborators to eas-ily communicate the information from a simulationstudy. Figure 5 shows an example screenshot of suchan analysis.
Figure 5: IPython notebook screenshot
Proceedings of BS2013: 13th Conference of International Building Performance Simulation Association, Chambéry, France, August 26-28
- 216 -
CONCLUSIONHigh level scripting languages are valuable to the ef-ficient pre and post-processing workflows of buildingperformance simulation professionals. This applica-tion paper overviews some common workflows thatcan be automated or simplified through the use of thePython. The goal of this analysis is to act as a catalystfor wider adoption of Python and similar languages bybuilding simulation professionals.
Current and Future Python Building SimulationProjectsA small but growing number of buildings-focusedPython libraries and projects are already available orin the planning stages. Table 2 illustrates the Pythonprojects known to the authors and applicable to thebuilding analysis domain.
Table 2: Building simulation Python projects
Project Name Applicationbuildingspy Modelica simulation driver and
postprocessor libraryCoolProp Fluid and air properties libraryPyBPS Parametric run simulation man-
agerPysolar Solar irradation librarypython-ifc IFC file manipulationPython-PoweredBuildings
Python tutorials and code exam-ples for building simulation
Revit PythonShell
Automation of Revit model
SimpleBuildingBeta
Simplified building simulationengine based on ISO 13790
Further ResourcesMore information on the building simulation-relatedPython projects and numerous code examples (in-cluding those presented in this paper) are madeavailable online as IPython notebooks hosted atwww.pythonpoweredbuilding.com.
ACKNOWLEDGEMENTSThe authors would like to acknowledge support fromETH Zurich and Technical University of Vienna.
REFERENCESBell, I. 2013. CoolProp: Open-Source, free
fluids property database and Python library.http://coolprop.sourceforge.net/.
Bell, I. H., Lemort, V., Groll, E. A., Braun, J. E., King,G. B., and Horton, W. T. 2012. Liquid-flooded com-pression and expansion in scroll machines. Part I:Model development. International Journal of Re-frigeration, 35(7):1878 – 1889.
Bertagnolio, S. and Andre, P. 2010. Development ofan Evidence-Based Calibration Methodology Ded-icated to Energy Audit of Office Buildings. Part 1:
Methodology and Modeling. In Proceedings of the10th REHVA World Congress - Clima 2010, Ana-talya, Turkey.
EnergyPlus 2012. EnergyPlus Manual, Version 7.2:Auxiliary EnergyPlus Programs. US Department ofEnergy.
Jones, E., Oliphant, T., Peterson, P., et al. 2001.SciPy: Open source scientific tools for Python.http://www.scipy.org/.
Jones, M. and Ledinger, S. 2010. Pushing the lim-its of simulation complexity a building energy per-formance simulation of an exhibition centre in theUAE. In Fourth National Conference of IBPSA–USA, New York City, New York.
Ledinger, S. and Jones, M. 2010. Visualization ofthermodynamics and energy performance for com-plex building system simulation. In Proceedings ofBauSIM 2010, Vienna Austria, 2010.
lxml Dev Team 2013. lxml 3.10. http://www.lxml.de/.
McKinney, W. 2012. Python for data analysis.O’Reilly Media, Incorporated.
Oliphant, T. 2007. Python for scientific computing.Computing in Science & Engineering, 9(3):10–20.
Perez, F. and Granger, B. E. 2007. IPython: a Systemfor Interactive Scientific Computing. Comput. Sci.Eng., 9(3):21–29.
Raftery, P. 2012. Energyplus hvac generator.http://www.nuigalway.ie/iruse/hvacgenerator.html.
Raftery, P. and Keane, M. 2011. Visualizing patternsin building performance data. In 12th Conference ofInternational Building Performance Simulation As-sociation, Sydney.
Raustad, R. 2012. Creating Performance Curves forVariable Refrigerant Flow Heat Pumps in Energy-Plus. Technical report, Florida Solar Energy Center.
Reddy, T. 2011. Applied Data Analysis and Modelingfor Energy Engineers and Scientists. Springer.
Schlueter, A. and Thesseling, F. 2009. Building in-formation model based energy/exergy performanceassessment in early design stages. Automation inConstruction, 18(2):153–163.
Sipser, M. 2006. Introduction to the Theory of Com-putation. Thomson.
The Open Green Building XML Schema 2012. GreenBuilding XML. http://www.gbxml.org/.
Zhou, Y., Wu, J., Wang, R., Shiochi, S., and Li, Y.2008. Simulation and experimental validation of thevariable-refrigerant-volume (VRV) air-conditioningsystem in EnergyPlus. Energy and Buildings,40(6):1041–1047.
Proceedings of BS2013: 13th Conference of International Building Performance Simulation Association, Chambéry, France, August 26-28
- 217 -