Embed Size (px)
Citation preview

Automating
Quality Assurance
Assessments
1U.S. EPA -- Region 4

Manual Prep.
For TSAs
• AQS AMP Reports– Like FRM’s (“Gold Standard”)
– Like FRM’s (slow, labor intensive)
– Most are PDF’s intended for hardcopy
– Many AMP Reports are needed for TSA
assessments
• 100’s to 1000’s of pages
2U.S. EPA -- Region 4

Semi-Automated
Prep. For TSAs
• AMP-504 -- Extract QA Data– Used for uploading QA Data to AQS
– Can be imported with Spreadsheets for
Sorting and Filtering results to identify
monitor*dates of failed checks
– Manually reconcile back to AMP-350
3U.S. EPA -- Region 4

Automated
QA Assessments
• Using the “R” scripting language
• R is “Procedural” code
– Re-enforces Consistency in Assessments
– Assessment Process is Transparent
• R is “Free”
• Leveraging work products made by NADG
(AQS Team) for SQL access to AQS tables
– End User Views
– Required to be inside EPA Firewall
4U.S. EPA -- Region 4
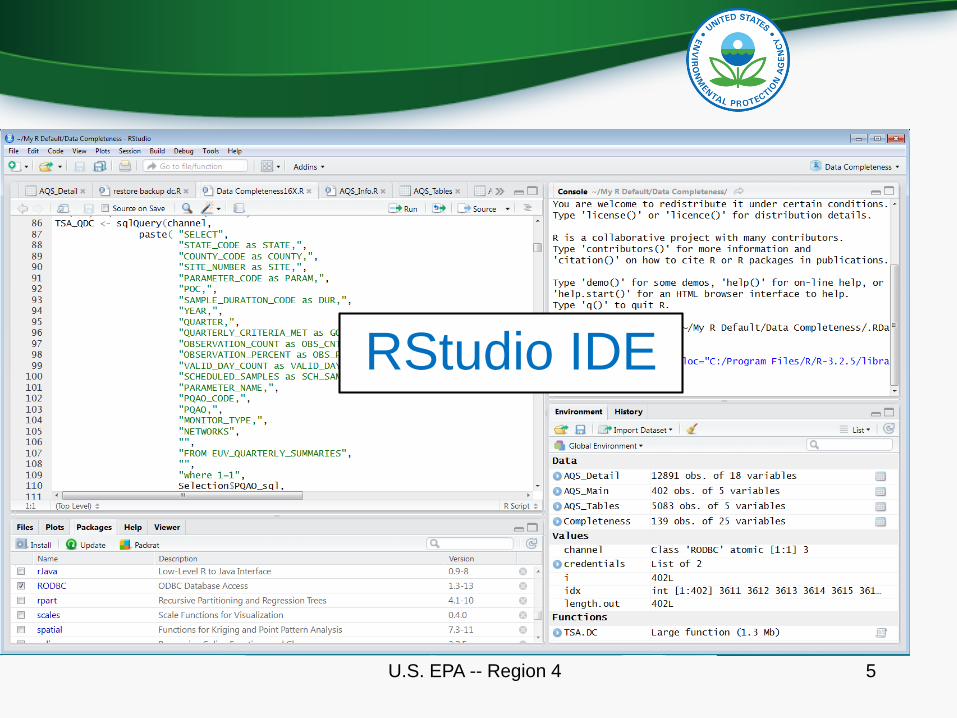
5U.S. EPA -- Region 4
RStudio IDE

6U.S. EPA -- Region 4
CONSR Scripts can be
intimidating at first
PROSEasier to Learn
than Python or VBA
R – Example Code

7U.S. EPA -- Region 4
R Script called
from Function
Using a Function
to Shield the User
from “Intimidating”
script body.
Only have to
edit once
Inputs to Function
“TSA.DC()”

8U.S. EPA -- Region 4
R dataframe
to Excel (raw)

9/28/2016 9U.S. EPA -- Region 4

10U.S. EPA -- Region 4
R -- PQAO
Network Summary
Query Date:
07-05-2016
Industrial Monitor

9/28/2016 11U.S. EPA -- Region 4
PQAO
Site
Summary

12U.S. EPA -- Region 4
Param Method Equipment
14129 192 Pb-TSP/ICP SPECTRA (ICP-MS)
42101 054 THERMO ELECTRON 48, 48C, 48i
42401 060 THERMO ELECTRON 43A, 43B, 43C
42401 100 API MODEL 100 A SO2 ANALYZER
42401 600 Teledyne API 100 EU
44201 047 THERMO ELECTRON 49
44201 053 MONITOR LABS 8810
44201 087 MODEL 400 OZONE ANALYZER
81102 079 RUPRCHT&PATSHNCK TEOM SER 1400
88101 118 R & P CO PLUS MODEL 2025PM SEQ
LEGEND
PQAO Site Summary( /w method codes)

13U.S. EPA -- Region 4
Daily RH Means
(Lab 1)
Computed from:• 150 Tab Delimited
files
• 238,425 minute
readings
Control Charting
with R

14U.S. EPA -- Region 4
Daily RH Means
(Lab 2)
Computed from:• 528 Tab Delimited
files
• 7,467,869 minute
readings
Control Charting
with R

R -- QA Assessment
Tools in Development
• Flowrate Verifications and Audits– Reconciling results with routine measurements
• 1-Pt Precision and Annual Performance Eval. Audits– Reconciling results with routine measurements
• Inspection of routine measurements for Test
Atmospheres– Time of day
– Extreme Values vs Null Data Coding
– Rate of Change
• AQS Metadata for Appendix E
• Export to ArcGIS or Google Earth KML for Site
Evaluations
15U.S. EPA -- Region 4

& enable R4 to do Quarterly QA Assessments like R1
Why Automate
QA Assessments?
Decreasing resources and increasing demands
require that we improve the efficiency and
effectiveness of data quality assessments.
Automated Data Analysis Tools:• Drive consistency in data evaluations
• Enhance the speed in performing QA assessments
• Liberate limited staffing resources for other high value
activities in TSAs
16U.S. EPA -- Region 4