Embed Size (px)
Citation preview

Automatic detection of microcalcifications in breast ultrasoundRuey-Feng Chang, Yu-Ling Hou, Chiun-Sheng Huang, Jeon-Hor Chen, Jung Min Chang, and Woo Kyung Moon
Citation: Medical Physics 40, 102901 (2013); doi: 10.1118/1.4821098 View online: http://dx.doi.org/10.1118/1.4821098 View Table of Contents: http://scitation.aip.org/content/aapm/journal/medphys/40/10?ver=pdfcov Published by the American Association of Physicists in Medicine Articles you may be interested in Ultrasound thermal ablation system and methods for treatment of breast cancer AIP Conf. Proc. 1481, 185 (2012); 10.1063/1.4757332 Development of a fully automatic scheme for detection of masses in whole breast ultrasound images Med. Phys. 34, 4378 (2007); 10.1118/1.2795825 Computerized lesion detection on breast ultrasound Med. Phys. 29, 1438 (2002); 10.1118/1.1485995 Automatic segmentation of breast lesions on ultrasound Med. Phys. 28, 1652 (2001); 10.1118/1.1386426 An algorithm for automatic needle localization in ultrasound-guided breast biopsies Med. Phys. 27, 1971 (2000); 10.1118/1.1287437

Automatic detection of microcalcifications in breast ultrasoundRuey-Feng ChangGraduate Institute of Biomedical Electronics and Bioinformatics, National Taiwan University, Taipei 10617,Taiwan and Department of Computer Science and Information Engineering, National Taiwan University,Taipei 10617, Taiwan
Yu-Ling HouGraduate Institute of Biomedical Electronics and Bioinformatics, National Taiwan University, Taipei 10617,Taiwan
Chiun-Sheng HuangDepartment of Surgery, National Taiwan University Hospital, Taipei 10617, Taiwan
Jeon-Hor ChenDepartment of Radiology, E-Da Hospital and I-Shou University, Kaohsiung 82445, Taiwan and Tu and YuenCenter for Functional Onco-Imaging and Department of Radiological Science, University of California,Irvine, California 92697
Jung Min Chang and Woo Kyung Moona)
Department of Radiology, Seoul National University Hospital, Seoul 110-744, South Korea
(Received 4 April 2013; revised 5 August 2013; accepted for publication 29 August 2013;published 17 September 2013)
Purpose: In an ultrasound (US) image, the presence of microcalcifications within breast lesions isan important indicator of malignancy. The purpose of this study was to develop a novel automaticdetection system to find microcalcifications inside a breast lesion using an US image.Methods: Breast US images from 103 cases with microcalcifications were obtained using an USsystem with a 6–14 MHz transducer, and 585 microcalcification foci marked on 103 breast US imagesby a radiologist were used as the ground truth. After segmentation of the lesion contour using the levelset method, the microcalcification candidates inside the lesion were found using adaptive specklereduction and top hat filters. Then, three criteria were used to identify the real microcalcifications,including the mean, single point, and brightness criteria.Results: The proposed method revealed microcalcifications within the lesions in all 103 cases. Thesensitivity and the false positive (FP) rate for the detection of microcalcification foci were 80.3%(470/585) and 3.1 per case, respectively. The sensitivities and FP rates for the benign and malig-nant cases were 79.2% (243/307) with a FP rate of 3.5 and 81.7% (227/278) with a FP rate of 2.6,respectively.Conclusions: The authors’ proposed method has the potential to provide a tool to help physicians de-tect microcalcifications within breast lesions. © 2013 American Association of Physicists in Medicine.[http://dx.doi.org/10.1118/1.4821098]
Key words: microcalcifications, high frequency ultrasound, breast lesion
1. INTRODUCTION
In screening mammograms, microcalcifications, which aresmall calcium deposits 0.1–1.0 mm in size, are one of thesingular signs of early stage nonpalpable breast cancer.1 Themicrocalcifications in a mammogram can be further ana-lyzed and categorized by their density, morphological appear-ance, and distribution patterns. There are several commercialcomputer-aided detection (CAD) systems to identify micro-calcifications in mammograms, and they identify over 90% ofmalignant microcalcifications.2, 3
Recently, developments in ultrasound (US) equipment andthe refinement of breast imaging techniques have enabledradiologists to better detect and describe small lesions andto provide valid and efficient US guidance for percutaneousprocedures.3, 4 The presence of microcalcifications withinbreast lesions, particularly those that are less than 0.5 mm in
size, is an important indicator of malignancy in US images.4–6
Moon et al. analyzed the detection of clustered microcalcifi-cations using mammography and high frequency US.6, 7 Theirresults showed that the microcalcifications in malignant tu-mors are more likely to be detected by US than those inbenign tumors because most malignant calcifications occurwithin the masses as opposed to within the echogenic breastparenchyma. Most benign microcalcifications are less likelyto be detected by US, especially for fibrocystic diseases.8
However, the efficacy of detecting microcalcifications in abreast US is operator dependent.9
The computerized techniques for microcalcification detec-tion on breast US have been developed to overcome inter-observer variability and to help detect microcalcifications inbreast US images. Anderson et al. proposed the results of the-oretical, simulation, and experimental studies focused on theimprovement of the US visualization of microcalcifications.10
102901-1 Med. Phys. 40 (10), October 2013 © 2013 Am. Assoc. Phys. Med. 102901-10094-2405/2013/40(10)/102901/9/$30.00

102901-2 Chang et al.: Automatic detection of microcalcifications in breast ultrasound 102901-2
Shankar et al. presented a statistical model based on theMcKay densities to detect microcalcifications.11 Recently,an automatic detection system for finding microcalcifica-tions was developed, and the software (MicroPureTM, ToshibaMedical System, Japan) was incorporated into commercialequipment with the conventional B-mode. This image mode(MicroPureTM) is based on the visualization of hyperechoicmicrocalcifications above a specific threshold. Stoeblen et al.compared the B-mode image with the MicroPureTM mode im-age for identifying and localizing breast microcalcifications.12
However, in their study only 25% (13 of 52) of microcalcifi-cations were detected.
In this paper, we propose a novel detection algorithm toautomatically find the microcalcifications inside a breast le-sion using US images. The detection performance of the pro-posed algorithm was evaluated by comparing the results tothe microcalcification foci marked on breast US images bya radiologist and proven by US-guided biopsy and specimenradiography.
2. MATERIALS
Institutional review board approval was obtained for thisstudy, and informed consent was waived for this retrospectivereview. Between May 2006 and August 2010, 103 consecutivepatients (mean age 46.3 yr; age range 24–70 yr) underwent an11-gauge vacuum-assisted US-guided breast biopsy of sus-picious microcalcifications detected by mammography. USexams were performed prior to the breast biopsy by threeradiologists, each of whom possess 5–15 yr of experienceperforming US breast examinations using an EUB-8500 USsystem (Hitachi Medical, Tokyo, Japan) and a 6–14 MHzlinear array transducer. In all cases, microcalcifications wereobserved as echogenic dots within the mass or as a dilatedduct on the US images and the retrieval was proven by spec-imen radiography obtained after US-guided biopsy. For thisstudy, we selected only one image per patient showing thelargest dimension of the calcific lesion and the 585 micro-calcification foci marked by a radiologist were used as theground truth. The radiologist had 15 yr of experience perform-ing breast US and interpreting mammography.
Specimen radiographs of core samples obtained by US-guided biopsy showed a variable number (5–200) of micro-calcifications. The microcalcifications were confirmed by thepathology results in all of the cases. There were 61 benignand 42 malignant cases. The mammographic lesion size was3–9 mm for 25 lesions, 10–19 mm for 43 lesions, 20–29 mmfor 20 lesions, 30–39 mm for 13 lesions, and 40–50 mm for2 lesions. Based on the assessment metric from the AmericanCollege of Radiology (ACR) Breast Imaging Reporting andData System (BI-RADS), suspicious abnormal lesions (cate-gory 4) were present in 64 cases and lesions that were highlysuggestive of malignancy (category 5) were present in 39cases. According to the pathology reports, the benign lesionswere associated with fibrocystic changes (including ductal hy-perplasia, sclerosing adenosis, and fibroadenomatous change)in 55 cases, papilloma lesions were present in 2 cases, andfibroadenoma lesions were present in 4 cases; the malignant
lesions included ductal carcinoma in situ (DCIS) (35 cases)and invasive ductal carcinoma (7 cases).
3. METHOD
Microcalcifications can be identified in US images as tinyareas that are slightly brighter than the surrounding tissue.Based on this characteristic, we propose a microcalcificationdetection method with three major steps, as shown in Fig. 1 Inthe first step, the lesion segmentation method with a human-defined seed point is used for precise segmentation of a sus-pected lesion region. In the second step, an adaptive specklereduction filter13 and a top hat filter14, 15 are used to reduce thespeckle and find the bright spots in the US images. Becausethe top hat filter shows all of the microcalcification candi-date spots, in the third step several criteria are used to removethe candidate spots that are not real microcalcifications.
The proposed detection method was implemented us-ing MATLAB software (MathWorks, Natick, Massachusetts,USA). The experiments were performed on a personal com-puter with an Intel Core i7 CPU 920 processor (Intel, SantaClara, CA, USA), 3 GB memory, and a Microsoft Windows 7operating system (Microsoft, Seattle, WA, USA).
3.A. Step 1: Lesion segmentation
For the purpose of supporting a more accurate diagno-sis, we proposed the segmentation method procedure shownin Fig. 2.16 The US image was preprocessed by three filters
FIG. 1. The flowchart of the proposed method for microcalcification detec-tion. Step 1 is lesion segmentation, step 2 is the reduction of speckle and theidentification of candidate spots in the US images, and step 3 is the identifi-cation of real microcalcifications from the candidate spots.
Medical Physics, Vol. 40, No. 10, October 2013

102901-3 Chang et al.: Automatic detection of microcalcifications in breast ultrasound 102901-3
FIG. 2. Illustration of lesion segmentation in a 43-year-old woman withfibrocystic change. (a) The original image. (b) The image after sigmoid fil-tering. (c) The image after sigma filtering. (d) The image after gradient mag-nitude filtering. (e) The image after a second sigmoid filtering. (f) The seg-mented lesion based on the level set algorithm overlapped on the originalB-mode image.
including a sigmoid filter,17 a sigma filter,18 and a gradi-ent magnitude filter,19 and then the fast marching level setmethod20 with a human-defined seed point was applied forlesion segmentation.
Sigmoid filtering was used to enhance the original US im-age by the following function:
I ′ = (max − min)
(1 + exp
(−I − β
α
))−1
+ min, (1)
where I and I′ are the intensities of the input and output image,respectively. The intensity range is described by its center β
and its width α. The target image range is given by the inter-val [min, max], which was set as [0, 255]. In our experiments,sigmoid filtering with α = 22 and β = 15 was used to en-hance the edges of suspected lesions. Figures 2(a) and 2(b)show the original image and the image after sigmoid filter-ing, respectively. A sigma filter was applied to the contrast-enhanced US image to remove the speckle noise, as shown inFig. 2(c). In our study, we used a sigma value of 1 to smoothan image by averaging the neighboring pixels that did not de-viate from the current pixel value by more than a given range.Then, a gradient magnitude filter was used to separate ho-mogeneous regions and to detect the object contours in thecontrast-enhanced image using the gradient ∇I(x,y) and themagnitude of the gradient mag(∇I) of the image I(x,y). These
are defined as
∇I (x, y) =[
gx
gy
]=
⎡⎢⎢⎣
∂I
∂x
∂I
∂y
⎤⎥⎥⎦ , (2)
mag(∇I ) =√
g2x + g2
y. (3)
The image after gradient magnitude filtering is shown inFig. 2(d). Finally, it was enhanced again using a sigmoid fil-ter with α = 0.1 and β = 0.1 before the gradient magnitudeimage was segmented, as shown in Fig. 2(e).
Then, the fast marching level set method20 was usedto propagate the initial human-defined seed points outwardand fine-tune the contour of the segmented lesion. �(x,t)= {ψ(x,t) = 0} is the zero level set, where ψ(x,t) is thezero level set of a higher dimensional level set function andx is a point in RN. Using a partial differential equation, thelevel set function ψ(x,t = 0) propagates the user-defined seedsγ (t = 0) as follows:
ψ(x, t = 0) = ±d, (4)
where d is the distance from x to γ (t = 0) and the sign deter-mines whether the point is inside (negative) or outside (pos-itive) the initial contour. The partial differential equation forψ is
ψ + F |∇ψ | = 0, (5)
where F with a given value of ψ(x,t = 0) supplies the speedin the outward normal direction. The final segmented lesioncontour on the original B-mode image was overlapped usingthe level set algorithm (Fig. 2(f)). After the lesion segmen-tation, the system will detect the microcalcifications that areonly within the segmented lesion.
3.B. Step 2: Adaptive speckle reduction, top hat filter,and labeling
In the US system, the coherence of the backscattered echosignals, called speckle, will increase the difficulty of the diag-nosis. Therefore, speckle reduction is an important issue forUS images. In this study, an adaptive speckle reduction filter13
based on the K-distribution mode was used for speckle statis-tics. This filter can provide the statistics of scattering mediawith arbitrary scatter densities from the unsharp masking fil-ter output Y of an unsharp masking filter for input X as givenby
Y = X̄ + c(X − X̄), (6)
c = 1 − π2
24
D̂2
V, (7)
where X̄ is the local mean, X is the input of the filter, and c isthe local statistic limited to the range [0, 1]. D̂ is an estimateof the logarithmic compression transfer function for the log-arithmic compression parameter for transferring the US echo
Medical Physics, Vol. 40, No. 10, October 2013

102901-4 Chang et al.: Automatic detection of microcalcifications in breast ultrasound 102901-4
FIG. 3. (a) The top hat filter. Pixels are divided into two groups, the central crown and the rim of the flat disk. (b) The relationship between L and H. Hi includesthe four pixels near the central pixel, and Li includes the four pixels in the four corners, which are at a distance of several pixels from the central pixel.
signal to a signal for display by
D = 20
R(Xmax − Xmin) , (8)
where Xmax and Xmin are the maximum and minimum outputvalues of the display device, and R is the input dynamic rangeof the US echo signal. V is the sample variance of the log-compressed image and can be defined as follows:
V = 1
N − 1
N∑i=1
(Xi − X̄)2. (9)
After applying a speckle reduction filter, a top hat filter isused to enhance the regions in which the inner sub-regionsare brighter than the outer sub-regions.14, 15 The top hat filterconsists of a central crown of a smaller diameter and a flat diskon the surface, as shown in Fig. 3(a). In Fig. 3(b), Hi includesthe four pixels near the central pixel and Li includes the fourpixels in the four corners, which are at a distance of severalpixels from the central pixel. In this study, the top hat filterwas designed by finding the difference between the minimumvalues of Hi and Li and is given by
Diff = min(H ) − min(L). (10)
Thus, the bright spots can be contrasted against a darkerbackground.
The microcalcifications, which are bright spots, are eas-ier to be found after applying this filter. However, not allof the candidate spots are real microcalcifications. Becausethe background is black, several boundary points will behighlighted. Figures 4(b) and 4(c) show the US image fromFig. 4(a) after the speckle reduction filter and top hat filter,respectively, have been used to filter the image. The candidatespots on the boundary of the segmented image are deleted,as shown in Fig. 4(d). In order to group the neighboring mi-crocalcification pixels into a region, the connected compo-nent algorithm19 is used. Each candidate spot is sequentiallyscanned using 4-connected labeling, and the individual prop-erties of each connected spot region are measured. Three cri-teria based on the properties of the spot regions are proposedto check the candidate spots.
3.C. Step 3: Selection of microcalcifications usingthree criteria
Three criteria are used to identify the true microcalcifica-tions from among the candidate spots: the mean, the singlepoint, and the brightness. These criteria are based on the ba-sic characteristics of the microcalcifications and the specklenoise in US images.21
3.C.1. Mean criterion
After applying the top hat filter, the bright spots will beenhanced against the darker background, including the realmicrocalcifications and the nonmicrocalcification tissues, andthe intensities of their gray-level values will be different. Thebrightness of the nonmicrocalcification tissues is higher thanthat of the darker background but lower than that of the mi-crocalcifications inside the lesion. However, it is not easy todetermine an optimal threshold for identifying real microcal-cifications because the microcalcifications do not have simi-lar gray-level values in different US images. Thus, we adopta mean value for the US images as the threshold, THmean, tofind those spots. That is, for a segmented US image with Npixels, xi, THmean is defined as
THmean = 1
N
N∑i=1
xi. (11)
When the brightness of the candidate spots is lower thanthe threshold, THmean, these candidate spots will be deleted.
3.C.2. Single point criterion
US images often contain speckle noise.22 US speckle is aconsequence of the stochastic nature of the reflectivity of ascattering medium and the coherent nature of the piezoelec-tric transducer. When these noises are filtered by the specklereduction filter and the top hat filter, the brighter spots likelybecome smaller or a single point. Hence, these single points
Medical Physics, Vol. 40, No. 10, October 2013

102901-5 Chang et al.: Automatic detection of microcalcifications in breast ultrasound 102901-5
FIG. 4. Illustration of microcalcification detection process. (a) The seg-mented lesion region in the original US image. (b) The US image after ap-plying the adaptive speckle reduction filter. (c) The US image after applyingthe top hat filter. (d) The US image after deleting the point in the side of themarked image. (e) The US image after using the mean criterion. (f) The USimage after using the single point criterion. (g) The US image after using thebrightness criterion. (h) Final detection results from CAD. (i) The US imagewith microcalcifications (arrows) marked and the lesion contour drawn by theradiologist. A tiny hyperechoic dot (arrowhead) not marked by the radiologistwas counted as a false positive. In this example, THmean = 60.4 and Nbright
= 40%.
are considered to be noise, and will be deleted from the can-didate spot group.
3.C.3. Brightness criterion
The gray-level values of microcalcifications are generallyhigher than the mean gray-level value of the US image. How-
ever, the gray-level values of nonmicrocalcification tissues arealso likely higher than the mean gray-level value. If the gray-level values of nonmicrocalcification tissues are higher thanthe mean gray-level value of the US image, they will remain inthe candidate spot group even after the above two criteria areapplied. Based on the characteristics of microcalcifications,only the brightest spots will be considered to be real micro-calcifications in this study. Thus, all of the candidate spotsare sorted by their gray-level values, and only the top Nbright
percentage of spots remains. The results after using the threecriteria are shown in Figs. 4(e)–4(h). In this example, THmean
= 60.4 and Nbright = 40%.
3.C.4. Statistical analysis
The parameters of three preprocessing filters were adjustedfor the experimental dataset in order to have better segmen-tation results. These adjusted parameters were used for allthe images. The Nbright parameter of microcalcification detec-tion was used to determine the performance on the existingdataset.
The results of the proposed CAD method were comparedwith the physician-marked microcalcifications. The true posi-tive (TP) is defined as the number of physician-marked micro-calcifications correctly detected by the proposed algorithm.The false positive (FP) is the number of spots detected by theproposed algorithm that are not marked by the physician. Thefalse negative (FN) is the number of physician-marked micro-calcifications missed by the proposed algorithm. The rate ofsensitivity is defined as TP divided by (TP + FN).
The overall performance of the microcalcification detec-tion test is demonstrated with a free-response operating char-acteristic (FROC) curve23 to show the relationship betweenTP and FP. In this study, a complete FROC curve is obtainedby changing the Nbright value.
4. EXPERIMENTAL RESULTS
Microcalcifications were found by the proposed CADmethod in all 103 cases. The detection results of Nbright
= 40% for 585 microcalcification foci in 103 cases arelisted in Table I. For the benign, malignant, and all casescollectively, the sensitivities were 79.2% (243/307), 81.7%
TABLE I. The performance of the physician and the proposed algorithm fordetecting microcalcifications in benign and malignant cases.
Detection numbera
Physician Algorithm Sensitivity (%) FP per case FN per case
Benign 307 243 79.2 3.52 1.05Malignant 278 227 81.7 2.57 1.21Total 585 470 80.3 3.14 1.12
Note: FP = false positive, FN = false negative.aThe microcalcification foci marked by an experienced radiologist and confirmedby core needle biopsy are used as the ground truth. The top brightness percent-age, Nbright, for the brightness criterion is selected to be 40% to obtain the bestperformance.
Medical Physics, Vol. 40, No. 10, October 2013
102901-6 Chang et al.: Automatic detection of microcalcifications in breast ultrasound 102901-6
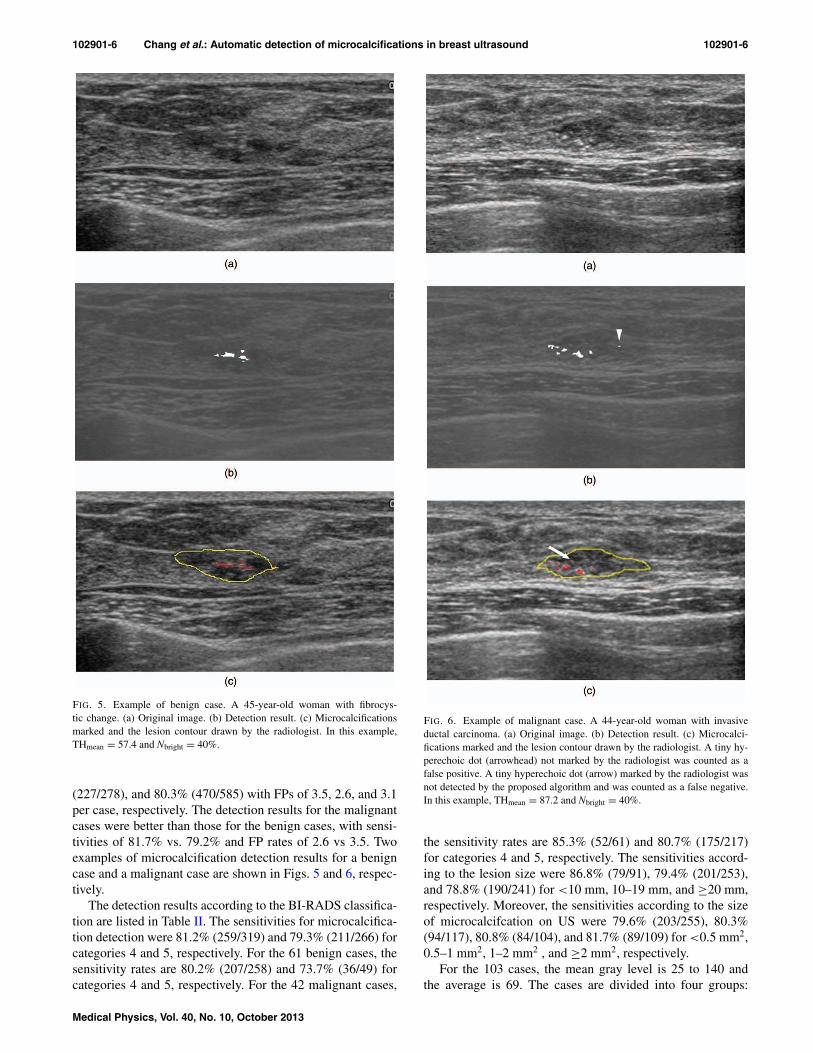
FIG. 5. Example of benign case. A 45-year-old woman with fibrocys-tic change. (a) Original image. (b) Detection result. (c) Microcalcificationsmarked and the lesion contour drawn by the radiologist. In this example,THmean = 57.4 and Nbright = 40%.
(227/278), and 80.3% (470/585) with FPs of 3.5, 2.6, and 3.1per case, respectively. The detection results for the malignantcases were better than those for the benign cases, with sensi-tivities of 81.7% vs. 79.2% and FP rates of 2.6 vs 3.5. Twoexamples of microcalcification detection results for a benigncase and a malignant case are shown in Figs. 5 and 6, respec-tively.
The detection results according to the BI-RADS classifica-tion are listed in Table II. The sensitivities for microcalcifica-tion detection were 81.2% (259/319) and 79.3% (211/266) forcategories 4 and 5, respectively. For the 61 benign cases, thesensitivity rates are 80.2% (207/258) and 73.7% (36/49) forcategories 4 and 5, respectively. For the 42 malignant cases,
FIG. 6. Example of malignant case. A 44-year-old woman with invasiveductal carcinoma. (a) Original image. (b) Detection result. (c) Microcalci-fications marked and the lesion contour drawn by the radiologist. A tiny hy-perechoic dot (arrowhead) not marked by the radiologist was counted as afalse positive. A tiny hyperechoic dot (arrow) marked by the radiologist wasnot detected by the proposed algorithm and was counted as a false negative.In this example, THmean = 87.2 and Nbright = 40%.
the sensitivity rates are 85.3% (52/61) and 80.7% (175/217)for categories 4 and 5, respectively. The sensitivities accord-ing to the lesion size were 86.8% (79/91), 79.4% (201/253),and 78.8% (190/241) for <10 mm, 10–19 mm, and ≥20 mm,respectively. Moreover, the sensitivities according to the sizeof microcalcifcation on US were 79.6% (203/255), 80.3%(94/117), 80.8% (84/104), and 81.7% (89/109) for <0.5 mm2,0.5–1 mm2, 1–2 mm2 , and ≥2 mm2, respectively.
For the 103 cases, the mean gray level is 25 to 140 andthe average is 69. The cases are divided into four groups:
Medical Physics, Vol. 40, No. 10, October 2013

102901-7 Chang et al.: Automatic detection of microcalcifications in breast ultrasound 102901-7
TABLE II. The sensitivity of the proposed algorithm for detecting microcal-cifications according to the ACR BI-RADS classification.
Sensitivity
BIARDS Category Benign Malignant Total
4 80.2% (207/258) 85.3% (52/61) 81.2% (259/319)5 73.5% (36/49) 80.7% (175/217) 79.3% (211/266)Total 79.2% (243/307) 81.7% (227/278) 80.3% (470/585)
25–53, 54–82, 83–111, and 112–140, and the results areshown in Table III. The sensitivity rate for each of thefour groups is 75.2% (103/137), 82.1% (239/291), 83.0%(117/141), and 68.7% (11/16). The sensitivity results for dif-ferent brightness percentages are shown in Table IV. Nbright isvaried from 10% to 100%, which results in sensitivities from48.7% (285/585) to 87.4% (511/585) with FP rates from 0.29to 14.4. The FROC curves for benign, malignant, and all casescollectively are shown in Fig. 7. The FROC curve is generatedwith different brightness percentages, Nbright. To obtain thebest performance, the highest percentage of Nbright was foundto be 40%.
To understand the effects of the three criteria, the sensi-tivity rates of seven combinations are shown in Table V. Thesensitivity rates using only one criterion are 92.0% (528/585),88.9% (520/585), and 90.6% (530/585) with FP rates of 29.3,31.0, 19.1 for the mean criteria, single point criteria, andbrightness criteria, respectively. When two criteria are used,the sensitivity rates are 87.4% (511/585), 85.6% (501/585),and 85.5% (500/586) with FP rates of 14.4, 8.1, and 8.7.When all three criteria are used, the sensitivity rate is 80.3%(470/585) with a FP rate of 3.1.
5. DISCUSSION
Breast US is more widely used for the evaluation of mi-crocalcifications with or without associated mass detected bymammography. Microcalcifications are one of the singularsigns of early stage nonpalpable breast cancer. Therefore, toidentify the suspicious microcalcifications with US is impor-tant for the diagnosis of breast cancer and in locating the area
TABLE III. The sensitivity of the proposed algorithm for detecting mi-crocalcifications according to the different gray level intervals for lesionsegmentation.
Sensitivity
Gray level range Benign Malignant Total
25–53 20 cases 6 cases 26 cases78.1% (64/82) 70.9% (39/55) 75.2% (103/137)
54–82 29 cases 21 cases 50 cases80.7% (121/150) 83.7% (118/141) 82.1% (239/291)
83–111 10 cases 15 cases 25 cases79.7% (47/59) 85.4% (70/82) 83.0% (117/141)
112–140 2 cases 0 cases 2 cases68.8% (11/16) – 68.8% (11/16)
TABLE IV. The sensitivity and FP rate of the proposed algorithm for detect-ing microcalcifications using different brightness percentages, Nbright.
Nbright (%) Sensitivity FP rate
10 48.7% (285/585) 0.2920 65.3% (382/585) 0.7330 76.6% (448/585) 1.5040a 80.3% (470/585) 3.1450 82.4% (482/585) 4.7760 84.8% (496/585) 6.9570 86.8% (508/585) 8.9780 87.2% (510/585) 11.06100 87.4% (511/585) 14.44
aWe selected 40% as the threshold values according to performance indices.
of concern in US-guided biopsy. Microcalcification retrievalis a criterion for the success of the US-guided biopsy of cal-cific lesions in the breast.9 Therefore, this study focused onthe detection of microcalcifications within the breast lesionson US images and we proposed a novel detection algorithmto automatically identify microcalcifications inside a breastlesion using US images. After the segmentation of the lesion,an adaptive speckle reduction filter and a top hat filter wereused to identify microcalcification candidates. Then, the realmicrocalcifications were selected from the candidates usingthree criteria: the mean, single point, and brightness crite-ria. The detection performance of the proposed algorithm wasgood, achieving a sensitivity of over 80% for microcalcifica-tions. Furthermore, the detection results for malignant caseswere better than those for benign cases, exhibiting a sensi-tivity of 81.7% and a FP rate of 2.6 as compared to 79.2%and 3.5, respectively, for the benign cases. The interestingfinding is that the performance of the computer system wassimilar when the results were stratified by microcalcificationsize. Our results agree with previous reports that showed thatthe majority of malignant microcalcifications can be identi-fied through breast US because they exist in the hypoechoicbackground of the lesion.7 If the microcalcifications are not
FIG. 7. The FROC curve of the proposed detection algorithm.
Medical Physics, Vol. 40, No. 10, October 2013

102901-8 Chang et al.: Automatic detection of microcalcifications in breast ultrasound 102901-8
TABLE V. The performance of the proposed algorithm for detecting micro-calcifications using different combinations of the criteria.
Criterion Sensitivity FP per case
M 92.0% (538/585) 29.31S 88.9% (520/585) 30.97B 90.6% (530/585) 19.1M+S 87.4% (511/585) 14.43M+B 85.6% (501/585) 8.06S+B 85.5% (500/585) 8.66M+S+B 80.3% (470/585) 3.14
Note: M: mean criterion, S: single point criterion, B: brightness criterion.
within the tumor, however, they are difficult to be detecteddue to the speckle noise in the US image.
With our algorithm, the contrast of the bright spots withthe darker background will be enhanced by the top hat filter,and the gray levels of the lesion will affect the detection per-formance. If the brightness of the US image increases or de-creases, the gray-level values of the microcalcifications willalso become brighter or darker, respectively. Therefore, thetop hat filter will not be effective because the gray level val-ues of the microcalcifications and the background image aretoo close. In the experiments, the average of the gray levels is69 for 103 cases, and the results show that the detection per-formance is not good in brighter (112–140) or darker (25–33)images. Choosing a proper Nbright is thus a trade-off betweenthe sensitivity and the FP rate. In our experiments, Nbright
= 40% has the best sensitivity of 80.3% and a lower FP rate of3.1 per case. In addition, nonmicrocalcifications removed us-ing a single criterion are analyzed to prove the criterion abil-ity of detecting microcalcifications. According to the exper-imental results, the mean criterion achieved the highest sen-sitivity rate, but the brightness criterion achieved the lowestFP rate. When two criteria are used, the brightness criterioncan help reduce the FP rate while maintaining a good sensi-tivity rate. Combined with the brightness criterion, the meancriterion and the single point criterion provide similar perfor-mance. Without the brightness criterion, the FP will be higher.However, using all three criteria results in the lowest FP ratewith a lower sensitivity rate.
There are several limitations in this study. First, the qualityof the US images will be affected by the speckle noise and ar-tifacts, and the lesion segmentation technique will also causeredundancy or tiny candidate spots. Second, the microcalcifi-cations marked by the physician are used as the ground truth.Some microcalcifications might not be marked by the physi-cian, and some marked microcalcifications might not actuallybe microcalcifications. Thus, the sensitivity and FP rate willbe affected. Third, we did not use a separate dataset to selectthe parameters for image processing and computer detection.In addition, the only one Nbright parameter of microcalcifica-tion detection was used to obtain the FROC curve and decidethe performance on the existing dataset. Hence, these parame-ters might be adjusted for other different US systems. Finally,we did not compare the performance of our system with com-mercial software (MicroPureTM).
6. CONCLUSIONS
In conclusion, we developed a novel automatic detectionsystem to identify microcalcifications inside a breast lesionusing US images. The proposed method has the potential toprovide a tool to help physicians detect microcalcificationswithin breast lesions with US and locate the area of concernin US-guided biopsy.
ACKNOWLEDGMENTS
The authors thank the National Science Council (NSC99-2221-E-002-136-MY3), the Ministry of Economic Af-fairs (101-EC-17-A-19-S1-164), and the Ministry of Educa-tion (AE-00-00-06) of the Republic of China for the finan-cial support. This work was also supported by grants from theNational R&D Program for Cancer Control (A01185), theInnovative Research Institute for Cell Therapy (A062260),Ministry of Health & Welfare, and by the National ResearchFoundation of Korea (NRF) grant funded by the Korea gov-ernment (MEST) (Grant No. 2012R1A2A1A01010846).
a)Author to whom correspondence should be addressed. Electronic mail:[email protected]; Telephone: +82-2-2072-3928.
1L. W. Bassett, “Mammographic analysis of calcifications,” Radiol. Clin.North Am. 30, 93–105 (1992).
2S. K. Yang, W. K. Moon, N. Cho, J. S. Park, J. H. Cha, S. M. Kim, S. J. Kim,and J. G. Im, “Screening mammography-detected cancers: Sensitivity ofa computer-aided detection system applied to full-field digital mammo-grams,” Radiology 244, 104–111 (2007).
3E. B. Mendelson, J. K. Baum, W. A. Berg, C. R. B. Merritt, and E. Rubin,Breast Imaging Reporting and Data System, BI-RADS: Ultrasound (Amer-ican College of Radiology, Reston, VA, 2003).
4M. S. Soo, J. A. Baker, and E. L. Rosen, “Sonographic detection andsonographically guided biopsy of breast microcalcifications,” AJR, Am.J. Roentgenol. 180, 941–948 (2003).
5W. K. Moon, J. S. Myung, Y. J. Lee, I. A. Park, D. Y. Noh, andJ. G. Im, “US of ductal carcinoma in situ,” Radiographics 22, 269–280(2002).
6N. Cho, W. K. Moon, J. H. Cha, S. M. Kim, M. J. Jang, J. M. Chang, andS. Y. Chung, “Ultrasound-guided vacuum-assisted biopsy of microcalcifi-cations detected at screening mammography,” Acta Radiol. 50, 602–609(2009).
7W. K. Moon, J. G. Im, Y. H. Koh, D. Y. Noh, and A. Park, “US of mammo-graphically detected clustered microcalcifications,” Radiology 217, 849–854 (2000).
8T. Nagashima, H. Hashimoto, K. Oshida, S. Nakano, N. Tanabe, T. Nikaido,K. Koda, and M. Miyazaki, “Ultrasound demonstration of mammographi-cally detected microcalcifications in patients with ductal carcinoma in situof the breast,” Breast Cancer 12, 216–220 (2005).
9N. Cho, W. K. Moon, J. M. Chang, S. H. Park, C. Y. Lyou, and I. A. Park,“Ultrasonography-guided vacuum-assisted biopsy of microcalcifications:Comparison of the diagnostic yield of calcified cores and non-calcifiedcores on specimen radiographs,” Acta Radiol. 51, 123–127 (2010).
10M. E. Anderson, M. S. Soo, R. C. Bentley, and G. E. Trahey, “The detectionof breast microcalcifications with medical ultrasound,” J. Acoust. Soc. Am.101, 29–39 (1997).
11P. Shankar, “A statistical model for the ultrasonic backscattered echo fromtissue containing microcalcifications,” IEEE Trans. Ultrason. Ferroelectr.Freq. Control 60, 932–942 (2013).
12F. Stoblen, S. Landt, R. Ishaq, R. Stelkens-Gebhardt, M. Rezai, P. Skaane,J. U. Blohmer, J. Sehouli, and S. Kummel, “High-frequency breast ultra-sound for the detection of microcalcifications and associated masses in BI-RADS 4a patients,” Anticancer Res. 31, 2575–2581 (2011).
13V. Dutt and J. F. Greenleaf, “Adaptive speckle reduction filter for log-compressed B-scan images,” IEEE T. Med. Imaging 15, 802–813 (1996).
Medical Physics, Vol. 40, No. 10, October 2013

102901-9 Chang et al.: Automatic detection of microcalcifications in breast ultrasound 102901-9
14J. C. Russ, The Image Processing Handbook, 4th ed. (CRC Press, BocaRaton, 1999).
15D. S. Bright and E. B. Steel, “Two-dimensional top hat filter for extractingspots and spheres from digital images,” J. Microsc.-Oxford 146, 191–200(1987).
16W. M. Moon, S. C. Chang, C. S. Huang, and R. F. Chang, “Breast tumorclassification using fuzzy clustering for breast elastography,” UltrasoundMed. Biol. 37, 700–708 (2011).
17J. M. Thijssen, B. J. Oosterveld, and R. F. Wagner, “Gray level trans-forms and lesion detectability in echographic images,” Ultrason. Imaging10, 171–195 (1988).
18J. S. Lee, “Digital image smoothing and the sigma filter,” Comput. Vis.Graph. 24, 255–269 (1983).
19R. C. González and R. E. Woods, Digital Image Processing, 2nd ed.(Pearson/Prentice Hall, Upper Saddle River, NJ, 2009).
20J. A. Sethian, Level Set Methods and Fast Marching Methods: EvolvingInterfaces in Computational Geometry, Fluid Mechanics, Computer Vision,and Materials Science (Cambridge University Press, Cambridge, 1999).
21A. T. Stavros, C. L. Rapp, and S. H. Parker, Breast Ultrasound (Lippin-cott/Williams & Wilkins, 2004).
22R. F. Chang, W. J. Wu, W. K. Moon, and D. R. Chen, “Improvementin breast tumor discrimination by support vector machines and speckle-emphasis texture analysis,” Ultrasound Med. Biol. 29, 679–686 (2003).
23D. Chakraborty, “Statistical power in observer-performance studies: Com-parison of the receiver operating characteristic and free-response methodsin tasks involving localization,” Acad. Radiol. 9, 147–156 (2002).
Medical Physics, Vol. 40, No. 10, October 2013