Embed Size (px)
Citation preview
“main” — 2012/8/24 — 12:40 — page 103 — #1
Revista Brasileira de Geofısica (2012) 30(1): 103-110© 2012 Sociedade Brasileira de GeofısicaISSN 0102-261Xwww.scielo.br/rbg
AUTOMATIC DETECTION METHOD OF CORONAL MASS EJECTIONBY DIGITAL IMAGE ANALYSIS
Nivaor Rodolfo Rigozo
Recebido em 10 setembro, 2010 / Aceito em 8 maio, 2012Received on September 10, 2010 / Accepted on May 8, 2012
ABSTRACT. This paper intends to present and validate a new automated methodology to detect coronal mass ejections (CME) and determine its dynamics, using
digital image processing. This methodology allows determining the CME radial and lateral expansion dynamics. The CME dynamics is determined by selecting a radial
direction in a given LASCO image, which starts just before the occulter and extends to the extremity of the image. By taking a series of images, extracting the same radial
direction from them and placing them side by side, it is possible to obtain a time history of any moving feature along this direction. This technique allows to choose the
number of directions that will be used in CMEs detecting, i.e., in determining their dynamics.
Keywords: coronal mass ejection, CME dynamics, digital image processing.
RESUMO. O objetivo deste trabalho e apresentar e validar uma nova metodologia para detectar automaticamente as ejecoes de massas coronais (EMCs) e determinar
a sua dinamica, usando o processamento digital de imagens. Esta metodologia permite determinar a dinamica radial e de expansao lateral das EMCs. A dinamica
das EMCs e determinada pela selecao de uma direcao radial nas imagens do telescopio LASCO, iniciando no centro do ocultador (occulter ) e estendendo-se ate a
extremidade da imagem. Se tomarmos uma serie de imagens e extrairmos delas a mesma direcao radial e possıvel obter a historia temporal de qualquer caracterıstica
em movimento ao longo desta direcao. Esta tecnica permite escolher o numero de direcoes que se pode usar na deteccao das EMCs, ou seja, na determinacao de suas
caracterısticas dinamicas.
Palavras-chave: ejecoes de massas coronais, dinamica das EMCs, processamento digital de imagens.
Centro Regional Sul de Pesquisas Espaciais (CRS/INPE), 97105-970 Santa Maria, RS, Brazil. Phone: +55(55) 3301-2025; Fax: +55(55) 3301-2030
– E-mail: [email protected]

“main” — 2012/8/24 — 12:40 — page 104 — #2
104 AUTOMATIC DETECTION METHOD OF CORONAL MASS EJECTION BY DIGITAL IMAGE ANALYSIS
INTRODUCTION
CME are solar plasma explosions from the Sun’s gravitationalfield observed in the corona (Hundhausen et al., 1984; Schwenn,1996; Hundhausen, 1997). These observations are made by in-struments called coronagraphs that register the photospheric ra-diation (or White Light) spread by electrons in the coronal ionizedplasma (Brueckner et al., 1995). By following a timeline sequenceof these observations is possible to identify these coronal out-flows. One of the coronagraphs in operation is the experimentLarge Angle and Spectroscopic Coronagraph (LASCO) locatedin the satellite Solar and Heliospheric Observatory (SOHO) thatis a joint project carried by the National Aeronautics and SpaceAdministration (NASA) and the European Space Agency (ESA).LASCO tracks the solar coronal dynamics and observations aremade by two coronagraphs called C2 and C3 through corona im-ages from 2-6 and 4-32 solar rays, respectively. When a CMEoccurs towards the satellite sight line (Sun-Earth path), it appearsas a halo structure expanding to all directions, and this is called“CME halo” (Howard et al., 1982).
One of the difficulties faced by the scientific communitiesis to quantify the observations provided by LASCO images. Asa result, techniques were developed to study LASCO images,such as the ones presented by Sheeley et al. (1999) and by DalLago et al. (2003a, 2004) to determine CME dynamics. Theseauthors report events with acceleration and deceleration. Theacceleration process is closely related to CME formation, whilethe deceleration is probably related to the CME interaction withthe environment ahead, therefore is very important to find out atwhat distance from the Sun, these processes occur (Dal Lago etal., 2004).
The purpose of this article is to present and validate a newautomatic methodology to detect the CME and determine its dy-namics (radial and lateral expansion) through digital image pro-cessing. To demonstrate its efficiency, the technique was appliedin four CME events – on September 28, 1997, February 2, 2001,March 1, 2002 and December 2, 2003 – to quantify these im-ages. This technique presents some similarity to those presentedby Sheeley et al. (1999) and Dal Lago et al. (2003a, 2004),however, some fundamental differences do exist: 1 – The newCME dynamics detection method is automatic, while the tech-nique presented by Sheeley et al. (1999) and Dal Lago et al.(2003a, 2004) is done manually. 2 – Another great advantage ofthis technique, in relation to the other ones, is that it determinesthe lateral expansion dynamics. As a function of this, determi-nation of CME dynamics is carried out for all directions wherethe CME events present lateral expansion.
METHODOLOGY
A new Digital Image Processing technique was created based onthose aspects presented by Sheeley et al. (1999) and Dal Lago etal. (2003a, 2004). However, a few differences still exist betweenthem. The technique presented by Sheeley et al. (1999) consistsof selecting one rectangular radial slice in one given LASCO im-age, that begins just before the occulter disk and extends to theimage extremity. By taking a series of images and extracting thesame rectangle (same position) for each one of them and placingthem side by side, it is possible to have a timeline history of anycharacteristic that have dislocated in the interior of such rectangle.These authors utilize the subtraction of images for their analysis,meaning that each image was subtracted from the previous one.Additionally, some corrections of radial intensity were applied, inorder to make visible the characteristics at great Sun’s distances.Please refer to Sheeley et al. (1999) article to find more detailsabout the referred technique.
Dal Lago et al. (2003a, 2004) technique consists of divid-ing each LASCO image in angular sectors, not rectangular. Eachsector begins in the center of the image, with an aperture angleof 5 degrees. In this way, the area covered by each one of theseslices is widened with the solar rays. In this sequence, concen-tric circles, centered in the center of the image, were placed in thesame figure, each one of them with a ray 2 pixels bigger than theother. The slices intersection with the circles, define small areas,and their sizes get bigger with the radial distance from the cen-ter. Adding all the pixel values within an area, is the equivalent toaccomplish one angular integration. “If in a sequence of images,of the same kind, same spatial resolution, were selected the same“pieces” or “parts” and the same parts are displayed side by side,one would have the dynamic characteristic of the phenomenonwithin the observed region”. This allows to produce one height-time diagram for each angular position and obtain a height-timedispersion graphic.
The technique employed in this work, consists of dividingeach LASCO image in punctual angular directions, and not inrectangular or angular sector, each direction begins in the cen-ter of the image. The angular distance between two directions (orangular aperture) is defined by us. This is a great advantage overthe other methods, once it permits me to control the angular res-olution between the directions.
If we take a sequence of images and select the same pointfor each one of them, and put them side by side, one has a time-line history of the characteristics that dislocate inside this point.In this way it is possible to produce one height-time diagramfor each angular position and obtain one graphic of height-timedispersion. This process is illustrated in Figure 1.
Revista Brasileira de Geofısica, Vol. 30(1), 2012

“main” — 2012/8/24 — 12:40 — page 105 — #3
RIGOZO NR 105
Figure 1 – Illustration of the technique used for image analysis.
Figure 2 – CME radial position in the T1 and T2 times.
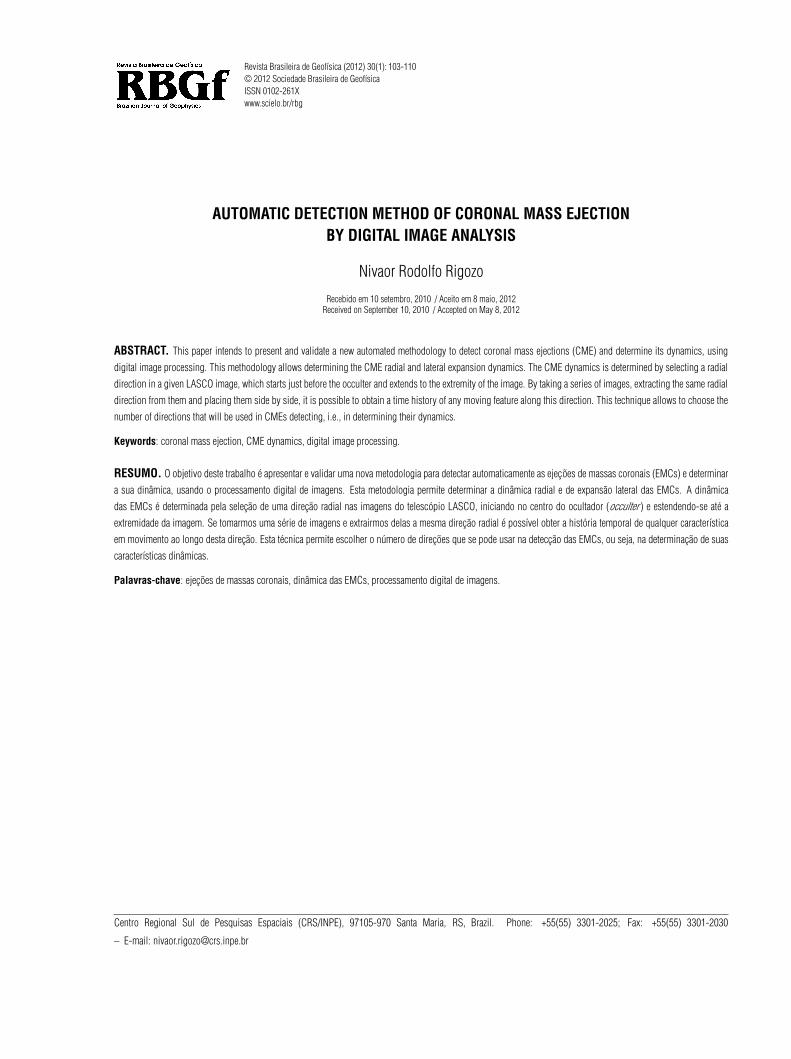
Figure 2 illustrates one example of CME punctual evolu-tion, along the time, for the 180◦ angular direction. By subtractingthe positions P2 from P1, the radial distance (D) traveled by CMEin this direction is determined.
Figure 3 shows the positions occupied by CME, in the 180◦
direction, in time. The time (T) is obtained from the CME imageacquisition through LASCO C3. Therefore, the determination ofthe traveled distance and spent time permits to determine the CME
Brazilian Journal of Geophysics, Vol. 30(1), 2012
“main” — 2012/8/24 — 12:40 — page 106 — #4
106 AUTOMATIC DETECTION METHOD OF CORONAL MASS EJECTION BY DIGITAL IMAGE ANALYSIS
radial velocity (V) for the 180◦ angle.The first (pre-event) image is utilized as a reference (back-
ground), all other images are subtracted by the first image beforebeing analyzed. This permits to visualize, clearly, the occurrenceof the CME events in the images.
Figure 3 – Position and radial speed of the CME, in time, for the direction of the180◦ angle.
RESULTS
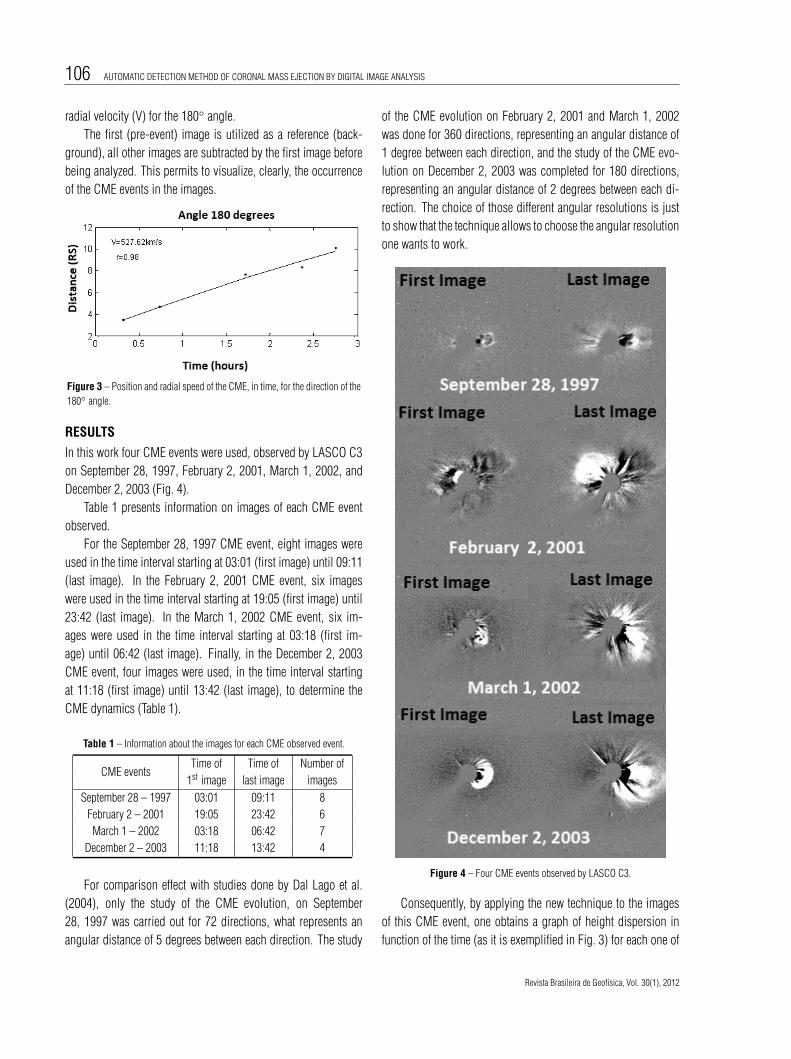
In this work four CME events were used, observed by LASCO C3on September 28, 1997, February 2, 2001, March 1, 2002, andDecember 2, 2003 (Fig. 4).
Table 1 presents information on images of each CME eventobserved.
For the September 28, 1997 CME event, eight images wereused in the time interval starting at 03:01 (first image) until 09:11(last image). In the February 2, 2001 CME event, six imageswere used in the time interval starting at 19:05 (first image) until23:42 (last image). In the March 1, 2002 CME event, six im-ages were used in the time interval starting at 03:18 (first im-age) until 06:42 (last image). Finally, in the December 2, 2003CME event, four images were used, in the time interval startingat 11:18 (first image) until 13:42 (last image), to determine theCME dynamics (Table 1).
Table 1 – Information about the images for each CME observed event.
CME eventsTime of Time of Number of
1st image last image images
September 28 – 1997 03:01 09:11 8
February 2 – 2001 19:05 23:42 6
March 1 – 2002 03:18 06:42 7
December 2 – 2003 11:18 13:42 4
For comparison effect with studies done by Dal Lago et al.(2004), only the study of the CME evolution, on September28, 1997 was carried out for 72 directions, what represents anangular distance of 5 degrees between each direction. The study
of the CME evolution on February 2, 2001 and March 1, 2002was done for 360 directions, representing an angular distance of1 degree between each direction, and the study of the CME evo-lution on December 2, 2003 was completed for 180 directions,representing an angular distance of 2 degrees between each di-rection. The choice of those different angular resolutions is justto show that the technique allows to choose the angular resolutionone wants to work.
Figure 4 – Four CME events observed by LASCO C3.
Consequently, by applying the new technique to the imagesof this CME event, one obtains a graph of height dispersion infunction of the time (as it is exemplified in Fig. 3) for each one of
Revista Brasileira de Geofısica, Vol. 30(1), 2012

“main” — 2012/8/24 — 12:40 — page 107 — #5
RIGOZO NR 107
Figure 5 – Radial speed in function of the angle for the CME events on the following days: (A) September 28 (1997), (B) February 2 (2001), (C) March 1 (2002)and (D) December 2 (2003). It is possible to visualize the CME higher speed direction (shown with dotted lines).
the directions, where the “x” axis is the time (hours) and the “y”axis is the radial distance from the center of the Sun (solar rays).The linear adjustment (first order) is used to determine the speedfor each position, curve presented in Figure 3. For determiningthe acceleration, for each position, a second order adjustment isimplemented.
The results of the analysis are presented in Figure 5, wherethe average speeds are plotted as a function of the angle. Forthe September 28, 1997 event (Fig. 5A), the highest averagespeed, of 352.4±59.3 km/s, was found for the direction of 75 de-grees and it was observed that the CME acceleration was of10.8±4.3 m/s2. In the event of February 2, 2001 (Fig. 5B) thehighest average speed of 738.4±93.9 km/s, was found for thedirection of 49◦, occurring a CME deceleration of –6.3±2.2 m/s.In the March 1, 2002 event (Fig. 5C), the highest average speed of759.4±121.6 km/s, was found for the direction of 241◦ and it wasobserved that occurred a CME deceleration of –28.9±8.5 m/s2.Finally, during the December 2, 2003 event (Fig. 5D), the highestaverage speed of 1,265.2±234.3 km/s, was detected for the 266◦
direction, and there was a CME acceleration of 20.3±9.4 m/s2.
DISCUSSION
The height × time diagrams of the CME events for September28 (1997), February 2 (2001), March 1 (2002), and December2 (2003) were obtained using such an image processing tech-nique that allowed us to follow the radial movements of thoseCME events. The graphs of height dispersion in function of thetime, obtained from those diagrams, were well adjusted by a sec-ond order polynomial curve, confirming the acceleration and de-celeration in those directions.
Dal Lago et al. (2003a) found a radial speed of 416 km/s andan acceleration of 11.6 m/s2 for the 25◦ direction, in the CMEevent of September 28 (1997). However, the SOHO LASCO CMEcatalog (CDAW) (http://cdaw.gsfc.nasa.gov/CME list/) presents aradial speed of 359 km/s and an acceleration of 2.8 m/s2 for the89◦ direction. While, in this work, it was found a radial speed of352.4 km/s and an acceleration of 10.8 m/s2 for the 75◦ direc-tion. The average speeds found here were closer to those of theSOHO LASCO CME catalog than the results found by Dal Lagoet al. (2003a). The found speed difference was of approximately2% in relation to the CDAW, while the one from Dal Lago et al.
Brazilian Journal of Geophysics, Vol. 30(1), 2012

“main” — 2012/8/24 — 12:40 — page 108 — #6
108 AUTOMATIC DETECTION METHOD OF CORONAL MASS EJECTION BY DIGITAL IMAGE ANALYSIS
(2003a) was of 16%. However, the acceleration was an overesti-mate in relation to the CDAW by the two employed methods. ThisCME was on the front side and it produced a shock wave in theinterplanetary medium, that reached the Earth 71 hours later, onOctober 1 (1997). On that same day, the ejection that followedsuch shock wave caused an intense geomagnetic storm that af-fected the Earth, with a Dst index of –98 nT (Dal Lago et al.,2003a).
CDAW presents a radial speed of 639 km/s and an accelera-tion of –6.2 m/s2 for the 86◦ direction for the CME event of Febru-ary 2 (2001). During this work, it was found a radial speed of738.4 km/s and an acceleration of –6.3 m/s2 for the 49◦ direc-tion. The difference, if compared with the CDAW, was of 15.5% ofthe average speed and only 1.6% of the acceleration.
In the CME event of March 1 (2002), the CDAW presents aradial speed of 719 km/s and an acceleration of –16.2 m/s2 forthe 245◦ direction. During this work it was found a radial speedof 759.4 km/s and an acceleration of –28.9 m/s2 for the 241◦
direction (Fig. 5C). A difference of 5.6% was presented whendetermining the average speed.
For the CME event of December 2 (2003), the CDAW presentsa radial speed of 1,393 km/s and an acceleration of 18.5 m/s2
for the 261◦ direction. While, in this work, it was found a radialspeed of 1,265.2 km/s and an acceleration of 20.3 m/s2 for the266◦ direction (Fig. 5D). If compared with the CDAW data, theaverage speed difference was of 9.2% and the acceleration differ-ence of 9.7%.
Four CME events were analyzed by this new method, two ofthem presented an acceleration (September 28, 1997) and Decem-ber 2, 2003). The CME are driven by the Lorentz force that accel-erates the unstable coronal magnetic structure to the speeds thatare necessary to be thrown in the interplanetary space (Forbes,2000). Thus, the CME are ejected and accelerated in the corona’smagnetic field and while traveling in the space the magnetic forcedecreases and other processes can accelerate the CME (Manoha-ran, 2006). As it is the case of the interaction CME-CME. The ef-fects of the CME-CME interaction can be measured directly whentwo CMEs are thrown from the same active area. In the case that asecond CME goes faster than the first, the result of such interac-tion is that the first CME will be accelerated while the second willbe decelerated (Vrsnak et al., 2008).
The other two CME events that were analyzed presented decel-eration (February 2, 2001 and March 1, 2002). This happens as aresult of the coupling CME-wind, eruptions that are faster than thesolar wind, usually decelerate, while those that are slower than thesolar wind accelerate (Gopalswamy et al., 2000). Vrsnak (2001)
demonstrated that the deceleration is dependent of the speed andheight. Fast CME tend to present an accentuated deceleration,where the deceleration decreases with the height, in other words,with the environmental decrease of the density. Such behavior in-dicates that the CME movements are strongly affected by the aero-dynamic dragging, caused by the large-scale emission of MHDwaves with wide amplitude, that remove the impulse and energy(Cargill et al., 1996; Cargill, 2004).
Dal Lago et al. (2003b) and Schwenn et al. (2005) proposedthe use of the lateral expansion speed of the event of a “CME halo”(as it happened on September 28, 1997), measured in the LASCOC3’s images, to predict the CME travel time towards the Earth. TheCME lateral expansion speed (VEXP) is defined as the growth rate,approximately, perpendicular to the direction of the radial speed(Dal Lago et al., 2003b; Schwenn et al., 2005) (Fig. 6).
The new technique is able to estimate the speed and accelera-tion, with a lateral expansion nature, of a CME event, this is an in-novation on the methodologies used by Sheeley et al. (1999) andDal Lago et al. (2003a, 2004). In order to determine the dynamicsof CME lateral expansion, the first step is to determine the angularposition of the highest radial speed. From this position, the pairsof radial speed are detected, with equidistant angular position (tosatisfy the perpendicularness condition, as defined by Dal Lagoet al. (2003b) and Schwenn et al. (2005). The following step isto select the pair that presents the greatest distance among them-selves. This distance is indicative of the lateral expansion size(Fig. 7). The temporal evolution of that distance with lateral ex-pansion, which is determined for each LASCO image, representsthe CME speed of lateral expansion.
Table 2 – Dynamic characteristics of CMElateral expansion.
Vexp (km/s) aexp (m/s2)
1,091.3 –0.1
611.7 –0.2
538.8 0.0
1,091.3 –0.1
Table 2 presents information about the speed and lateralexpansion acceleration for the CME events. On September 28(1997), the found expansion speed was of 40.0 km/s. Thisevent did not present an acceleration with lateral expansion.However, on February 2 (2001) the found expansion speedwas of 611.7 km/s and presented an expansion deceleration of–0.2 m/s2. While on March 1 (2002), the found expansion speedwas of 538.8 km/s. This event, also, did not present expansion
Revista Brasileira de Geofısica, Vol. 30(1), 2012

“main” — 2012/8/24 — 12:40 — page 109 — #7
RIGOZO NR 109
Figure 6 – Illustration of how the expansion speed is defined (Vexp) (Schwenn et al., 2005).
Figure 7 – Illustration of how the method determines the expansion speed (Vexp)of a CME event. Where Vradmax is the vector of higher radial speed, V1D, 2D, 3Dand V1E, 2E, 3E are the pairs of speed vectors (to the left and right of Vradmax) andd1, 2, 3 represent the distances between their respective pairs of speed vectors.
acceleration. Finally, on December 2 (2003), the found expansionspeed was of 1,091.3 km/s and presented an expansion deceler-ation of –0.1 m/s2.
This type of measurements can be of extreme importance forthe studies of spatial climate, once they can be used to predict theCME travel time towards the Earth (Dal Lago et al., 2004; Schwennet al., 2005).
The results obtained with the technique for analysis proposedherein, can be considered excellent, once the image data representphenomena that are millions of kilometers distant from the Earth,and each pixel of the image represents about 39,340 kilometers.
CONCLUSION
This article presented a new methodology to automatically detectthe coronal mass ejections (CME) and determine its dynamics,using digital image processing. In order to validate the resultsobtained by this new and original methodology, it was appliedfor four CME events: on September 28, 1997, February 2, 2001,
March 1, 2002 and December 2, 2003, and their results werecompared with the SOHO LASCO CME catalog (CDAW), and DalLago et al. (2003a). The results obtained when validating weregood, showing that this methodology is adequate for the study ofCME dynamics through digital images.
The advantages of the new methodology in relation to thetechniques applied by Dal Lago et al. (2003a) and by the CDAWare: 1) It automatically detects the CME events; 2) It allows todetermine the CME dynamics of lateral expansion.
ACKNOWLEDGMENTS
The author gratefully acknowledges the LASCO and teams forpermitting the use of the images in this work. Also thankfulto the Conselho Nacional de Desenvolvimento Cientıfico e Tec-nologico (CNPq) for the financial support in the accomplish-ment of this work, through the projects: APQ 470252/2009-0and 301033/2009-9.
Brazilian Journal of Geophysics, Vol. 30(1), 2012

“main” — 2012/8/24 — 12:40 — page 110 — #8
110 AUTOMATIC DETECTION METHOD OF CORONAL MASS EJECTION BY DIGITAL IMAGE ANALYSIS
REFERENCES
BRUECKNER GE, HOWARD RA, KOOMEN MJ, KORENDYKE CM,
MICHELS DJ, MOSES JD, SOCKER DG, DERE KP, LAMY PL, LLEBARIA
A, BOUT MV, SIMNETT GM, BEDFORD DK & EYLES CJ. 1995. The Large
Angle Spectroscopic Coronagraph (LASCO). Solar Phys., 162: 357–402.
CARGILL PJ. 2004. On the Aerodynamic Drag Force Acting on Interplan-
etary Coronal Mass Ejections. Sol. Phys., 221: 135–149.
CARGILL PJ, CHEN J, SPICER DS & ZALESAK ST. 1996. Magnetohy-
drodynamic simulations of the motion of magnetic flux tubes through a
magnetized plasma. J. Geophys. Res., 101: 4855–4870.
DAL LAGO A, SCHWENN R, STENBORG G & GONZALEZ WD. 2003a.
Coronal mass ejection speeds measured in the solar corona using LASCO
C2 and C3 images. Adv. Space Res., 32(12): 2619–2624.
DAL LAGO A, SCHWENN R & GONZALEZ WD. 2003b. Relation between
the radial speed and the expansion speed of coronal mass ejections. Adv.
Space Res., 32(12): 2637–2640.
DAL LAGO A, SCHWENN R, STENBORG G, GONZALEZ WD, GONZALEZ
ALC, VIEIRA LEA, ETHER E, GUARNIERI FL & SCHUCH NJ. 2004. Decel-
eration observed on the July 25 (1999) coronal mass ejection. Geofisica
International, 439(1): 41–45.
FORBES TG. 2000. A review on the genesis of coronal mass ejections.
J. Geophys. Res., 105: 23153–23166.
GOPALSWAMY N, LARA A, LEPPING RP, KAISER ML, BERDICHEVSKY
D & St CYR OC. 2000. Interplanetary acceleration of coronal mass ejec-
tions. Geophys. Res. Lett., 27: 145–148.
HOWARD RA, MICHELS DJ, SHEELEY NR Jr & KOOMEN MJ. 1982. The
observation of a coronal transient directed at Earth. Astrophys. J., 263:
101–104.
HUNDHAUSEN AJ. 1997. An introduction. In: CROOKER N, JOSELYN
JA & FEYNMAN J. (Eds.). Coronal mass ejections. Washington, DC:
AGU, 99: 1–7.
HUNDHAUSEN AJ, SAWYER CB, HOUSE LL, ILLING RME & WAGNER
WJ. 1984. Coronal mass ejections observed during the solar maximum
mission – latitude distribution and rate of occurrence. J. Geophys. Res.,
89: 26–39.
MANOHARAN PK. 2006. Evolution of Coronal Mass Ejections in the In-
ner Heliosphere: A Study Using White-Light and Scintillation Images.
Sol. Phys., 235: 345–368.
SCHWENN R. 1996. An essay on terminology, myths, and known facts:
solar transients – flare – CME – driver gas – piston – BDE – magnetic
cloud – shock wave – geomagnetic storm. Astrophys. J., 243: 187.
SCHWENN R, DAL LAGO A, HUTTUNEN E & GONZALEZ WD. 2005. The
association of coronal mass ejections with their effects near the Earth.
Annales Geophysicae, 23: 1033–1059.
SHEELEY Jr NR, WALTERS JH, WANG Y-M & HOWARD RA. 1999. Con-
tinuous tracking of coronal outflows: two kinds of coronal mass ejections.
J. Geophys. Res., 104(A11): 24739–24767.
VRSNAK B. 2001. Deceleration of Coronal Mass Ejections. Sol. Phys.,
202: 173–189.
VRSNAK B, VRBANEC D & CALOGOVIC J. 2008. Dynamics of coronal
mass ejections – The mass-scaling of the aerodynamic drag. Astronomy
& Astrophysics, 490: 811–815.
NOTES ABOUT THE AUTHOR
Nivaor Rodolfo Rigozo. Doctor in Space Geophysics, INPE – Instituto Nacional de Pesquisas Espaciais (1998), currently researcher at Centro Regional Sul dePesquisas Espaciais, an INPE division in the Rio Grande do Sul State. Nowadays studying the Sun-Earth relationship through Natural Registers by the analysis oftemporal series, and analysis of digital images of coronal mass ejections (CME) events.
Revista Brasileira de Geofısica, Vol. 30(1), 2012