Embed Size (px)
Citation preview

Automated QbD-Based Method Development and Validation of Oxidative Degraded Atorvastatin
Application Note
AuthorsVinayak AK and Syed Salman Lateef Agilent Technologies Inc, Bangalore, India
Pharmaceutical QA/QC
AbstractQuality-by-Design (QbD) approach emphasizes risk management and sound science. Its application in analytical method development helps to increase the robustness and ruggedness of methods compared to traditional approaches. This study applied a QbD approach in analytical method development to achieve the best purity of Active Pharmaceutical Ingredient (API) peak from oxidative degraded Atorvastatin drug substance. The developed method is validated, incorporating a multivariate robustness study, using Fusion QbD Automated QbD Method Development and Validation Software (S-Matrix) on an Agilent 1200 Infinity Series LC Method Development System. API purity was found to be 99.8 %, and was well separated from impurities in the developed method.

2
SoftwareFusion QbD Automated Method Development and Validation Software from S-Matrix Corporation. Version 9.6.22 was used for the automated experimentation.
Reagents and materialsAtorvastatin calcium drug substance was purchased from Aldrich, all solvents used for analysis were of LC/MS grade and were purchased from Fluka. Additives and reagents were purchased from Aldrich. Purified water was obtained from Milli-Q water purification system (Millipore, USA). Hydrogen peroxide was purchased from a local supplier.
Degradation procedureFor oxidative degradation, 1.6 mg of Atorvastatin drug substance was treated with 400 µL of 3 % H2O2. A control sample was also prepared by treating the drug substance with 400 µL of water. Both control and treated samples were incubated at 40 °C for 24 hours, followed by a vacuum dry using an Eppendorf concentrator 5301 (Eppendorf, Germany), and reconstituted with 1,600 µL of dimethylformamide (DMF). Then, the samples were subjected to centrifugation at 13,000 rpm for 10 minutes. The supernatant was used for analysis.
ExperimentalInstrumentationAgilent 1200 Infinity Series LC Method Development Solution. The individual modules and components were:
• Agilent 1290 Infinity Binary Pump (G4220A)
• Agilent 1290 Infinity Valve Drive (G1170A) and Agilent Quick-Change 12-position/13-port solvent selection valve (G4235A)
• Agilent 1290 Infinity Autosampler (G4226A) maintained at 5 °C using thermostat (G1330B)
• Agilent 1290 Infinity TCC (G1316C) cluster with two Agilent Quick-Change 8-position/9-port valves (G4230B)
• Solvent Selection Tubing Kit for four solvent (p/n 5067-4601)
• Agilent 1290 Infinity DAD (G4212A)
The Agilent 1290 Infinity LC System was operated using an Agilent OpenLAB CDS ChemStation Edition Workstation (C.01.05, [38]). Additional information on instrumentation is mentioned elsewhere8.
IntroductionQbD is defined in ICH guidelines Q8(R2) as “A systematic approach to development that begins with predefined objectives and emphasizes product and process understanding and process control, based on sound science and quality risk management”1. ICH guidelines suggest that designing quality into a process minimizes the risk or failures, thereby enabling the production of an intended quality product. The analytical method for a drug is also a process, and quality principles in the ICH guidelines can be implemented in the design of the method2,3. The goal of Analytical QbD is to achieve quality in measurement. This objective is attained by identifying the critical method attributes (CMAs) upfront, performing multifactorial exploration of the process design space surrounding the chosen conditions, and implementing systematic risk management to keep the process in control4. In a QbD approach, CMAs are established and the interactions between critical method variables (CMV) are characterized using statistical multivariate analysis and modeling. This leads to reductions in method failure in the field, and fewer out-of-specification studies.
In this Application Note, an Agilent 1200 Infinity Series LC Method Development System was coupled with the Fusion QbD Automated QbD Method Development and Validation Software to develop and validate a method for the separation of Atorvastatin API from its oxidative degradants. Method development was performed by screening and optimizing method parameters using separate DOE designs5, 6, 7. The method was validated by multivariate robustness designs.

3
of the validation effort, the robustness of the method was verified using DOE to deliberately vary multiple CMVs simultaneously, together with regression analysis to quantitatively characterize the individual and combined effects of the CMVs on the robustness of the method. The general workflow, with corresponding variables in each phase, is summarized in Figure 1. Designs were created and exported from Fusion QbD to the OpenLab Chromatography Data System (CDS). The chromatograms were processed in the CDS, and imported back into Fusion QbD8. Multiple response curves (3-dimensional) show the individual and combined effects of the study variables on the CMAs.
WorkflowThe workflow involved two QbD-based rapid method development screening phases followed by an optimization phase. Based on the user defined variables, the software predicted the best answer at each phase. The multivariate approach during these phases narrowed the knowledge space into a design space where quality of the method is assured. The developed method was further optimized to achieve the best API peak purity and better overall separation. The multivariate analysis results were modelled to obtain the final robust design space, also called the Method Operable Design Region (MODR). The optimized method was later fully validated. As part
QbD: setting goals/targetsTwo of the major elements of QbD-based method development are Analytical Target Profile (ATP) and Critical Method Attributes (CMAs).
ATP is the method objective that describes the intended purpose of the method and verifies that the data fits the objective. In this study, the set ATP had the following requirements:
• The method should separate analyte (Active Pharmaceutical Ingredient) from degradants.
• It should use an MS-compatible mobile phase for identification of degradants by mass spectrometry in the future.
• The developed method should be robust.
• The confidence of measurement from validation results should have precision RSD < 5 %.
CMA is an element of method performance that must be measured to assess whether a method is capable of producing fit-for-purpose data. In this study, the set CMAs were:
• API Tangent Resolution: ≥ 2.00 for API peak from nearest pre- and post-eluting impurity peaks.
• Purity value: The API peak should have purity ≥ 99 %.
• Maximum number of peaks having low peak width: Maximum number of peaks of degraded sample should have reasonable peak width and theoretical plates.
• Robustness of method: The final method should be robust to all established critical parameters.
Variable
• Column chemistry • pH (aqueous solvent)• Strong solvent (organic)• Gradient time
Screening Phase 1
Variable
• Column length• pH fine tuning• Additive (THF)• Gradient time• Column temperature
ScreeningPhase 2
Optimization
Validation
Variable
• Flow rate • Intermediate gradient hold time• Gradient slope• Oven temperature
CMVs
• Flow rate • Injection volume• Column temperature • pH• Buffer concentration
Figure 1. Overall workflow used for the study. Variables used during each phases are shown beside each phase. CMVs included in the robustness study are also shown.

4
Variables and constantsThe details of constants and variables used for Screening Phase 1 and 2 experiments are given in Tables 1 and 2 respectively. To achieve the optimum separation and purity of API, a step gradient with intermediate hold time was incorporated into the optimization phase. The variables used in the optimization phase, and the Critical Method Parameters (CMPs), which were deliberately varied during the validation phase, are given in Tables 3 and 4 respectively.
Table 1. Variables and constants used in Screening Phase 1.
VariableColumnsAgilent ZORBAX RRHD SB Aq, 3.0 × 50 mm, 1.8 µm (p/n 857700-314)Agilent ZORBAX RRHD Bonus-RP 2.1 × 50 mm, 1.8 µm (p/n 857768-901)Agilent ZORBAX RRHD Eclipse Plus C8, 3.0 × 50 mm, 1.8 µm (p/n 959757-306)Agilent ZORBAX RRHD Eclipse Plus Phenyl-Hexyl, 3.0 × 50 mm, 1.8 µm (p/n 959757-312) Agilent PLRP-S, 4.6 × 50 mm, 3.0 µm (p/n PL1512-1300)Agilent ZORBAX RRHD Eclipse Plus C8, 3.0 × 50 mm, 1.8 µm (p/n 959757-306)SolventsA1 pH 3.0, 20 mM formic acid in waterA3 pH 4.0, 5 mM formic acid and 10 mM ammonium formate in waterA5 pH 5.0, 5 mM acetic acid and 10 mM ammonium accetate in waterA7 pH 7.0, 10 mM ammonium accetate in waterA9 pH 8.1, 10 mM ammonium hydrogencarbonate in waterB1 AcetonitrileB2 MethanolGradient time3 to 10 minutesConstantGradientEquilibration 3.0 minutes, at 5 % B Initial hold 0.5 minutes, at 5 % B Final hold 0.5 minutes, at 95 % B Re-equilibration 2 minutes, at 5 % BPump flow 0.6 mL/minInjection volume 1 µLColumn temperature 40 °CWavelength 245 nm ± 4 nm (ref off)

5
Table 2. Variables and constants used in Screening Phase 2.
VariableColumn Length (Agilent ZORBAX RRHD Eclipse Plus Phenyl-Hexyl)3.0 × 50 mm, 1.8 µm (p/n 959757-312)3.0 × 100 mm, 1.8 µm (p/n 959964-312)SolventsA1 pH 4.0, 5 mM formic acid and 10 mM ammonium formate in waterA2 pH 4.5, adjusted from pH 5 with acetic acidA3 pH 5.0, 5 mM acetic acid and 10 mM ammonium acetate in waterA4 pH 5.5, adjusted from pH:7 with acetic acidA5 pH 6.0, adjusted from pH:7 with acetic acidA6 pH 6.5, adjusted from pH:7with acetic acidA7 pH 7.0, 10 mM ammonium acetate in waterB1 AcetonitrileB2 Acetonitrile: THF (88:12)Gradient time9 minutes15 minutesColumn temperature35 °C40 °C45 °C50 °CConstantGradientEquilibration 1.0 minute, at 5 % BInitial hold 1 minute, at 5 % B Final hold 2 minutes at 95 % B Re-equilibration 4 minutes at 5 % BFlow rate 0.6 mL/minInjection volume 1 µLWavelength 245 nm ± 4 nm (ref off)All other finalized parameters from Phase 1
Table 3. Variables used in optimization phase.
Variable parameters Study rangePump flow rate (mL/min) 0.55
0.60 0.65
Intermediate hold time (min) 3 to 7 minutesGradient slope (final % of Gradient 1) 30 to 35 %Oven temperature (°C) 33
36 39
Gradient 1 5 % B to (30–35) % BGradient 2 (30–35) % B to 90 % B

6
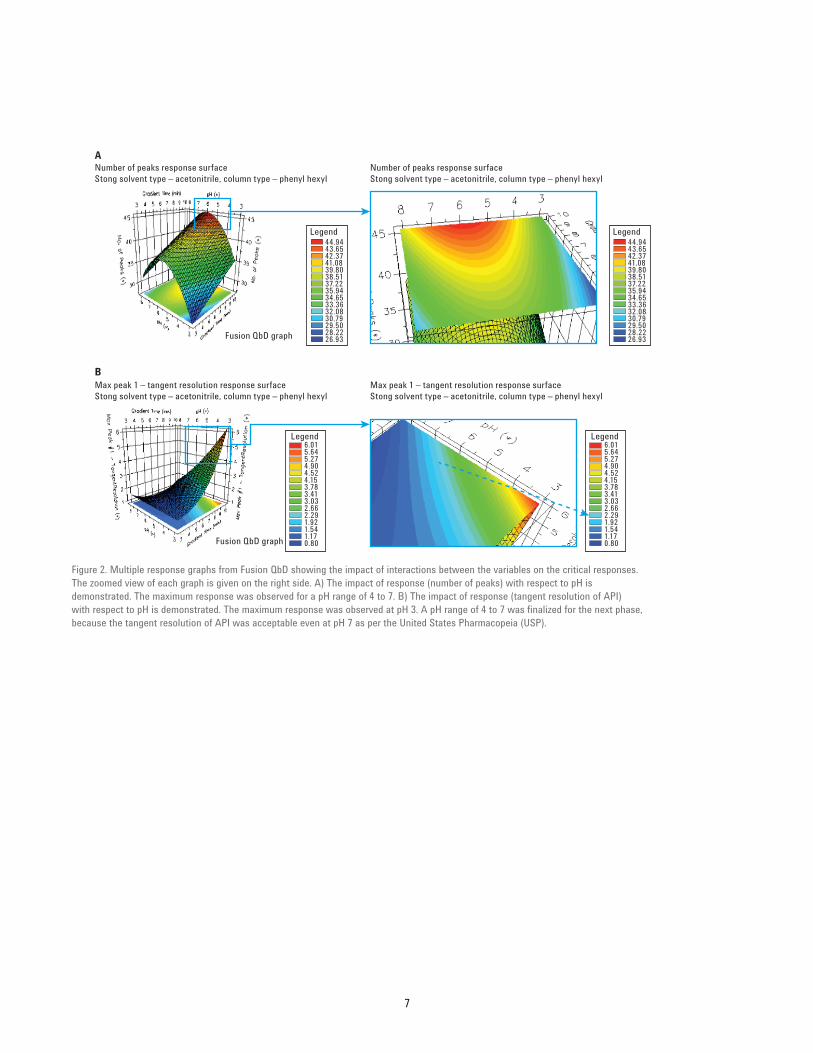
Results and DiscussionMethod development screening Phase 1In this phase, the goal was to identify the conditions that provide better separation of API from its adjacent impurities. The Goal (CMA) and outcome of screening Phase 1 are summarized in Tables 5A and 5B respectively. The best reverse phase column chemistry and solvent were determined to be phenyl hexyl and acetonitrile. Multiple response curves (Figures 2A and 2B) were used to identify the optimum pH range for next screening studies.
Table 4. Critical Method Variables used for method validation.
CMV Coded name* Range testedFlow rate (mL/min) A 0.59
0.600.61
Injection volume (µL) B 0.91.01.1
Oven temperature (°C) C 323334
pH D 6.666.766.86
Buffer concentration (mM) E 9.510.010.5
*Coded names are used in robustness model displays.
Table 5A. Response (CMA) goals set for method screening Phase 1.
Response goals TargetLower bound
Upper bound Relative rank
No. of peaks Maximize 25 50 1No. of peaks ¡ 1.50 (tangent resolution) Maximize 22 31 1No. of peaks ¡ 2.00 (tangent resolution) Maximize 20.0 27.0 1Max peak 1 (tangent resolution) Minimize 0.37 6.24 1
Table 5B. Best overall answer of screening Phase 1, predicted by Fusion QbD.
Variable Level settingColumn type Phenyl hexylSolvent A pH 6.763Solvent B (organic) AcetonitrileGradient time 9.37
7
Number of peaks response surfaceStong solvent type – acetonitrile, column type – phenyl hexyl
Max peak 1 – tangent resolution response surfaceStong solvent type – acetonitrile, column type – phenyl hexyl
Max peak 1 – tangent resolution response surfaceStong solvent type – acetonitrile, column type – phenyl hexyl
Number of peaks response surfaceStong solvent type – acetonitrile, column type – phenyl hexyl
Fusion QbD graph
Fusion QbD graph
A
B
Legend44.9443.6542.3741.0839.8038.5137.2235.9434.6533.3632.0830.7929.5028.2226.93
Legend44.9443.6542.3741.0839.8038.5137.2235.9434.6533.3632.0830.7929.5028.2226.93
Legend6.015.645.274.904.524.153.783.413.032.662.291.921.541.170.80
Legend6.015.645.274.904.524.153.783.413.032.662.291.921.541.170.80
Figure 2. Multiple response graphs from Fusion QbD showing the impact of interactions between the variables on the critical responses. The zoomed view of each graph is given on the right side. A) The impact of response (number of peaks) with respect to pH is demonstrated. The maximum response was observed for a pH range of 4 to 7. B) The impact of response (tangent resolution of API) with respect to pH is demonstrated. The maximum response was observed at pH 3. A pH range of 4 to 7 was finalized for the next phase, because the tangent resolution of API was acceptable even at pH 7 as per the United States Pharmacopeia (USP).

8
Method development screening Phase 2In this phase, the goal was to narrow down column length, column temperature, and pH range by taking inputs from Phase 1. Since the USP method has tetrahydrofuran (THF) in the mobile phase composition, the effect of THF in the mobile phase was also screened. A new response, peak symmetry was also introduced and the knowledge space was further narrowed down. The goal and outcome of screening Phase 2 is summarized in Tables 6A and 6B. The results show better separation without THF in the mobile phase. The improvement in elution profile from screening Phases 1 to 2 is shown in Figure 3.
Table 6A. Response (CMA) goals set for method screening Phase 2.
Response goals TargetLower bound
Upper bound Relative rank
No. of peaks Maximize 36 45 1No. of peaks ¡ 1.50 (tangent resolution) Maximize 28 34 0.9No. of peaks ¡ 2.00 (tangent resolution) Maximize 21 28 1Max peak #1 (tangent resolution) 2.51 1.40 3.62 1Max peak #1 (symmetry) Minimize 1.14 1.15 0.9
Table 6B. Best overall answer of method screening Phase 2, predicted by Fusion QbD.
Variable Level settingColumn length 100 mmSolvent A pH 7.0Solvent B (organic) AcetonitrileGradient time 15 minutesColumn temperature 35.1 °C
min2 4 6 8 10 12 14 16
mAUA
B
0
100
200
300
400
min2 4 6 8 10 12 14 16
mAU
0
100
200
300
400
Screening Phase 1
Screening Phase 2
Figure 3. Chromatograms showing the improvement in elution profile of degraded atorvastatin sample from screening Phase 1 (A) to Phase 2 (B).

9
Method development optimization phaseIn this phase, the goal was to fine tune parameters such as flow rate, gradient intermediate hold time, gradient slope, and column temperature. The best overall answer from the optimization phase was:
Flow rate 0.6 mL/min
Intermediate hold time 5.52 minutes
Final organic solvent of Gradient 1 35 % (gradient slope)
Column temperature 33 °C
These results were reflected in the optimized design space graph. The robustness simulator algorithm was executed to model process capability (Cp)8 and Proven Acceptable Ranges (PARs). The parameters used in the robustness simulator are summarized in Table 7. The design space (MODR) graph marked with Cp and PARs is shown in Figure 4. The PAR’s center point and four border points were selected by the software for point prediction. The values from the point prediction utility were automatically exported and run as a sequence to the CDS. The experimental response values were found to be within the confidence limit; values from the center point are shown in Table 8. A total of 43 peaks were separated, with 35 of the 43 peaks achieving a tangent resolution ≥ 1.50. The number of peaks with narrow peak width and good peak tailing were 17 and 29 respectively. The before and after optimization phase chromatograms were compared to observe the improvement (Figure 5).
Table 7. Robustness Simulator parameters from Fusion QbD. The maximum expected variation values are defined by user.
Enabled Experimental variable Units Max. expected variation (+3 Sigma value)Yes Flow rate mL/min 0.01Yes Intermediate hold time min 0.15Yes Solvent B % 1.5Yes Column temperature °C 1.75
Figure 4. The Fusion QbD software design space (MODR) graph. The figure includes Cp values and PAR region.
Table 8. Fusion QbD software predicted response (CMA) values from the center point of PAR. The experimental results were compared with predicted values and found to be within Sigma confidence limit.
Response variable
Predicted response value
–2 Sigma confidence limit
+2 Sigma confidence limit Experimental
No. of peaks 42.53 41.11 43.94 43No. of peaks > 1.50 (tangent resolution) 35.3 33.87 36.73 35No. of peaks < 0.05 (width) 15.6 13.32 17.87 17No. of peaks < 1.6 (tailing USP) 26.72 24.08 29.36 29

10
Method validation phase The robustness of an analytical procedure is a measure of its capacity to remain unaffected by small, but deliberate variations in method parameters, and provides an indication of its reliability during normal usage1. Normally, the robustness of a developed method is tested by changing one method parameter at a time, keeping the others constant. In this study, multiple variables were changed simultaneously, in different combinations, using a DOE approach. Method robustness was performed on the optimized method for the separation of Atorvastatin API in an oxidative degraded sample. Five CMVs were changed simultaneously to evaluate the robustness of the method. These CMVs and their measured deviations from set point, are listed in Table 9. The method passed the robustness test for all expected deviations in all CMAs. Summarized results for all CMAs obtained from the Fusion QbD software are given in Table 10, and an example Fusion QbD Robustness Report is shown in Table 11.
min2.5 5 7.5 10 12.5 15 17.5 20 22.5
mAU
0
50
100
150
200 8.79
, API
min2.5 5 7.5 10 12.5 15 17.5 20 22.5
mAU
0
50
100
150
200
10.0
1, AP
I
min10 10.2 10.4
998
| || |' ' ' ' '
Before optimization
A
BAfter optimization
min8.8 8.9
998
| || |' ' ' ' '
Figure 5. The chromatographic elution profiles of degraded atorvastatin before and after optimization phase were compared to observe the improvement. The corresponding peak purity plots are given as insets. API peak purity failed before the optimization step (marked in red below the API peak). After incorporating the optimized method parameters, the peak purity passes with a value of 99.8 % (marked in green).
Table 9. CMVs used for robustness study and measured deviations.
*Coded name used in models showing multiple interactions
CMV Coded name* Method nominal Robust rangePump flow rate (mL/min) A 0.6 ± 0.01Oven temperature (°C) B 33 ± 1pH C 6.76 ± 0.1Buffer concentration (mM) D 10 ± 0.5Injection volume E 1 ± 0.1
Table 10. Observed deviations for all CMAs from robustness study.
CMA Mean RSDAPI tangent resolution 2.7 3.3 %API area 4,504.5 1.9 %API RT 10.0 0.7 %ADPK RT* 9.2 0.67 %
*Adjacent peak

11
ConclusionsA robust analytical method for chromatographic separation of oxidative degraded Atorvastatin was developed and validated using an Agilent 1200 Infinity Series LC Method Development System and Automated QbD-based Method Development and Validation Software – Fusion QbD (S-Matrix). The API was well separated from adjacent impurity peaks, having a mean tangent resolution of 2.7, and showed a peak purity of 99.8 %. The developed method was capable of separating 43 peaks with 35 peaks having a tangent resolution ≥ 1.50. The software-predicted optimized conditions were experimentally verified. Fusion QbD-assisted robustness was carried out incorporating multiple variable interaction models. The QbD approach to method development has helped to better understand the critical method variables, leading to less chance of failure during method validation and transfer. The automated QbD method development approach using Fusion QbD software helps to develop a robust method in a short time compared to manual method development.
Table 11. An example showing the Robustness report of API tangent resolution from Fusion QbD.
Model term name
Robustness testing level (coded)
Predicted tolerance limit effect
Predicted tolerance limit standard error
Predicted tolerance limit t statistic Pass/Fail
(D)² 1.0000 –0.08464231348 0.0712 –1.1894 Pass(E)² 1.0000 0.05480284456 0.0775 0.7073 PassC*D 1.0000 0.05084585269 0.0739 0.6884 PassD*E 1.0000 –0.03184544154 0.0766 –0.4159 PassD 1.0000 –0.03094020681 0.0712 –0.4348 Pass(C)² 1.0000 0.02825316236 0.0712 0.3968 PassC*E 1.0000 –0.01662310268 0.0763 –0.2180 PassE 1.0000 0.01558544704 0.0775 0.2011 PassC 1.0000 0.01456864789 0.0712 0.2046 PassA*C 1.0000 0.01253588742 0.0742 0.1688 PassA*E 1.0000 –0.00978673976 0.0767 –0.1276 PassA 1.0000 0.00682243132 0.0731 0.0933 Pass(A)² 1.0000 0.00567516215 0.0731 0.0776 PassA*D 1.0000 0.00042223391 0.0745 0.0057 Pass

www.agilent.com/chem
This information is subject to change without notice.
© Agilent Technologies, Inc., 2014 Published in the USA, August 1, 2014 5991-4944EN
References1. International Conference on
Harmonization (ICH) Q8 (R2): Pharmaceutical Development 1. (August 2009). http://www.ich.org/ products/guidelines/quality/article/ quality-guidelines.html/
2. Vogt, et al. Development of Quality-By-Design Analytical Methods. J. of Pharma. Sci. March 2011, 100, No. 3, pp 797-812.
3. Reid, G.; et al. Analytical Quality by Design (AQbD) in pharmaceutical Development. American Pharmaceutical Review August 2013, 144191.
4. Thorsten, V.; et al. Quality by design for a vaccine release immunoassay: a case study. Bioanalysis 2013, 5(20), pp 2531-2545.
5. Verseput, R.; et al. A Quality-by-Design methodology for rapid LC method development, Part 1. LCGC North America Dec 2008.
6. Verseput, R.; et al. A Quality-by-Design methodology for rapid LC method development, Part II. LCGC North America Jan 2009.
7. Mcbrien, M. Practical Implications of Quality by Design to Chromatographic Method Development. Chromatog. Today May/June 2010, pp 30-34.
8. Lateef, S.; Vinayak, A. K. Stability Indicating Method Development for Linagliptin Drug Product using Quality-by-design, Agilent Technologies, Bangalore, India, publication number 5591-3834EN.