Embed Size (px)
Citation preview

, . 182: 68–75 (1997)
AUTOMATED LOCATION OF DYSPLASTIC FIELDSIN COLORECTAL HISTOLOGY USING IMAGE
TEXTURE ANALYSIS
. 1*, . 2, 2, . 3, 4 . 1
1Department of Pathology, The Queen’s University of Belfast, Belfast, N. Ireland, U.K.2Optical Sciences Center, University of Arizona, Tucson, Arizona, U.S.A.
3Royal Hospital Trust, Belfast, N. Ireland, U.K.4Institute of Pathological Anatomy and Histopathology, University of Ancona, Ancona, Italy
SUMMARY
Automation in histopathology is an attractive concept and recent advances in the application of computerized expert systems andmachine vision have made automated image analysis of histological images possible. Systems capable of complete automation not onlyrequire the ability to segment tissue features and grade histological abnormalities, but must also be capable of locating diagnosticallyuseful areas from within complex histological scenes. This is the first stage of the diagnostic process. The object of this study was todevelop criteria for the automatic identification of focal areas of colorectal dysplasia from a background of histologically normal tissue.Fields of view representing normal colorectal mucosa (n=120) and dysplastic mucosa (n=120) were digitally captured and subjected toimage texture analysis. Two features were selected as being the most important in the discrimination of normal and adenomatouscolorectal mucosa. The first was a feature of the co-occurrence matrix and the second was the number of low optical density pixels inthe image. A linear classification rule defined using these two features was capable of correctly classifying 86 per cent of a series oftraining images into their correct groups. In addition, large histological scenes were digitally captured, split into their component images,analysed according to texture, and classified as normal or abnormal using the previously defined classification rule. Maps of thehistological scenes were constructed and in most cases, dysplastic colorectal mucosa was correctly identified on the basis of imagetexture: 83 per cent of test images were correctly classified. This study demonstrates that abnormalities in low-power tissue morphologycan be identified using quantitative image analysis. The identification of diagnostically useful fields advances the potential of automatedsystems in histopathology: these regions could than be scrutinized at high power using knowledge-guided image segmentation for diseasegrading. Systems of this kind have the potential to provide objectivity, unbiased sampling, and valuable diagnostic decision support.? 1997 by John Wiley & Sons, Ltd.
J. Pathol. 182: 68–75, 1997.No. of Figures 6. No of Tables 2. No. of References 14.
KEY WORDS—automation; image analysis; histopathology; colon; machine vision; quantitative pathology
INTRODUCTION
Over the years, there has been a rapid increase in therole of automation in laboratory-based specialties suchas clinical biochemistry and haematology. In histopath-ology and cytopathology,1 automation is an attractiveconcept, but development along these lines has beendifficult due to the need for visual interpretation ofcomplex images. While significant progress has beenmade in the development and marketing of automatedcervical screening devices, automated analysis of tissuehistology is a much more complex task. However, recentadvances in the application of machine vision, featureextraction, computerized expert systems, and quantita-tive classification have made automated analysis ofhistological images possible. By providing the machinewith knowledge-based capabilities for image under-standing, important tissue structures can be identified,segmented, and subjected to measurement for the
purposes of objective disease classification.2 Softwarehas now been developed for the automated imagesegmentation of colorectal,3,4 prostate,5,6 and breast7histology.In all of these histological studies, the images used for
segmentation and analysis have been preselected anddigitally captured by an experienced pathologist. Thisprocess was necessary to test the reliability of themachine vision system in scene segmentation and analy-sis of specified fields. Having illustrated the success ofthis approach, the next step is to design methodologieswhich allow the automatic location of these diagnosti-cally useful areas from within a histological scene.Automatic location of abnormal tissue morphologybased on quantitative criteria would be essential inconstructing a device capable of totally automated,unsupervised, histological interpretation.The object of this study was to develop criteria for the
automatic identification of focal areas of colorectaldysplasia from a background of histologically normaltissue. Colorectal tissue represents a sufficiently complexdomain in which to test these concepts and the methods
*Correspondence to: Dr Peter W. Hamilton, Quantitative PathologyLaboratory, Department of Pathology, The Queen’s University ofBelfast, Grosvenor Road, Belfast BT12 6BL, N. Ireland, U.K.
CCC 0022–3417/97/050068–08 $17.50 Received 7 August 1996? 1997 by John Wiley & Sons, Ltd. Revised 9 October 1996
Accepted 16 October 1996

developed can be easily adapted for application in otherglandular tissues.There are a variety of quantitative features which, at
high magnification, might characterize dysplastic glandsand allow their discrimination from normal tissue.4,8–10However, as an automated system would have toscan an entire slide, a detailed interrogation of glandstructure would be time-consuming and unnecessary forthis purpose. Most pathologists initially view a slide atlow power and having identified potential areas ofabnormality, examine those regions at high power. Thesame approach was adopted here: low-power analysisof image texture was used in an attempt to identifyabnormal fields.Texture is a term used to describe a series of measure-
ments which reflect the distribution and spatial inter-relationships of pixel grey values within a digitizedimage and allows the detection of subtle changes inimage appearance. Previously texture analysis hasbeen largely used for the quantitative description ofthe appearance of nuclear chromatin and the subtlechanges that occur in chromatin organization in(pre)malignancy.11–13 It was considered that quantitativetextural analysis might provide a useful tool for identi-fication of diseased colorectal tissue in tissue sections.
MATERIALS AND METHODS
TissueTwenty cases of colorectal adenomatous polyps,
which had been formalin-fixed and paraffin wax-embedded, were retrieved from file at the Royal VictoriaHospital, Belfast, Northern Ireland. Five-micrometresections were cut and stained routinely with haematoxy-lin and eosin. These were routinely assessed and graded
histologically as showing low, moderate, or high-gradecolorectal dysplasia. This study, however, was onlyinterested in the identification of dysplastic mucosa,regardless of grade.
Image capture
All images were recorded at 10:1 objective magnifi-cation on a videophotometer (Optical Sciences Centre,University of Arizona, U.S.A.) equipped with a 3-chipCCD camera (SONY). The system was calibrated byadjusting the light source until for an empty field ofview, grey values of 255 are obtained. Next, readingswere taken for a series of neutral density filters(OD=0·1–3·00), a calibration curve was calculated, anda look-up table was stored to ensure a linear response. Anarrow band contrast filter with transmission centredaround 620 nm was inserted and grey-level images werecaptured using the red chip of the 3CCD camera.
Training set
Thirty fields of normal colorectal mucosa and 30 fieldsof adenoma were selected as a training set. Each imagewas divided into quarters (Fig. 1), resulting in a datasetof 120 images each for the normal and adenomatousgroups. Each image was then independently subjectedto textural analysis using software developed as part ofthe TICAS (Taxonomic intracellular analytic system)project (University of Chicago/University of Arizona,U.S.A.) and running on a Sun Sparkstation 10. Thissoftware automatically calculates a variety of texturalfeatures on images of any size. In this study, a total of 82textural features were calculated for each image. Thisincludes a variety of measurements relating to the image
Fig. 1—Fields of view were captured (A) and split into quarters (B). Each quarter (C) was then subjected to texturalanalysis. In this figure, C is enlarged to show pixel grey values, which are analysed for textural features
69AUTOMATION IN HISTOPATHOLOGY
? 1997 by John Wiley & Sons, Ltd. J. Pathol. 182: 68–75 (1997)

optical density histogram, grey level co-occurrencematrix, and grey level run-lengths.It was important initially to define criteria which
would distinguish empty fields from those containingtissue. A set of 20 fields containing little or no tissue wascollected in order to determine the criteria for theidentification of empty fields.
Classification rule for discrimination of normal anddysplastic colorectal mucosaThe two groups of data for normal and dysplastic
images were subjected to a Kruskal–Wallis test to reducethe feature set to those showing significant differences(P<0·05) between the two groups. Further reduction offeatures was carried out by stepwise discriminant analy-sis which selected those features most useful in distin-guishing the images showing normal colorectal mucosafrom those showing adenomatous dysplasia. A linearclassification function based on selected features wasdefined. The ability of this rule to classify images cor-rectly as normal or abnormal was examined both on thetraining set from which it was derived and on a test setof images.
Digitized histological scenes (test set)Five histological scenes were recorded from tissue
sections of colorectal adenomas not used in the training
set. Each scene comprised numerous images, captured at10:1 in a sequential manner, which had been mergedtogether to generate a large histological scene5 (Fig. 2).The image shown in Fig. 2A is 3840#2048 pixels in sizebut can be reduced in size by pixel averaging, allowingthe whole scene to be viewed on screen. For anylocation, however, the image at full resolution can beinstantly displayed (Fig. 2B).Each image making up the scene was divided into
quarters as in Fig. 1. Each quarter was visually exam-ined and classified as either (a) normal colorectal tissue,(b) dysplastic tissue, or (c) being devoid of tissue. Theimages were small enough to be easily classified. Forthese, a map of the scene could be drawn illustratingdysplastic areas of the tissue section based on visualinspection of the component images (see Fig. 6). Thismap was used for comparisons with, and validation of,the computer-based classification methods.For a given scene, the images were then subjected to
computerized textural analysis and classified using therule defined on the training image set. A similar map wasdrawn for the computerized classification of tissue andcompared with the map based on visual assessment.
Probability maps
In addition, the classification rule was used todetermine the probability of group (normal/dysplasia)
Fig. 2—This shows a histological scene (A) composed of numerous images which have been merged. The images werecaptured at high power. Image (B) shows the high power equivalent of the image with the black border shown in A
(A) (B)
Fig. 3—Example of a blank image (A) and an image containing tissue (B) showing the sumof pixel OD (a.u.) obtained for both. A total OD of >10 000 was used to identifytissue-containing fields
70 P. W. HAMILTON ET AL.
? 1997 by John Wiley & Sons, Ltd. J. Pathol. 182: 68–75 (1997)

membership. These probabilities were mapped andcompared with the visual map of the histological scene.
RESULTS
Classification rule for discrimination of normal anddysplastic colorectal mucosaFigure 4 shows the variation in image texture charac-
teristics in normal and dysplastic mucosa. The Kruskal–Wallis test reduced the feature set to five which had thehighest H test statistic value. From these, two featureswere selected as being the most important in the dis-crimination of normal and adenomatous colorectalmucosa. The first was a feature of the co-occurrencematrix (fea028) and the second was the number oflow OD pixels in the image based on the mean ODvalue (fea321).
A plot of normal and dysplastic mucosal imagesagainst these two features is shown in Fig. 5. A linearclassification rule defined using these two features wascapable of correctly classifying 86 per cent of imagesinto their appropriate groups (Fig. 5 and Table I).
Identification of empty fields
Fields containing tissue could be easily identifiedusing the sum of the pixel OD values by setting athreshold of >10 000 a.u. (Fig. 3). Any fields showingvalues which fell below this threshold were excludedfrom the second stage of classification.
Analysis of histological scenes
Maps of the five histological scenes are shown inFigs 6A. Maps of the five scenes based on visual
Fig. 4—Three images from the series illustrating the differences in pixel density and distribution in (i) normal mucosa and(ii) and (iii) adenomatous colorectal mucosa. Textural analysis provides a quantitative measure of these differences and canbe used to discriminate between normal and diseased colorectal mucosa
Fig. 5—A scatterplot of normal and dysplasia images against the two textural features selected bydiscriminant analysis. This shows clear separation of the two groups (-, normal mucosa; X, dysplasticmucosa), with a linear threshold providing an 86 per cent correct classification of the training cases (seeTable I)
71AUTOMATION IN HISTOPATHOLOGY
? 1997 by John Wiley & Sons, Ltd. J. Pathol. 182: 68–75 (1997)

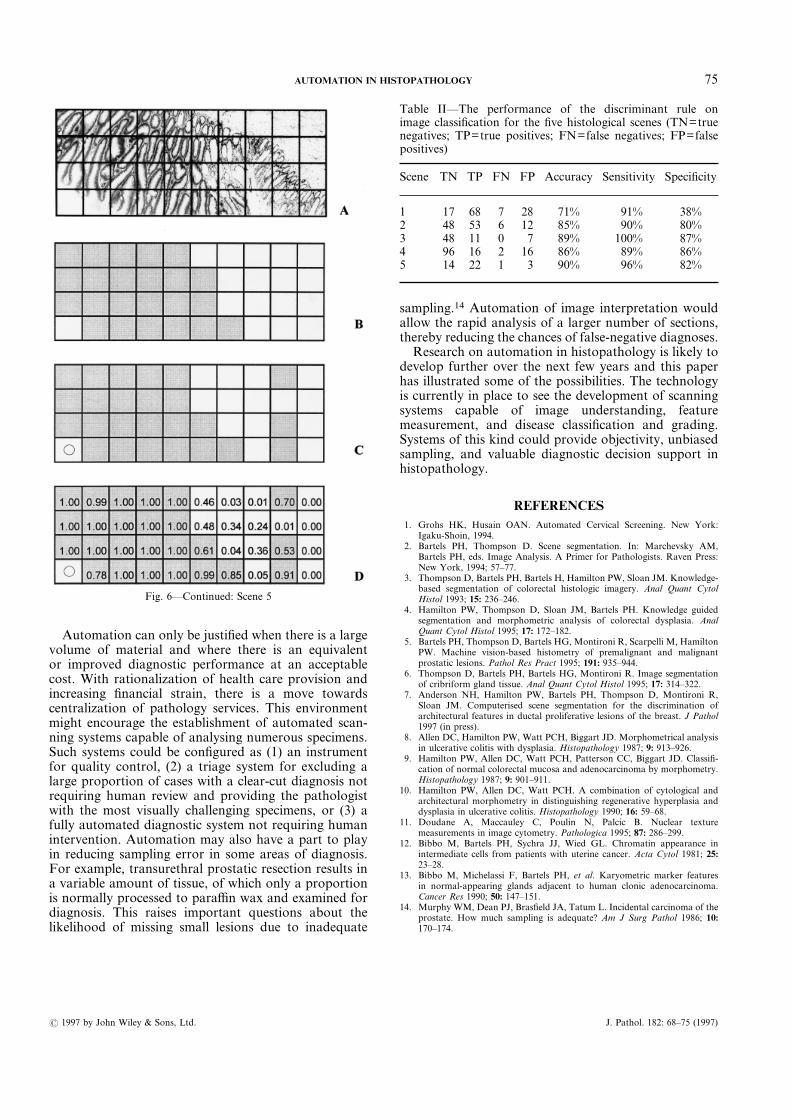
assessment are shown in Figs 6B and were comparedwith automated texture-based classification maps shownin Figs 6C and 6D.The success of the classification rule for the identifi-
cation of abnormal colorectal tissue from the five histo-logical scenes is shown in Table II. In all but scene 1, theaccuracy of image classification exceeded 80 per cent.Specificity for four of the cases was greater than80 per cent. Scene 1 showed a large number of falsepositives (n=28), i.e., normal fields being classified asabnormal, resulting in the lower accuracy and speci-ficity, but a low number of false negatives resulting in ahigh sensitivity. Only 3 per cent of all images wereclassified as normal when they showed abnormalities:sensitivity (positivity in disease) ranged from 89 to 100per cent over the five scenes. When all of the imagesfrom the five scenes were pooled, an overall correctclassification of 83 per cent was obtained.The classification rule was also used to calculate
probability of group membership. These are illustratedin Figs 6D.
DISCUSSION
There are three facets of the diagnostic process whichare subjective and can lead to poor reproducibility.Firstly, there is the visual assessment and grading ofhistological features. Secondly, there is the task ofdeciding what impact a particular observation has onthe diagnostic decision; for example, having observedmild pleomorphism, how likely is it that the lesion ismalignant? It has been repeatedly shown that measure-ment and statistical classification can significantlyimprove the reproducibility of these assessments. Also,with recent developments in machine vision and imageunderstanding, automated image interpretation and his-tological grading are now possible.2,4,6,7 The third facetwhich presents problems is the location of appropriateareas within a histological section for grading, usuallycalled the ‘worst area’. This has been given relativelylittle attention, but can be a major factor contributing todiscordant diagnoses between individuals. It is also animportant aspect of the development of automatedsystems capable of unsupervised analysis of histologicalimages.
The results detailed in this paper present a means oflocating focal areas of abnormality from within largehistological scenes, based on low-power scanning ofimage texture. Using textural analysis in this way, forthe identification of abnormal tissue patterns, couldprovide an automated system with the capability for thepreselection of fields within a tissue section whichdeserve closer scrutiny through glandular identificationand quantitative grading at higher power. This latterfunction can be achieved in an automated fashion using
Table I—Prediction matrix based on the linear classificationrule defined for discrimination of normal mucosa and dys-plastic mucosa using textural features fea321 and fea028. Totalcorrect classification was 86 per cent (kappa value=0·73,P<0·0001)
Actual groupNo. ofimages
Predicted group membership
Normalmucosa
Adenomatousmucosa
Normal mucosa 120 109 (90·8%) 11 (9·2%)Adenomatous mucosa 120 22 (18·3%) 98 (81·7%)
Continued
Fig. 6—Scene 1: This shows the comparison of automated texturalclassification with the conventional visual assessment of scene. Ashows the original digitized scene and its component images. (B) Mapof histological scene, where the shaded squares represent images whichshowed dysplastic mucosa as judged by conventional visual assess-ment. (C) Map of histological scene in which images have beenclassified as containing no tissue (,) or abnormal (shaded) on thebasis of their optical density and textural features. (D) Map ofhistological scene showing the probability of being abnormal on thebasis of image texture
72 P. W. HAMILTON ET AL.
? 1997 by John Wiley & Sons, Ltd. J. Pathol. 182: 68–75 (1997)

knowledge-guided machine vision.3,4 This two-levelstrategy of locating suspicious fields at low powerand segmentation of tissue structures at high powerprovides a possible model for an automated system forhistological diagnosis.In this study the classification of images into normal
and dysplastic, on the basis of their texture, was notperfect. All difficult classification problems inevitablysuffer from a certain proportion of false-positive andfalse-negative classifications and these were recorded foreach histological scene. A majority of the image classi-fications were successful. Scene 1 gave the highest false-positive rate, resulting overall in low accuracy (Table II).This was a fairly complex image, with densely packedglands and an unclear boundary between dysplastic andnormal mucosa. In an automatic system, false-positiveclassification of images is clinically unimportant, asin our proposed scheme they would undergo furthermore detailed analysis for the grading of histologicalabnormalities. One would expect that this more detailed
analysis would reveal that the glands within the imagewere indeed normal and that the image would beexcluded from the assessment. From a technical point ofview, however, the excessive inclusion of false-positiveimages would slow down the scanning process signifi-cantly, thereby increasing the cost of the procedure. It ispossible to adjust the classification rule to reduce thenumber of false-positive images, but as this is done oneincreases the risk of false negatives, an occurrence thatone would wish to avoid. An additional point to con-sider is that quantitative texture analysis may well besensitive to subtle changes in the mucosa which, regard-less of human visual classification, may justify a fullerinterrogation of glandular detail at high power.It is important to note that these sections were
retrieved randomly from slide archives and had not beenstained as a batch. This confirms that the imaging andclassification algorithms described here are relativelyinsensitive to staining variation and should be applicablein a routine histopathology laboratory.
Fig. 6—Continued: Scene 2
73AUTOMATION IN HISTOPATHOLOGY
? 1997 by John Wiley & Sons, Ltd. J. Pathol. 182: 68–75 (1997)

In scene 4, there were a number of false-positiveclassifications. Rather than being a genuine misidentifi-cation of colorectal mucosa, these misclassified regionsmap to an area of the biopsy that shows heat damagedue to the use of a thermal loop for polypectomy.Images showing thermal tissue damage were notincluded in our training image set and unfortunately ourclassification rule identifies these as dysplastic. Again,this is of little clinical concern, as more high-powered
analysis would reveal the lack of glandular structuresand so remove these from the assessment. Nevertheless,it may be possible to define a separate classification rulespecifically for the discrimination of thermal artefactsand dysplastic mucosa. Classification of images couldthen take place on three levels: (1) identification ofimages containing tissue; (2) identification of potentiallydysplastic mucosa; (3) removal of images identified asshowing thermal damage artefact.
Fig. 6—Continued: Scene 3 and 4
74 P. W. HAMILTON ET AL.
? 1997 by John Wiley & Sons, Ltd. J. Pathol. 182: 68–75 (1997)
Automation can only be justified when there is a largevolume of material and where there is an equivalentor improved diagnostic performance at an acceptablecost. With rationalization of health care provision andincreasing financial strain, there is a move towardscentralization of pathology services. This environmentmight encourage the establishment of automated scan-ning systems capable of analysing numerous specimens.Such systems could be configured as (1) an instrumentfor quality control, (2) a triage system for excluding alarge proportion of cases with a clear-cut diagnosis notrequiring human review and providing the pathologistwith the most visually challenging specimens, or (3) afully automated diagnostic system not requiring humanintervention. Automation may also have a part to playin reducing sampling error in some areas of diagnosis.For example, transurethral prostatic resection results ina variable amount of tissue, of which only a proportionis normally processed to paraffin wax and examined fordiagnosis. This raises important questions about thelikelihood of missing small lesions due to inadequate
sampling.14 Automation of image interpretation wouldallow the rapid analysis of a larger number of sections,thereby reducing the chances of false-negative diagnoses.Research on automation in histopathology is likely to
develop further over the next few years and this paperhas illustrated some of the possibilities. The technologyis currently in place to see the development of scanningsystems capable of image understanding, featuremeasurement, and disease classification and grading.Systems of this kind could provide objectivity, unbiasedsampling, and valuable diagnostic decision support inhistopathology.
REFERENCES1. Grohs HK, Husain OAN. Automated Cervical Screening. New York:
Igaku-Shoin, 1994.2. Bartels PH, Thompson D. Scene segmentation. In: Marchevsky AM,
Bartels PH, eds. Image Analysis. A Primer for Pathologists. Raven Press:New York, 1994; 57–77.
3. Thompson D, Bartels PH, Bartels H, Hamilton PW, Sloan JM. Knowledge-based segmentation of colorectal histologic imagery. Anal Quant CytolHistol 1993; 15: 236–246.
4. Hamilton PW, Thompson D, Sloan JM, Bartels PH. Knowledge guidedsegmentation and morphometric analysis of colorectal dysplasia. AnalQuant Cytol Histol 1995; 17: 172–182.
5. Bartels PH, Thompson D, Bartels HG, Montironi R, Scarpelli M, HamiltonPW. Machine vision-based histometry of premalignant and malignantprostatic lesions. Pathol Res Pract 1995; 191: 935–944.
6. Thompson D, Bartels PH, Bartels HG, Montironi R. Image segmentationof cribriform gland tissue. Anal Quant Cytol Histol 1995; 17: 314–322.
7. Anderson NH, Hamilton PW, Bartels PH, Thompson D, Montironi R,Sloan JM. Computerised scene segmentation for the discrimination ofarchitectural features in ductal proliferative lesions of the breast. J Pathol1997 (in press).
8. Allen DC, Hamilton PW, Watt PCH, Biggart JD. Morphometrical analysisin ulcerative colitis with dysplasia. Histopathology 1987; 9: 913–926.
9. Hamilton PW, Allen DC, Watt PCH, Patterson CC, Biggart JD. Classifi-cation of normal colorectal mucosa and adenocarcinoma by morphometry.Histopathology 1987; 9: 901–911.
10. Hamilton PW, Allen DC, Watt PCH. A combination of cytological andarchitectural morphometry in distinguishing regenerative hyperplasia anddysplasia in ulcerative colitis. Histopathology 1990; 16: 59–68.
11. Doudane A, Maccauley C, Poulin N, Palcic B. Nuclear texturemeasurements in image cytometry. Pathologica 1995; 87: 286–299.
12. Bibbo M, Bartels PH, Sychra JJ, Wied GL. Chromatin appearance inintermediate cells from patients with uterine cancer. Acta Cytol 1981; 25:23–28.
13. Bibbo M, Michelassi F, Bartels PH, et al. Karyometric marker featuresin normal-appearing glands adjacent to human clonic adenocarcinoma.Cancer Res 1990; 50: 147–151.
14. Murphy WM, Dean PJ, Brasfield JA, Tatum L. Incidental carcinoma of theprostate. How much sampling is adequate? Am J Surg Pathol 1986; 10:170–174.
Fig. 6—Continued: Scene 5
Table II—The performance of the discriminant rule onimage classification for the five histological scenes (TN=truenegatives; TP=true positives; FN=false negatives; FP=falsepositives)
Scene TN TP FN FP Accuracy Sensitivity Specificity
1 17 68 7 28 71% 91% 38%2 48 53 6 12 85% 90% 80%3 48 11 0 7 89% 100% 87%4 96 16 2 16 86% 89% 86%5 14 22 1 3 90% 96% 82%
75AUTOMATION IN HISTOPATHOLOGY
? 1997 by John Wiley & Sons, Ltd. J. Pathol. 182: 68–75 (1997)


![Histology Slides - mediconotes.commediconotes.com/freenotes/basic/histology_laboratory_slides.pdf[Histology] Histology Slides MedicoNotes provides real laboratory Histological slides](https://img.dokumen.tips/doc/110x75/5ae110e87f8b9a5a668e6aa3/histology-slides-histology-histology-slides-mediconotes-provides-real-laboratory.jpg)


![arXiv:1603.00275v2 [cs.CV] 1 Sep 2016to the recent surge in development of algorithms for histology image analysis. In colorectal cancer, morphology of intestinal glands including](https://img.dokumen.tips/doc/110x75/5f31d72706a8586520416da4/arxiv160300275v2-cscv-1-sep-2016-to-the-recent-surge-in-development-of-algorithms.jpg)