Embed Size (px)
Citation preview

About me
Postgres experience: 12+ years (database systems: 17+)
Founder and CTO of 3 startups (total 30M+ users), all based on Postgres
Founder of #RuPostgres (1600+ members on Meetup.com)
Twitter: @postgresmen
Private consulting practice in the U.S. (SF Bay Area)http://PostgreSQL.support
2

Popularity of Postgres is booming among startups
3
YCombinator HackerNews Hiring Trendshttps://www.hntrends.com/

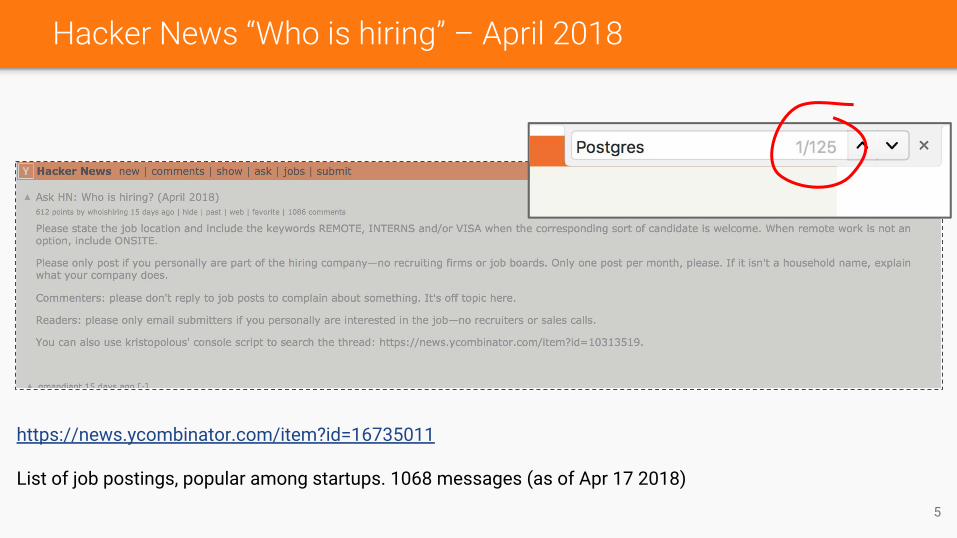
Hacker News “Who is hiring” – April 2018
https://news.ycombinator.com/item?id=16735011
List of job postings, popular among startups. 1068 messages (as of Apr 17 2018)
4
Hacker News “Who is hiring” – April 2018
https://news.ycombinator.com/item?id=16735011
List of job postings, popular among startups. 1068 messages (as of Apr 17 2018)
5

Hacker News “Who is hiring” – April 2018
https://news.ycombinator.com/item?id=16735011
List of job postings, popular among startups. 1068 messages (as of Apr 17 2018)
6

Where are DBAs?
Are they disappearing? Why?
7

Where are DBAs?
Are they disappearing? Why?
● Clouds
● DevOps
● any other reasons?
8

Where are DBAs?
Are they disappearing? Why?
● Clouds
● DevOps
● any other reasons?
What is “new DBA”?
...just “database expert”? ...dbOps?
9

Where are DBAs?
Are they disappearing? Why?
● Clouds
● DevOps
● any other reasons?
What is “new DBA”?
...just “database expert”? ...dbOps?
Speaking of DevOps...
Isn’t it the same/similar story? 10
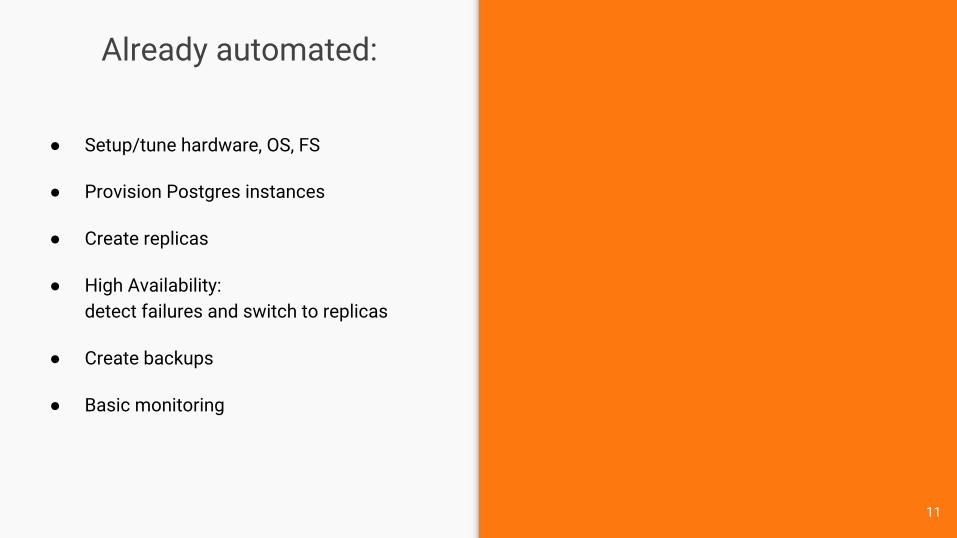
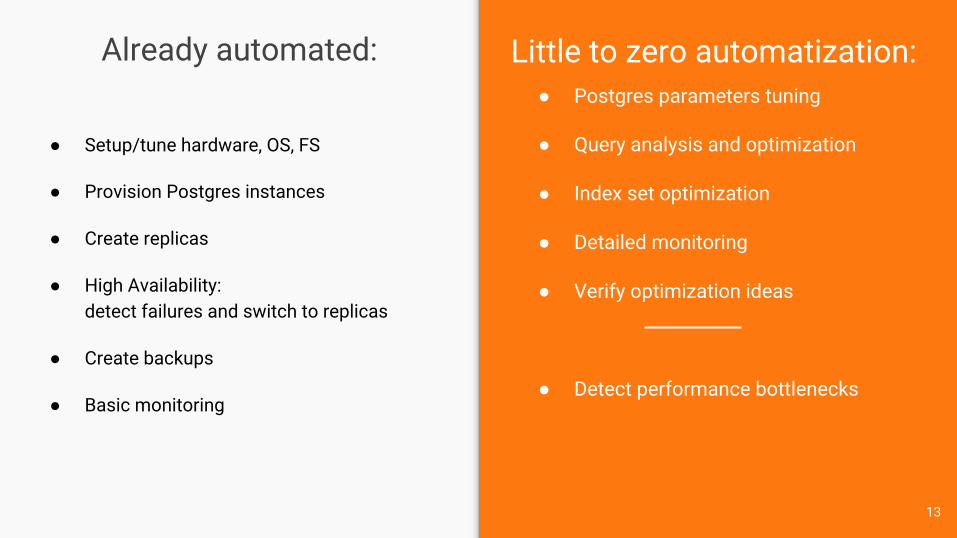
Already automated:
● Setup/tune hardware, OS, FS
● Provision Postgres instances
● Create replicas
● High Availability:detect failures and switch to replicas
● Create backups
● Basic monitoring
11

Already automated:● Postgres parameters tuning
● Query analysis and optimization
● Index set optimization
● Detailed monitoring
● Verify optimization ideas
● Setup/tune hardware, OS, FS
● Provision Postgres instances
● Create replicas
● High Availability:detect failures and switch to replicas
● Create backups
● Basic monitoring
Little to zero automatization:
12
Already automated:● Postgres parameters tuning
● Query analysis and optimization
● Index set optimization
● Detailed monitoring
● Verify optimization ideas
● Detect performance bottlenecks
● Setup/tune hardware, OS, FS
● Provision Postgres instances
● Create replicas
● High Availability:detect failures and switch to replicas
● Create backups
● Basic monitoring
Little to zero automatization:
13

Already automated:● Postgres parameters tuning
● Query analysis and optimization
● Index set optimization
● Detailed monitoring
● Verify optimization ideas
● Detect performance bottlenecks
● Predict performance bottlenecks
● Setup/tune hardware, OS, FS
● Provision Postgres instances
● Create replicas
● High Availability:detect failures and switch to replicas
● Create backups
● Basic monitoring
Little to zero automatization:
14

Already automated:● Postgres parameters tuning
● Query analysis and optimization
● Index set optimization
● Detailed monitoring
● Verify optimization ideas
● Detect performance bottlenecks
● Predict performance bottlenecks
● Prevent performance bottlenecks
● Setup/tune hardware, OS, FS
● Provision Postgres instances
● Create replicas
● High Availability:detect failures and switch to replicas
● Create backups
● Basic monitoring
Little to zero automatization:
The ultimate goal
of automatization15

Manual steps to look into database
psql is great, choice #1 to work with Postgres for many experts
16

Manual steps to look into database
psql is great, choice #1 to work with Postgres for many experts
● \? to see psql commands
● \h to help with SQL (example: “\h select”)
17

Manual steps to look into database
psql is great, choice #1 to work with Postgres for many experts
● \? to see psql commands
● \h to help with SQL (example: “\h select”)
The 1st question: What are the biggest DBs/tables/indexes? Show me the list!
● \l+ to see databases
● \d+ to see tables, views, materialized views, sequences or separately: \dt+, \dv+, \dm+, \ds+
● \di+ to see indexes18

Manual steps to look into database
...but: if your screen is not wide enoughpostgres=# \l+
19

Manual steps to look into database
pspg – a must have if you use psql daily. https://github.com/okbob/pspg postgres=# \l+
20

Manual steps to look into database
Let’s find the biggest databasespostgres=# \l+
It seemsthis database isthe largest one
21

Manual steps to look into database
Let’s find the biggest databasespostgres=# \l+
And this one lookslike #2...
22

Manual steps to look into database
OK. What about tables?test=# \dt+
37 tables, oh..
23

The largest tables – something better than \dt+ is needed
24
How many times did you google things
like this?

Meet postgres_dbapostgres_dba – The missing set of useful tools for Postgres
https://github.com/NikolayS/postgres_dba
25

Meet postgres_dbapostgres_dba – The missing set of useful tools for Postgres https://github.com/NikolayS/postgres_dba
26

Meet postgres_dbaReport #2: sizes of the tables in the current database
27
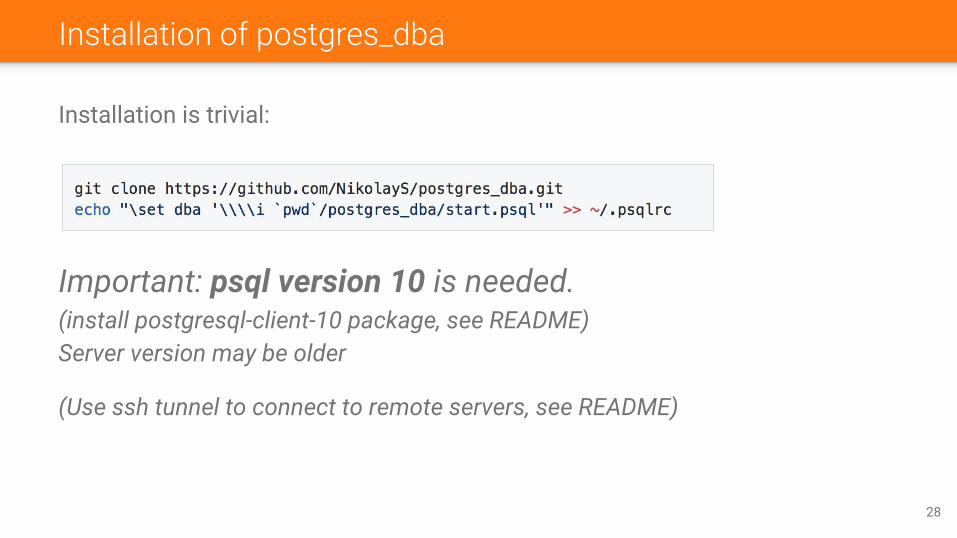
Installation of postgres_dba
Installation is trivial:
Important: psql version 10 is needed.(install postgresql-client-10 package, see README)Server version may be older
(Use ssh tunnel to connect to remote servers, see README)
28

Installation of postgres_dba
Installation is trivial:
Important: psql version 10 is needed. Server version may be older
Now open psql and type ":dba" to launch postgres_dba’s menu.
That’s it.
29

Meet postgres_dbaLet’s continue...
30

Meet postgres_dbaReport #0: Postgres instance info + current DB’s details
31

Table bloat
How can it (fast estimation) be done:
● pg_stat_user_tables, n_dead_tup & n_live_tup – might be very wrong / lagging
32

Table bloat
How can it (fast estimation) be done:
● pg_stat_user_tables, n_dead_tup & n_live_tup – might be very wrong / lagging
● Jehan-Guillaume (ioguix) de Rorthais, Dalibo https://github.com/ioguix/pgsql-bloat-estimation ● PG Experts https://github.com/pgexperts/pgx_scripts/tree/master/bloat ● Data Egret https://github.com/dataegret/pg-utils/tree/master/sql
– similar reports, also might be wrong (see next slides)
33

Table bloat
How can it (fast estimation) be done:
● pg_stat_user_tables, n_dead_tup & n_live_tup – might be very wrong / lagging
● Jehan-Guillaume (ioguix) de Rorthais, Dalibo https://github.com/ioguix/pgsql-bloat-estimation ● PG Experts https://github.com/pgexperts/pgx_scripts/tree/master/bloat ● Data Egret https://github.com/dataegret/pg-utils/tree/master/sql
– similar reports, also might be wrong (see next slides)
● pgstattuple extension, exact but affects performance (don’t run on entire prod database!)
34

Table bloatb1: table bloat estimation
35
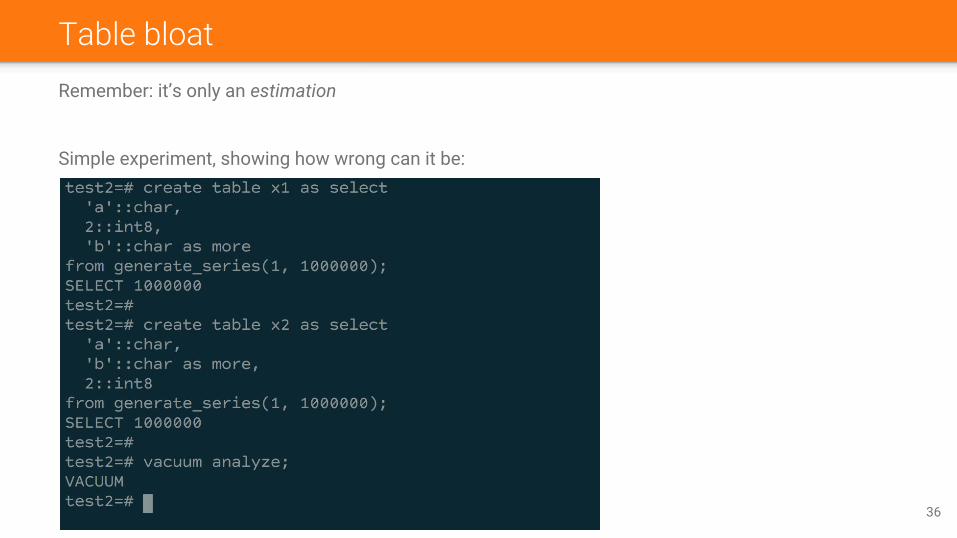
Table bloatRemember: it’s only an estimation
Simple experiment, showing how wrong can it be:
36

Table bloatRemember: it’s only an estimation
Simple experiment, showing how wrong can it be:
37
1 byte, then 8 bytes, then again 1 byte

Table bloatRemember: it’s only an estimation
Simple experiment, showing how wrong can it be:
38
1 byte, then 8 bytes, then again 1 byte
1 byte, 1 byte, then 8 bytes

Table bloatWhat will report “b1” show for our experiment?
39
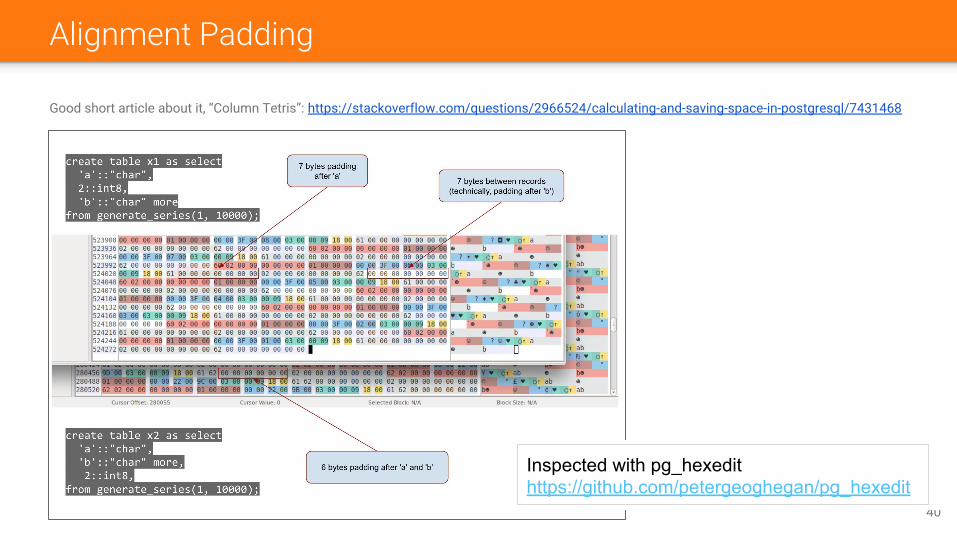
Alignment Padding
Good short article about it, “Column Tetris”: https://stackoverflow.com/questions/2966524/calculating-and-saving-space-in-postgresql/7431468
40
Inspected with pg_hexedithttps://github.com/petergeoghegan/pg_hexedit

Experimental report to see alignment paddingp1 – experimental report showing alignment padding and suggesting column reorder
41

When estimation is not enough
Use pgstattuple module:
● b3 and b4 reports ● don’t run on production!● it’s good if you can do it on a replica – better on an
experimental/temporary one (perhaps, promoted to be a separate master)
Simple approach – clone table:
create table t1_clone as select * from t1;
● And then compare sizes (report 2)● Good way if you don’t have pgstattuple (Heroku, Google Cloud SQL, etc)● Still: better do it on an experimental clone (create a replica and promote)
42

What else?i1 and i2 – find unused and redundant indexes, get rid of them
i1:
i2:
43

What else?s1 – slowest queries (grouped, pg_stat_statements)
44
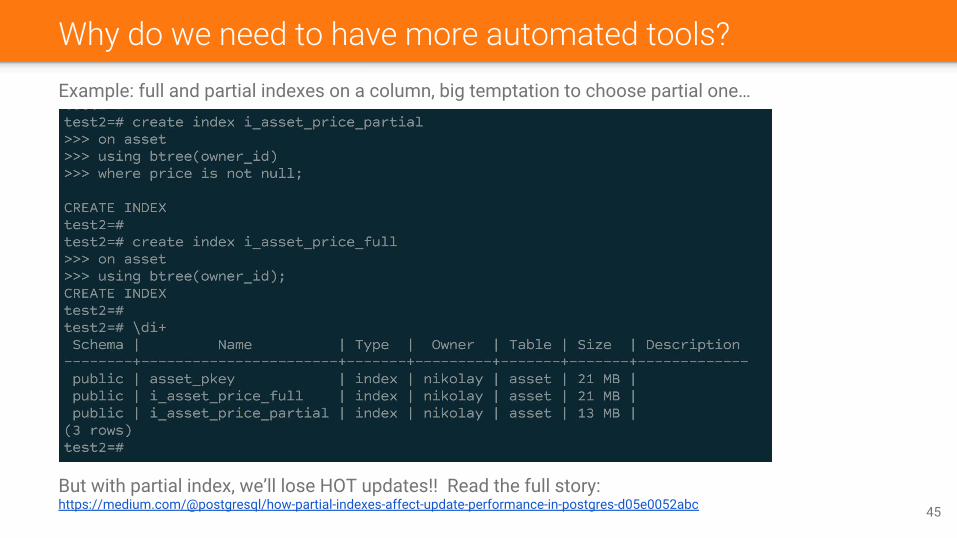
Why do we need to have more automated tools?Example: full and partial indexes on a column, big temptation to choose partial one…
But with partial index, we’ll lose HOT updates!! Read the full story:https://medium.com/@postgresql/how-partial-indexes-affect-update-performance-in-postgres-d05e0052abc 45

How to add your own report
Adding new reports to postgres_dba is trivial:
46

How to add your own report
Adding new reports to postgres_dba is trivial:
47

“Extended” mode
“x” in postgres_dba’s menu will make tables wider
48
More columns, good to debug and good for machines/APIs

postgres_dba: future development
● More reports (pg_statio_**, memory analysis, etc)● API- & monitoring-friendly versions for each report● Better formatting● Brief help for each report + useful links (knowledge base)● Detect [potential] issues and recommend changes
Maybe:
● Snapshots for pg_stat_** and time series analysis● Single-key navigation● Color highlighting● “Active” tools: create/alter/drop a DB user, fix permissions, reset pwd, refresh mat. views, run
pg_repack, etc
Try it now: https://github.com/NikolayS/postgres_dba 49

Back to full-fledged automation
● Detect performance bottlenecks
● Predict performance bottlenecks
● Prevent performance bottlenecks
But how?
50
The ultimate goal
of automatization

How to get a really automated performance control over your database?
The Postgres ecosystem currently gives us:
pg_stat_statements – the default tool for most users, available on AWS RDS.
But:
○ naïve grouping (based on syntax)
○ no historical data
○ no locks/wait events data
○ no disk/FS-level data
○ no sample queries
○ nothing about actual plans51

How to get a really automated performance control over your database?
The Postgres ecosystem currently gives us:
auto_explain – included to postgresql-contrib, available on AWS RDS
But:
○ everything goes to logs, nothing inside Postgres itself
○ no grouping, only individual queries
→ needs some additional tool to get real reports
● weird: file_fdw (log_fdw on RDS) and process inside Postgres
● pgBadger
52

How to get a really automated performance control over your database?
The Postgres ecosystem currently gives us:
pgBadger – the most powerful tool to analyze logs. Lots of reports.
But:
● you need to be a good Postgres expert to work with it
● not always easy/possible to use (e.g. Google Cloud SQL has only error log)
● logs processing approach – even more “reactive” than pg_stat_*
53

How to get a really automated performance control over your database?
Modern monitoring systems are good:
pgHero – free, easy to install, basic things work well
pgAnalyze.com – interesting innovative reports (vacuum activity, log insights)
okmeter.io – great reports helping to find bottlenecks, based on pg_stat_statements
VividCortex – awesome visualizations of slow queries, synced to system graphs
New AWS RDS’s “Database Load” report is awesome
(I’ll skip my “BUTs” for each particular system, it could be another talk) 54

How to get a really automated performance control over your database?
“Ecosystem” tools and modern monitoring systems are good…
BUT:
55

How to get a really automated performance control over your database?
“Ecosystem” tools and modern monitoring systems are good…
BUT:
● They require a lot of manual actions
● You still need to be a database expert
● All of them are reactive
56
Detect performance bottlenecks

Human DBAs are proactive
create table t1 (id int8 primary key, param1 int);
select * from t1 where param1 = :param1;
Observation #1:
An experienced human DBA doesn’t need to wait until t1 grows to 1M records to tell developer: “Hey, you must create an index on param1 column”
Actually, in such cases,DBA won’t wait for any data.
57
Predict performance bottlenecks

Human DBAs know which optimizations are most important
● 280+ config params in postgresql.conf
● thousands of grouped queries in pg_stat_statements
● often spikes in monitoring, swapping, temporary files,
● high level of table bloat, disk space growing too fast,
● checkpoints occur too frequently, etc, etc.
→ We could generate dozens/hundreds of recommendations (and some monitoring systems already have “advices” or “hints”). But which of them matter most?
Observation #2:
An experienced human DBA knows which changes will give the better performance gain right now … and in the future 58
Prevent performance bottlenecks

A human DBA is experimenting a lot
For experienced DBA, it’s usually much better to:
● provision a new replica (thanks, clouds!),● promote it, and● run a bunch of experiments, collect results, and destroy this instance
...than:
● try to verify ideas on dev/test (or – omg – prod) environment, or● just “guess” and deploy.
Observation #3:
An experienced human DBA makes a lot of experiments59

Conclusion
Some new solutions are to appear. They will combine:
● DB-oriented monitoring capabilities (“detection”)
● Ability to find bottlenecks at very early stage (“prediction”)
● Suggest developers how to fix issues (“preventing”)
● And BONUS: automatically verify all ideas(or, perhaps, all DDL? “Continuous Database Administration”?)
60

DIY automated pipeline for DB optimizationHow to automate database optimization using ecosystem tools and AWS?
Analyze:● pg_stat_statements● auto_explan● pgBadger to parse logs, use JSON output● pg_query to group queries better
Configuration:● annotated.conf● pgtune, pgconfigurator, postgresqlco.nf (wip)● ottertune
Suggested indexes● (useful: pgHero, POWA, HypoPG, dexter, plantuner)
Conduct experiments:● pgreplay to replay logs (different log_line_prefix, you need to handle it)● EC2 spot instances
Machine learning● MADlib 61

Conducting experiments
Postgres
temporaryEC2 spot instancePostgres logs from production,
short period of high activity
auto_explain.log_min_duration = 100 msauto_explain.log_timing = onauto_explain.log_analyze = onauto_explain.log_analyze = onauto_explain.log_triggers = onauto_explain.log_verbose = onauto_explain.log_nested_statements = on
pgreplay
Metadata Storage
(permanent)
Collect results:● pg_stat_statements● pg_stat_***● pgBadger (JSON output) with
auto_explain-ed samples
● pgBadger and pgreplay require different log formats (conversion is needed)
● SQL queries from log might expect different DB snapshot (having few errors is OK)
● Big challenge: how to speed up DB snapshot initialization?

Compare results of experiments
Original I-20180416-141109 (details)
-2m23s (-5.23%)
TOTAL
43m08s45m31s
Query Group #1
select from asset where owner_id = ? and price is not null;
11m55s15m03s -3m08s (-20.82%)
Samples (3) Samples (3)
Query Group #2
update asset set price = price + ? where id = ?;
8m38s7m30s +1m08s (+15.33%)
Samples (3) Samples (3)

Meet PostgreSQL.support
AI-based cloud-friendly platform to automate database administration
64
SteveAI-based expert in database tuning
JoeAI-based expert in query optimization and Postgres indexes
NancyAI-based expert in resource planning.Conducts experiments with benchmarks
Sign up for early access:
http://PostgreSQL.support

Main Ideas
1. Automate everything
2. Make more experiments, verify ideas
3. Detect, predict and prevent performance problems
65

Thanks!
Nikolay Samokhvalov
twitter: @postgresmen
http://PostgreSQL.support
66