Embed Size (px)
Citation preview

Auto Sales Forecast 2011
Lacey L. Plache
Chief Economist
Edmunds.com
January 2011
1

2
With the new year upon us, a key question for automotive industry followers is what will happen to automobile sales in 2011. The current economic recovery has followed a sluggish pace to date with GDP growth at about a 2.6% annual rate during the first 6 quarters of recovery. The recovery pace of auto sales has followed suit. Auto sales declined 41% from a seasonally adjusted annual rate (SAAR) of 15.72 million at the beginning of the recession in December 2007 to a low SAAR of 9.32 million in February 2009. As of December 2010, auto sales corresponding to a SAAR of 12.48 million still remain 21% below the rate seen at the recession onset.1 (See Figure 1.) Edmunds.com research indicates that based on the current pace of recovery,2 auto sales can be expected to total 12.9 million in 2011.
Figure 1
In this report, we discuss whether we expect key factors that affect auto sales to differ in 2011 from the recovery to date and thus result in higher or lower sales than 12.9 million. Given excess production capacity in the industry3 and the lack of known constraints on input availability,4 we believe that automakers are well‐positioned to meet any growth in overall consumer demand for vehicles, based on the current mix of vehicles planned to be offered in
1 Bureau of Economic Analysis, Ward’s U.S. SAAR. 2 Adjusted for Cash for Clunkers. 3 According to Ward’s Automotive Group, U.S. capacity utilization for 2010 was 61.7%, including heavy and medium trucks. Data available at http://wardsauto.com/keydata/NACUSummary/. 4 For example, it is unlikely that production would be constrained by labor shortages, given current unemployment rates and the substantial automotive layoffs during recent years.
024681012141618
Dec 2007
Mar 2008
Jun 2008
Sep 2008
Dec 2008
Mar 2009
Jun 2009
Sep 2009
Dec 2009
Mar 2010
Jun 2010
Sep 2010
Dec 2010
SAAR in M
illions
Source: Edmunds.com
Cash for Clunkers
Monthly U.S. Automobile SalesDuring the 2007-09 Recession and Recovery
(Seasonally Adjusted Annual Rate)

3
2011.5 As a result, we believe that supply constraints are unlikely to be a key factor affecting auto sales and that whether sales will deviate from the projected growth path will depend predominantly on demand‐side factors.
Consumer demand for auto purchases is based on three general factors (“the 3 C’s”):
o Cash: The ability to pay o Credit: The ability to borrow o Confidence: The motivation to buy.6
Each of these factors plays a key role in determining the level of auto sales. Another factor that may contribute to changes in the current recovery path of auto sales is pent‐up demand, i.e., exceptionally strong demand that occurs following a period of reduced spending, such as a recession. Currently, there is evidence that sizable pent‐up demand for automobiles could still occur during the recovery: auto sales remain well‐below the pre‐recession highs of over 16 million and below a likely “non‐bubble” norm of 14‐15 million, scrappage has been outpacing new vehicle registration,7 the current fleet is aging.8 For pent‐up demand to occur and for auto sales to deviate from the above projection, one or more of the factors driving demand also will have to change from its recovery course.
We believe that improving credit conditions will have the largest impact on auto sales in 2011, potentially resulting in higher sales than predicted by recovery growth to date. We also expect sales to be noticeably impacted by whether consumers are more motivated to increase
5 Model‐specific production is largely planned in advance for the upcoming year based on previous sales of each model and expectations about consumer preferences in that year, among other factors. However, should consumer preferences change such that a different vehicle mix is demanded (for example, a greater than expected demand for hybrids due to a spike in gas prices), shortages on certain models or vehicle types could occur, which could potentially impact annual sales if manufacturers are unable to meet demand quickly enough and consumer demand for these vehicles is sufficiently inelastic. 6 Our forecast of 12.9 million includes both retail and fleet sales. The breakdown between retail and fleet sales historically has been roughly 80% retail and 20% fleet, and consumer demand and business demand for auto purchases have tended to be highly correlated. Since we expect this relationship to continue in the coming year, we focus on how consumer demand for auto purchases could be affected in the coming year. 7 Through Q2 2010, the most recent data available at this time. Jeffrey Anderson, “Drive Market Share Gains – Automotive Industry Insights: Q2, 2010,” Experian Automotive, p. 7. See also “Polk: Scrappage Rate, Average Vehicle Age Climb,” Mar. 31, 2010, available at http://www.autoremarketing.com/node/6017 (noting that while the Q3 2009 “Cash for Clunkers” program accounted for “thousands” of scrapped units and accordingly raised the scrappage rate for that period, analysts at R.L. Polk & Co. had seen an upward trend in the scrappage rate over the previous 5 years as well). Based on Ward’s and R. L. Polk & Co. data. 8 Experian reports an average vehicle age of 10.3 years as of Q2 2010, the most recent data available at this time. This is up from 10.0 years as of Q2 2009 and continues an ongoing trend of increasing fleet age. Interestingly, the Cash for Clunkers program did not noticeably affect average vehicle age. See Jeffrey Anderson, “Drive Market Share Gains – Automotive Industry Insights: Q2, 2010,” Experian Automotive, p. 7; “Polk: Scrappage Rate, Average Vehicle Age Climb,” Mar. 31, 2010, available at http://www.autoremarketing.com/node/6017. Based on Ward’s and R. L. Polk & Co. data.

their car purchases. At this point, after a mid‐2010 downturn, consumer spirits have been slowly improving in recent months and could combine with “recession weariness” to spur higher than predicted auto purchases in 2011. In addition, the acceptance of President Obama’s recently approved tax plan has reduced uncertainty regarding taxes in the short‐term, thereby allowing consumers to better plan for the next two years and potentially increasing consumer motivation to make auto purchases. The effect of improvements in “Credit” and “Confidence,” however, could be tempered by adverse economic conditions abroad, which could slow or even stall economic recovery in the U.S., and thereby weaken consumer ability to pay (“Cash”) as well as consumer confidence, especially if the U.S. stock markets fall at the same time. Similarly, a strong increase in certain commodity prices, such as gasoline, also could weaken consumer ability to pay and consumer confidence in economic recovery, and, as a result, could weaken the recovery itself.
We further believe that other key components of the “3 C’s” will change little from their current recovery paths, thereby having little effect on our sales projection. For example, we do not expect to see significant increases in business investment beyond the routine replacement and upgrades of software and equipment that have been occurring in recent months, due to the extent of excess industrial capacity. Without significant business expansion, we do not expect employment or income to grow beyond their current paths. Given the excess production, labor, and real estate capacity in the economy, we anticipate that inflation will remain low for the foreseeable future. These factors will not contribute much to moving “Cash” from the current trend. On the “Credit” side, we expect household deleveraging to continue at a similar rate as currently, given the lack of expectation of above‐trend income changes that could allow and motivate deleveraging to occur at a higher rate. The state of the housing market also does not indicate a departure from trend in 2011, with a likely continuation of the current status of high inventory and weak prices and with more foreclosures on the horizon, although a greater than expected weakening in housing prices could also weaken “Confidence.”
In addition, while President Obama’s tax plan has led numerous economists to increase their GDP forecasts for 2011, we are skeptical that the plan will have a significant impact on GDP, or drive auto sales beyond the projected growth rate based on the ability to pay, because the plan contains relatively little new stimulus and the majority of the new stimulus results from a temporary tax cut, a fiscal tool which historically has resulted in relatively little additional consumption due to the propensity of consumers to save the majority of the windfall. As discussed above, the most likely impact from the acceptance of this plan on auto sales will be from increased “Confidence,” not increased “Cash.”
4

Finally, two additional key factors affecting “Confidence” are the types of vehicles offered for sale and the net prices at which they can be obtained by consumers. A number of all‐new models have been introduced in late 2010, or will be introduced in 2011, including a variety of new alternative fuel vehicles and hybrids. However, the contribution of these vehicles to raising auto sales beyond projections remains to be seen. In addition, auto transaction prices have risen in the past year, and there is reason to believe they will continue to increase, as new technologies are added to more and more models. Moreover, incentives have fallen but are likely to remain fairly stable if auto sales continue to increase, with automakers disinclined to slow growth by lowering incentives or to decrease profits by raising incentives when growth is already occurring. The combination of rising prices and lower incentives will act as a counterweight to the attraction of new vehicles and technologies and thus, we do not necessarily expect auto sales to rise beyond projections due to these factors.
To summarize, we expect the projected auto sales of 12.9 million to be impacted as follows by the key demand factors of Cash, Credit, and Confidence:
o Cash: Consumer ability to pay is not likely to improve at faster pace than seen during the recovery to date since we do not expect the key determinants of this factor, income and employment, to vary substantially from the growth trends shown during the recovery to date. Moreover, consumer ability to pay may even decrease if the foreign economic situations worsen and/or if gas or certain other commodity prices increase substantially. The temporary nature of the recently approved 2% payroll tax cut implies that it is likely to be saved rather than spent, and thus will have very little, if any, effect on consumption. Business investment is unlikely to increase substantially, despite incentives, due to existing excess capacity.
o Credit: Consumer ability to borrow should improve as credit conditions are likely to improve at a rate faster than previously, if recent trends in credit availability continue and household deleveraging remains steady. Ongoing weakness in the housing market, however, will continue to constrain the ability to borrow.
o Confidence: Consumer motivation to make auto purchases will likely increase in the coming year as recession‐weary consumers (and the stock market) continue to view any positive economic indications as evidence of ongoing economic recovery. After downturns earlier last year, consumer confidence and, especially, consumer sentiment have shown some improvement in recent months, likely in part due to the acceptance of President Obama’s tax plan resolving uncertainty regarding tax increases. However, confidence gains may reverse if the economic situations abroad worsen and the stock market falls in
5

6
response. Confidence may also deteriorate if gas prices continue to rise and/or housing values fall further.
As a result, we believe auto sales of 12.9 million in 2011 are reasonable to expect and perhaps even conservative.
Cash: The Ability to Pay
The first of the “3 C’s” driving consumer demand for automobiles is the ability of consumers to pay, whether up front for cash purchases of autos or over time for financed purchases. The recent recession seriously impaired the ability of many consumers to purchase automobiles, with the resulting drop in auto sales discussed above. There has been some recovery in auto sales to date, indicating an improvement in the ability to pay for at least some consumers. Not surprisingly, what will happen to the ability to pay in the next year depends primarily on employment status and income levels, which in turn are driven by the strength of supply and demand for labor in the economy.
Employment and Income
During the recent recession, the unemployment rate soared to a peak of 10.1% in October 2009. Since that time, real GDP growth has not been sufficient to bring down unemployment and it stubbornly has remained just below 10%.9 (See Figure 2a.) In addition, job creation has been slow and has fallen well short of the 250,000 or more gains per month that are expected to characterize the early stages of a recovery.10 (See Figure 2b.)
9 While the unemployment rate did recently fall to 9.4% in December 2010, this drop appears to reflect a shrinking labor supply, as job searchers give up and exit the market, rather than a true improvement in economic conditions. “Employment Situation,” Jan. 7, 2011, http://www.bloomberg.com/markets/economic‐calendar/. 10 Most recently, in December 2010, 103,000 nonfarm payroll and 113,000 private sector payroll jobs were created. Besides falling short of gains needed to fuel a recovery, these gains were much less than consensus projections of 160,000 and 180,000, respectively. “Employment Situation,” Jan. 7, 2011, http://www.bloomberg.com/markets/economic‐calendar/.

7
Figure 2a
Figure 2b
9.4%
0%
2%
4%
6%
8%
10%
12%
Dec 2007
Apr 2008
Aug 2008
Dec 2008
Apr 2009
Aug 2009
Dec 2009
Apr 2010
Aug 2010
Dec 2010
Unemployment Rate (Seasonally Adjusted)
Source: Bureau of Labor StatisticsSource: Bureau of Labor Statistics
10.1%
(900)
(700)
(500)
(300)
(100)
100
300
500
Dec 2007
Apr 2008
Aug 2008
Dec 2008
Apr 2009
Aug 2009
Dec 2009
Apr 2010
Aug 2010
Dec 2010
Monthly Jobs Added(Seasonally Adjusted)
Source: Bureau of Labor Statistics
(x 1,000)
Adding 250,000+ jobs per month is
considered a healthy rate for recovery

8
As a result of the lack of substantial improvement in employment, nominal income growth has been sluggish. (See Figure 3.) Nominal income growth is not expected to improve until the unemployment rate improves markedly; yet, even if GDP grows at 3 to 4% (i.e., in the higher range of projections) in 2011, unemployment is likely to fall only about 1 percentage point during that period, suggesting that income growth is not likely to move much beyond the current growth path in the coming year.
Figure 3
President Obama’s Tax Plan
The recently approved Obama tax plan, which maintained Bush era tax rates and long‐term unemployment benefits and offered some new stimulus in the form of a 2% payroll tax cut for 2011 among other benefits, led many economists to revise their 2011 GDP growth forecasts upward.11 While some cited the net new stimulus added by the plan as a basis for improved forecasts, we do not expect this new stimulus to have a particularly strong effect on GDP growth due to the nature of the stimulus, i.e., a temporary tax cut. Historically, temporary tax cuts have increased savings rates, rather than consumption, with the result that the 11 For example, Bank of America Merrill Lynch’s US Economics group increased its forecast from 2.3% to 2.8% as a result of the new fiscal package. Bank of America Merrill Lynch, US Economic Weekly, “A big dose of caffeine,” Dec. 10, 2010. See also Robin Harding, “Economists raise forecasts for 2011 US growth,” FT.com, Dec. 7, 2010, available at, http://www.ft.com/cms/s/0/54e31da6‐022f‐11e0‐aa40‐00144feabdc0.html#axzz1AOKGbNf5.
‐2%
‐1%
0%
1%
2%
3%
4%
Q4 2007
Q1 2008
Q2 Q3 Q4 Q1 2009
Q2 Q3 Q4 Q1 2010
Q2 Q3
Growth in Nominal Disposable Personal Income
Source: Philadelphia Fed
0%

9
multiplier for such stimulus is well under 1 and has been estimated to be 0.3 or less.12 For example, a recent one‐time tax rebate offered as part of President Bush’s 2008 $168 billion economic stimulus plan resulted in the personal savings rate increasing from 2.7% in Q1 2008 to 4.8% in Q2 2008 (checks were mailed in late April 2008). Although real personal disposable income increased at a 9% annual rate during this period, real consumer spending was flat and real GDP expanded just 0.6% at an annual rate.13 Moreover, auto sales fell during each month in Q2 2008. The new net stimulus from the current tax plan is estimated at $100 billion, of which $60 billion is attributed to the net impact of the payroll tax cut.14 Even assuming an historically high multiplier of 0.3, the implied impact of the tax cut will be just an additional $30 billion, or an additional 0.2 percentage point of GDP growth.15
Certain industry observers have suggested that the greater impact of the plan for consumer ability to pay will come from business expansion, inducing job creation, following the resolution of uncertainty regarding consumer tax rates. Given that the expiration of the Bush tax rates could have resulted in a $200 billion tax shock to the economy, they argue that the extension of these rates and the elimination of the uncertainty regarding this potential shock (at least for the next two years) are likely to result in greater business investment. We agree that this is a possibility but expect it to be tempered by existing excess production capacity in the economy as well as by uncertainty about the worsening debt situation in Europe and concerns about the impact of overheating economies in China and other emerging markets. Thus, we do not expect to see significant increases in business investment beyond the recent trend, in which investment typically has been limited to the routine replacement and upgrades of software and equipment.
Economies Abroad: Europe, China, Emerging Markets
The ability of U.S. consumers to pay for automobiles also can be affected by the economic situations in other countries due to the interdependence of the U.S. economy and the economies of these countries. In particular, exports account for roughly 12% of U.S. GDP and have been growing nearly 5 times as fast as the rest of the economy, thereby doing more
12 See, e.g., John F. Cogan, Tobias Cwik, John B. Taylor, and Volker Wieland, “New Keynesian versus Old Keynesian Government Spending Multipliers,” Manuscript (Feb. 2009); John B. Taylor, “The Lack of an Empirical Rationale for a Revivial of Discretionary Fiscal Policy,” American Economic Review, Papers and Proceedings, Vol. 99, No. 2 (May 2009). 13 See, e.g., David A. Rosenberg, “Breakfast with Dave: Market Musings and Data Deciphering,” Gluskin Sheff Economic Commentary, Dec. 13, 2011; John B. Taylor, “The Lack of an Empirical Rationale for a Revivial of Discretionary Fiscal Policy,” American Economic Review, Papers and Proceedings, Vol. 99, No. 2 (May 2009). 14 The other $40 billion is estimated to come from the net impact of the estate tax and the ability of businesses to accelerate depreciation expensing. See Bank of America Merrill Lynch, US Economic Weekly, “A big dose of caffeine,” Dec. 10, 2010, pp. 2‐3. 15 Based on GDP for Q3 2010, SAAR, 3rd revision, Dec. 22, 2010, available at http://www.bea.gov/newsreleases/national/gdp/gdpnewsrelease.htm.
10
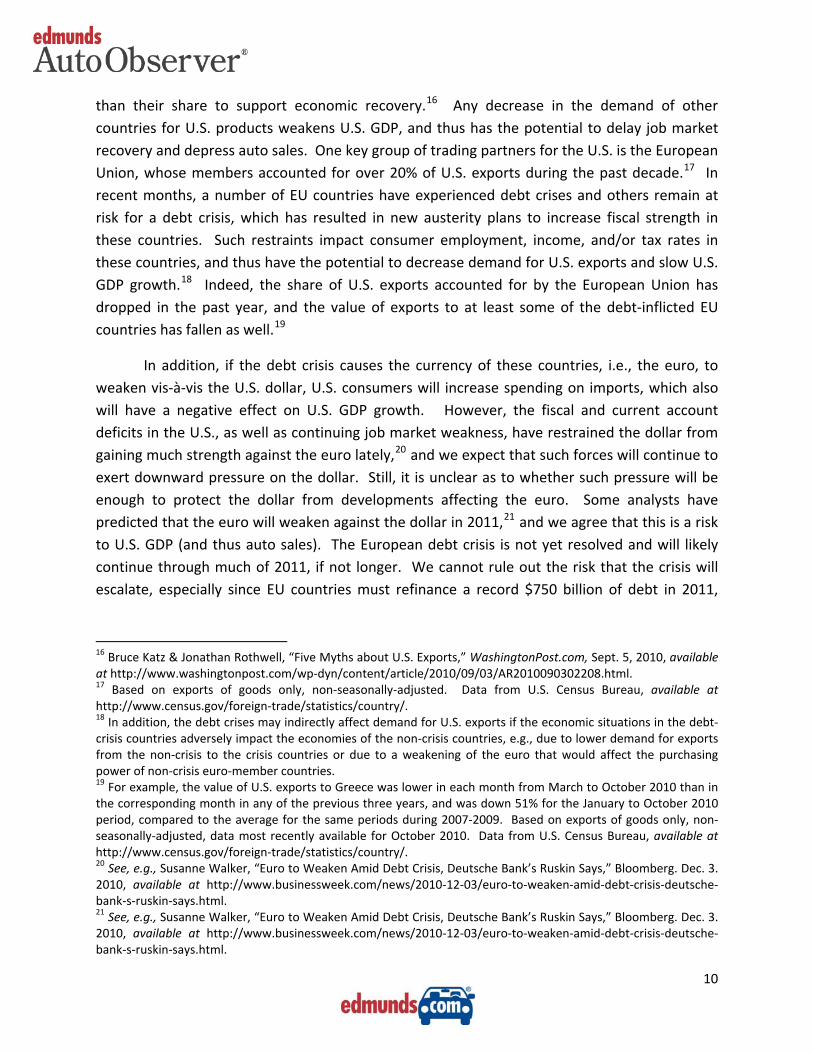
than their share to support economic recovery.16 Any decrease in the demand of other countries for U.S. products weakens U.S. GDP, and thus has the potential to delay job market recovery and depress auto sales. One key group of trading partners for the U.S. is the European Union, whose members accounted for over 20% of U.S. exports during the past decade.17 In recent months, a number of EU countries have experienced debt crises and others remain at risk for a debt crisis, which has resulted in new austerity plans to increase fiscal strength in these countries. Such restraints impact consumer employment, income, and/or tax rates in these countries, and thus have the potential to decrease demand for U.S. exports and slow U.S. GDP growth.18 Indeed, the share of U.S. exports accounted for by the European Union has dropped in the past year, and the value of exports to at least some of the debt‐inflicted EU countries has fallen as well.19
In addition, if the debt crisis causes the currency of these countries, i.e., the euro, to weaken vis‐à‐vis the U.S. dollar, U.S. consumers will increase spending on imports, which also will have a negative effect on U.S. GDP growth. However, the fiscal and current account deficits in the U.S., as well as continuing job market weakness, have restrained the dollar from gaining much strength against the euro lately,20 and we expect that such forces will continue to exert downward pressure on the dollar. Still, it is unclear as to whether such pressure will be enough to protect the dollar from developments affecting the euro. Some analysts have predicted that the euro will weaken against the dollar in 2011,21 and we agree that this is a risk to U.S. GDP (and thus auto sales). The European debt crisis is not yet resolved and will likely continue through much of 2011, if not longer. We cannot rule out the risk that the crisis will escalate, especially since EU countries must refinance a record $750 billion of debt in 2011,
16 Bruce Katz & Jonathan Rothwell, “Five Myths about U.S. Exports,” WashingtonPost.com, Sept. 5, 2010, available at http://www.washingtonpost.com/wp‐dyn/content/article/2010/09/03/AR2010090302208.html. 17 Based on exports of goods only, non‐seasonally‐adjusted. Data from U.S. Census Bureau, available at http://www.census.gov/foreign‐trade/statistics/country/. 18 In addition, the debt crises may indirectly affect demand for U.S. exports if the economic situations in the debt‐crisis countries adversely impact the economies of the non‐crisis countries, e.g., due to lower demand for exports from the non‐crisis to the crisis countries or due to a weakening of the euro that would affect the purchasing power of non‐crisis euro‐member countries. 19 For example, the value of U.S. exports to Greece was lower in each month from March to October 2010 than in the corresponding month in any of the previous three years, and was down 51% for the January to October 2010 period, compared to the average for the same periods during 2007‐2009. Based on exports of goods only, non‐seasonally‐adjusted, data most recently available for October 2010. Data from U.S. Census Bureau, available at http://www.census.gov/foreign‐trade/statistics/country/. 20 See, e.g., Susanne Walker, “Euro to Weaken Amid Debt Crisis, Deutsche Bank’s Ruskin Says,” Bloomberg. Dec. 3. 2010, available at http://www.businessweek.com/news/2010‐12‐03/euro‐to‐weaken‐amid‐debt‐crisis‐deutsche‐bank‐s‐ruskin‐says.html. 21 See, e.g., Susanne Walker, “Euro to Weaken Amid Debt Crisis, Deutsche Bank’s Ruskin Says,” Bloomberg. Dec. 3. 2010, available at http://www.businessweek.com/news/2010‐12‐03/euro‐to‐weaken‐amid‐debt‐crisis‐deutsche‐bank‐s‐ruskin‐says.html.

11
among other factors, and we thus believe that downside risk exists for U.S. auto sales as projected.
The economic situations in China and other emerging markets, while different from those in Europe, also have the potential to adversely affect the balance of trade between the U.S. and these countries and thereby constrain U.S. GDP growth. Many of these countries, including China, India, and Brazil, have been experiencing strong growth in recent years. China, for example, has had roughly 10% growth in real GDP on average for the past few years.22 The strength of these economies has helped support the U.S. economy during the 2007‐09 recession and recovery. U.S. exports to these countries have grown significantly in recent years, increasing their share of total U.S. exports.23 However, there have been signs of late that at least some of these economies, including, importantly, China, are overheating and that inflation is rising. This raises the possibility that central banks in these countries may act to curb inflation by raising interest rates, and in fact, China, for one, has increased its interest rate several times in recent months. If interest rate increases successfully slow domestic economic expansion as intended, demand for U.S. exports also will decrease, putting downward pressure on U.S. GDP growth and thus auto sales. We believe there is some risk to overheating economies in China and other emerging markets affecting U.S. auto sales as projected.
Gasoline Prices
Another factor affecting consumer ability to pay is the cost of other items in their monthly budgets. As the prices for these items rise (fall), consumers have less (more) available income for other expenditures, such as to make payments on an auto loan, holding quantities purchased constant. Recent upward trends in gasoline prices raise the question of what effect gas prices could have on consumer ability to pay if prices continue to rise in 2011. Gasoline consumption is relatively inelastic; for example, research has shown that each cent‐per‐gallon increase in the price of gasoline reduced gasoline consumption by about 0.2%, mainly in terms of miles traveled (as opposed to switching to a more fuel efficient vehicle).24 However, gasoline expenditures only accounted for roughly 5% of consumer expenditures during 2007‐2009.25 In addition, for consumers buying a new vehicle, the impact of increases in gasoline prices can be
22 Data from CIA, The World Factbook, available at https://www.cia.gov/library/publications/the‐world‐factbook/geos/. 23 Based on exports of goods only, non‐seasonally‐adjusted. Data from U.S. Census Bureau, available at http://www.census.gov/foreign‐trade/statistics/country/. 24 Antonio Bento, et al, “Distributional and Efficiency Impacts of Increased U.S. Gasoline Taxes,” manuscript, July 2006, p. 30. 25 Bureau of Labor Statistics, “Consumer Expenditures—2009,” Oct. 5, 2010, available at http://www.bls.gov/news.release/cesan.nr0.htm.

12
limited by buying a more fuel efficient vehicle.26 Given these factors, while we acknowledge that the possibility exists for gasoline prices to impact the ability to pay for a new vehicle, we think that such an impact is likely to be small. As discussed below, we think it is more likely that rising gas prices will negatively impact auto sales by decreasing consumer motivation to buy.
Credit: The Ability to Borrow
The second of the “3 C’s” driving consumer demand for autos involves the ability of consumers to borrow. This is a key factor since almost 75% of automotive purchases are made with a financing component.27 The ability to borrow can be broken down into lender offerings (e.g., the availability of credit and the associated terms) and borrower qualifications (e.g., risk factors, such as credit scores and debt‐to‐income ratios)
Lender Balance Sheets and Terms of Lending
The recent banking collapse resulted in a substantial tightening of lending as banks and other lenders scrambled to address seriously damaged balance sheets resulting from an over‐loosening of credit terms on a wide variety of loans, including auto loans. As part of the financial reforms resulting from the recent banking collapse, banks and other financial institutions have been required to increase their capital reserves and the availability of credit has tightened as lenders imposed more stringent borrowing requirements, in particular for borrowers with non‐prime and sub‐prime credit ratings. As reforms have been implemented, lender balance sheets have improved in recent months and there is now evidence of growing strength in auto loans portfolios. For example, a recent Experian report for Q3 2010 found the highest risk segments decreasing and improved delinquencies in auto loan portfolios.28 Experian found that 30‐day and 60‐day delinquencies both dropped in Q3 2010, compared with Q3 2009. The 30‐day delinquency fell 8.43% (from 3.27% to 2.99% delinquencies). The 60‐day delinquency rate fell 17.39% (from 0.93% to 0.77% delinquencies). In addition, repossessions and charge‐offs are down, as are balances of delinquencies, with the total dollar volume of loans at risk of default dropping by $6.4 billion.29
26 In some cases, improvements in fuel economy across fleets may mean that a consumer buying a new vehicle can counter increases in expenditures due to higher gas prices without even having to switch to a different class of vehicle. 27 According to http://www.newcars.com/how‐to‐buy‐a‐new‐car/auto‐financing.html, 73% of new car purchases are financed, either through loans or leasing. 28 Melinda Zabritski, “State of the Automotive Finance Market, Third Quarter 2010,” Experian Automotive, Dec. 2010. 29 Melinda Zabritski, “State of the Automotive Finance Market, Third Quarter 2010,” Experian Automotive, Dec. 2010.

13
As lenders’ balance sheets have improved, competition has grown. Increased competition as well as a more favorable or less uncertain economic outlook have led some lenders to ease credit standards.30 Indeed, there are signs that credit conditions are loosening for automotive customers. Experian recently reported that the share of new auto loans to customers with credit scores at subprime and lower levels increased by 12.7% in Q3 2010, compared with Q3 2009.31 Specifically, the Experian report showed that the share of new loans to nonprime customers (those with a 620 to 679 credit score) rose from 9.79% in Q3 2009 to 10.86% in Q3 2010. For subprime customers (with credit scores from 550 to 619), the share of loans increased from 5.66% to 6.61%, while the share of loans to deep‐subprime customers (credit scores below 550) rose from 1.46% to 1.59%.32 In addition, the average credit score for a new vehicle customer in Q3 2010 fell by six points to 769 from 775 in Q3 2009.33 These data suggest a shift may have occurred with respect to credit conditions for auto loans.34 If so, we expect auto sales to expand more rapidly than expected in 2011.
Interest Rates
During the tightening of credit terms during the recession, average nominal interest rates rose to 8.4% and 10.0% for new and used car financing, respectively. They subsequently fell to near record lows and remain around 4% for new and 8% for used car financing. (See Figure 4.) Despite expansionary monetary policy, interest rates for new and used vehicles have barely moved. Given the slack in the economy which is unlikely to markedly decrease in 2011, it is also unlikely monetary policy will tighten or interest rates rise substantially in 2011. As a result, we do not expect interest rate shocks to noticeably affect projected auto sales in 2011.
30 See, e.g., Federal Reserve Board, Senior Loan Officer Opinion Survey on Bank Lending Practices, Oct. 2010, http://www.federalreserve.gov/boarddocs/snloansurvey/201011/default.htm. 31 Melinda Zabritski, “State of the Automotive Finance Market, Third Quarter 2010,” Experian Automotive, Dec. 2010. 32 Changes in the risk distribution of auto loans are best measured on a quarter over quarter basis since auto loans tend to be highly cyclical. For example, an uptick in subprime and below loan share from Q4 of one year to Q1 of the next is a normal occurrence. 33 Melinda Zabritski, “State of the Automotive Finance Market, Third Quarter 2010,” Experian Automotive, Dec. 2010. 34 While comparable data are not yet available for Q4 2010, increased SAARs for auto sales in each month of Q4 2010 suggest that the credit conditions continued to improve in that quarter.

14
Figure 4
Household Balance Sheets
On the borrower side of “Credit,” the recession also found household balance sheets in similarly serious condition, having reached peak debt‐to‐income ratios of 130% in Q3 2007.35 These levels far surpassed historical levels of 60%‐90% during the 1960s through the 1990s. These debt loads have negatively impacted consumer credit worthiness, which is turn has affected automobile sales. It is expected that the household deleveraging cycle will take roughly ten years. Since Q3 2007, households have reduced debt to 118% of income, as of Q3 2010. Since income growth is not expected to pick up substantially in 2011, it is unlikely that debt‐to‐income ratios will improve at a faster rate in the next year either. Given this, we do not expect auto sales to deviate from projections due to accelerated deleveraging.
Housing Market
A key source of the weakness in both lender and household balance sheets stems from excessive, and in many cases bad, mortgage debt. Foreclosures have been down in recent months due to the institution of reforms to address substandard foreclosure practices and
35 Based on household debt, including mortgages and credit debt, and nominal personal disposable income, which is income net of tax liabilities.
0%
2%
4%
6%
8%
10%
12%
Jan 2005
Jul 2005
Jan 2006
Jul 2006
Jan 2007
Jul 2007
Jan 2008
Jul 2008
Jan 2009
Jul 2009
Jan 2010
Jul 2010
Nominal Interest Rates on Auto Loans
New UsedSource: Federal Reserve
15
inadequate documentation by the banks. However, more are expected in 2011. Excess supply remains a critical issue with two million loans currently in the foreclosure process and another 2.4 million in arrears. In addition, in the aftermath of the expiry of the tax credits, home prices have fallen for several months in succession — a string that has not occurred since the dismal March‐May 2009 period. Given the continuing issues in the housing market, we do not expect this component of balance sheets to improve markedly in the coming year or, as a result, noticeably improve the ability to borrow. Indeed, the housing market may even have a negative effect on credit conditions for automotive borrowers (and thus auto sales) if the situation worsens more than expected.
Confidence: The Motivation to Buy
The third of the “3 C’s,” consumer motivation to buy, is influenced by a variety of factors. These factors include consumer attitudes regarding economic conditions (including job security and wealth), financial values, and government policy, and the types and prices of vehicles offered.
Consumer Attitudes
Consumer attitudes about the economy are measured primarily by surveys which question consumers on their personal financial conditions and on their views regarding general economic conditions, both current and future. These are directly related to the strength of consumer spending. The two key surveys that track consumer attitudes are The Conference Board’s survey, which is said to track “consumer confidence,” and the University of Michigan’s survey, which is said to track “consumer sentiment.” Both measures have risen recently, after several months of lower results during the summer of 2010. (See Figures 5 and 6.) Indeed, it appears that consumer spirits may be lagging consumer spending (on auto sales in particular), suggesting that as spirits catch up, spending may rise further.36 If this is the case, pent‐up demand for automobiles may occur, thereby resulting in higher than projected auto sales in 2011.
36 While encouraging, we do not want to overstate the recent increases, since both confidence measures remain below their pre‐recession highs and below previous levels reached earlier during the recession and recovery. The key point here is that if confidence improves more in 2011 than during the recovery to date, this could result in higher than projected auto sales, and the recent upward trend suggests that more improvement may be on the horizon.

16
Figure 5
Figure 6
20
30
40
50
60
70
80
90
100
Dec 2007
Apr 2008
Aug 2008
Dec 2008
Apr 2009
Aug 2009
Dec 2009
Apr 2010
Aug 2010
Dec 2010
Consumer Confidence Index
Source: The Conference Board
0102030405060708090
Dec 2007
Apr 2008
Aug 2008
Dec 2008
Apr 2009
Aug 2009
Dec 2009
Apr 2010
Aug 2010
Dec 2010
Consumer Sentiment Index
Source: University of Michigan

17
However, lagging consumer spirits also may reflect a new cautiousness, or even pessimism, resulting from the recent recession and the sluggish recovery. For many, a shift in financial values has followed the recession, as mending household balance sheets and job and income issues require a greater personal austerity. The need for this austerity, which will likely continue at least until marked gains in income and employment occur, is thus not likely to abate substantially in the coming year. Despite this, we believe that greater personal austerity will not completely restrain growth in auto sales. Rather, this austerity will likely be tempered by the tendency of “recession‐weary” consumers to view any positive economic data as evidence of ongoing recovery and to respond by increasing spending, including on autos.
Gasoline prices
Gasoline prices steadily rose during the latter part of 2010, and, as a result, the 2010 annual average retail price of $2.78 was nearly 20% higher than the 2009 average of $2.35. (See Figure 7.) As gas prices inched toward the $3.00 per gallon mark, hitting $2.99 on average in December 2010, there has been much talk of whether gas prices will continue to rise during 2011 and of how high they could rise. While the U.S. Energy Information Administration forecasts gas prices at $3.17 per gallon on average during 2011, it also acknowledges that “there is significant uncertainty surrounding this forecast” and does not rule out the possibility of gasoline prices hitting $3.50 or even $4 per gallon during the summer and/or early fall of 2011, based on current market prices for futures and options contracts for gasoline.37 Higher gasoline prices can have some impact on auto sales if they increase short‐term demand by leading consumers to swap out their current vehicles for more fuel efficient models, sooner than they would have otherwise purchased a new vehicle. The most recent episode of spiking gas prices in summer 2008 did, in fact, motivate consumers to buy new, more fuel efficient vehicles on an accelerated replacement schedule; however, the net effect on auto sales was difficult to determine since many automakers either lacked adequate fuel efficient product offerings or had insufficient stocks of their most fuel efficient vehicles, and shortages ensued.38 Since 2008, automakers have made efforts to address the problem by increasing fuel efficiency in their fleets and introducing new high fuel efficient vehicles, such as the much publicized Chevy Volt and Nissan Leaf.39 Automakers now claim that they will be able to meet consumer demand for high fuel efficient vehicles if gas prices spike in 2011.40 As a result of automaker
37 Forecasts are for regular‐grade motor gasoline retail prices. U.S. Energy Information Administration, “Short‐Term Energy Outlook,” Jan. 11, 2011 release, available at http://www.eia.gov/emeu/steo/pub/contents.html. The EIA’s forecast assumes U.S. real GDP growth of 2.2% in 2011, which is well below many current projections of 3‐4%. Should GDP growth be higher, demand for oil and gasoline could rise, putting upward pressure on prices. 38 In addition, auto sales were depressed during 2008 by the deepening recession. 39 See, e.g., Dan Shapley, “The Most Fuel‐Efficient Cars of 2011,” available at http://www.thedailygreen.com/environmental‐news/latest/fuel‐efficient‐cars‐47102201#fbIndex1. 40 See, e.g., Dale D. Buss, “Will Higher Gasoline Prices Kill the Industry’s Buzz?,” www.autoobserver.com.

18
efforts, it is possible that should gas prices rise sufficiently in 2011, an even greater number of auto owners than usual may be tempted to switch to more fuel efficient vehicles due to the greater set of choices available to them.
However, past experience has shown that consumers are much more likely to react to higher gasoline prices by switching to new vehicles at an accelerated rate of vehicle replacement when gas prices rise suddenly, as in 2008. Gradual increases in gas prices do not tend to have as strong an effect on auto sales.41 Furthermore, adverse shocks to economies abroad could decrease their consumption of crude oil, thereby putting downward pressure on prices of oil and, as a result, retail gasoline. For example, if austerity measures in Europe result in decreased government and/or consumer spending, both manufacturing and consumer demand for oil and gasoline will decrease. Given these factors, we do not necessarily expect to see the kinds of increases in gasoline prices that would cause auto sales to rise above projections in 2011. On the other hand, while increasing gas prices can be a sign of economic recovery due to greater demand for oil, consumers may lose confidence in the recovery if improvements in employment and income do not keep pace with price increases. In this case, which we see as a somewhat larger risk, rising gas prices could even decrease auto sales in 2011 if they cause consumer confidence to weaken and consumers to hold back on auto purchases as a result.
Figure 7
41 Rebecca Lindland, “Light Vehicle Outlook,” Presented at the SAA Automotive Outlook Conference, Jan. 9, 2011.
$ 2.99
$0 $0.50 $1.00 $1.50 $2.00 $2.50 $3.00 $3.50 $4.00 $4.50
Dec 2007
Apr 2008
Aug 2008
Dec 2008
Apr 2009
Aug 2009
Dec 2009
Apr 2010
Aug 2010
Dec 2010
National Average Retail Gasoline Prices
Source: U.S. Energy Information Administration

19
Political climate
Consumer motivation to buy is influenced by the political climate and consumer beliefs that government policy will support economic growth, as well as by uncertainty about policy changes. For example, while President’s Obama tax plan will not substantially increase the ability of consumers to pay for automobile purchases, it is quite likely that there are consumers who were delaying such purchases until they knew what tax rates they would face in the coming year. We expect pent‐up demand represented by these consumers to increase auto sales beyond the projected rate in 2011.
Vehicles Types and Prices
Two additional key factors affecting “Confidence” are the types of vehicles offered for sale and the net prices at which they can be obtained by consumers. Studies have found that restyling vehicles, especially complete restyling, is a key factor in increasing market share,42 raising the question of whether a sufficient selection of restyled vehicles could help trigger the release of pent‐up demand in 2011. Several notable new or restyled vehicles and technologies have just been introduced or are slotted to become available in 2011. These vehicles include the Honda Civic, Ford Focus, a plug‐in Toyota Prius, and a variety of other alternative fuel vehicles and hybrids.43 While there has been much talk of the Chevy Volt and Nissan Leaf,44 in particular, and SNS predictions include a takeoff in growth of the electric car in the coming year,45 the fact remains that hybrid sales have been falling since 2007 and that hybrids even lost market share in 2010, despite the addition of sales from 12 new models in the U.S. market.46 (See Figure 8.) Moreover, projected production of the Volt and the Leaf, even if expected demand materializes, would contribute very little to 2011 auto sales.47 Thus, we do not expect the new or restyled alternative fuel vehicles to significantly impact auto sales in 2011. It remains possible, however, that new or restyled non‐alternative fuel vehicles will draw
42 See Oleg Korenok, George E. Hoffer, & Edward L. Millner, “Non‐price determinants of automotive demand: Restyling matters most,” J. Bus. Research 63, 1282 (Dec. 2010). This study also found that it would be necessary to double relative advertising expenditures to achieve the same market share increase as a restyling. 43 http://www.edmunds.com/futuremodels/. 44 Both were introduced in 2010 as model year 2011. 45 http://www.tapsns.com/blog/index.php/2010/12/sns‐predictions‐for‐2011/. 46 Based on Edmunds.com data. 47 GM has said that it expects to sell 10,000 to 15,000 Volts in the U.S. in 2011. See http://www.luxurycarreport.com/blog/1050669_2011‐chevrolet‐volt‐production‐to‐rise‐to‐60000‐units‐by‐2012. The Nissan Leaf will be produced only at Nissan’s Oppama, Japan facility in 2011. This facility has a capacity of 50,000 units per year, and at least one report indicated that only half of those would be sold in the U.S. See http://nissan‐leaf.net/2010/07/08/nissan‐plans‐to‐sell‐25000‐leafs‐in‐us‐in‐2011/. Based on these numbers, sales for the Volt and Leaf are expected to be in the 40,000 range at most, which would be around 0.4% of auto sales at most.

20
additional consumers to the market. As noted above, we believe it is likely that recession‐weary consumers will be looking for reasons to spend in 2011 and cannot rule out the potential influence of new and restyled vehicles on consumer motivation to buy, especially if other economic indicators meet or exceed expectations.
Figure 8
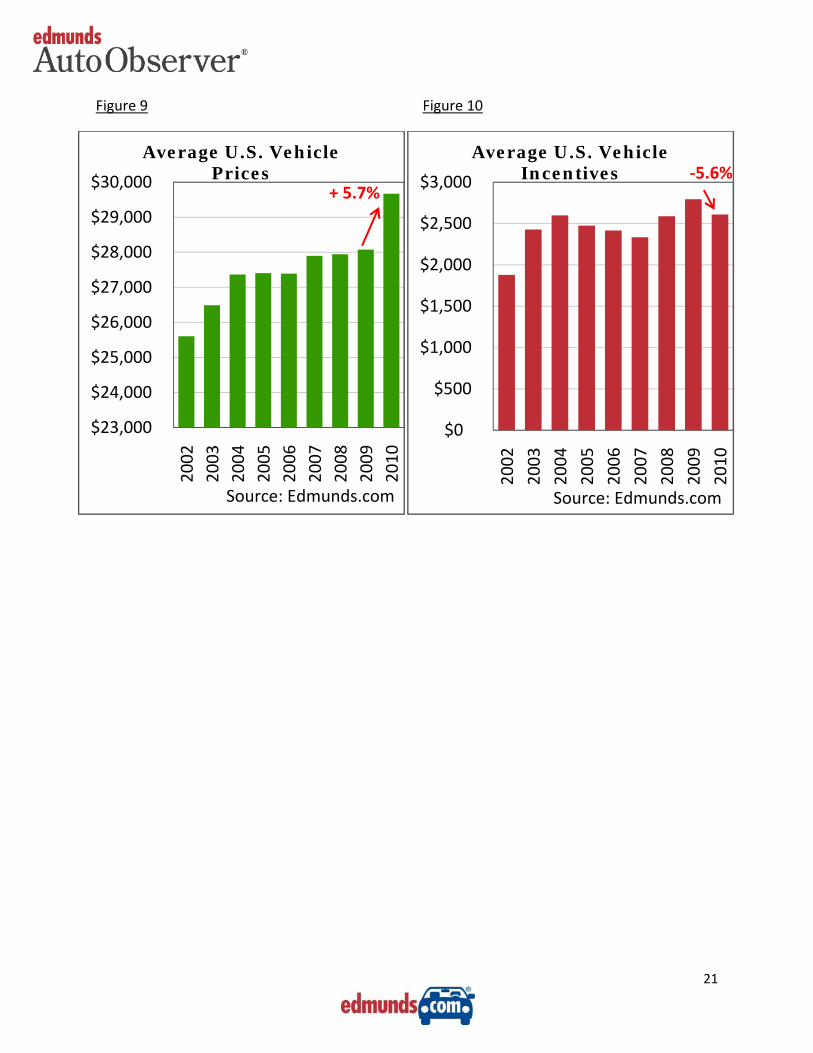
Regardless of restyling, price remains a key determinant of consumer motivation to buy. Auto transaction prices for new vehicles rose 5.7% on average in the past year,48 and there is reason to believe prices will continue to increase, as new technologies are developed and existing technologies are added to more and more models.49 (See Figure 9.) Moreover, vehicle incentives from automakers are unlikely to soften the effect of rising prices. Incentives fell 6.6% on average in 2010 after rising for the previous 2 years50 and are likely to remain fairly stable in 2011 if auto sales continue to increase, with automakers disinclined to slow growth by lowering incentives or to decrease profits by raising incentives when growth is already occurring. (See Figure 10.) The combination of rising prices and lower incentives will act as a counterweight to any attraction of new vehicles and/or technologies and thus, we do not necessarily expect auto sales to rise beyond projections due to these factors.
48 Based on Edmunds.com’s True Market Value (TMV)®. 49 While the cost of technological features typically falls as the technology matures, the addition of any new feature to a given model is often associated with increasing vehicle prices. The exact impact of any given feature on price is beyond the scope of this report, but is an issue on which further research would be useful. 50 Based on Edmunds.com’s True Cost of Incentives (TCI)®.
0.0%
0.5%
1.0%
1.5%
2.0%
2.5%
3.0%
1999 2000 2001 2002 2003 2004 2005 2006 2007 2008 2009 2010Source: Edmunds.com
Market Share of Hybrid Vehicles in the U.S.
21
Figure 9 Figure 10
$23,000
$24,000
$25,000
$26,000
$27,000
$28,000
$29,000
$30,000 2002
2003
2004
2005
2006
2007
2008
2009
2010
Average U.S. Vehicle Prices
Source: Edmunds.com
$0
$500
$1,000
$1,500
$2,000
$2,500
$3,000
2002
2003
2004
2005
2006
2007
2008
2009
2010
Average U.S. Vehicle Incentives ‐5.6%
+ 5.7%
Source: Edmunds.com