Embed Size (px)
Citation preview
Auto Component Industry in India: Growing Capabilities & Strengths

• India: A Vibrant Economy
• Automotive Industry in India
• Auto Component Industry in India
• Policy Environment
• Capabilities & Challenges
• The Way Forward
• About ACMA
Agenda
2

India: A Vibrant Economy
3

4
1. Largest Democracy – 1.2 billion people, Growing Middle Class
2. 4th largest GDP (PPP) and 10th largest GDP (Nominal, USD 1.8 trillion)
3. One of the fastest growing economies• India’s average GDP growth rate: 8.4% over past 5 years
• Expected to outpace China in the next decade
4. 3rd Largest Investor base in the World
5. Robust Legal and Banking Infrastructure
6. Demographics Advantage – Youth driven economy
7. Suburbanization & Rural to Urban Migration – 140 million by 2020; 700 million by 2050
8. 2nd largest pool of Certified Professionals and highest number of Qualified Engineers in the world
9. Investment in Infrastructure
India: A Vibrant Economy

Automotive Industry in India
5
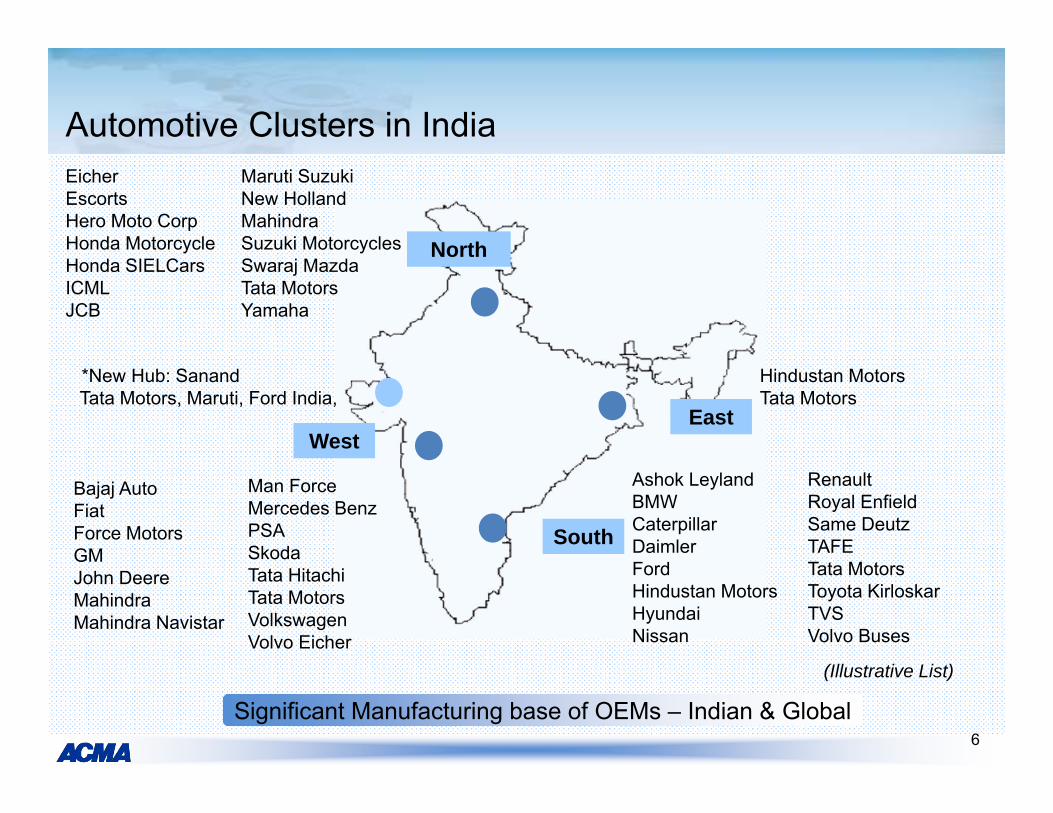
Automotive Clusters in India
West
Hindustan MotorsTata Motors
North
Significant Manufacturing base of OEMs – Indian & Global
Ashok Leyland BMWCaterpillarDaimlerFordHindustan MotorsHyundaiNissan
RenaultRoyal EnfieldSame DeutzTAFETata MotorsToyota KirloskarTVS Volvo Buses
East
South
EicherEscortsHero Moto CorpHonda MotorcycleHonda SIELCars ICMLJCB
Maruti SuzukiNew HollandMahindraSuzuki MotorcyclesSwaraj MazdaTata MotorsYamaha
Bajaj AutoFiatForce MotorsGMJohn DeereMahindraMahindra Navistar
Man ForceMercedes BenzPSASkodaTata HitachiTata MotorsVolkswagenVolvo Eicher
(Illustrative List)
6
*New Hub: SanandTata Motors, Maruti, Ford India,

7
Rapidly growing presence of Global OEMs
Passenger Vehicle market share by OEM parent country2007 2011
MahindraHindustan MotorsPremier
Maruti SuzukiTata MotorsMahindraHindustan MotorsPremier
Mercedes BenzFordToyotaHondaGMFiat HyundaiMaruti SuzukiTata MotorsMahindraHindustan Motors
BMWVWSkodaRenault NissanMercedes BenzFordToyotaHondaGMFiatHyundaiMaruti SuzukiTata MotorsMahindraForce Motors Hindustan Motors
Loca
lFo
reig
n
1980 1990 2000 2011
(Illustrative List)

1,838 2,357
2,987 3,146 3234
5100
10,000
-
2,500
5,000
7,500
10,000
2008-09 2009-10 2010-11 2011-12 2012-13 2015-16 2020-21
(’000 units)
CAGR 2008-12: 14%
CAGR 2012-21: 13%* *
Passenger Vehicles Production
*
(* Estimates)Figures for financial year – April to March
8

Figures for financial year – April to March
( ’000 units)Commercial Vehicles
(* Estimates)
9
Tractors( ’000 units)
CAGR 2011-21: 5%*
Two & Three Wheelers
(In ’000 units)
Commercial Vehicles include:• Small Commercial Vehicles (SCV) < 1 ton• Light Commercial Vehicles (LCV) > 1 ton but < 7.5 tons
• Medium Commercial Vehicles (MCV) > 7.5 tons but <16 tons• Heavy Commercial Vehicles (HCV) > 16 tons
Construction Vehicles( ’000 units)
CAGR 2011-21: 14%*
CAGR 2008-12: 22%CAGR 2012-21: 11%*
CAGR 2008-12: 16%CAGR 2012-21: 7%*
Other Vehicles Production
9

Auto Component Industry in India
10

Auto Component Industry Profile - Turnover
Engine Parts31%
Drive Transmission & Steering Parts
19%Body & Chassis12%
Suspension & Braking Parts
12%
Equipments10%
Electrical Parts9%
Others7%
Comprehensive Product Range
USD
billi
on
(* Estimates)
*
11
CAGR 2008-12: 12%
CAGR 2013-21: 14%*
Figures for financial year – April to March
*

Auto Component Industry Profile - ExportsU
SD b
illion
Export Destinations
OEM/Tier 1 account for 80%; Aftermarket for 20%
3.8 4 3.4 5.28.5 9.3
12
30
0
10
20
30
2007-08 2008-09 2009-10 2010-11 2011-12 2012-13 2015-16 2020-21
(* Estimates)
*
*
12
CAGR 2008-12: 22%
CAGR 2013-21: 16%*
Figures for financial year – April to March
Australia, 1% Africa, 9%
Europe, 35%
North America,
26%
Asia, 25%
South America, 4%

Increased Component Outsourcing
Tier 1 Component Manufacturers• Bosch• Continental• Cummins• DANA• Delphi• Denso• Eaton• Getrag• Kolbenschmidt• Magna• Meritor• TRW• Valeo
OEMs• BMW• Caterpillar• Ford• FIAT• GM• MAN• Mercedes-Benz• Nissan• Peugeot• Renault• Toyota• Volkswagen
Over 30 IPOs of Global OEMs & Tier 1 Procuring from India
Indian components already driving on international roads
(Illustrative List)
13

Auto Component Industry Profile - Imports
Sources of Imports
(* Estimates)
6.2 6.8 6.5 8.513.2 13.1
19
35
0
10
20
30
40
2007-08 2008-09 2009-10 2010-11 2011-12 2012-13 2015-16 2020-21
USD
billi
on
*
*
14
CAGR 2008-12: 11%
CAGR 2013-21: 13%*
Figures for financial year – April to MarchNorth
America, 8%
South America,
1%
Asia, 59%
Europe, 32%

33.954
858.5
12
30
13.2
19
35
0
50
100
150
2011-12* 2015-16 (E) 2020-21 (E)
Production for domestic consumption Exports Imports
15Total Industry Potential: USD 150 billion by 2020
Vision 2020: Indian Auto Component Industry
85
150
USD
Bill
ion
56
E-Estimated
Source: ACMA - EY Vision 2020

Policy Environment & Trade
16

Favorable Policy Regime
Auto Policy 2002 and Auto Mission Plan 2006-16 – framework for Automotive Manufacturing in India
• Manufacturing and Imports Free from Licensing and Approvals
• WTO compliant policies (no import restrictions and reduced tariff levels)
• Robust Legal system and stable Foreign Exchange regime
• Joined UN-ECE WP 29 for Global Standard in Technology
• Increased budgets for R&D activities
• 100% FDI permitted without prior Govt. approval
Robust Indian Automotive
Industry
17
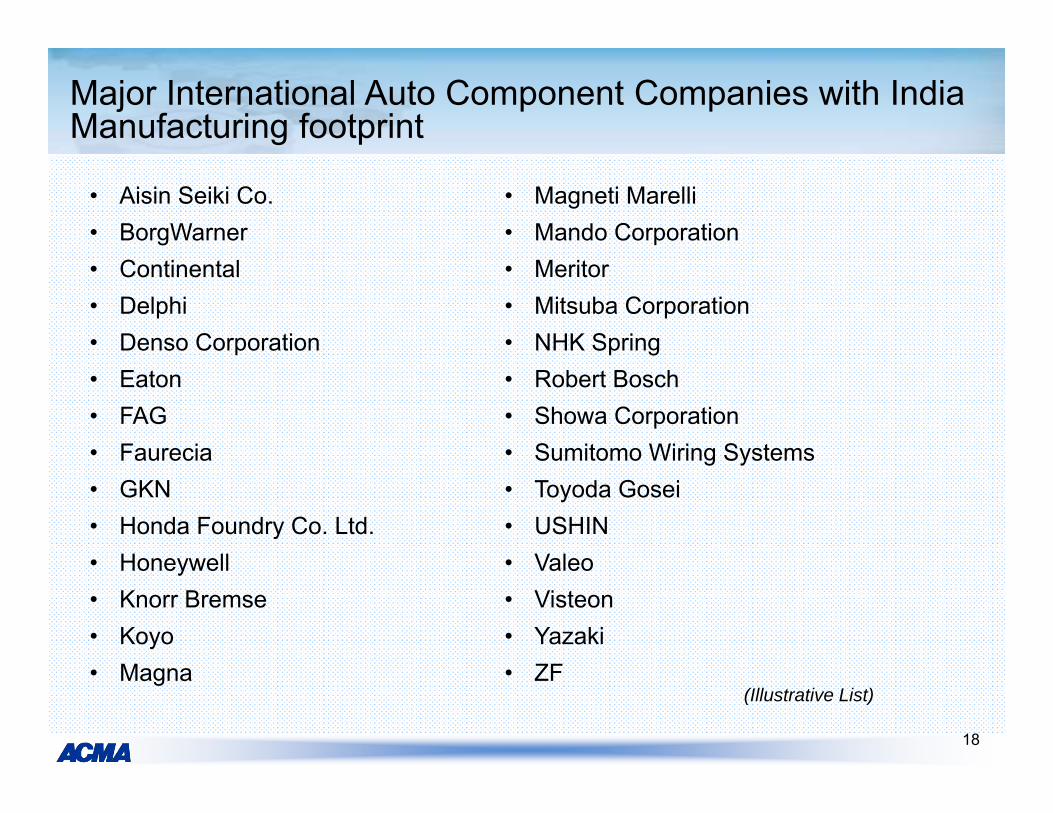
Major International Auto Component Companies with India Manufacturing footprint
(Illustrative List)
18
• Aisin Seiki Co.• BorgWarner• Continental• Delphi• Denso Corporation• Eaton• FAG• Faurecia• GKN• Honda Foundry Co. Ltd.• Honeywell• Knorr Bremse• Koyo• Magna
• Magneti Marelli• Mando Corporation• Meritor• Mitsuba Corporation• NHK Spring• Robert Bosch• Showa Corporation• Sumitomo Wiring Systems• Toyoda Gosei• USHIN• Valeo• Visteon• Yazaki• ZF

Capabilities & Challenges of Indian Component Suppliers
19

Indian Suppliers’ Focus – Global Best Practices
Industry fast embracing modernshop-floor practices:
5-S; 7-WKaizenTQMTPM6 SigmaLean Manufacturing
Deming Award - 12
Japan Quality Medal - 2 JIPM - 3Shingo Silver
Medallion - 1TPM Award
- 15
Largest no. of Deming Award winning companies outside Japan
Focus on Quality
20

Increasing focus on Innovation and Research
• AMD
• Boeing
• Bosch
• Caterpillar
• Continental
• Cummins
• Ford
• GM
• GE
• Honda
• Honeywell
• Hyundai
• Intel
• Magna
• Motorola
• Mercedes Benz
• Microsoft
• Renault Nissan
• Suzuki
• Valeo
Design & Research Centers of leading Global companies in India
(Illustrative List)
21

Challenges – Typical of a high Growth Emerging Market
• Raising Capital & Scaling Capacities
• Infrastructure Challenges
− Roads
− Ports
− Power
• Inflation
• Availability of Skilled Manpower
• Managerial Depth across Tiers
• R&D Competence
22
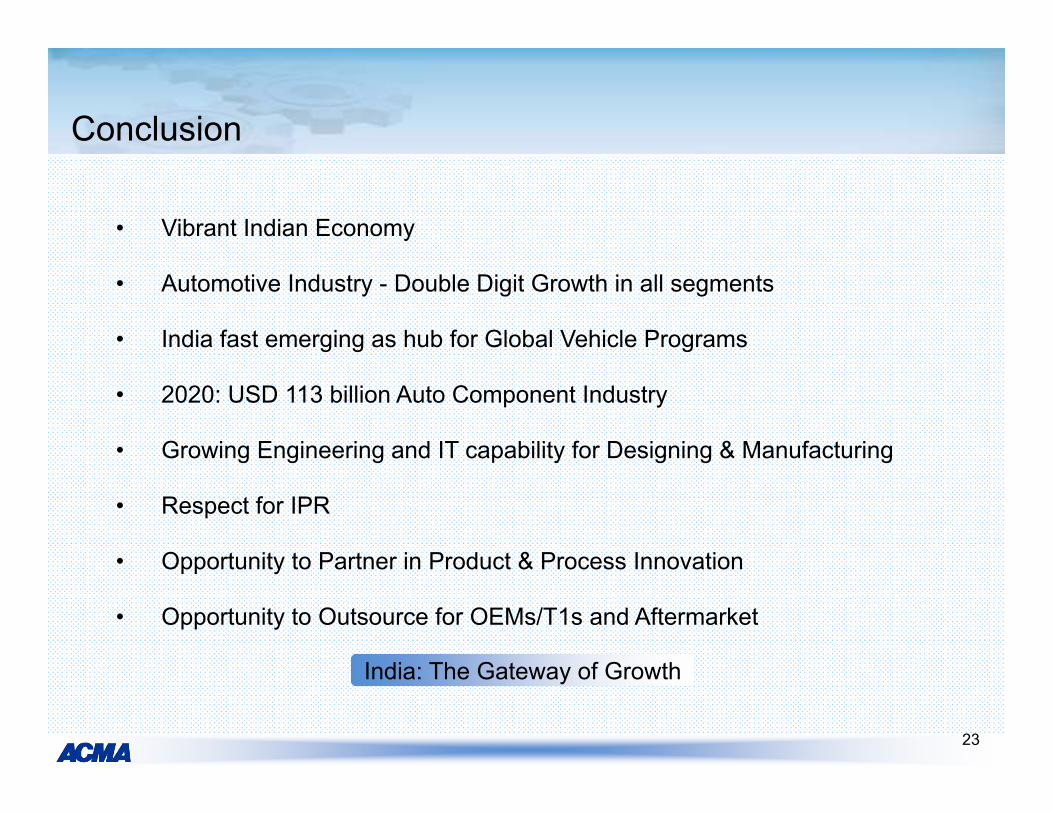
Conclusion
• Vibrant Indian Economy
• Automotive Industry - Double Digit Growth in all segments
• India fast emerging as hub for Global Vehicle Programs
• 2020: USD 113 billion Auto Component Industry
• Growing Engineering and IT capability for Designing & Manufacturing
• Respect for IPR
• Opportunity to Partner in Product & Process Innovation
• Opportunity to Outsource for OEMs/T1s and Aftermarket
India: The Gateway of Growth
23

About ACMA
24

About ACMA
• Established in 1959
• Apex body of Auto Component Industry in India
• 650+ members from the Organized sector
• Represents 85% of the Industry by turnover
• Represented on all Government and Industry bodies –
Strategic to the Auto Sector
• Offices across all Regions in the Country
• An ISO 9001-2008 Institution
ACMA – Excellence in Service Delivery
25

Collection &Dissemination of
Information
QualityEnhancement
TechnologyUp-gradation
Promotes IndianAutomotive Component Industry
Vital Catalyst for Industrial Development
Trade Promotion
ACMA Services
26

ACMAThe Capital Court, 6th Floor, Olof Palme Marg, Munirka, New Delhi – 110 067
Tel: 011-26160315, Fax: 011-26160317E-mail: [email protected], Website: www.acma.in
Thank You
for any assistance contact
27


![[Insert Exercise Name] - CTEP AAR-IP... · [Insert aligned core capabilities from situation manual] Strengths . The following strengths related to this objective were observed in](https://img.dokumen.tips/doc/110x75/5f040ce77e708231d40c1297/insert-exercise-name-ctep-aar-ip-insert-aligned-core-capabilities-from.jpg)