Embed Size (px)
Citation preview

RESEARCH Open Access
Autistic traits and individual braindifferences: functional network efficiencyreflects attentional and social impairments,structural nodal efficiencies indexsystemising and theory-of-mind skillsSubhadip Paul1,2†, Aditi Arora2,3†, Rashi Midha2,4, Dinh Vu5,6, Prasun K. Roy2,7 and Matthew K. Belmonte2,6,8*
Abstract
Background: Autism is characterised not only by impaired social cognitive ‘empathising’ but also by superior rule-based ‘systemising’. These cognitive domains intertwine within the categorical diagnosis of autism, yet behaviouralgenetics suggest largely independent heritability, and separable brain mechanisms. We sought to determinewhether quantitative behavioural measures of autistic traits are dimensionally associated with structural andfunctional brain network integrity, and whether brain bases of autistic traits vary independently across individuals.
Methods: Thirty right-handed neurotypical adults (12 females) were administered psychometric (SocialResponsiveness Scale, Autism Spectrum Quotient and Systemising Quotient) and behavioural (Attention NetworkTest and theory-of-mind reaction time) measures of autistic traits, and structurally (diffusion tensor imaging) andfunctionally (500 s of 2 Hz eyes-closed resting fMRI) derived graph-theoretic measures of efficiency of informationintegration were computed throughout the brain and within subregions.
Results: Social impairment was positively associated with functional efficiency (r = .47, p = .006), globally and withintemporo-parietal and prefrontal cortices. Delayed orienting of attention likewise was associated with greater functionalefficiency (r = − .46, p = .0133). Systemising was positively associated with global structural efficiency (r = .38, p = 0.018),driven specifically by temporal pole; theory-of-mind reaction time was related to structural efficiency (r = − .40, p = 0.0153)within right supramarginal gyrus.
Limitations: Interpretation of these relationships is complicated by the many senses of the term ‘connectivity’, includingfunctional, structural and computational; by the approximation inherent in group functional anatomical parcellations whenconfronted with individual variation in functional anatomy; and by the validity, sensitivity and specificity of the several surveyand experimental behavioural measures applied as correlates of brain structure and function.
(Continued on next page)
© The Author(s). 2021 Open Access This article is licensed under a Creative Commons Attribution 4.0 International License,which permits use, sharing, adaptation, distribution and reproduction in any medium or format, as long as you giveappropriate credit to the original author(s) and the source, provide a link to the Creative Commons licence, and indicate ifchanges were made. The images or other third party material in this article are included in the article's Creative Commonslicence, unless indicated otherwise in a credit line to the material. If material is not included in the article's Creative Commonslicence and your intended use is not permitted by statutory regulation or exceeds the permitted use, you will need to obtainpermission directly from the copyright holder. To view a copy of this licence, visit http://creativecommons.org/licenses/by/4.0/.The Creative Commons Public Domain Dedication waiver (http://creativecommons.org/publicdomain/zero/1.0/) applies to thedata made available in this article, unless otherwise stated in a credit line to the data.
* Correspondence: [email protected]†Subhadip Paul and Aditi Arora are co-first authors.2National Brain Research Centre, NH-8, Nainwal Mode, Manesar 122051, India6Department of Psychology, Chaucer Bldg., Nottingham Trent University,Shakespeare Street, Nottingham NG1 4FQ, UKFull list of author information is available at the end of the article
Paul et al. Molecular Autism (2021) 12:3 https://doi.org/10.1186/s13229-020-00377-8

(Continued from previous page)
Conclusions: Functional connectivities highlight distributed networks associated with domain-general properties such asattentional orienting and social cognition broadly, associating more impaired behaviour with more efficient brain networksthat may reflect heightened feedforward information flow subserving autistic strengths and deficits alike. Structuralconnectivity results highlight specific anatomical nodes of convergence, reflecting cognitive and neuroanatomicalindependence of systemising and theory-of-mind. In addition, this work shows that individual differences in theory-of-mindrelated to brain structure can be measured behaviourally, and offers neuroanatomical evidence to pin down the slipperyconstruct of ‘systemising’ as the capacity to construct invariant contextual associations.
Keywords: Autism, Dimensional, Social, Attention, Theory-of-mind, fMRI, DTI, Functional connectivity, Graph theory
BackgroundThe twenty-first century science and public rhetoric of aut-ism have been dominated by a shift from exclusively categor-ical construal as a disease condition to a recognition ofdimensional autistic traits throughout the general population.In this regard, autism and autistic traits have mirrored axesof variation within other complex neuropsychiatric condi-tions such as schizophrenia and schizotypy [1], or obsessive-compulsive disorder and obsessionality, compulsivity and or-dering [2]. Although specific patterns of variation may con-verge on general graph-theoretic hub territories such asprefrontal cortex in schizophrenia, the devil is in the details,and studies do not in general agree [3, 4] on how exactlythese dimensional trait measures map onto dimensional vari-ations in brain connectivity. Categorical autism is distin-guished by brain dysconnectivity [5, 6], and as the construalof autism has extended to dimensional traits, so have suchdimensional behavioural and cognitive traits begun to be re-lated to dimensional variation in brain connectivity [7]. Thesedimensional relationships complement and interact with cat-egorical differences [8], no doubt presenting developmentalendpoints of complex interactive specialisation [9, 10]. Butare broadly defined and broadly surveyed social and percep-tual ‘autistic’ traits fundamentally neurally related to autismitself, or are they but reflections of individual variation? [11].Neurophysiological variables have been shown to co-
vary with behavioural measures of such traits, but thesebehavioural measures have been dominated by ones thatfocus on social communication in particular, most com-monly the well validated and oft used Social Responsive-ness Scale [12], and by informant-report or even self-report surveys rather than experimental measures.Although the canonical social communicative result onautism is apparent impairment in theory-of-mind, thepast three and a half decades have not yielded conver-gence on any single scale by which this deficit ought tobe measured. In general, different tests of theory-of-mind seem to agree less with each other and more interms of their various confounds [13], such as workingmemory and language. The main approach to resolvingthe binary outcome of the original, ‘Sally-Anne’ test oftheory-of-mind into a continuous measure has been to
sum binary item scores across multiple test scenarios,with checks for comprehension [14, 15]; a complemen-tary approach is to average reaction times across re-peated trials of ToM versus non-ToM scenarios [16]. Asthe former, accuracy-based method tends to yield ceilingeffects in non-autistic populations; in this study of di-mensional autistic traits, we implement the latter,reaction-time approach, within a motivating, game-based context [17] whose graphical presentation mini-mises verbal confounds.Social communication can be the most obvious of autis-
tic traits but is far from the only axis of variation, and ex-perimental measures can yield information more directand domain-specific, complementary to that provided bysurveys. Dimensional brain-behaviour relationships mayvary across behavioural domains and across types of be-havioural assay, and questions remain as to whether andhow such relationships differ across sensory/perceptual,attentional, social cognitive, and verbal tasks, and acrosssurvey and experimental behavioural measures. Might be-haviourally measured correlations between social andnon-social autistic traits [18, 19] persist into the realm ofbrain function? Or do these dimensional traits have inde-pendent brain bases reflecting their mostly independentheritability [7, 20–22]? And do survey and experimentalbehavioural measures yield similar results?At the same time as behavioural measures can be ex-
tended, so can metrics of brain structure and function.The field has witnessed a shift from raw measures of dif-fusion anisotropy and temporal correlation to derivedgraph-theoretic metrics that address more specificallythe networks subserving neural information transfer[23]. Pathways between brain regions can be representedas a graph-theoretic complex networked system, whereregions are vertices and pathways are edges of the net-work [24]. Such mathematical representation of white-matter pathways is known as a ‘structural connectome’[24, 25], defined by anatomical connections. The func-tional connectome, on the other hand, represents rela-tions between brain regions’ functional activities [26],where graph edges are defined as cross-correlations be-tween time series of functional activations. Graph-
Paul et al. Molecular Autism (2021) 12:3 Page 2 of 18

theoretic complex network measures allow characterisa-tion of structural and functional brain networks at globaland nodal/regional levels [27].Whole-brain associations between the graph-theoretic
resting-state functional network measures, DTI-derivedmeasures of localised white-matter integrity, and psycho-metrics including the Social Responsiveness Scale andAutistic Spectrum Screening Questionnaire have beenexplored previously [28], linking autistic traits with re-duced average local (but not global) functional efficiency(a graph-theoretic measure of how well neural networksintegrate information from disparate sources) overall,and in right posterior cingulum in particular. Associa-tions between the Social Responsiveness Scale scoresand rs-fMRI connectivity were also explored in a region-of-interest approach centred on rostral anterior cingu-lum [29], finding reduced correlation with mid-insulaand heightened correlation with lateral occipital cortex,superior parietal cortex and angular gyrus. However,structural connectome measures as a function of dimen-sional autistic traits have only recently begun to beassayed [30].This preliminary study applies both survey and experi-
mental measures to identify dimensional variation inbrain-behaviour relationships, across both social andnon-social behavioural and cognitive domains of autistictraits in the normal population, using graph-theoreticmetrics derived from both functional (resting fMRI) andstructural (DTI) measures of brain connectivity. We askwhich combinations of behavioural (survey and experi-mental, social and non-social) and brain (structural andfunctional) measures might be sensitive to such brain-behaviour dimensions. The straightforward hypothesesare an association of broad measures of autistic traitswith reduced local functional network integrity (low effi-ciency, low clustering, long path length) across the entirebrain [28], alongside similar effects within anatomical re-gions functionally associated with specific constructsand their measures (e.g. impaired theory-of-mind withright temporoparietal junction [31], slowed orienting ofattention with intraparietal sulcus [32], impaired execu-tive control with anterior cingulum [28, 33], superiorsystemisimg with posterior parietal cortex and impairedempathising with frontotemporal cortices [34]).
MethodsSubjectsThirty right-handed volunteers (mean age ± standarddeviation: 27.29 years ± 2.88, 18 males, 12 females) par-ticipated in the study for small monetary reimburse-ment. All participants had normal or corrected-to-normal vision, and no history of psychological or neuro-logical disorders. Written informed consent was ob-tained from participants.
Behavioural measuresFive questionnaires and three computer-based psychomet-ric tests along with two tests of verbal fluency were ad-ministered (Table 1, Additional file 1). All participantscompleted the adult version of the Autism Spectrum Quo-tient (AQ [35]). On the basis of our previous work [18] inwhich granular scoring of the AQ made a more sensitivecorrelate of other measures of autistic traits, the AQ wasscored on a symmetric 4-point Likert scale. AQ subcat-egory scores were recorded, both the social subscoreAQSoc comprising attention switching (AQAttSw), com-munication (AQComm), imagination (AQImag) and so-cial skills (AQSS), and the details/patterns subscore(AQDet). Participants’ self-reported ability to understandothers’ intentions, predict their behaviour, and respondwith appropriate emotions were measured with the Em-pathy Quotient (EQ) [36].The Systemizing Quotient (SQ) [37] assessed the drive to
build contexts from individual parts and details. ‘Systemiz-ing’, having been a somewhat nebulously defined construct,deserves some explication. Baron-Cohen et al. define a ‘sys-tem’, in this context, as “something that takes inputs, whichcan then be operated on in variable ways, to deliver differentoutputs in a rule-governed way” [37]. More specifically, a sys-tem might map between concrete motor outputs and sen-sory inputs, as with a fidget spinner, or between mechanicalcauses and effects, as with an engine, or between logical pa-rameters input and results output, as with a computer, or be-tween books or records and their linearly or hierarchicallyordered classification numbers, as in a library. The face valid-ity in relation to autistic preferences and expertise at classify-ing, ordering and predicting within explicitly defined systemsseems clear enough. However, the SQ’s construct validity asa measure of drive to understand rule-based input-output re-lations has been called into question by its lack of any strongrelationship to mathematical skill [38]. The SQ’s questionsfocus on construction, spatial mappings, component parts,component mechanisms and processes, and taxonomies (de-scribed by Ling et al. [39] as ‘DIY’, ‘topography’, ‘structure’,‘technicity’ and ‘taxonomy’, respectively)—all processes thatemphasise spatially and temporally invariant, static andtherefore predictable relations of parts and details to framesand contexts, and thus reflect an autistic cognitive style ofbricolage, in which abstract and general representations areeffortfully, extensionally constructed bottom-up from theunderlying details and instances [40]. Baron-Cohen’s system-izing construct thus is not so much a drive to understandrule-based input-output relations as it is a skill of construct-ing invariant contextual associations. SQ scores map ontopopulation-level sex differences in cognitive traits related toautism [41], males being on average more prone to the SQ’ssystemizing approach to cognition, and females being greaterat the cognitive empathy tapped by same group’s‘Empathizing Quotient’.
Paul et al. Molecular Autism (2021) 12:3 Page 3 of 18

Autistic sensory traits were assessed by the SensorySensitivity Questionnaire (SSQ) [42–45]. At the time ofdata collection, few self-report or informant-report mea-sures of sensory processing quick enough to be accept-able to subjects in this multi-measure study were yetavailable (see Table 3 of DuBois et al. [46]), and thosethat were available had been used in categorical con-trasts of autistic and non-autistic populations (e.g. [47])rather than as dimensional measures—a trend that con-tinues today. Thus, the selection of a sensory measurewas based on a combination of free availability and facevalidity for autism, its use as a dimensional measurebeing necessarily an extrapolation.To assess autistic social communicative traits, the So-
cial Responsiveness Scale- Adult (SRS) [12] was com-pleted by subjects’ social partners (e.g. spouse, parent,longtime friend). The SRS was developed as a measureof subthreshold autistic traits and has accumulated anextensive history and norms for use as such. One subjectdid not return the SRS.Social cognition also was measured by the ‘Reading
the Mind in the Eyes’ Test (RMET) [48]. The RMET ori-ginally was developed as a test of the ability to infer an-other’s mental state, its face validity being established byits covariance with other quantitative measures of autismspectrum conditions and autistic traits. It has been ap-plied widely as a dimensional measure of autistic traits(e.g. [18, 49]). Later work demonstrates that the RMET
Table 1 Mean and standard deviation of all behaviouralmeasures
Behavioural measures Female Male Total
AQ
Mean − 18.92 − 19.56 − 19.24
SD 27.16 19.18 23.17
EQ
Mean 45.75 39.39 42.57
SD 12.73 11.20 11.97
SQ
Mean 64.92 74.56 69.74
SD 15.89 17.25 16.57
SSQ
Mean 5.75 3.50 4.63
SD 2.45 1.50 1.98
SRS
Mean 33.00 42.76 37.88
SD 12.88 25.67 19.27
RMET
Mean 27.64 25.44 26.54
SD 4.95 4.68 4.81
COWA
Mean 49.00 43.11 46.06
SD 14.21 7.94 11.08
AnNT
Mean 18.00 16.50 17.25
SD 5.59 4.59 5.09
FC-EFT
Mean 11410.41 (ms) 8815.5 (ms) 10112.95 (ms)
SD 5561.96 (ms) 5002.31 (ms) 5282.13 (ms)
ANT (alerting effect)
Mean 48.25 (ms) 51.70 (ms) 49.97 (ms)
SD 34.53 (ms) 28.56 (ms) 31.54 (ms)
ANT (orienting effect)
Mean 58.166 (ms) 48.05 (ms) 53.11 (ms)
SD 37.64 (ms) 20.97 (ms) 29.31 (ms)
ANT (conflict effect)
Mean 116.33 (ms) 114.64 (ms) 115.49 (ms)
SD 38.56 (ms) 40.14 (ms) 39.35 (ms)
ANT (grand mean effect)
Mean 656.33 (ms) 620.52 (ms) 638.43 (ms)
SD 60.32 (ms) 34.16 (ms) 47.24 (ms)
Second-order ToM
Mean − 5.20 (s) − 0.063 (s) − 2.63 (s)
SD 4.95 (s) 10.61 (s) 7.78 (s)
Table 1 Mean and standard deviation of all behaviouralmeasures (Continued)
Behavioural measures Female Male Total
Egocentric first-order ToM
Mean 6.984 (s) 1.183 (s) 4.08 (s)
SD 14.01 (s) 18.65 (s) 16.33 (s)
Allocentric first-order ToM
Mean 3.94 (s) 0.548 (s) 2.24 (s)
SD 5.160 (s) 11.477 (s) 8.31 (s)
WASI (verbal IQ)
Mean 109.42 109.67 109.54
SD 9.89 7.90 8.90
WASI (performance IQ)
Mean 102.00 109.17 105.58
SD 6.66 7.08 6.87
WASI (full-scale IQ)
Mean 106.83 110.89 108.86
SD 7.52 7.54 7.53
AQ Autism Spectrum Quotient, EQ empathy quotient, SQ systemizing quotient,SSQ Sensory Sensitivity Questionnaire, SRS Social Responsiveness Scale, RMETReading the Mind in the Eyes Test, COWA Controlled Oral Word Associationtest, AnNT Animal Names Test, FC-EFT forced-choice version of the EmbeddedFigures Test, ANT Attention Network Task, WASI Wechsler Abbreviated Scaleof Intelligence
Paul et al. Molecular Autism (2021) 12:3 Page 4 of 18

measures more the ability to name emotions [50], andverbal ability in general [51], although with this inter-pretive caveat the RMET remains useful as a measure ofsocial cognitive function in the broad sense. The testcomprises 36 photographs of the eye region, for each ofwhich participants choose the one of four words thatbest describes what the person in the picture is feelingor thinking.Perceptual disembedding was measured by a forced-
choice version of the Embedded Figures Test (FC-EFT)[52, 53]. Subjects were asked to locate the embeddedshape as rapidly as possible with a 50-s timeout interval,pressing the number key 1 for the shape on the left orthe number key 9 for the shape on the right. Thescore is the mean latency of correct responses. TheEFT has been applied in many studies of dimensionalautistic traits (e.g. [18]), though a review of these byCribb et al. [54] suggests that the EFT may be mosteffective when applied categorically or between ex-tremes rather than along a continuum of dimensionalvariation.The Attention Network Test Revised (ANT-R) [33, 55]
combines the Posner visual attention task [56] with avisual spatial flanker task [57] to measure alerting (tem-poral effect of cueing), orienting (spatial effect of cue-ing), and executive control over conflicts betweenpercept-action mappings (effect of flanker congruence),the final two of which, at least, are demonstrably per-turbed in autism [58]. Scores were computed as simpledifferences of mean reaction times in trials with correctresponses: alerting, central cue minus no cue; orienting,spatial cue minus central cue; conflict, no cue with in-congruent flankers minus no cue with congruentflankers. The ANT has been validated against self-reportmeasures of individual differences in attentional control[59], though not to our knowledge in terms of autistictraits per se.Phonetic association fluency was measured by the
Controlled Oral Word Association (COWA) test [60].The COWA evaluates the spontaneous, timed produc-tion of words beginning with a given letter. In three 1-min trials, participants were asked to generate as manywords as possible beginning with ‘F’, ‘A’ and ‘S’, respect-ively, excluding proper names and names of numbers.The score was the mean tally of qualifying words, ex-cluding repetitions, across the three trials. Subjects alsocompleted the Animal Names Test [61], a semantic flu-ency test in which subjects are asked to generate in a 1-min timed trial as many animal names as possible, ex-cluding the names of fish, birds and snakes. The score isthe total number of qualifying animal names, excludingrepetitions. Similar phonetic and semantic fluency taskshave been oft applied in measurement of individualdifferences [62].
Egocentric and allocentric [63] first-order theory-of-mind (ToM), and second-order ToM, were assessed asreaction time differences between conditions in a graph-ical version of the Sally-Anne test. This task was imple-mented as a computer game [17] (see SupplementaryMethods) wherein Sally is a friendly spaceship captain,Anne is a space pirate, the ball is a cache of resourcesfor the player’s space station, and the basket and the boxeach are one of four planets distinguished by spatial pos-ition, colours and texture. The resulting no-theft,unobserved-theft and observed-theft vignettes were pre-sented mainly graphically, supplemented by simple text-ual narrative at the bottom of the display. The subjectwas reminded that Sally would always steer her space-ship where she thought the cache was, and was asked toset a course to meet up with her by moving a trackpadcursor up, down, left or right to one of the four planets.To assess general intelligence, participants were tested
with the Wechsler Abbreviated Scale of Intelligence(WASI) [64]. The WASI’s four subtests estimate verbalcomprehension and perceptual reasoning abilities thatcontribute to general intelligence.
Image acquisitionsMR image acquisitions were performed using a 3 TeslaPhilips Achieva scanner with eight-channel head coil.The head was immobilised using cushions and straps.During the resting-state fMRI data acquisition, partici-pants were asked to keep their eyes closed, relax and notthink about anything specific, but to avoid sleeping. Allparticipants confirmed that they did not sleep and didnot come close to falling asleep during the scan.Resting-state Blood Oxygen Level Dependent (BOLD)signals were acquired using a 3D PRESTO (principles ofecho shifting with a train of observations) sequence [65,66] with the following parameters: field of view (FOV)256 mm × 256 mm × 140 mm, voxel dimension 4 mm ×4 mm × 4 mm, 1000 time points, dynamic scan time 500ms, repetition time (TR) 22 ms, echo time (TE) (shifted)32 ms, SENSE p reduction = 2, SENSE s reduction = 2,flip angle (FA) 9°. This high-frequency (2 Hz) samplingminimises aliasing of high-frequency (~ 0.1–1 Hz)cardiac and respiratory oscillations into the slower(0.01–0.1 Hz) spontaneous fluctuations of BOLD signal.However, these fMRI parameters yield lower anatomicalcontrast compared to T1-weighted images. This 9° func-tional scan therefore was followed by a similar PRESTOscan at 25° flip angle for use in spatially co-registeringthe PRESTO images against T1-weighted anatomical im-ages [67]. Lastly, a 3D T1-weighted image (Additionalfiles 2, 3, 4, 5 and 6) was acquired using a Turbo FieldEcho sequence with the following parameters: FOV 240mm × 240 mm × 160 mm, voxel dimension = 1.0 mm3
isotropic, TR 8 ms, TE 3.69 ms, flip angle 8°.
Paul et al. Molecular Autism (2021) 12:3 Page 5 of 18

Diffusion-weighted images were obtained using a spin-echo (SE) echo-planar imaging (EPI) sequence, FOV 224mm × 224 mm × 140 mm, voxel dimension = 2 mm × 2mm × 2 mm, TR/TE = 9386/58 ms, diffusion gradienttiming (Δ/δ = 28.9/17.8 ms, b = 1000 s/mm2, 32 direc-tions, with fat suppression using Spectral Presaturationby Inversion Recovery (SPIR). The sequence was re-peated three times (total gradient directions = 96) inorder to improve the quality of the diffusion-weightedsignals. Fifteen volumes with no diffusion weighting (b =0 s/mm2) were also acquired.
PreprocessingIndividual fMRI scans were spatially re-aligned to the lastfunctional volume using Statistical Parametric Mapping(SPM) software. Then, the high-contrast 25° PRESTOscan was spatially co-registered to these realigned fMRIscans and each T1-weighted image was linearly trans-formed onto it using the default setting of FLIRT(FMRIB’s Linear Image Registration Tool). T1-weightedimages were segmented into grey matter (GM), whitematter (WM) and cerebrospinal fluid (CSF) maps usingFAST (FMRIB’s Automated Segmentation Tool), andthese maps were transformed to the realigned PRESTOscans using applyxfm function of FSL (FMRIB SoftwareLibrary). Nearest-neighbour interpolation was used so asto avoid introducing partial-volume tissue categorieswhilst spatially transforming the segmented maps. Furtherprocessing took place in DPARSF (Data Processing Assist-ant for Resting-State fMRI) [68]. The first 10 volumes ofthe realigned fMRI scans were discarded and theremaining fMRI time series with 990 time points were de-trended. Averaged WM and CSF signals were from thefMRI time series using the realigned tissue-segmentedmaps as masks. This and head motion parameters wereregressed out (Additional file 7) from the fMRI time series.High-frequency respiratory and cardiac oscillations (0.1–1Hz) and low-frequency scanner drift (< 0.01 Hz) were re-moved by band-pass filtering at 0.01–0.1 Hz [69]. ThefMRI datasets were not spatially smoothed, as smoothingis inherent in spatially averaging the time series from eachregion of interest (described in the subsection on“Network construction”).We have concatenated the three sets of diffusion im-
aging data and the gradient tables. In order to correctthe distortion of diffusion-weighted images due to eddycurrents and head motion, the diffusion-weighted imagesof each participant were registered to the respective firstb = 0 image using affine transformation. Rotational com-ponents corresponding to each diffusion-weighted vol-ume were extracted from the transformation matrix, andthe B-matrix was rotated using the extracted rotationvector in order to correct for head motion [70].
Modelling of diffusion-weighted signalsDiffusion-weighted signal in each voxel was modelledconsidering multiple fibre orientations in the voxel.Metropolis-Hastings Markov Chain Monte Carlo sam-pling was used for estimation of model parameters and aBayesian method, Automatic Relevance Determination(ARD), was applied to determine whether the diffusion-weighted signals of a voxel should be represented by asingle-fibre or a multiple-fibre model [71]. Diffusion-weighted data were modelled using the bedpostx func-tion of FDT (FMRIB’s Diffusion Toolbox) with defaultvalues of the parameters.
Network constructionA network with N nodes and K edges can be denoted bya graph (G(N,K)) [72]. The rows and columns of the N ×N adjacency matrix represent the nodes and each elem-ent (wij) of this matrix denotes the link between the ithand the jth nodes of the network. We describe the pro-cedures to construct adjacency matrices to represent thefunctional and structural connectivity networks below.
Correlation matrixUsing FNIRT (FMRIB’s non-linear image registrationtool), the ICBM152 T1 template was non-linearly regis-tered to each participant’s preprocessed fMRI scans, byusing the PRESTO-aligned T1-weighted image as theregistration target. This spatial transformation was thenapplied to the AAL-90 atlas label map using FSL’s apply-warp function, with nearest-neighbour interpolation toretain the values of the atlas labels. The resulting AAL-90 map registered to each individual participant’s func-tional scans was masked using that participant’s similarlyregistered tissue segmentation map to select only greymatter voxels.Using this grey matter AAL-90 label map, the averaged
time series corresponding to each AAL-90 brain areawas extracted from the preprocessed fMRI scans. Thesymmetric 90 × 90 correlation matrix (Additional file 8)for each participant was constructed by calculating thezero-lagged Pearson correlation coefficient between allpairs of BOLD time series. Each element (wij) of the cor-relation matrix is the correlation between the time seriesextracted from the ith and the jth AAL-90 regions.Zeroes have been assigned to the diagonal.
Connection matrixSimilarly to the preprocessing of the functional images de-scribed above, T1-weighted images were rigidly registeredto the corresponding first b = 0 image using FLIRT, seg-mented GM maps were linearly transformed to the corre-sponding b = 0 space, the b=0-registered T1-weightedimages were non-linearly registered to the ICBM152 T1template using FNIRT and AAL-90 label maps were
Paul et al. Molecular Autism (2021) 12:3 Page 6 of 18

warped to the b = 0 images using the inverted non-lineartransformations with nearest-neighbour interpolation.The voxels of the label map that corresponded to greymatter in the b=0-registered segmented GM map were se-lected for tractography.Probabilistic tractography was executed from each
brain area to the other 89 brain areas using FDT(FMRIB’s Diffusion Toolbox). For every sampled stream-line fibre at the seed voxel, a sample direction was se-lected from the local direction distribution. Moving 0.5mm to a new location along the sample direction, a newsample direction was selected from the direction distri-bution at that new location. Five thousand streamline fi-bres were sampled from each seed voxel in theprobabilistic tractography framework. Let us consider abrain area comprising n voxels. Dividing the number offibres passing through that area by n × 5000 yields theconnection probability from the seed area to the givenarea. However, the connection probability of the ithbrain area to the jth brain area is not necessarily equalto the connection probability of the jth brain area to theith brain area. We have calculated undirected connec-tion probability between those two areas (Pij) by takingthe average of those two probabilities. A symmetric con-nection matrix (Additional file 8) of dimension 90 × 90for each participant was constructed by performingprobabilistic tractography from all 90 brain areas. Eachelement (wij) of the connection matrix denotes the un-directed connection probability between the ith and thejth AAL-90 regions. Zeroes have been assigned to thediagonal.
Network metricsUsing the brain connectivity toolbox [27], we have calcu-lated the functional and the structural network metricsfor each participant from the corresponding correlationmatrix and the connection matrix respectively, the coef-ficient in each matrix cell serving as an adjacency weightfor the corresponding pair of AAL-90 regions. As we areinterested not in whole-group patterns but in individualdifferences, weights have not been thresholded [6]; anynon-zero weight represents some measure of adjacency.This strategy avoids the potential of artefactually gener-ating disconnected graph components which could skewthe measures in some subjects. In selecting these met-rics, we have taken a cue from previous studies of autismand autistic traits: Billeci et al. [30] used characteristicpath length and clustering coefficient, and Jakab et al.[28] used local and global efficiency. A deficit in “small-world” network topology, defined as a combination ofhigh density of connections for computation within localneural neighbourhoods and direct connection routes forinformation transfer between these neighbourhoods, hasbeen cited as a distinguishing characteristic of the
autistic brain [73]. Small-world topology is maintainedby minimising ‘wiring’ connections whilst maintainingstrong clustering; small characteristic path length andlarge clustering coefficient, therefore, constitute perhapsthe most straightforward graph-theoretic metrics ofcomplexity. Global and local efficiencies are related topath length and clustering, respectively, but efficiencycan be a more powerful derived metric for empiricaldata, because its summation of reciprocals of pathlengths gives weight to hubs and parallel connectionsrather than to disconnected regions and serial con-nections [74].
StrengthStrength of the ith node (swi ) of the network is denotedby the summation over the edge weights (wij) of all linksto the ith node:
swi ¼X
j∈Nwij ð1Þ
The value of the nodal strength reveals the significanceof that node in the network [27].
Characteristic path lengthThe characteristic path length of a network is defined asthe average shortest path length between all pairs ofnodes in the network [27]:
Lw ¼ 1N
Xi∊N
Pi∊N ; j≠id
wij
N − 1ð2Þ
where dwij (the inverse of connection strength, wij) de-
notes the element of weighted distance matrix (dw).Characteristic path length is a global measure of integra-tion in a network.
Clustering coefficientThe weighted clustering coefficient of the ith node ofthe network (Cw
i ) is defined [75] as
Cwi ¼
Pj;m∈N wijwimwjm
� �13
ki ki − 1ð Þ ð3Þ
where ki stands for the weighted degree, ki = ∑j ∈Nwij.When ki = 0 or 1, a zero value is assigned to the cluster-ing coefficient of that node. The clustering coefficient isa network-based measure of segregation which denotesthe ability of specialised processing within densely con-nected brain regions [27, 76]. The nodal clustering coef-ficient represents how strongly a node is clustered withits neighbouring nodes. The global clustering coefficientof a network is calculated by taking the average of theclustering coefficients over all the nodes of the network:
Paul et al. Molecular Autism (2021) 12:3 Page 7 of 18

Cw ¼ 1N
Xi∈N
Cwi ð4Þ
The clustering coefficient of a network (Cw) charac-terises the level of interconnectivity of the network.
Global and local efficienciesGlobal and local efficiencies measure the integration ofinformation from distributed brain areas and estimatehow well these brain areas communicate. Global effi-ciency of the network is computed using the followingexpression [77]:
Ewglob ¼
1N
Xi∈N
Pj∈N ; j≠iðdw
i jÞ − 1
N − 1ð5Þ
On the other hand, local efficiency of the ith node ofthe network is the global efficiency of the neighbour-hood of that node [27]:
Ewloc;i ¼
12
Xi∈N
Pj;m∈N ; j≠i wijwjm dw
jm Nið Þh i − 1
� �13
ki ki − 1ð Þð6Þ
where dwjmðNiÞ denotes the shortest path between the jth
and mth nodes which are within the neighbourhood ofthe ith node.
Statistical analysesBehavioural measures and the functional and structural net-work metrics were z-transformed. Behavioural measureswere correlated with the network metrics using multi-linearregression. Age, gender, full-scale IQ, head-motion effect(average frame-wise displacement [78]) and brain volumeswere considered as confounding factors, and were removedfrom the neuroimaging-based measures using multiple linearregression. Spearman correlation coefficients between theresulting residuals of the neuroimaging-based measures andthe behavioural measures were computed across all subjects.Tail probabilities, one-sided with respect to whichever tailwas nearest, were estimated using permutation testing (as inthe supplementary information of [79]) as [min(|{ρrand |ρobs>ρrand}|, |{ρrand | ρobs<ρrand}|)+1]/N where ρobs is theSpearman correlation computed from the actual data andthe ρrand are the N = 10000 Spearman correlations computedon the N = 10000 random permutations of the data (Add-itional file 9). Statistical significances of the correlations be-tween the nodal/regional neuroimaging-based measures andeach behavioural measure were thresholded at 5% false dis-covery rate (FDR) [80], except in the case of theory-of-mindmeasures with an a priori hypothetical association with brainregions in the right temporoparietal junction. Effect sizes areindicated by absolute values of the correlation coefficients.
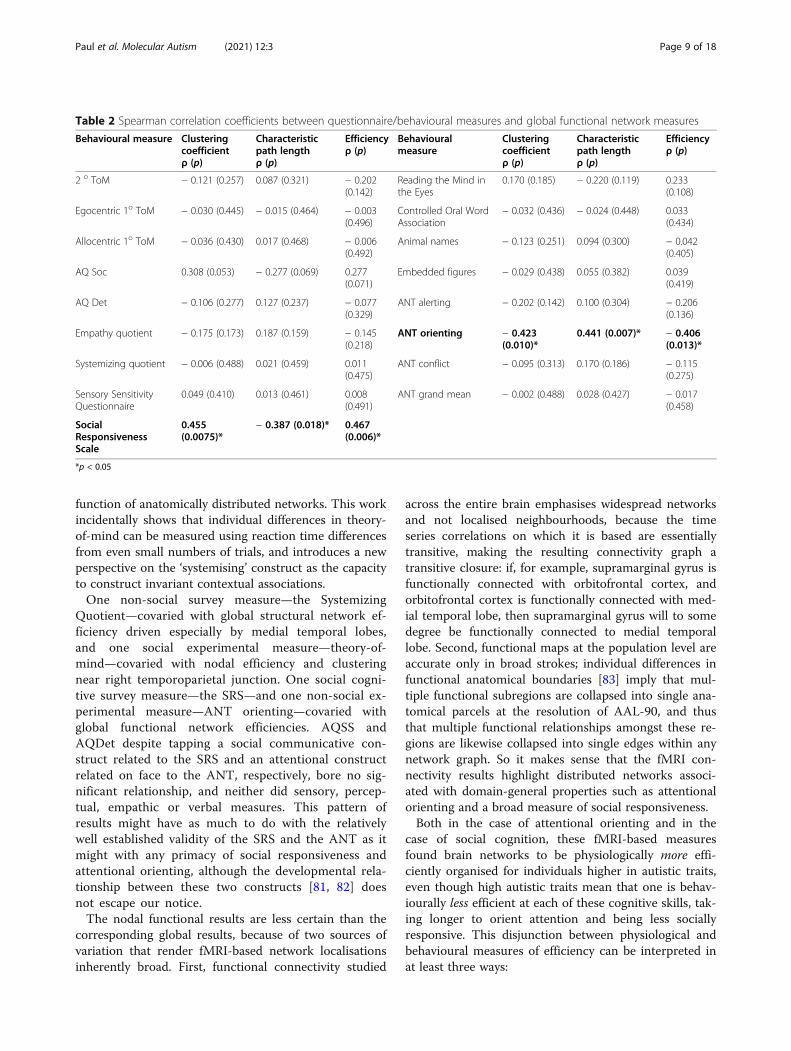
ResultsGlobal functional clustering, characteristic path lengthand efficiency correlated with Social ResponsivenessScale (Table 2). This global association was driven bynodal strength, clustering and efficiency in a networkspanning most of the cerebral cortex (as well as putamenand globus pallidus), with strength differences in pre-frontal, medial-anterior temporal and temporoparietalcortices (full details in Table 3). Global functional clus-tering, characteristic path length and efficiency also cor-related with the orienting score on the AttentionNetwork Test (Table 2). This global association wasdriven by nodal clustering (but not significantly by nodalstrength or efficiency) in a similarly widespread cerebralnetwork encompassing a smaller number of regions inprefrontal, temporal and parietal cortices as well as puta-men and globus pallidus (full details in Table 4, illus-trated in Fig. 1). We have not observed any significantassociations between global (p > 0.05) or nodal (pFDR >0.05) functional network measures and other behaviouralmeasures (Table 2).Global structural clustering and efficiency correlated with
Systemizing Quotient (SQ) scores (p < 0.05) (Table 5). Thisglobal association was driven by nodal strength, clusteringand efficiency in a network comprising the medial temporallobes and right temporal pole (full details in Table 6, illus-trated in Fig. 1). At the nodal level, allocentric first-ordertheory-of-mind reaction time difference was associated withefficiency (ρ = − 0.397, one-tailed p = 0.0153) and clustering(ρ = − 0.400, one-tailed p = 0.014, both uncorrected given apriori association of theory-of-mind with right temporoparie-tal junction) in right supramarginal gyrus, which was the onlybrain region to manifest any significant uncorrected correl-ation with theory-of-mind. We have not observed any sig-nificant associations between global (p > 0.1) or nodal (pFDR> 0.05) structural network measures and other behaviouralmeasures (Table 5). Global structural characteristic pathlengths were not significantly associated with any behaviouralmeasures (p > 0.05).
DiscussionWe applied both survey and experimental measures, andboth functional and structural brain imaging, to assaybrain-behaviour relationships in both social and non-social autistic trait dimensions. Various social and non-social measures correlated with both global functionaland regional structural network efficiency, although thedirection of these correlations was contrary to hypoth-esis: greater autistic traits tended to associate withgreater efficiency. Where correlations were detected,more specific capacities such as systemising and theory-of-mind were related to structure of specific brain re-gions whereas general or integrative traits such as socialresponsiveness and attention orienting associated with
Paul et al. Molecular Autism (2021) 12:3 Page 8 of 18
function of anatomically distributed networks. This workincidentally shows that individual differences in theory-of-mind can be measured using reaction time differencesfrom even small numbers of trials, and introduces a newperspective on the ‘systemising’ construct as the capacityto construct invariant contextual associations.One non-social survey measure—the Systemizing
Quotient—covaried with global structural network ef-ficiency driven especially by medial temporal lobes,and one social experimental measure—theory-of-mind—covaried with nodal efficiency and clusteringnear right temporoparietal junction. One social cogni-tive survey measure—the SRS—and one non-social ex-perimental measure—ANT orienting—covaried withglobal functional network efficiencies. AQSS andAQDet despite tapping a social communicative con-struct related to the SRS and an attentional constructrelated on face to the ANT, respectively, bore no sig-nificant relationship, and neither did sensory, percep-tual, empathic or verbal measures. This pattern ofresults might have as much to do with the relativelywell established validity of the SRS and the ANT as itmight with any primacy of social responsiveness andattentional orienting, although the developmental rela-tionship between these two constructs [81, 82] doesnot escape our notice.The nodal functional results are less certain than the
corresponding global results, because of two sources ofvariation that render fMRI-based network localisationsinherently broad. First, functional connectivity studied
across the entire brain emphasises widespread networksand not localised neighbourhoods, because the timeseries correlations on which it is based are essentiallytransitive, making the resulting connectivity graph atransitive closure: if, for example, supramarginal gyrus isfunctionally connected with orbitofrontal cortex, andorbitofrontal cortex is functionally connected with med-ial temporal lobe, then supramarginal gyrus will to somedegree be functionally connected to medial temporallobe. Second, functional maps at the population level areaccurate only in broad strokes; individual differences infunctional anatomical boundaries [83] imply that mul-tiple functional subregions are collapsed into single ana-tomical parcels at the resolution of AAL-90, and thusthat multiple functional relationships amongst these re-gions are likewise collapsed into single edges within anynetwork graph. So it makes sense that the fMRI con-nectivity results highlight distributed networks associ-ated with domain-general properties such as attentionalorienting and a broad measure of social responsiveness.Both in the case of attentional orienting and in the
case of social cognition, these fMRI-based measuresfound brain networks to be physiologically more effi-ciently organised for individuals higher in autistic traits,even though high autistic traits mean that one is behav-iourally less efficient at each of these cognitive skills, tak-ing longer to orient attention and being less sociallyresponsive. This disjunction between physiological andbehavioural measures of efficiency can be interpreted inat least three ways:
Table 2 Spearman correlation coefficients between questionnaire/behavioural measures and global functional network measures
Behavioural measure Clusteringcoefficientρ (p)
Characteristicpath lengthρ (p)
Efficiencyρ (p)
Behaviouralmeasure
Clusteringcoefficientρ (p)
Characteristicpath lengthρ (p)
Efficiencyρ (p)
2 o ToM − 0.121 (0.257) 0.087 (0.321) − 0.202(0.142)
Reading the Mind inthe Eyes
0.170 (0.185) − 0.220 (0.119) 0.233(0.108)
Egocentric 1o ToM − 0.030 (0.445) − 0.015 (0.464) − 0.003(0.496)
Controlled Oral WordAssociation
− 0.032 (0.436) − 0.024 (0.448) 0.033(0.434)
Allocentric 1o ToM − 0.036 (0.430) 0.017 (0.468) − 0.006(0.492)
Animal names − 0.123 (0.251) 0.094 (0.300) − 0.042(0.405)
AQ Soc 0.308 (0.053) − 0.277 (0.069) 0.277(0.071)
Embedded figures − 0.029 (0.438) 0.055 (0.382) 0.039(0.419)
AQ Det − 0.106 (0.277) 0.127 (0.237) − 0.077(0.329)
ANT alerting − 0.202 (0.142) 0.100 (0.304) − 0.206(0.136)
Empathy quotient − 0.175 (0.173) 0.187 (0.159) − 0.145(0.218)
ANT orienting − 0.423(0.010)*
0.441 (0.007)* − 0.406(0.013)*
Systemizing quotient − 0.006 (0.488) 0.021 (0.459) 0.011(0.475)
ANT conflict − 0.095 (0.313) 0.170 (0.186) − 0.115(0.275)
Sensory SensitivityQuestionnaire
0.049 (0.410) 0.013 (0.461) 0.008(0.491)
ANT grand mean − 0.002 (0.488) 0.028 (0.427) − 0.017(0.458)
SocialResponsivenessScale
0.455(0.0075)*
− 0.387 (0.018)* 0.467(0.006)*
*p < 0.05
Paul et al. Molecular Autism (2021) 12:3 Page 9 of 18

Table 3 Spearman correlation coefficients between Social Responsiveness Scale scores and nodal functional network measures
Region Nodal strength ρ (p) Nodal clustering ρ (p) Nodal efficiency ρ (p)
L precentral gyrus 0.442 (0.008) 0.452 (0.006)
R precentral gyrus 0.468 (0.005) 0.514 (0.002)
L superior frontal gyrus 0.549 (0.001) 0.523 (0.001)
L superior frontal (orbital) 0.545 (0.001) 0.423 (0.011) 0.434 (0.010)
R superior frontal (orbital) 0.558 (0.0006) 0.466 (0.004) 0.449 (0.006)
R middle frontal gyrus 0.510 (0.003) 0.510 (0.002)
L middle frontal (orbital) 0.603 (0.0004) 0.636 (0.0002) 0.639 (0.0002)
R middle frontal (orbital) 0.547 (0.001) 0.518 (0.002) 0.532 (0.001)
L inferior frontal (opercular) 0.382 (0.020) 0.413 (0.013)
R inferior frontal (triangular) 0.446 (0.007) 0.401 (0.015)
L inferior frontal (orbital) 0.440 (0.007) 0.434 (0.009)
R inferior frontal (orbital) 0.389 (0.017)
L Rolandic operculum 0.397 (0.015)
R Rolandic operculum 0.490 (0.003) 0.452 (0.006)
L supplementary motor area 0.590 (0.0006) 0.366 (0.023) 0.449 (0.007)
L medial superior frontal gyrus 0.510 (0.003)
L olfactory 0.396 (0.017) 0.437 (0.008)
R olfactory 0.355 (0.027) 0.365 (0.025)
R superior frontal gyrus (medial) 0.413 (0.013) 0.358 (0.027)
L superior frontal (medial orbital) 0.362 ( 0.024)
R superior frontal (medial orbital) 0.379 (0.021)
L insula 0.409 (0.013) 0.383 (0.019)
R insula 0.377 (0.020) 0.351 (0.029)
L anterior cingulate, paracingulate 0.368 (0.022)
R anterior cingulate, paracingulate 0.437 ( 0.009) 0.376 ( 0.021)
L median cingulate, paracingulate 0.560 (0.0008) 0.468 (0.004)
L posterior cingulate 0.368 (0.024) 0.386 (0.020)
R posterior cingulate 0.372 (0.022)
R hippocampus 0.576 (0.001) 0.410 (0.011) 0.345 (0.030)
L parahippocampal gyrus 0.405 (0.012) 0.337 (0.030)
R parahippocampal gyrus 0.431 (0.008) 0.412 (0.011)
L amygdala 0.449 (0.006) 0.415 ( 0.013)
R amygdala 0.479 (0.003) 0.418 (0.010) 0.393 (0.016)
L calcarine cortex 0.483 (0.003) 0.461 (0.005)
R calcarine cortex 0.445 (0.007) 0.385 (0.017)
L cuneus 0.388 (0.016) 0.401 (0.014)
R cuneus 0.409 (0.012) 0.381 (0.020)
L lingual gyrus 0.487 (0.003) 0.445 (0.006)
L superior occipital gyrus 0.464 (0.005) 0.492 (0.002)
L fusiform gyrus 0.356 (0.026) 0.363 (0.022)
R fusiform gyrus 0.413 (0.012) 0.408 (0.012)
L postcentral gyrus 0.355 (0.029)
R postcentral gyrus 0.355 (0.027)
L inferior parietal lobule 0.492 (0.003) 0.433 (0.010)
Paul et al. Molecular Autism (2021) 12:3 Page 10 of 18

(1) Despite the deficits in these two specificbehavioural measures, autistic traits can makepeople more efficient at other aspects of cognition.This scenario is easy to imagine and is enunciatedin Asperger’s absent-minded “Professor” whose“besonderen Leistungen” (“unusual achievements”)come hand in hand with “Hilflosigkeit dem prak-tischen Leben gegenüber” (“helplessness in the faceof practical life”) [84], a trope repeated time andagain in postmodern literature and media (e.g. [85],p. 6). In terms of neural and cognitive mechanisms,a perturbed excitatory/inhibitory balance [86] pro-duces abnormally low network entropy [87] whichwhen it arises during activity-dependent develop-ment evokes abnormal desegregation between net-works [88, 89] consistent with the observation ofenhanced ‘rich club’ connectivity of network hubsin autism [6, 90]. The cognitive result can be tem-porally inefficient orienting [91] and spatially ineffi-cient filtering [92]. This ‘sticky’ style of attentionmay lead to rumination on particular stimuli anddetails, and to compensatory processing [93] thatyields ultimately a more complete style of represen-tation based on bricolage [40]; likewise, time and
cognitive effort not spent on exhausting and oftenfutile attempts at social understanding may insteadbe invested in understanding the more tractableworld of deterministic systems and rules.
(2) fMRI-based connectivity may measure a crudecombination of connectivities within anatomicallysuperimposed functional networks that differ infMRI-indistinguishable parameters such as operat-ing frequency band and cellular physiology. Previ-ous studies of eyes-closed resting EEG takentogether show, if nothing else, that the picture ofautistic brain connectivity becomes complicatedwhen frequency band is taken into account. Find-ings include elevated short-range coherence in thetheta band and reduced long-range coherence inthe lower-alpha band [94], elevated short-range andreduced long-range coherence in delta band correl-ating with score on the Autism Diagnostic Observa-tion Schedule (ADOS) [73], and reduced delta andtheta coherences at all ranges with reduced alphaand beta coherences at some short-range electrodepairs [95]. An eyes-open resting MEG study meas-uring graph-theoretic relations amongst correlationsbetween signal envelopes in a variety of frequency
Table 3 Spearman correlation coefficients between Social Responsiveness Scale scores and nodal functional network measures(Continued)
Region Nodal strength ρ (p) Nodal clustering ρ (p) Nodal efficiency ρ (p)
R inferior parietal lobule 0.356 (0.028) 0.393 (0.017)
L supramarginal gyrus 0.478 (0.004) 0.403 (0.014) 0.417 (0.011)
R supramarginal gyrus 0.479 (0.004) 0.443 (0.007)
L angular gyrus 0.572 (0.0006) 0.457 ( 0.006) 0.511 (0.003)
R angular gyrus 0.448 (0.007) 0.445 (0.007)
L precuneus 0.617 (0.0002) 0.567 ( 0.001)
R precuneus 0.374 (0.023) 0.359 (0.026)
L paracentral lobule 0.374 (0.021)
R paracentral lobule 0.419 (0.011)
L putamen 0.369 (0.023)
R putamen 0.587 (0.0004) 0.550 (0.0008)
L pallidum 0.486 (0.004) 0.444 (0.008)
R pallidum 0.649 (0.0001) 0.366 (0.021)
R lenticular nucleus, pallidum 0.357 (0.026)
L thalamus 0.358 (0.026)
L Heschl’s gyrus 0.363 (0.022) 0.354 (0.027)
L superior temporal pole 0.499 (0.003) 0.444 (0.007)
R superior temporal pole 0.354 (0.029) 0.365 (0.023)
L middle temporal gyrus 0.503 (0.003) 0.459 (0.007) 0.473 (0.005)
L middle temporal pole 0.451 (0.007) 0.399 (0.015)
R middle temporal pole 0.466 (0.006) 0.392 (0.016)
R inferior temporal 0.578 (0.0007) 0.417 (0.010) 0.417 (0.011)
Paul et al. Molecular Autism (2021) 12:3 Page 11 of 18

bands found greater gamma network efficiency butlesser beta efficiency in autism, both categoricallyand in correlation with ADOS scores, along withgreater alpha efficiency categorically [96]; these au-thors suggested an altered balance between height-ened bottom-up, gamma-mediated signalling andattenuated top-down, beta-mediated signalling [97].Both EEG [98] and intracranial [99] recordings inhumans have demonstrated that BOLD fMRI ismost positively coupled to gamma oscillations.Viewed through this lens, then, our fMRI connect-ivity data become consistent with the thesis ofheightened bottom-up, gamma-mediated connectiv-ity not only in autism categorically but perhaps alsowith autistic traits dimensionally. This second caseof interpretation is not at all mutually exclusivewith the first case above; indeed, such an alteredbalance between bottom-up and top-down informa-tion flow could be the physiological substrate ofautistic cognitive superiorities and deficits.
(3) There may be a discontinuity between clinicallyautistic impairment on the one hand and subclinical
levels of nominally ‘autistic’ traits that form part ofgeneral individual differences on the other. Autistictraits in separate domains of cognitive function tendto be inherited largely independently [100, 101] andconstitute distinct domains of function in the non-autistic population [102], but once they cross water-shed levels they may begin to synergise, reinforcingeach other as development proceeds [19]. The re-sult might be a classic inverted-U dose-responsecurve: traits that individually and in moderate dosesare cognitively adaptive may in combination and inhigher doses become cognitively impairing overall,as development proceeds. Indeed, DTI-based im-aging shows that local nodal network inefficiencymanifests as early as 6 months of age in familiallyhigh-risk infants who later are diagnosed with aut-ism, progressing from right primary auditory andmiddle and superior temporal gyri to higher-ordercortices [103].
Perhaps related to this third possibility of discontinuityacross the diagnostic boundary is the current result’splace within a mixed bag of previous findings: both func-tional [28] and structural [30] imaging studies have iden-tified reduced average nodal resting-state functionalnetwork efficiency as a function of autistic traits in non-autistic adults [28], driven by inefficiencies in thedefault-mode network centred on posterior cingulum.However, structural imaging in categorically autisticchildren shows the opposite relationship, heightened ef-ficiency with increasing autism severity [30]. Studies ofautistic traits and simple functional connectivity, not de-riving network metrics, have found mixed results inwhich autistic traits are related to lesser functional con-nectivity between a rostral anterior cingulate region ofinterest and bilateral mid-insula [29] but greater func-tional connectivities between the same region of interestand other insular subregions [29, 104] as well as lateraloccipital cortex, superior parietal cortex and angulargyrus [29], and perhaps developmentally related to lesserconnectivity within the default-mode network centredon posterior cingulum [104]. One study identified op-posite occipitofrontal connectivity perturbations in twosubgroups [105]. To the extent that this collection ofmethods and results can support any general conclusionabout functional network characteristics and autistictraits, that conclusion seems the negative one that thisrelationship is not necessarily monotonic across the aut-ism diagnostic boundary and/or across development,and that these dependencies may differ between brainnetworks. Indeed, recent theoretical work points out thatin this context of normal individual differences in cogni-tion, so-called ‘autistic’ trait dimensions, defined so gen-erally as to encompass much individual cognitive
Table 4 Spearman correlation coefficients between AttentionNetwork Test orienting scores and nodal functional clusteringcoefficients
Regions Clustering coefficientρ (p)
R precentral gyrus − 0.511 (0.003)
L superior frontal − 0.417 (0.010)
L middle frontal (orbital) − 0.480 (0.004)
R middle frontal (orbital) − 0.431 (0.009)
L inferior opercular frontal − 0.412 (0.012)
R olfactory − 0.450 (0.006)
R middle orbitofrontal − 0.429 (0.007)
R gyrus rectus − 0.439 (0.008)
L amygdala − 0.485 (0.003)
R amygdala − 0.479 (0.004)
R calcarine cortex − 0.553 (0.0008)
L superior occipital gyrus − 0.445 (0.006)
R postcentral gyrus − 0.434 (0.007)
R inferior parietal lobule − 0.481 (0.004)
R supramarginal gyrus − 0.571 (0.001)
L putamen − 0.437 (0.006)
R putamen − 0.480 (0.003)
L pallidum − 0.471 (0.004)
R pallidum − 0.434 (0.010)
L superior temporal pole − 0.424 (0.009)
L middle temporal pole − 0.494 (0.003)
R middle temporal pole − 0.455 (0.005)
All results are significant at 5% FDR level
Paul et al. Molecular Autism (2021) 12:3 Page 12 of 18

Fig. 1 Examples of functional and structural, experimental and survey results. Regional correlations between nodal functional network efficienciesand Attention Network Test orienting scores (top), and between nodal structural network clustering coefficients and Systemizing Quotient scores(bottom). Sizes of the regions reflect of AAL-90 parcellations and are not individually any indication of network extents. Orienting is associatedwith a functional attention network comprising basal ganglia and frontal, parietal and visual cortices, overlapping substantially with that for socialresponsiveness (not shown), whereas systemising is associated with structural contextual-association networks within parahippocampal cortices.Right supramarginal gyrus, the cortical region most strongly associated with attention orienting functionally, also is the region associated withtheory-of-mind structurally
Table 5 Spearman correlation coefficients between questionnaire/behavioural measures and global structural network measures
Behaviouralmeasures
Clusteringcoefficientρ (p)
Characteristicpath lengthρ (p)
Efficiencyρ (p)
Behaviouralmeasures
Clusteringcoefficientρ (p)
Characteristicpath lengthρ (p)
Efficiencyρ (p)
2 o ToM 0.127 (0.248) − 0.051 (0.394) 0.144(0.218)
Reading the Mind inthe Eyes
− 0.162 (0.195) 0.210 (0.135) − 0.141(0.229)
Allocentric 1o ToM − 0.266 (0.076) 0.216 (0.130) − 0.280(0.065)
Controlled Oral WordAssociation
− 0.079 (0.333) 0.114 (0.273) − 0.073(0.349)
Egocentric 1o ToM − 0.205 (0.137) 0.149 (0.216) − 0.169(0.181)
Animal names 0.077 (0.342) − 0.005 (0.487) 0.154(0.207)
AQ Soc − 0.104 (0.295) 0.136 (0.235) − 0.115(0.273)
Embedded figures − 0.088 (0.314) − 0.002 (0.498) − 0.076(0.335)
AQ Det − 0.067 (0.366) 0.107 (0.288) − 0.063(0.372)
ANT alerting 0.003 (0.495) 0.056 (0.379) 0.043(0.415)
Empathy quotient 0.221 (0.124) − 0.235 (0.106) 0.213(0.131)
ANT orienting 0.152 (0.210) − 0.164 (0.196) 0.152(0.206)
Systemizingquotient
0.368 (0.023)* − 0.256 (0.090) 0.385(0.018)*
ANT conflict − 0.052 (0.396) − 0.041(0.410) − 0.068(0.365)
Sensory SensitivityQuestionnaire
0.156 (0.202) − 0.242 (0.097) 0.107(0.286)
ANT grand mean 0.293 (0.211) − 0.283 (0.196) 0.301(0.207)
Social ResponsivenessScale
0.207 (0.128) − 0.175 (0.168) 0.219(0.116)
*p < 0.05
Paul et al. Molecular Autism (2021) 12:3 Page 13 of 18

variation, may well be influenced by mechanismsdistinct from those that produce the syndrome ofautism [11].Our DTI data, in contrast to fMRI, offer by their na-
ture a more granular description of connectivity,highlighting specific anatomical nodes of convergenceassociated with contextual association (tapped by theSystemizing Quotient) and theory-of-mind in particular.In this analysis, greater network integrity of a functionalbrain region reflects greater ability within the corre-sponding domain of cognitive function, regardless ofwhether such ability maps onto greater or lesser levels ofautistic traits.It seems especially notable that this analysis con-
firms right supramarginal gyrus in particular as adriver of faster perspective-taking, a result consistentwith experimental evidence relating the right tempor-oparietal junction to allocentric perspective-taking[106] and attribution of mental states [31]; the poster-ior inferior extent of this AAL-90 region is consistentwith the localisation of theory-of-mind activations[107], although an analysis in individual subject spacecould provide more specific anatomical confirmation.Likewise notable is the absence, within these func-tional and structural graph measures, of any associ-ation of right supramarginal gyrus with the RMET,contrary to the case of simple correlative analysiswith task-based fMRI [108].Interpretation of the SQ’s bilateral medial temporal
localisation is complicated by the persistent ambiguityas to what skill or trait it is that the SQ is measuring[39], although we have argued (vide supra) that theSQ measures invariant contextual association. Likethe slowed attentional orienting discussed above, in-variant contextual association can be straightforwardlyassociated with autistic bricolage, the building up ofconfigural representations from their component partsand details. And indeed contextual association in gen-eral has been proposed [109, 110] as a parsimoniouslyunifying theme for parahippocampal cortex’s func-tional associations with mapping and navigation aswell as episodic memory, all skills associated withautism. The computational structure of the medialtemporal lobe can support representations of spatial,temporal, and conceptual distances and contexts [111];autistic differences in synaptic strengths might bias
hippocampal firing sequences towards representation ofshort distances, producing a knack for local detail.
LimitationsInterpretation of these relationships between brain con-nectivity and behavioural measures is complicated manymeanings of the term ‘connectivity’ [88, 112], referringvariously to functional connectivity (correlated timeseries), anatomical connectivity (tracts and synapses) andcomputational connectivity (mutual information), onmultiple spatial and temporal scales. Indeed, the ques-tion of connectivity differences in autistic versus non-autistic brains, or in this case as a function of individualdifferences in autistic traits, depends at least as much onwhat we look for and how we look for it as it does onwhat we are looking at.Individual functional mapping both of task-related ac-
tivations within delimited brain areas [113] and ofresting-state network correlations across the whole brain[83] shows that individual functional anatomical bound-aries are idiosyncratic, and anatomically neighbouringfunctions are interdigitated when examined on spatialscales finer that gyral and sulcal definitions [83]. Anystudy that bases and expresses its localisations in termsof central tendencies across individuals, then, can yieldonly approximate results. Nevertheless, such results doretain an approximate meaning because functional ana-tomical adjacencies and parallel connections are pre-served across individuals, even though their geometricdetails are not [83]. In terms of the current study, eventhough a particular AAL-90 parcel will in general in-clude more than a single functional brain region, at apopulation (and sample) level, this blurring of severalindividual functional anatomies into each AAL-90parcel does not impair power to make inferencesabout the functional anatomical neighbourhood ofthat parcel (e.g., [114–116]), and to support hypoth-eses that localise a functional region wholly or prob-abilistically to a particular parcel, e.g. theory-of-mindwhose right temporoparietal hypothesis falls withinAAL-90’s right supramarginal gyrus parcel.No matter how powerful the physiological assays,
brain-behaviour correlations can be only as sensitive andspecific as the behavioural measures are. Of especialrelevance to this current work, quantitative assessmentof sensory sensitivity remains a developing endeavour, in
Table 6 Spearman correlation coefficients between Systemizing Quotient (SQ) scores and nodal structural network measures
Regions Strength vs SQρ (p)
Regions Clustering coefficient vs SQρ (p)
Regions Efficiency vs SQρ (p)
L Parahippocampal 0.585 (0.0003) R Parahippocampal 0.556 (0.0007) L Parahippocampal 0.556 (0.001)
R Parahippocampal 0.592 (0.0004) R Middle temporal pole 0.517 (0.0013) R Parahippocampal 0.564 (0.0005)
R Olfactory 0.555 (0.0007)
All results are significant at 5% FDR level
Paul et al. Molecular Autism (2021) 12:3 Page 14 of 18

which survey reports such as the SSQ may not convergewith direct observations [117]. Likewise, the story sur-rounding FC-EFT and EFT variants in general as ameasure of autistic perceptual focus on detail has be-come more and more equivocal [54], and the RMETseems to accomplish its correlation with autistic traitsmore by measuring verbal skills than by measuringempathy per se [50, 51].
ConclusionsThis study associates more autistotypal (i.e. more im-paired) levels of social responsiveness and attentionorienting with greater efficiency of brain-wide func-tional networks, and greater levels of systemising andof social perspective-taking with greater structuralnetwork efficiencies centring on medial/anterior tem-poral lobe and right temporoparietal junction, respect-ively. The skills indexed by widespread functionalnetwork efficiency may be more general across socialand non-social domains of cognition, and thoseindexed by anatomically specific structural networkefficiency more domain-specific. This study has notinvestigated intra-individual variation in the moment-to-moment dynamics of functional brain connectivity[118, 119], an approach that in future may help to re-solve apparent inconsistencies between these andother early results on dimensional relationships be-tween autistic traits and neural connectivity. Furtherwork can complement the current results with EEGor MEG imaging modalities sensitive to high-frequency signals and can resolve the open questionsof whether these relationships between autistic traitsand brain network efficiencies are invariant across de-velopment, and across the diagnostic boundary be-tween autistic traits and autism spectrum conditions.Understanding how people with autistic traits thinkcan ultimately help inform individualised supports forpeople within and beyond the autism spectrum.
Supplementary InformationThe online version contains supplementary material available at https://doi.org/10.1186/s13229-020-00377-8.
Additional file 1. Behavioural data. Spreadsheet of behavioural data forall subjects; and log data from each subject’s theory-of-mind test, in raw(ExperimentLog.txt) and tabular (.csv) formats.
Additional file 2. Structural images 1-7. Anonymised T1 structural im-ages for subjects 1 to 7, in gzipped NIfTI format.
Additional file 3. Structural images 8-14. Anonymised T1 structural im-ages for subjects 8 to 14, in gzipped NIfTI format.
Additional file 4. Structural images 15-21. Anonymised T1 structural im-ages for subjects 15 to 21, in gzipped NIfTI format.
Additional file 5. Structural images 22-27. Anonymised T1 structural im-ages for subjects 22 to 27, in gzipped NIfTI format.
Additional file 6. Structural images 28-30. Anonymised T1 structural im-ages for subjects 28, 29, and 30, in gzipped NIfTI format.
Additional file 7. Nuisance regressors. Nuisance regressor time series foreach subject, as floating-point values in ASCII text format.
Additional file 8. Connectivity matrices. Connection matrices andfunctional correlation matrices for each subject, as floating-point values inASCII text format, and MATLAB code for producing these.
Additional file 9. Brain-behaviour correlations. README file detailingdata curation; AAL-90 region masks in NIfTI format; spreadseehts of Spear-man correlations; code and data for the correlational analysis.
Additional file 10: Supplementary Methods. Theory-of-MindMeasurement.
AcknowledgementsThe study was designed and the data collected in 2011 whilst SP, AA, RM,PKR and MKB were at the National Brain Research Centre, Manesar, India.This study was presented in part at the annual meeting of the InternationalSociety for Autism Research, Montréal, on 2 May 2019.
Authors’ contributionsMKB, PKR, SP and AA conceived and designed the study. RM administered IQtests; AA collected the other behavioural data. DV performed data cleaningand prepared derived data for the theory-of-mind behavioural paradigm. SPcollected and analysed the brain imaging data and the brain-behaviour cor-relations. MKB, AA and SP wrote the paper. The authors read and approvedthe final manuscript.
Authors’ informationAA and SP contributed equally to this work.
FundingDevelopment of the video game software was supported by an agreementwith Cornell University, Department of Human Development under FacultyEarly Career Development Award BCS-0846892 from the Directorate for So-cial, Behavioral and Economic Sciences, US National Science Foundation,awarded to MKB.
Availability of data and materialsPseudonymised behavioural data and brain-behaviour correlations will bemade available as supplementary files alongside this manuscript. Ethical per-mission and consent do not allow for sharing individual subjects’ fMRI andDTI brain images.
Ethics approval and consent to participateThe study was conducted following the guidelines provided in theDeclaration of Helsinki and was approved by the National Brain ResearchCentre institutional human ethics committee. Informed consent wasobtained prior to psychometric and MRI data collection.
Consent for publicationNot applicable.
Competing interestsThe authors declare that they have no competing interests.
Author details1MIND Research Network, 1101 Yale Blvd NE, Albuquerque, NM 87106, USA.2National Brain Research Centre, NH-8, Nainwal Mode, Manesar 122051, India.3Centre for Cognitive Neuroscience, Universität Salzburg, Kapitelgasse 4-6,5020 Salzburg, Austria. 4National Institute of Mental Health and NeuroSciences, Hosur Road, Bangalore 560029, India. 5Department of Psychology,University of Oslo, Harald Schjelderups hus, Forskningsveien 3A, 0373 Oslo,Norway. 6Department of Psychology, Chaucer Bldg., Nottingham TrentUniversity, Shakespeare Street, Nottingham NG1 4FQ, UK. 7School ofBiomedical Engineering, Indian Institute of Technology (Banaras HinduUniversity), Varanasi 221005, India. 8The Com DEALL Trust, 224, 6th ‘A’ MainRoad, near Specialist Hospital, 2nd Block, HRBR Layout, Bangalore 560043,India.
Paul et al. Molecular Autism (2021) 12:3 Page 15 of 18

Received: 26 December 2019 Accepted: 2 September 2020
References1. Crespi B, Dinsdale N, Read S, Hurd P. Spirituality, dimensional autism, and
schizotypal traits: the search for meaning. PLoS One. 2019;14(3):e0213456.https://doi.org/10.1371/journal.pone.0213456.
2. van den Heuvel OA, Remijnse PL, Mataix-Cols D, Vrenken H, Groeneweg HJ.The major symptom dimensions of obsessive-compulsive disorder aremediated by partially distinct neural systems. Brain. 2009;132(4):853–68.https://doi.org/10.1093/brain/awn267.
3. Nelson MT, Seal ML, Phillips LJ, Merritt AH, Wilson R, Pantelis C. Aninvestigation of the relationship between cortical connectivity andschizotypy in the general population. J Nerv Ment Dis. 2011;199(5):348–53.https://doi.org/10.1097/NMD.0b013e318217514b.
4. Wang Y, Yan C, Yin DZ, Fan MX, Cheung EF, Pantelis C, Chan RC.Neurobiological changes of schizotypy: Evidence from both volume-basedmorphometric analysis and resting-state functional connectivity. SchizophrBull. 2015;41(Suppl 2):S444–54. https://doi.org/10.1093/schbul/sbu178.
5. Müller R-A, Shih P, Keehn B, Deyoe JR, Leyden KM, Shukla DK.Underconnected, but how? A survey of functional connectivity MRI studiesin autism spectrum disorders. Cereb Cortex. 2011;21(10):2233–43.https://doi.org/10.1093/cercor/bhq296.
6. Keown CL, Datko MC, Chen CP, Maximo JO, Jahedi A, Müller R-A. Networkorganization is globally atypical in autism: a graph theory study of intrinsicfunctional connectivity. Biol Psychiatry Cogn Neurosci Neuroimaging. 2017;2(1):66–75. https://doi.org/10.1016/j.bpsc.2016.07.008.
7. Abbott AE, Nair A, Keown CL, Datko M, Jahedi A, Fishman I, Müller RA.Patterns of atypical functional connectivity and behavioral links in autismdiffer between default, salience, and executive networks. Cereb Cortex.2016;26(10):4034–45. https://doi.org/10.1093/cercor/bhv191.
8. Elton A, Di Martino A, Hazlett HC, Gao W. Neural connectivity evidence for acategorical-dimensional hybrid model of autism spectrum disorder. BiolPsychiatry. 2016;80(2):120–8. https://doi.org/10.1016/j.biopsych.2015.10.020.
9. Johnson MH, Halit H, Grice SJ, Karmiloff-Smith A. Neuroimaging of typicaland atypical development: a perspective from multiple levels of analysis.Dev Psychopathol. 2002;14(3):521–36. https://doi.org/10.1017/s0954579402003073.
10. Johnson MH. Interactive specialization: a domain-general framework forhuman functional brain development? Dev Cogn Neurosci. 2011;1(1):7–21.https://doi.org/10.1016/j.dcn.2010.07.003.
11. Mottron L, Bzdok D. Autism spectrum heterogeneity: fact or artifact? MolPsychiatry. 2020; in press. https://doi.org/10.1038/s41380-020-0748-y.
12. Constantino JN, Todd RD. Intergenerational transmission of subthresholdautistic traits in the general population. Biol Psychiatry. 2005;57(6):655–60.https://doi.org/10.1016/j.biopsych.2004.12.014.
13. Warnell KR, Redcay E. Minimal coherence among varied theory of mindmeasures in childhood and adulthood. Cognition. 2019;191:103997.https://doi.org/10.1016/j.cognition.2019.06.009.
14. White SJ, Coniston D, Rogers R, Frith U. Developing the Frith-Happéanimations: a quick and objective test of Theory of Mind for adults withautism. Autism Res. 2011;4(2):149–54. https://doi.org/10.1002/aur.174.
15. Brewer N, Young RL, Barnett E. Measuring theory of mind in adults withautism spectrum disorder. J Autism Dev Disord. 2017;47(7):1927–41.https://doi.org/10.1007/s10803-017-3080-x.
16. Apperly IA, Warren F, Andrews BJ, Grant J, Todd S. Developmentalcontinuity in theory of mind: speed and accuracy of belief-desire reasoningin children and adults. Child Dev. 2011;82(5):1691–703. https://doi.org/10.1111/j.1467-8624.2011.01635.x.
17. Yoder KJ, Belmonte MK. Combining computer game-based behaviouralexperiments with high-density EEG and infrared gaze tracking. J Vis Exp.2010;46:e2320. https://doi.org/10.3791/2320.
18. Valla JM, Ganzel BL, Yoder KJ, Chen GM, Lyman LT, Sidari AP, Keller AE,Maendel JW, Perlman JE, Wong SKL, Belmonte MK. More than maths andmindreading: sex differences in empathising/systemising covariance. AutismRes. 2010;3(4):174–84. https://doi.org/10.1002/aur.143.
19. Valla JM, Belmonte MK. Detail-oriented cognitive style and socialcommunicative deficits, within and beyond the autism spectrum:independent traits that grow into developmental interdependence. DevRev. 2013;33(4):371–98. https://doi.org/10.1016/j.dr.2013.08.004.
20. Ronald A, Happé F, Plomin R. The genetic relationship between individualdifferences in social and nonsocial behaviours characteristic of autism. DevSci. 2005;8(5):444–58. https://doi.org/10.1111/j.1467-7687.2005.00433.x.
21. Ronald A, Happé F, Bolton P, Butcher LM, Price TS, Wheelwright S, Baron-Cohen S, Plomin R. Genetic heterogeneity between the three componentsof the autism spectrum: a twin study. J Am Acad Child Adolesc Psychiatry.2006;45(6):691–9. https://doi.org/10.1097/01.chi.0000215325.13058.9d.
22. Warrier V, Toro R, Won H, Leblond CS, Cliquet F, Delorme R, De Witte W,Bralten J, Chakrabarti B, Børglum AD, Grove J, Poelmans G, Hinds DA,Bourgeron T, Baron-Cohen S. Social and non-social autism symptoms andtrait domains are genetically dissociable. Commun Biol. 2019;2:328.https://doi.org/10.1038/s42003-019-0558-4.
23. Bullmore ET, Sporns O. Complex brain networks: graph theoretical analysisof structural and functional systems. Nat Rev Neurosci. 2009;10(3):186–98.https://doi.org/10.1038/nrn2575.
24. Hagmann P, Cammoun L, Gigandet X, Meuli R, Honey CJ, Wedeen VJ,Sporns O. Mapping the structural core of human cerebral cortex. PLoS Biol.2008;6(7):e159. https://doi.org/10.1371/journal.pbio.0060159.
25. Otte WM, van Diessen E, Paul S, Ramaswamy R, Subramanyam RallabandiVP, Stam CJ, Roy PK. Aging alterations in whole-brain networks duringadulthood mapping with the minimum spanning tree indices: The interplayof density, connectivity cost and life-time trajectory. NeuroImage. 2015;109:171–89. https://doi.org/10.1016/j.neuroimage.2015.01.011.
26. Van Dijk KRA, Hedden T, Venkataraman A, Evans KC, Lazar SW, Buckner RL.Intrinsic functional connectivity as a tool for human connectomics: theory,properties, and optimization. J Neurophysiol. 2010;103(1):297–321.https://doi.org/10.1152/jn.00783.2009.
27. Rubinov M, Sporns O. Complex network measures of brain connectivity:uses and interpretations. NeuroImage. 2010;52(3):1059–69. https://doi.org/10.1016/j.neuroimage.2009.10.003.
28. Jakab A, Emri M, Spisak T, Szeman-Nagy A, Beres M, Kis SA, Molnar P,Berenyi E. Autistic traits in neurotypical adults: correlates of graphtheoretical functional network topology and white matter anisotropypatterns. PLoS One. 2013;8(4):e60982. https://doi.org/10.1371/journal.pone.0060982.
29. Di Martino A, Shehzad Z, Kelly C, Krain Roy K, Gee DG, Uddin LQ, Gotimer K,Klein DF, Castellanos FX, Milham MP. Relationship between cingulo-insularfunctional connectivity and autistic traits in neurotypical adults. Am JPsychiatr. 2009;166(8):891–9. https://doi.org/10.1176/appi.ajp.2009.08121894.
30. Billeci L, Calderoni S, Conti E, Lagomarsini A, Narzisi A, Gesi C, Carmassi C,Dell'Osso L, Cioni G, Muratori F, Guzzetta A. Brain network organizationcorrelates with autistic features in preschoolers with autism spectrumdisorders and in their fathers: preliminary data from a DWI analysis. J ClinMed. 2019;8(4):e487. https://doi.org/10.3390/jcm8040487.
31. Saxe R, Wexler A. Making sense of another mind: the role of the righttemporo-parietal junction. Neuropsychologia. 2005;43(10):1391–9.https://doi.org/10.1016/j.neuropsychologia.2005.02.013.
32. Fan J, McCandliss BD, Fossella J, Flombaum JI, Posner MI. The activation ofattentional networks. NeuroImage. 2005;26(2):471–9. https://doi.org/10.1016/j.neuroimage.2005.02.004.
33. Fan J, Bernardi S, Dam NT, Anagnostou E, Gu X, Martin L, Park Y, Liu X,Kolevzon A, Soorya L, Grodberg D, Hollander E, Hof PR. Functional deficitsof the attentional networks in autism. Brain Behav. 2012;2(5):647–60.https://doi.org/10.1002/brb3.90.
34. Sassa Y, Taki Y, Takeuchi H, Hashizume H, Asano M, Asano K, Wakabayashi A,Kawashima R. The correlation between brain gray matter volume andempathizing and systemizing quotients in healthy children. NeuroImage.2012;60(4):2035–41. https://doi.org/10.1016/j.neuroimage.2012.02.021.
35. Baron-Cohen S, Wheelwright S, Skinner R, Martin J, Clubley E. The Autism-Spectrum Quotient (AQ): evidence from Asperger syndrome/high-functioning autism, males and females, scientists and mathematicians.J Autism Dev Disord. 2001;31(1):5–17. https://doi.org/10.1023/a:1005653411471.
36. Baron-Cohen S, Wheelwright S. The Empathy Quotient: an investigation ofadults with Asperger syndrome or high functioning autism, and normal sexdifferences. J Autism Dev Disord. 2004;34(2):163–75. https://doi.org/10.1023/b:jadd.0000022607.19833.00.
37. Baron-Cohen S, Richler J, Bisarya D, Gurunathan N, Wheelwright S. TheSystemizing Quotient: an investigation of adults with Asperger syndrome orhigh functioning autism, and normal sex differences. Philos Trans R Soc B.2003;358(1430):361–74. https://doi.org/10.1098/rstb.2002.1206.
Paul et al. Molecular Autism (2021) 12:3 Page 16 of 18
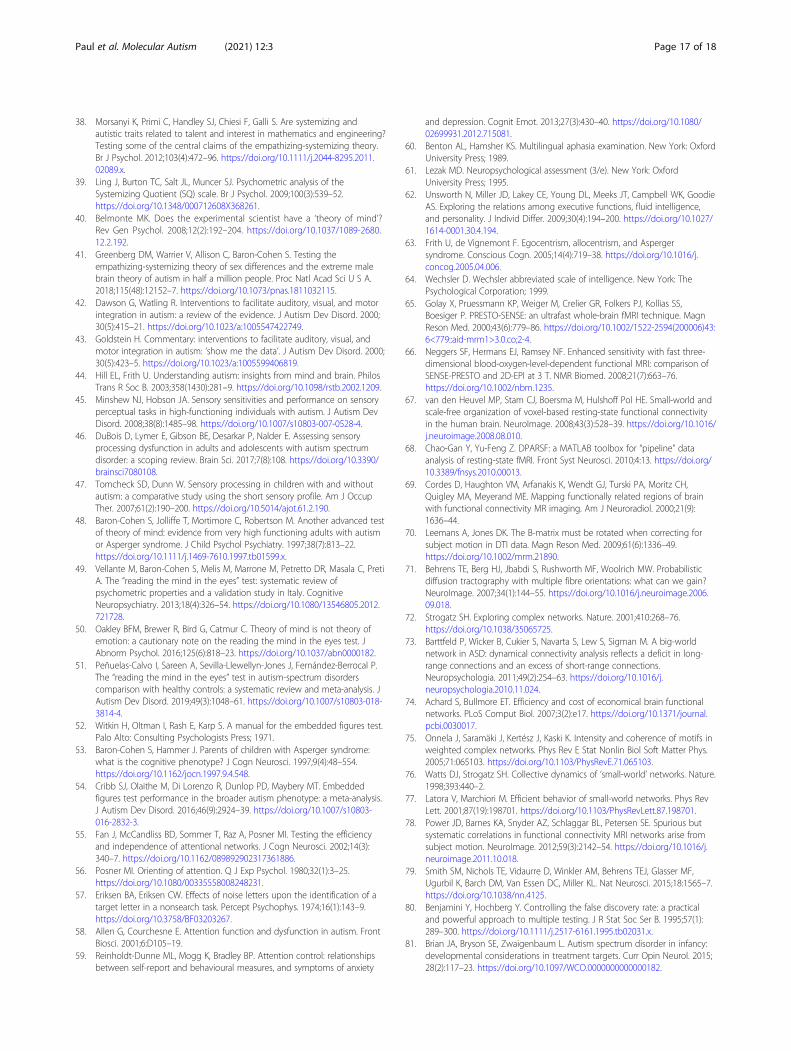
38. Morsanyi K, Primi C, Handley SJ, Chiesi F, Galli S. Are systemizing andautistic traits related to talent and interest in mathematics and engineering?Testing some of the central claims of the empathizing-systemizing theory.Br J Psychol. 2012;103(4):472–96. https://doi.org/10.1111/j.2044-8295.2011.02089.x.
39. Ling J, Burton TC, Salt JL, Muncer SJ. Psychometric analysis of theSystemizing Quotient (SQ) scale. Br J Psychol. 2009;100(3):539–52.https://doi.org/10.1348/000712608X368261.
40. Belmonte MK. Does the experimental scientist have a ‘theory of mind’?Rev Gen Psychol. 2008;12(2):192–204. https://doi.org/10.1037/1089-2680.12.2.192.
41. Greenberg DM, Warrier V, Allison C, Baron-Cohen S. Testing theempathizing-systemizing theory of sex differences and the extreme malebrain theory of autism in half a million people. Proc Natl Acad Sci U S A.2018;115(48):12152–7. https://doi.org/10.1073/pnas.1811032115.
42. Dawson G, Watling R. Interventions to facilitate auditory, visual, and motorintegration in autism: a review of the evidence. J Autism Dev Disord. 2000;30(5):415–21. https://doi.org/10.1023/a:1005547422749.
43. Goldstein H. Commentary: interventions to facilitate auditory, visual, andmotor integration in autism: ‘show me the data’. J Autism Dev Disord. 2000;30(5):423–5. https://doi.org/10.1023/a:1005599406819.
44. Hill EL, Frith U. Understanding autism: insights from mind and brain. PhilosTrans R Soc B. 2003;358(1430):281–9. https://doi.org/10.1098/rstb.2002.1209.
45. Minshew NJ, Hobson JA. Sensory sensitivities and performance on sensoryperceptual tasks in high-functioning individuals with autism. J Autism DevDisord. 2008;38(8):1485–98. https://doi.org/10.1007/s10803-007-0528-4.
46. DuBois D, Lymer E, Gibson BE, Desarkar P, Nalder E. Assessing sensoryprocessing dysfunction in adults and adolescents with autism spectrumdisorder: a scoping review. Brain Sci. 2017;7(8):108. https://doi.org/10.3390/brainsci7080108.
47. Tomcheck SD, Dunn W. Sensory processing in children with and withoutautism: a comparative study using the short sensory profile. Am J OccupTher. 2007;61(2):190–200. https://doi.org/10.5014/ajot.61.2.190.
48. Baron-Cohen S, Jolliffe T, Mortimore C, Robertson M. Another advanced testof theory of mind: evidence from very high functioning adults with autismor Asperger syndrome. J Child Psychol Psychiatry. 1997;38(7):813–22.https://doi.org/10.1111/j.1469-7610.1997.tb01599.x.
49. Vellante M, Baron-Cohen S, Melis M, Marrone M, Petretto DR, Masala C, PretiA. The “reading the mind in the eyes” test: systematic review ofpsychometric properties and a validation study in Italy. CognitiveNeuropsychiatry. 2013;18(4):326–54. https://doi.org/10.1080/13546805.2012.721728.
50. Oakley BFM, Brewer R, Bird G, Catmur C. Theory of mind is not theory ofemotion: a cautionary note on the reading the mind in the eyes test. JAbnorm Psychol. 2016;125(6):818–23. https://doi.org/10.1037/abn0000182.
51. Peñuelas-Calvo I, Sareen A, Sevilla-Llewellyn-Jones J, Fernández-Berrocal P.The “reading the mind in the eyes” test in autism-spectrum disorderscomparison with healthy controls: a systematic review and meta-analysis. JAutism Dev Disord. 2019;49(3):1048–61. https://doi.org/10.1007/s10803-018-3814-4.
52. Witkin H, Oltman I, Rash E, Karp S. A manual for the embedded figures test.Palo Alto: Consulting Psychologists Press; 1971.
53. Baron-Cohen S, Hammer J. Parents of children with Asperger syndrome:what is the cognitive phenotype? J Cogn Neurosci. 1997;9(4):48–554.https://doi.org/10.1162/jocn.1997.9.4.548.
54. Cribb SJ, Olaithe M, Di Lorenzo R, Dunlop PD, Maybery MT. Embeddedfigures test performance in the broader autism phenotype: a meta-analysis.J Autism Dev Disord. 2016;46(9):2924–39. https://doi.org/10.1007/s10803-016-2832-3.
55. Fan J, McCandliss BD, Sommer T, Raz A, Posner MI. Testing the efficiencyand independence of attentional networks. J Cogn Neurosci. 2002;14(3):340–7. https://doi.org/10.1162/089892902317361886.
56. Posner MI. Orienting of attention. Q J Exp Psychol. 1980;32(1):3–25.https://doi.org/10.1080/00335558008248231.
57. Eriksen BA, Eriksen CW. Effects of noise letters upon the identification of atarget letter in a nonsearch task. Percept Psychophys. 1974;16(1):143–9.https://doi.org/10.3758/BF03203267.
58. Allen G, Courchesne E. Attention function and dysfunction in autism. FrontBiosci. 2001;6:D105–19.
59. Reinholdt-Dunne ML, Mogg K, Bradley BP. Attention control: relationshipsbetween self-report and behavioural measures, and symptoms of anxiety
and depression. Cognit Emot. 2013;27(3):430–40. https://doi.org/10.1080/02699931.2012.715081.
60. Benton AL, Hamsher KS. Multilingual aphasia examination. New York: OxfordUniversity Press; 1989.
61. Lezak MD. Neuropsychological assessment (3/e). New York: OxfordUniversity Press; 1995.
62. Unsworth N, Miller JD, Lakey CE, Young DL, Meeks JT, Campbell WK, GoodieAS. Exploring the relations among executive functions, fluid intelligence,and personality. J Individ Differ. 2009;30(4):194–200. https://doi.org/10.1027/1614-0001.30.4.194.
63. Frith U, de Vignemont F. Egocentrism, allocentrism, and Aspergersyndrome. Conscious Cogn. 2005;14(4):719–38. https://doi.org/10.1016/j.concog.2005.04.006.
64. Wechsler D. Wechsler abbreviated scale of intelligence. New York: ThePsychological Corporation; 1999.
65. Golay X, Pruessmann KP, Weiger M, Crelier GR, Folkers PJ, Kollias SS,Boesiger P. PRESTO-SENSE: an ultrafast whole-brain fMRI technique. MagnReson Med. 2000;43(6):779–86. https://doi.org/10.1002/1522-2594(200006)43:6<779::aid-mrm1>3.0.co;2-4.
66. Neggers SF, Hermans EJ, Ramsey NF. Enhanced sensitivity with fast three-dimensional blood-oxygen-level-dependent functional MRI: comparison ofSENSE-PRESTO and 2D-EPI at 3 T. NMR Biomed. 2008;21(7):663–76.https://doi.org/10.1002/nbm.1235.
67. van den Heuvel MP, Stam CJ, Boersma M, Hulshoff Pol HE. Small-world andscale-free organization of voxel-based resting-state functional connectivityin the human brain. NeuroImage. 2008;43(3):528–39. https://doi.org/10.1016/j.neuroimage.2008.08.010.
68. Chao-Gan Y, Yu-Feng Z. DPARSF: a MATLAB toolbox for “pipeline” dataanalysis of resting-state fMRI. Front Syst Neurosci. 2010;4:13. https://doi.org/10.3389/fnsys.2010.00013.
69. Cordes D, Haughton VM, Arfanakis K, Wendt GJ, Turski PA, Moritz CH,Quigley MA, Meyerand ME. Mapping functionally related regions of brainwith functional connectivity MR imaging. Am J Neuroradiol. 2000;21(9):1636–44.
70. Leemans A, Jones DK. The B-matrix must be rotated when correcting forsubject motion in DTI data. Magn Reson Med. 2009;61(6):1336–49.https://doi.org/10.1002/mrm.21890.
71. Behrens TE, Berg HJ, Jbabdi S, Rushworth MF, Woolrich MW. Probabilisticdiffusion tractography with multiple fibre orientations: what can we gain?NeuroImage. 2007;34(1):144–55. https://doi.org/10.1016/j.neuroimage.2006.09.018.
72. Strogatz SH. Exploring complex networks. Nature. 2001;410:268–76.https://doi.org/10.1038/35065725.
73. Barttfeld P, Wicker B, Cukier S, Navarta S, Lew S, Sigman M. A big-worldnetwork in ASD: dynamical connectivity analysis reflects a deficit in long-range connections and an excess of short-range connections.Neuropsychologia. 2011;49(2):254–63. https://doi.org/10.1016/j.neuropsychologia.2010.11.024.
74. Achard S, Bullmore ET. Efficiency and cost of economical brain functionalnetworks. PLoS Comput Biol. 2007;3(2):e17. https://doi.org/10.1371/journal.pcbi.0030017.
75. Onnela J, Saramäki J, Kertész J, Kaski K. Intensity and coherence of motifs inweighted complex networks. Phys Rev E Stat Nonlin Biol Soft Matter Phys.2005;71:065103. https://doi.org/10.1103/PhysRevE.71.065103.
76. Watts DJ, Strogatz SH. Collective dynamics of ‘small-world’ networks. Nature.1998;393:440–2.
77. Latora V, Marchiori M. Efficient behavior of small-world networks. Phys RevLett. 2001;87(19):198701. https://doi.org/10.1103/PhysRevLett.87.198701.
78. Power JD, Barnes KA, Snyder AZ, Schlaggar BL, Petersen SE. Spurious butsystematic correlations in functional connectivity MRI networks arise fromsubject motion. NeuroImage. 2012;59(3):2142–54. https://doi.org/10.1016/j.neuroimage.2011.10.018.
79. Smith SM, Nichols TE, Vidaurre D, Winkler AM, Behrens TEJ, Glasser MF,Ugurbil K, Barch DM, Van Essen DC, Miller KL. Nat Neurosci. 2015;18:1565–7.https://doi.org/10.1038/nn.4125.
80. Benjamini Y, Hochberg Y. Controlling the false discovery rate: a practicaland powerful approach to multiple testing. J R Stat Soc Ser B. 1995;57(1):289–300. https://doi.org/10.1111/j.2517-6161.1995.tb02031.x.
81. Brian JA, Bryson SE, Zwaigenbaum L. Autism spectrum disorder in infancy:developmental considerations in treatment targets. Curr Opin Neurol. 2015;28(2):117–23. https://doi.org/10.1097/WCO.0000000000000182.
Paul et al. Molecular Autism (2021) 12:3 Page 17 of 18

82. Baranek GT, Woynaroski TG, Nowell S, Turner-Brown L, DuBay M, Crais ER,Watson LR. Cascading effects of attention disengagement and sensoryseeking on social symptoms in a community sample of infants at-risk for afuture diagnosis of autism spectrum disorder. Dev Cogn Neurosci. 2018;29:30–40. https://doi.org/10.1016/j.dcn.2017.08.006.
83. Braga RM, Buckner RL. Parallel interdigitated distributed networks within theindividual estimated by intrinsic functional connectivity. Neuron. 2017;95(2):457–71. https://doi.org/10.1016/j.neuron.2017.06.038.
84. Asperger H. Die ‘autistischen psychopathen’ im kindesalter. Arch PsychiatrNervenkr. 1944;117(1):76–136.
85. Cantor PA. Gilligan unbound: pop culture in the age of globalization.Lanham: Rowman & Littlefield; 2001.
86. Rubenstein JLR, Merzenich MM. Model of autism: increased ratio ofexcitation/inhibition in key neural systems. Genes Brain Behav. 2003;2(5):255–67. https://doi.org/10.1034/j.1601-183X.2003.00037.x.
87. Shew WL, Yang H, Yu S, Roy R, Plenz D. Information capacity andtransmission are maximized in balanced cortical networks with neuronalavalanches. J Neurosci. 2011;31(1):55–63. https://doi.org/10.1523/JNEUROSCI.4637-10.2011.
88. Belmonte MK, Allen G, Beckel-Mitchener A, Boulanger LM, Carper RA, WebbSJ. Autism and abnormal development of brain connectivity. J Neurosci.2004;24(42):9228–31. https://doi.org/10.1523/JNEUROSCI.3340-04.2004.
89. Deco G, Ponce-Alvarez A, Hagmann P, Romani GL, Mantini D, Corbetta M.How local excitation-inhibition ratio impacts the whole brain dynamics.J Neurosci. 2014;34(23):7886–98. https://doi.org/10.1523/JNEUROSCI.5068-13.2014.
90. Ray S, Miller M, Karalunas S, Robertson C, Grayson DS, Cary RP, Hawkey E,Painter JG, Kriz D, Fombonne E, Nigg JT, Fair DA. Structural and functionalconnectivity of the human brain in autism spectrum disorders andattention-deficit/hyperactivity disorder: a rich club-organization study. HumBrain Mapp. 2014;35(12):6032–48. https://doi.org/10.1002/hbm.22603.
91. Belmonte MK, Gomot M, Baron-Cohen S. Visual attention in autism families:‘unaffected’ sibs share atypical frontal activation. J Child Psychol Psychiatry.2010;51(3):259–76. https://doi.org/10.1111/j.1469-7610.2009.02153.x.
92. Belmonte MK. Obligatory processing of task-irrelevant stimuli: a hallmark ofautistic cognitive style within and beyond the diagnosis. Biolog PsychiatryCogn Neurosci Neuroimaging. 2017;2(6):461–3. https://doi.org/10.1016/j.bpsc.2017.07.002.
93. Belmonte MK, Yurgelun-Todd DA. Functional anatomy of impaired selectiveattention and compensatory processing in autism. Cogn Brain Res. 2003b;17(3):651–64. https://doi.org/10.1016/S0926-6410(03)00189-7.
94. Murias M, Webb SJ, Dawson G. Resting state cortical connectivity reflectedin EEG coherence in individuals with autism. Biol Psychiatry. 2007;62(3):270–3. https://doi.org/10.1016/j.biopsych.2006.11.012.
95. Coben R, Clarke AR, Hudspeth W, Barry RJ. EEG power and coherence inautistic spectrum disorder. Clin Neurophysiol. 2008;119(5):1002–9.https://doi.org/10.1016/j.clinph.2008.01.013.
96. Kitzbichler MG, Khan S, Ganesan S, Vangel MG, Herbert MR, Hämäläinen MS,Kenet T. Altered development and multifaceted band-specific abnormalitiesof resting state networks in autism. Biol Psychiatry. 2015;77(9):794–804.https://doi.org/10.1016/j.biopsych.2014.05.012.
97. Khan S, Michmizos K, Tommerdahl M, Ganesan S, Kitzbichler MG, Zetino M,Garel KA, Herbert MR, Hämäläinen MS, Kenet T. Somatosensory cortexfunctional connectivity abnormalities in autism show opposite trends,depending on direction and spatial scale. Brain. 2015;138(5):1394–409.https://doi.org/10.1093/brain/awv043.
98. Scheeringa R, Fries P, Petersson K, Oostenveld R, Grothe I, Norris DG, HagoortP, Bastiaansen MCM. Neuronal dynamics underlying high- and low-frequencyEEG oscillations contribute independently to the human BOLD signal. Neuron.2011;69(3):572–83. https://doi.org/10.1016/j.neuron.2010.11.044.
99. Lachaux J, Fonlupt P, Kahane P, Minotti L, Hoffmann D, Bertrand O, Baciu M.Relationship between task-related gamma oscillations and BOLD signal:New insights from combined fMRI and intracranial EEG. Hum Brain Mapp.2007;28(12):1368–75. https://doi.org/10.1002/hbm.20352.
100. Happé F, Ronald A. The ‘fractionable autism triad’: a review of evidencefrom behavioural, genetic, cognitive and neural research. Neuropsychol Rev.2008;18(4):287–304. https://doi.org/10.1007/s11065-008-9076-8.
101. Mandy WPL, Skuse DH. Research review: what is the association betweenthe social-communication element of autism and repetitive interests,behaviours and activities? J Child Psychol Psychiatry. 2008;49(8):795–808.https://doi.org/10.1111/j.1469-7610.2008.01911.x.
102. Palmer CJ, Paton B, Enticott PG, Hohwy J. ‘Subtypes’ in the presentation ofautistic traits in the general adult population. J Autism Dev Disord. 2015;45(5):1291–301. https://doi.org/10.1007/s10803-014-2289-1.
103. Lewis JD, Evans AC, Pruett JR Jr, Botteron KN, McKinstry RC, ZwaigenbaumL, Estes AM, Collins DL, Kostopoulos P, Gerig G, Dager SR, Paterson S,Schultz RT, Styner MA, Hazlett HC, Piven J. The emergence of networkinefficiencies in infants with autism spectrum disorder. Biol Psychiatry. 2017;82(3):152–4. https://doi.org/10.1016/j.biopsych.2017.03.006.
104. Neufeld J, Kuja-Halkola R, Mevel K, Cauvet É, Fransson P, Bölte S. Alterationsin resting state connectivity along the autism trait continuum: a twin study.Mol Autism. 2018;23(7):1659–65. https://doi.org/10.1038/mp.2017.160.
105. Keehn RJJ, Nair S, Pueschel EB, Linke AC, Fishman I, Müller R-A. Atypicallocal and distal patterns of occipito-frontal functional connectivity arerelated to symptom severity in autism. Cereb Cortex. 2019;29(8):3319–30.https://doi.org/10.1093/cercor/bhy201.
106. Murray RJ, Debbané M, Fox PT, Bzdok D, Eickhoff SB. Functional connectivitymapping of regions associated with self- and other-processing. Hum BrainMapp. 2015;36(4):1304–24. https://doi.org/10.1002/hbm.22703.
107. Scholz J, Triantafyllou C, Whitfield-Gabrieli S, Brown EN, Saxe R. Distinctregions of right temporo-parietal junction are selective for theory of mindand exogenous attention. PLoS One. 2009;4(3):e4869. https://doi.org/10.1371/journal.pone.0004869.
108. Uzefovsky F, Bethlehem RAI, Shamay-Tsoory S, Ruigrok A, Holt R, Spencer M,Chura L, Warrier V, Chakrabarti B, Bullmore E, Suckling J, Floris D, Baron-Cohen S. The oxytocin receptor gene predicts brain activity during anemotion recognition task in autism. Mol Autism. 2019;10:12. https://doi.org/10.1186/s13229-019-0258-4.
109. Bar M, Aminoff EM, Schacter DL. Scenes unseen: the parahippocampalcortex intrisically subserves contextual associations, not scenes or places perse. J Neurosci. 2008;28(34):8539–44. https://doi.org/10.1523/JNEUROSCI.0987-08.2008.
110. Aminoff EM, Kveraga K, Bar M. The role of the parahippocampal cortex incognition. Trends Cogn Sci. 2013;17(8):379–90. https://doi.org/10.1016/j.tics.2013.06.009.
111. Buzsáki G, Tingley D. Space and time: the hippocampus as a sequencegenerator. Trends Cogn Sci. 2018;22(10):853–69. https://doi.org/10.1016/j.tics.2018.07.006.
112. Horwitz B. The elusive concept of brain connectivity. NeuroImage. 2003;19(2):466–70. https://doi.org/10.1016/S1053-8119(03)00112-5.
113. Belmonte MK, Yurgelun-Todd DA. Anatomic dissociation of selective andsuppressive processes in visual attention. NeuroImage. 2003a;19(1):180–9.https://doi.org/10.1016/s1053-8119(03)00033-8.
114. Baek K, Morris LS, Kundu P, Voon V. Disrupted resting-state brain networkproperties in obesity: decreased global and putaminal cortico-striatalnetwork efficiency. Psychol Med. 2017;47(4):585–96. https://doi.org/10.1017/S0033291716002646.
115. Hu R, Qiu D, Guo Y, Zhao Y, Leatherday C, Wu J, Allen JW. Variability ofresting-state functional MRI graph theory metrics across 3T platforms.J Neuroimaging. 2019;29(3):344–7. https://doi.org/10.1111/jon.12603.
116. Beim Graben P, Jimenez-Marin A, Diez I, Cortes JM, Desroches M, RodriguesS. Metastable resting state brain dynamics. Front Comput Neurosci. 2019;13:62. https://doi.org/10.3389/fncom.2019.00062.
117. Tavassoli T, Brandes-Aitken A, Chu R, Porter L, Schoen S, Miller LJ, GerdesMR, Owen J, Mukherjee P, Marco EJ. Sensory over-responsivity: parentreport, direct assessment measures, and neural architecture. Mol Autism.2019;10:4. https://doi.org/10.1186/s13229-019-0255-7.
118. Hasson U, Avidan G, Gelbard H, Vallines I, Harel M, Minshew N, BehrmannM. Shared and idiosyncratic cortical activation patterns in autism revealedunder continuous real-life viewing conditions. Autism Res. 2009;2(4):220–31.https://doi.org/10.1002/aur.89.
119. Falahpour M, Thompson WK, Abbott AE, Jahedi A, Mulvey ME, Datko M, LiuTT, Müller RA. Underconnected, but not broken? Dynamic functionalconnectivity MRI shows underconnectivity in autism is linked to increasedintra-individual variability across time. Brain Connect. 2016;6(5):403–14.https://doi.org/10.1089/brain.2015.0389.
Publisher’s NoteSpringer Nature remains neutral with regard to jurisdictional claims inpublished maps and institutional affiliations.
Paul et al. Molecular Autism (2021) 12:3 Page 18 of 18