Embed Size (px)
Citation preview

T PES
ED 128 207
AUTI1OF 0c111-2nker, RicharcTITL stiqa-tioii in 1-rine nemistrl- Salinity IT.PUB DATE p61NCTE 17p.; For rc1at ed docuuient see 5E021289
EDBS PRICEDESCTFTOF5
IDENTIFIERS
ABSTRACT
mr-$0 83 fic-V.67 Plus Postag_Cbemistry; *Instn2ctiona1 Materials; a ology;*Physical Scier. Science Education; *Secondaryrducation; *Secondary Scliool Science; *Units of Study(Subject Tields)Salinity
Presented is a science activity in which the studentinvestigates methods of calibration of a simple conductivity metervia a hands-on inquiry '.echnique. conductivity is mathematicallycompared to salinity using a point slope fomula and graphicaltechniques. Sample soiutions of unknovn salinity are provided so that
the students can sharpen theiz salinity aleasuxing abilities.Evaluation exercises as ueJ.l as suggestions for further study are
included. (Authoria)
* **************t**** ******* *** *********** *******
Documents acquired by Enc include many informal unpublished* materials not available from other so:art:es. 'ERIC makes every effort *
* to obtain the best copy available. Nevertheless, items of marginal ** reproducibility are often encountered and this affects the quality ** of the microfiche and hardcopy reproductions ERIC makes available ** via the ERIC Document Reproduction Service (EDRS). EBBS is not
responsible for the quality of the original document. Reprodmctions *
* supplied by DES are the best tbat can be made from the original. *lok*********** **** ************************************************ *

U )EPAFFTM.,-,F410..4.4 rF-1,
& NE t_r -,AFF
FFA notlisj_ N5IfT01-,f.arI,FAUE
t-' ''A"' III k t"PPO,y f,,Ec iv D POM
r rA:. ,Ar t).1Y.
r ", .4f, PUF.4A If NA F
1 ' .1 r,01
Invest13atica8 in MArtne Uhemistlyi
Saatnitg If
by
Richard M, 3CoIcnier

Abstract
The student investigates methos
:)-1" ellibration of a silple CondllotIvitly
c:-- via r, hands-on incOiry teehniqua.
Condurvity :pi mathematially ec-mpared
tio salnity using a point Liope
formul. qn(1 i_vt.phs, Sample 3cIttiori
of unknewn salinity are provided so
t-nat the s-7,udent can sharpen his
s:alinity 1Isur1ng -billties.
Evaluation exercises, as well as
s*JgE7estions for further studz, are
included.

ire many aspects of chemistry and elec icty
9-5surfld to be in the instructors repertoire
Lind knowLede . However there are a Tew facts
and .cautions coceiing this unit whl h should be mentioned.
Pord v4teT will iot readily conduct an electric
;nowerr extremely sensittve mete rs: will detect
curre-A:t rlow even in ,;he pul'est water'. To mlnimize
In order t}at In vestlat1 or achiere the gre
de_
honogeneous mixt
the studts should
ed water should be u3ed,
t water solut1ori hould be a
mo ncuri that this condtto n exists,
ixucted to thix the s lt and
the water as throUhly as possible .
When the pr be i
switch closed, a curren
erted in the salt water and the
Wh_n this condition
e1ss, the copper !olat react with the solution. While
these react ons are beyond the scope of this unit, the
reactions do cause buildups on' the plates. These build
eff ctirely increase the resista_ce between the plates
and thus decrease the am unt of current flow which san
occur be
lenth
the p:t:tes. These buildups Increase as the
the probe is Immersed increases, they are=
not ins -ntaneous. or this reason the probe should be
inserted. briefly and the current readirg taker as soon

11
e after iminers iori Arter a reading has been
taken is a ood idea to rinse, the probe in fresh or
distilled water-. It is also u good idea to perlodlcally
Glean the probes with steel wool.
As the depth of Drobe immersion increases the
mount of surface area presented to the water increascs.
As the area Increases the area avaliable for electron
release to ard retriev 1 from the solution Increases.
It follows that as the depth of penetration Increases,
the current reading for a given salinity, will incre
In order to obtain uniform and meaningful results the
d pth of penetration should be held constant as one makes
a series of measurements, It should also be remembered-
that the the depth which is used when the salinity charts
are made, is the depth at which measurements will have- to
be made in real life situations If this scheme is not
followed, the calibration chart will be useless-.
It Is hoped that this list of cautions, while not
intendec exhaustive, will produce a more meaning-
ful unit for the student.

Introductior
Measur!Lrg the salinity of a body of wate .oan be an
interesting, enjoyable and fairly lnexpenslrive task. One
problem must be mrercome. If you were to build your own
salinity or conductivity meter, it would probably need to
be calibrated. How might this be ac -plished?
In this wilt the student i_ presented with a simio
conductivity mlter. The meter is constructed, using a few
pieces of wire a battery, a milliammeter, a swItch,two
pieces of string, a pi ce of wood and two copper electrode.
His task Is to calibrate the meter so hat it can be used
for measuring the s linities of the worlds oceans, as well
as the wide range of salinit _s four' in tide pools
The constru7A1
follows;
of the meter is pictured graphically
e y
Copper ElectrodesWooden Block

capjfetIves
Goals
10 To introduce the student to a functioning co
4
du tivity meter0
To introduce the student to methods of calibrating
a salinity or conductivity meter.
To introduce the student to methods of comparing
salinity and conductivity.
.To provide the student with sample situations by
which he can gain experience measuring salinity.
Upon cornpletIon of this unit, the student will be able
1. Calibrate a simple conductivlty meter.
20 Make charts which will allow rapid conversioA of
current flow to s linity in parts per thousand (o/o
Use a sImple, inexpensive conductivity meter in
real situations.
One 6V battery.
One DC milliammeter 0-1 amp range.
30 One 1,5V battery.
4. One on/off toggle switch.
7

5. Two pieces of string.
6. One plece=of wood, 1cm x lam x 10cm0
7. Two copper electrodes, icm x 10cm (other materIals-
may be- used, e.g. stainless steel
Several lengths of number 12, 14, of 16 wire with
alligator clips on each end.
10. A straight edge., prefer bly calibrated in cm.
11. A quantity of table salt or a quantity of sea water.
Sea water may be prepared with salt compounds
obtained Irom a biological supply house. The
rEixture one obtains will be identical to that of
regular sea water and will support marine life.
12. Several 500m1 beakers; other containers may be used.
13. Several 250m1 beakers; other containers may be used.
Procedure-
In this unit we are concerned with calibrating our
instrument. This task shall be accomplished by relating salt
water ooriductIvity to salinity in parts per thousand (o/oo).
Current flow is-related to resistance in the following
formula, E = IR where E = voltage, I = current flow and R =
resistance, Tt follows that I = E/R, thus current flow is
directlr proportional to voltageand inversely proportional
to resistance. If voltage is held constant, as it is with
the conductivity meter (6V ), ourrent flow becomes a function
8

f res stance. LookIng at this co- ept from another p
specta, the conductivity of a material is a function of
its' resistance.
Saline water has the ability to conduct current flow.
Thts will beco-e rapidly evident if you momentarily dip
the probe into a beaker of salt water. Since the veltage is
held constant, the milliammeter readini is dependent upon
the salinity of the water,
The salinity of the worlds oceans ranges from about
17 0/00 in the dilute northern areas to as much as 300 oo
in areas such as the Red Sea. There are, of course, a
multitude of variations depending upon the area one finds
himself measuring. Much of the local variation is determined
by rainfall, river runoff and evaporation. However, the
salinity of the standard ocean, by convention, is accepted
t_ be 35 100.
When the conductivIty meter is finally calibrated,
it must be useful in local areas. This may be accompli hed
by using a method of calibration which will provide useful
readings over a wide range of salinities.
1. Have the student mix two salt solutions. Each
solution should be made using 400m1 of fresh
or distilled water. In 400ml volume dissolve
5g NaCl and in the other, dissolve 2.5g,
2. The student should now build the meter as shown
1- the previous diagram.
9

3. Immerse the probe (reriew the precaution:: In the
preface) in each beaker momentarily, close the
switch and record the readings.
4. Comp te the resistance of the water for the different
salt c-ntents, using the f rm -la E = IR.
At this point the student has investigated and is aware of
the conductivIty-salt rel tionship. If a sample of sea
ter of known salini y is available, It may be used. If
not, it is necessary to mix a solution which can be used as
a standard. .51.nce llnIty is measured in parts per thousand,
we realize that for e-iery so many parts of sea water there
Is a part of salt. The standard ocean is 35 /oo. It
follows that if we desire to mix a solution of 35 o/oo,
35g NaC1 must be added to every 1000g of distilled water.
Should a 300 o/oo solution be desired, 300g NaC1 must be
dissolved in 1000g of water.
5. The class should mi- several different solu onsf
for example, 42 o/oo, 40 o/oo, 35 0/00, 22 oo,
18 co/oo.
6. Using the salinIty meter, measure the condu tivlty
of each solution and record the data. The following
scheme works well.
10
-6-
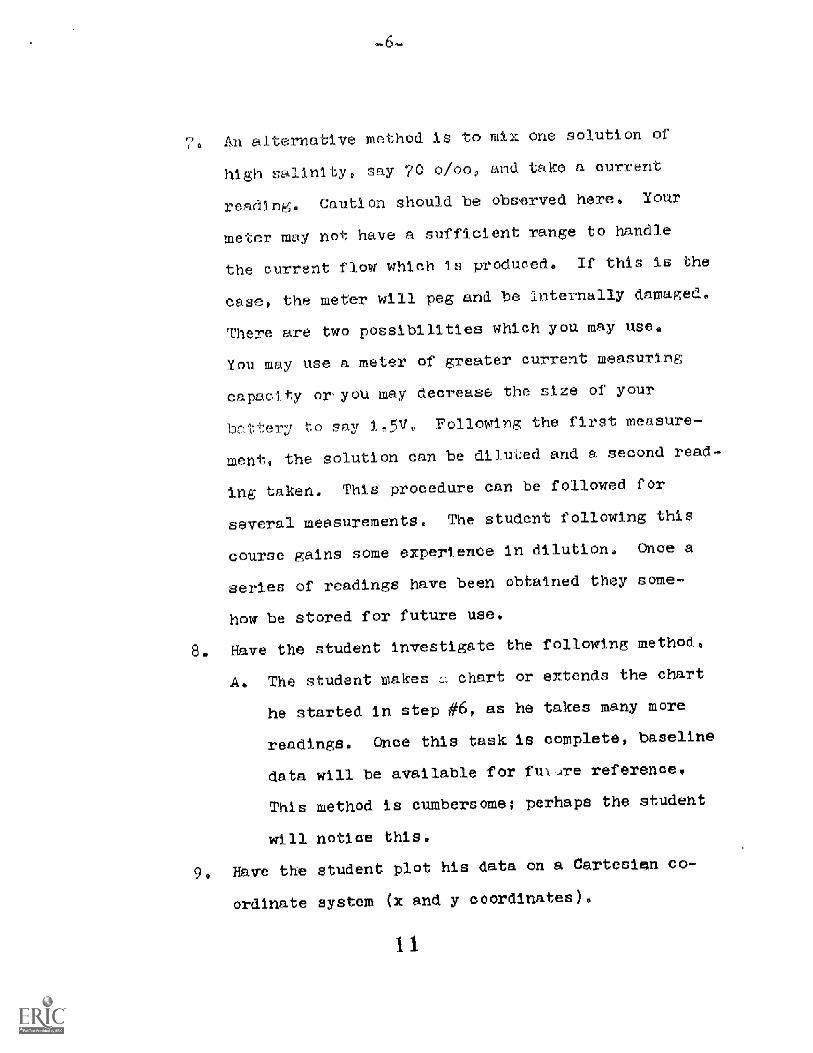
An alternative method is to mix one solution of
high sa1inity , say 70 o/oo, and. take a current
reading. Caution should be observed here. Your
meter may not have a suf icient range to handle
the e rre t flow which Is produced. If this is the
case, the meter will peg and be internally damaged.
-re are two possibilities which you may use.
You may use a meter of gre_ter current measuring
capacity or you may decrease the size of your
lottery to say 1,5V, Following the first measure-
ment, the solution can be diluted and a second read-
ing taken. This procedure can be followed for
several measurements. The student following this
course gains some experience in dilution. Once a
series of .-eadings have been obtained they some-
how be stored for future use.
8. Have the student investigate the following method.
A. The student makes s chart or extends the chart
he started in step #6, as he takes many more
readings. Once this task is complete, baseline
data will be available for fut-sre reference.
This method is cumbersome; perhaps the student
will notice this.
Have the student plot his data on a Cartesian co-
ordinate system (x and y coordinates).

ci
salinity in o/oo
Re ember that since conductivity is dependent upon salini yo
it values a e plotted along the "y" axis. The student
should use the values obtained in step d6 to com,lte this
step, The question now is how can plotting data in this
manner be useful at a later date?
A plot of many readings lill probably look s0meth1ri g
like this.
salinity
There is a defInIte relationship here which can be better
identified by drawl g a best fit line through the center of
the data plot.
1 2

This line has the f ()mule, y mx b, where- b = the
intercept or that peint on the "y" axis where the best
ltne crosses it. Tte slope = m = rise/run, x = a value
along the "x and y = a value along the "y" axis.
The slope or value .of the amount of rise there is
for e- h anit of rum.10. Fave te tt2den examine his best fit line. Does
it pass tIrough non than one data point? The
answer is probably yes.The atudemt should_ label the point which it goes
thxought e losest to the "y axis, xi and the second
Point Ir2. These points can also be labeled srt and
3r2 r speotively.
(x2
f lloWs tht ;

-9-
12. Rare the student extend the best fit line sO that
it intercepts the "y" axis. This point Is labeled
"b" in the formula. The student now has sufficient
information to substitute , in the equation,
y = mx b and arrive at a formula which Identifies
the true relationship between salinity and con-
ductivity.
13. The student should make the necessary substitutions.
At this point an enterprising student might conclude that in
order to obtain the slope, only two points are needed. H
might also mention that once a point is ploted (an ord-red
pair known) and the slope lanown, the "y intercept may be
arrived at mathematically; the best fit line need rat be
LIxtended through the "y" axis. If not mentioned, these f
should -he pointed out,
14. illave the student make a graph w:lose x" a- s
divided in a linear- annex-from 0 to 300 0/00.
This should be accomplished using graph paperv.
15. Usini, the information, which he has previously
obtained, each student should plot and should
draw a best fit line. The line should begin at
the "y" axis and extend to at least 300 oioc on
the "x- axis.
16. The student graduatesthe "y a- ss in a manner
consistent with his data. This wilI be:a linear
graduation. The produat should be Similar to the
one shown below.
14

0
ID
U 1.2A
VlA
800
600
400
200
Salinity vs ucti ty
75 150 2 5 300
SALINITY 0/00
15

17. The instructor should make up 10 or more solutions
for which only he Wows the sali-ity.
18. The students are now asked to determine the sali 1:y
of the unowns, usIng only the meter which t _y
have built and thetr graph.
19. The instructor conducts a group dis ussion. Du. i g
the discussion, the group should be led toward
the areas which have beer investigated in the unit.
tion
1. Using a simple conductivity me,ter, which incorporates
a 1.5V battery as a voltage source, make the
following graphs;
A plot of the resistance between the plates vS.
salinity.
B. A plot of current flow vs. salinity.
Write a mathematical equation for each relation-
ship listed in question #1.
Determine the sallnities'of several mystery solu ons
(provided by the instructor
a§agjLeAtZ'.Furtherftud_
1. Investigate how your meter functions In a real
situation.
2. Study the available chemistry bo Rs and ascertain
what takes place when the probe is inse:ted ir the
saline solutton and the switch closed.
16

hat other materials might be used in place 01 the
copper electrodes? Investigate several m te
A. Wh ch materials are better?
B. Vhy are,some materials better than others?
What is the buildup thioh occurs on the copper-
plates after the,system is energized?
Vocabulary
-p--A unIt measure of eurrent flow.
Calibr_te--To adjust according to some predetermined
scheme.
3. Cartesian coordiratesAn xo y coordinate system
which is named after the mathematician, Decartes.
Resistance.-The quality of a material which determines
the amount of current which can passthrough thatmaterial.
River runcf Docean.
rIver water Into the
SalinityThe amount of sa _u contained per unitvolume of water.
Slope--Rise/run.
VoltageThe- force es current to flow.