Embed Size (px)
Citation preview

www.elsevier.com/locate/atmosenv
Author’s Accepted Manuscript
The impact of fireworks on airborne particles
Roberta Vecchi, Vera Bernardoni, Diana Cricchio,Alessandra D’Alessandro, Paola Fermo, Franco Lucarelli,Silvia Nava, Andrea Piazzalunga, Gianluigi Valli
PII: S1352-2310(07)00968-5DOI: doi:10.1016/j.atmosenv.2007.10.047Reference: AEA 7897
To appear in: Atmospheric Environment
Received date: 7 June 2007Revised date: 22 October 2007Accepted date: 26 October 2007
Cite this article as: Roberta Vecchi, Vera Bernardoni, Diana Cricchio, AlessandraD’Alessandro, Paola Fermo, Franco Lucarelli, Silvia Nava, Andrea Piazzalunga and Gian-luigiValli, The impact of fireworks on airborne particles, Atmospheric Environment (2007),doi:10.1016/j.atmosenv.2007.10.047
This is a PDF file of an unedited manuscript that has been accepted for publication. Asa service to our customers we are providing this early version of the manuscript. Themanuscript will undergo copyediting, typesetting, and review of the resulting galley proofbefore it is published in its final citable form. Please note that during the production processerrors may be discovered which could affect the content, and all legal disclaimers that applyto the journal pertain.

Accep
ted m
anusc
ript
1
The impact of fireworks on airborne particles
Roberta Vecchi*,1, Vera Bernardoni1, Diana Cricchio1, Alessandra D’Alessandro1, Paola Fermo2, Franco Lucarelli3, Silvia
Nava4, Andrea Piazzalunga2, Gianluigi Valli1
1Inst. of Applied General Physics, University of Milan, and INFN-Milan, 20133, Milan, Italy
2Dep. of Inorganic, Metallorganic and Analytical Chemistry, University of Milan, 20133, Milan, Italy
3Dep. of Physics, University of Florence, and INFN-Florence, 50019, Florence, Italy
4National Inst. of Nuclear Physics, Sesto Fiorentino, 50019, Florence, Italy
Abstract
Fireworks are one of the most unusual sources of pollution in atmosphere; although transient, these pollution episodes are
responsible for high concentrations of particles (especially metals and organic compounds) and gases. In this paper, results
of a study on chemical-physical properties of airborne particles (elements, ions, organic and elemental carbon and particles
size distributions) collected during a fireworks episode in Milan (Italy) are reported. Elements typically emitted during
pyrotechnic displays increased in one hour as follows: Sr (120 times), Mg (22), Ba (12), K (11), and Cu (6). In our case
study, Sr was recognised as the best fireworks tracer because its concentration was very high during the event and lower
than, or comparable with, minimum detection limits during other time intervals, suggesting that it was mainly due to
pyrotechnic displays. In addition, particles number concentrations increased significantly during the episode (up to 6.7
times in one hour for the 0.5<d<1 µm size bin). Contributions (e.g. Cu, elemental carbon and nitrogen oxides) to air
pollution due to the large traffic volume registered during the same night were also singled out.
The original application of Positive Matrix Factorization and Multiple Linear Regression allowed, as far as we know, here
for the first time, the quantification of the fireworks contribution to atmospheric particulate matter and the resolution of
their chemical profile. The contribution of fireworks to the local environment in terms of PM10 mass, elements and
chemical components was assessed with 4-hour time resolution. PM10 mass apportioned by fireworks was up to 33.6 µg
m-3 (about 50% of the total PM10 mass). Major contributors were elemental and organic carbon (2.8 and 8.1 µg m-3,
respectively) as well as metals like Mg, K, Sr, Ba, and Cu (0.4, 0.7, 0.07, 0.1, and 0.1 µg m-3, respectively).
Keywords: fireworks, chemical composition, number size distribution, PMF
___________________
*Corresponding author: e-mail: [email protected] (R. Vecchi)
Tel +39 02 50317498 Fax +39 02 50317496

Accep
ted m
anusc
ript
2
1. Introduction
In recent years concern for air pollution effects both on short-term and on long term has increased (Pope and Dockery,
2006; and therein literature). Therefore, many studies are currently carried out to characterise anthropogenic emissions
especially in urban areas where large populations live.
One of the most unusual sources of pollution in atmosphere is the displacement of fireworks to celebrate festivities
worldwide as well as specific events. The burning of fireworks is a huge source of gaseous pollutants such as ozone,
sulphur dioxide, and nitrogen oxides (Attri et al., 2001; Ravindra et al., 2003) as well as of suspended particles. The aerosol
particles emitted by fireworks are generally composed of metals (e.g. potassium, magnesium, strontium, barium, and
copper), elemental carbon and secondary compounds like nitrate and organic substances (Kulshrestha et al., 2004;
Drewnick et al., 2006; Moreno et al., 2007; Wang et al., 2007). The issue of exposure to elevated particle concentrations
during celebrations with fireworks has implications in many countries of the world where pyrotechnic exhibitions often last
for several hours/days (e.g. during Diwali Festival in India, Las Fallas in Spain, Lantern Festival in Beijing and New Year’s
celebration world-wide). The complex nature of particles emitted during fireworks may cause adverse health effects as
reported in Ravindra et al. (2001). Nevertheless, some authors (Perry, 1999; Dutcher et al., 1999) concluded that fireworks
unlikely pose a significant public health hazard, as they are relatively rare, detonate at altitudes well above the ground and
generally burn outdoors, where the emitted pollutants can be dispersed in a large volume of air.
An additional effect of fireworks is the visibility reduction due to the generation of a dense cloud of smoke that drifts
downwind and slowly disperses. The impact of fireworks on visibility and human health is particularly evident when the
pyrotechnic exhibition is performed during stable meteorological conditions (Clark, 1997).
In this paper, we report on the chemical-physical characteristics of ambient aerosol measured during fireworks burnt in
Milan (Italy) to celebrate the win of the football World Cup; due to the short duration of the fireworks exhibition, we
considered it as a case study. The main goal of this paper is the assessment of the fireworks emissions environmental
impact through the aerosol characterisation in terms of number (10 min resolution), mass and chemical composition (4-
hour time resolution) as well as 1-hour resolution elemental data. In addition to particulate matter, trace gases
concentrations, meteorological parameters, and atmospheric stability conditions were taken into account. Owing to the
occurrence of this episode during a longer monitoring campaign, the apportionment of the fireworks source was possible
applying Positive Matrix Factorization (PMF) and Multiple Linear Regression (MLR) to the whole dataset; as far as we
know, this is the first attempt to identify and quantify the fireworks source contribution using a receptor model.
2. Experimental
The effect of pyrotechnic displays on air quality was studied in Milan (Italy) in July 2006, during the night between 9th and
10th, when the Italian team was celebrated for the win of the 2006 FIFA World Cup.

Accep
ted m
anusc
ript
3
2.1 Site and sampling
Major pyrotechnic displays were located in the Cathedral’s square downtown Milan; additional celebrations with many
minor fireworks displays and a huge amount of crackers and sparkles were burnt everywhere in the town, starting soon
after the end of the football match (at about 10:45 p.m.). Due to the peculiarity of the episode, the duration of the
celebrations is not easy to assess (a reasonable estimate might be approximately 1 - 2 hours). The samplings were carried
out at the University campus on the roof of the Institute of Physics, at about 10 m a.g.l.. The monitoring station was about 3
km far from the city centre so that the measurement related to the advected and diffused smoke cloud (as generally done in
literature studies on this topic).
PM10 was sampled starting at 12 a.m., local time, from July 9th to 11th, every 4 hours. Samplings were carried out in
parallel on PTFE filters (diameter: 47 mm, pore size: 2 µm) and quartz fibre filters (diameter: 47 mm, pre-fired at 700°C
for 1 hour) using CEN-equivalent samplers operating at a flow rate of 2.3 m3 h-1.
Fine (dae<2.5 µm) and coarse (2.5<dae<10 µm) PM fractions were also collected with hourly resolution, using a streaker
sampler. The streaker sampler separates particles in two different stages using a pre-impactor (which removes particles
with dae>10µm) and an impactor. The latter is made of a Kapton foil on which coarse particles are collected. The fine
fraction is then sampled on a Nuclepore filter (0.4 µm pore diameter). The Kapton foil and Nuclepore filter are paired in a
cartridge rotating at constant angular speed (1.8° h-1); this produces a circular continuous deposition on both stages. It
should be noted that mass concentration in streaker samples is not available. Further details on the sampler, its cut-off
diameters, and its control unit can be found elsewhere (Prati et al. 1998); it should be noticed that mass concentration in
streaker samples is not available.
2.2 Laboratory analyses
Before and after the samplings the filters were exposed for 48 hours on open but dust-protected sieve-trays in an air-
conditioned weighing room (T = 20 ° 1 °C and R.H. = 50 ° 5 %). The gravimetric determination of the mass was carried
out using an analytical microbalance (precision 1 mg), which was installed and operated in the weighing room. Calibration
procedures checked the microbalance performance.
PTFE filters were analysed for elemental composition by Energy Dispersive X-Ray Fluorescence technique (details can be
found in Marcazzan et al., 2004), obtaining concentration values for Mg, Al, Si, S, Cl, K, Ca, Ti, Cr, Mn, Fe, Ni, Cu, Zn,
Br, Sr, Ba, Pb. Other elements (i.e. V, As, Se, Zr, and Mo) were in principle detectable, but they often resulted below the
minimum detection limit (MDL), which was in the range 2 – 20 ng m-3 for most elements. Experimental overall
uncertainties were in the range 10-15 %.
One half of the quartz fibre filters was analysed for water-soluble major components (SO42-, NO3
-, and NH4+) by ion
chromatography (IC). A special care was used in IC analyses of particulate matter collected on quartz fibre filters due to

Accep
ted m
anusc
ript
4
high blank levels (minimum detection limits: 167, 359 e 46 ng m-3 for SO42-, NO3
-, and NH4+, respectively); information
about extraction procedures and blanks correction can be found in Fermo et al. (2006). The overall uncertainty for ionic
concentrations was estimated in 10 %.
One punch (area: 1.5 cm2) cut from the quartz fibre filter was analysed by TOT (Thermal-Optical Transmittance) method
(Birch and Cary, 1996) to quantify elemental and organic carbon. The technique detection limit was 0.2 mgC m-3 and the
precision was 5%.
Nuclepore and Kapton substrates from the streaker sampler were analysed by Particle Induced X-ray Emission analysis
(PIXE) at the LABEC-INFN accelerator facility in Florence, Italy, whose set up is described in Calzolai et al. (2006). The
concentration of 19 elements (Na, Mg, Al, Si, S, Cl, K, Ca, Ti, Cr, Mn, Fe, Ni, Cu, Zn, Br, Sr, Ba, Pb) was obtained. As for
ED-XRF analysis, other elements were in principle detectable, but they often were below the minimum detection limit
(lower than 10 ng m-3 for V, As, Se, Zr, Rb, Mo). The accuracy of hourly elemental concentrations was in the range 2% -
20%.
2.3 Additional measurements
An Optical Particle Counter (Grimm, mod.1.107) measured number size distributions in the 0.25-32 mm range (31 size
bins).
To evaluate atmospheric dispersion conditions, 222Rn short-lived decay products measurements were performed using the
experimental methodology reported in Marcazzan et al. (2003). Mixing layer heights (MLH) with hourly resolution were
obtained by means of a box model suitably set up by the group of the Institute of Physics using 222Rn concentration
measurements as input data (Pacifico, 2005). MLH evaluations by our box-model were in good agreement with thermal
inversions heights from radio-soundings data by the nearby Milan-Linate airport as well as with other modelling studies
based on thermodynamic variables (Casadei et al., 2006).
Meteorological parameters (wind speed and direction, relative humidity, pressure, temperature, solar radiation and
precipitation) were also measured at the Institute of Physics monitoring station.
Trace gases data recorded at monitoring stations of the Regional Environmental Protection Agency were also available
(Figure 1): NO2 and NO at the 1-J station (near the University campus and the motor-way) and NO2, NO and CO at the 2-V
station (city centre) and 3-L (on the ring-round). Moreover, hourly traffic volumes in the city centre were recorded at the
station 4-S (city centre).
2.4 Receptor model
The fireworks episode occurred during a longer field campaign, which was performed during two weeks in summer and
two weeks in winter 2006, with the same characteristics as those described in paragraphs 2.1, 2.2, and 2.3. The complete

Accep
ted m
anusc
ript
5
PM10 data set (180 samples) was analysed by PMF to identify and apportion (by MLR) major aerosol sources. PMF
resolved seven sources (re-suspended soil, construction works, industry, traffic, secondary sulphates, secondary nitrates and
fireworks). In this paper, only results on the fireworks source will be described and discussed (another paper in preparation
deals with the other six sources).
PMF is an advanced factor analysis technique computing a weighted, non-negative constrained least squares fit. It imposes
non-negativity constraints to the factors and uses realistic error estimates from data standard deviations, as described in
Paatero (1997). Data values and errors, missing values and below detection limit data were calculated according to Polissar
et al. (1998) and used in this work as inputs for the PMF.
In PMF studies, a weak variable (according to signal to noise ratio criterion, as in Paatero and Hopke, 2003) can sometimes
be inserted in the fit with the normal variables if it represents a tracer of a specific source (Qin et al., 2006). This approach
was here adopted for Sr, considered the best tracer of the fireworks source in our case study (see paragraph 3.3). It was not
really a weak variable but it had a much lower signal to noise ratio respect to other variables. In this work, instead of
reducing the weights of Sr, we doubled them to highlight the role of this fireworks tracer in the fit. At the same time, it was
necessary to down-weight some variables by increasing their uncertainties by a factor from 2 to 4 to obtain a better
distribution of their scaled residuals (Kim et al., 2003). The coefficients of adjustment for the weights were determined
with trial and error method until the model resolved the fireworks source, together with the same six sources found in a
previous analysis where Sr was not used as input for PMF.
Rotational ambiguity is always a problem in factor analysis (Paatero et al., 2002); in this work, after a systematic study of
the rotational range of the solution, FPEAK=0 was chosen. MLR was performed to regress the total mass against the factor
scores; the regression coefficients were then used to transform the factor profiles given in arbitrary units in parts per million
ones and to quantitatively apportion the mass contributions among the resolved sources.
3. Results and discussion
3.1 Mass concentration and meteorological conditions
During the case study period, meteorological conditions were quite stable. The wind speed was about 1 m s-1 as average
value between 10:30 p.m. and 12 a.m. on the fireworks night and the prevalent wind direction was changing from south-
westerly to westerly direction.
During the fireworks night a 222Rn strong accumulation was registered (Figure 2); the variation of Radon concentration
between the minimum (8.6 Bq m-3) on July 9th afternoon and the maximum (26.4 Bq m-3) in the following day was a good
indicator of the nocturnal mixing layer depth, which was lower than 100 m.
In Figure 2, PM10 mass and 222Rn concentration on 9th-10th July 2006 are shown. On 10th July, PM10 concentration
increased up to 63.9 µg m-3 in the time interval between 12 a.m. and 4 a.m., when the pyrotechnical displays contribution

Accep
ted m
anusc
ript
6
was maximum at our monitoring station, as singled out by the chemical markers analysis (see paragraph 3.3). However,
fireworks were not likely the only cause of PM10 growth during that night; indeed, the concomitant strong accumulation of
222Rn concentration suggests that this increase was likely due both to sources emissions and to the strong atmospheric
stability.
As far as we know, currently in the literature there is no quantification of the fireworks contribution to the PM mass, as this
estimation is difficult and not straightforward. With the aim of apportioning the fireworks source, in this paper the receptor
model approach has been possible owing to the availability of a large number of chemically characterised PM samples with
4-hours temporal resolution. According to the PMF source apportionment the fireworks contribution began to be
remarkable in the 8 p.m. – 12 a.m. time interval, accounting for 13.1 µg m-3of the PM10 mass (27 %), reached its
maximum at 33.6 µg m-3 (53 %) in the 4 hours after midnight and decreased to 4.2 µg m-3 (8 %) from 4 a.m. to 8 a.m.
3.2 Gaseous pollutants
CO concentration and traffic volumes increased soon after the end of the match (10:45 p.m.) at the monitoring stations 2-V
and 4-S near the Cathedral’s Square, as shown in Figure 3a. A similar pattern in CO concentration, i.e. maximum value
between 11 p.m. and 12 a.m. with a 3-fold increase in one hour, was also recorded at the station 3-L, located next to the
city ring-road (see Figure 1) and about 1.5 km far from major pyrotechnic displays. In Figure 3b NO2 temporal patterns
recorded at the stations 2-V, 3-L and 1-J are reported. At the 2-V and 3-L stations the concentration increase was recorded
simultaneously with the CO increase while at the station 1-J (near University Campus) a delay in the maximum
concentration occurred.
Ravindra et al. (2003) observed NO2 increases during the pyrotechnic displays. On the contrary, in our case the
experimental results indicate that the increase in trace gases concentration was mainly due to the high number of vehicles
circulating soon after the end of the match to celebrate the national team more than to fireworks emissions. Indeed, it is
important to observe that the location of the 3-L monitoring station compared to the city centre and the prevalent wind
direction (see paragraph 3.1) suggest that fireworks unlikely affect air quality in that area. Moreover, the NO2 temporal
trend observed at the station near major pyrotechnic displays (2-V) and at the 3-L station are comparable, indicating that no
significant NO2 emissions can be ascribed to fireworks in our case study. The NO2 peak occurring at 2 a.m. in the 1-J
station was explained by traffic flows, likely due to people going back home, as also confirmed by Cu temporal pattern
(another traffic tracer) represented in Figure 4.
3.3 Chemical composition
On 9th July, starting from 11 p.m., the hourly concentrations of some elements in the fine fraction strongly increased.
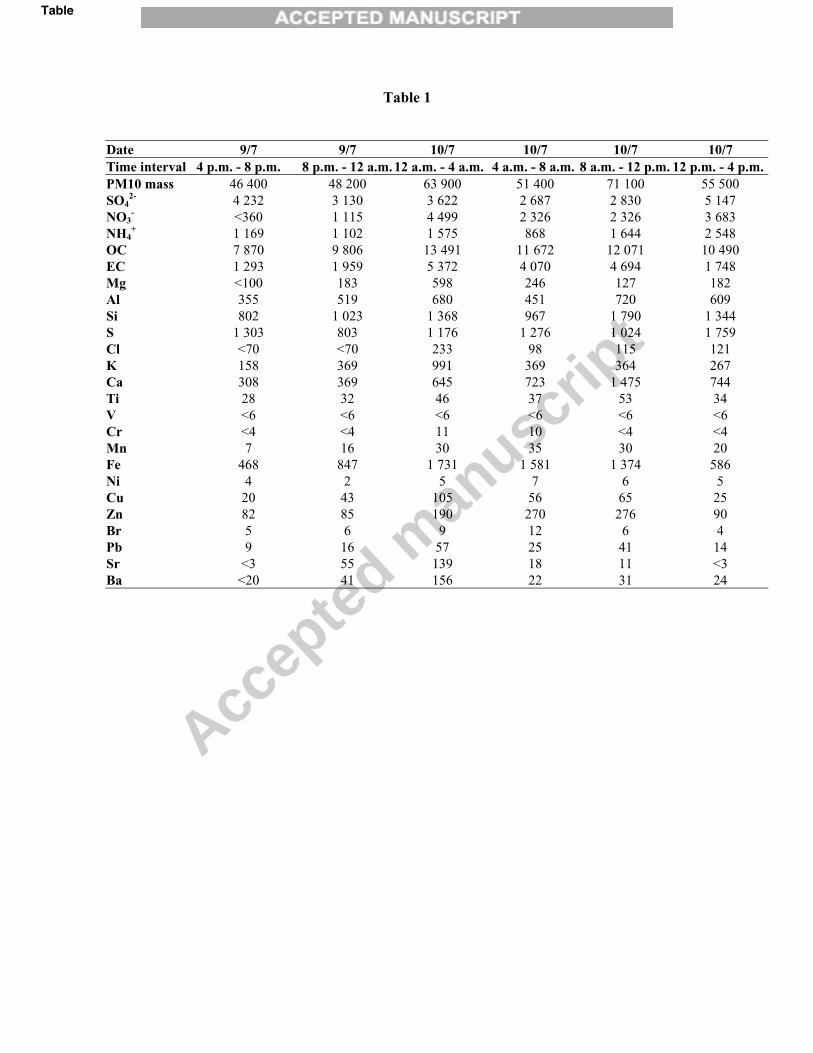
Similar results were also found PM10 elemental data with 4-hour resolution (in Table 1 mass and chemical components

Accep
ted m
anusc
ript
7
concentrations are given for the episode); nevertheless, for sake of brevity, the data with the highest time resolution are
represented in Figure 4. At our monitoring station, the highest values were registered on 10th July between 1 a.m. and 2
a.m.; this is consistent with the location of major fireworks considering wind speed and direction. To quantify the elements
concentration increase during the episode, the maximum concentration was compared to the value of the day before (9th
July, not affected by fireworks), averaged between 12 a.m. and 10 p.m. In case of below MDL hourly data, one-half of the
MDL value was used. Remarkable increases in Sr (120 times), Mg (22 times), K (12 times), Ba (11 times), and Cu (6
times) concentration were observed. No increases were detected in the coarse fraction elemental concentrations and Sr, Mg,
K, Ba, and Cu concentrations were below or comparable to MDL (not shown), indicating that ambient aerosol after the
fireworks event was preferably confined in the fine fraction.
Sr, Ba, and Cu compounds are used to give red, green, and blue fireworks, respectively (Kulshrestha et al., 2004; Wang et
al., 2007; Moreno et al., 2007). Different Ba compounds can give the green colour, but the increase in chlorine
concentration measured during the fireworks night and the nitrate concentration comparable or lower than other nights one,
suggested that Ba(ClO3)2 was more likely used (Perry, 1999). K is one of the major components of fireworks (Liu et al.,
1997; Dutcher et al., 1999; Perry, 1999; Kulshrestha et al., 2004; Drewnick et al., 2006): 74% of black powder consists of
KNO3, which provides the main oxidizer to the burning. Also potassium perchlorate or, less commonly, chlorate can be
used in the black powder. Mg gives origin to bright electric white fireworks and it is used as metallic fuel (Moreno et al.,
2007; Wang et al. 2007).
In this work, Sr was recognised as the best fireworks tracer because its concentration was very high during the event and
lower than, or comparable with, MDL during other time intervals, suggesting that it was mainly due to pyrotechnic displays
(see also PMF results in Table 2). On the contrary, Cu and Ba can also have a contribution coming from traffic (Vecchi et
al., 2007 and therein literature) and K and Mg are widespread elements emitted by many sources (e.g. biomass burning for
K and soil dust for Mg).
From 4-hours resolution PM10 data, the concentration ratios between levels registered in the 12 a.m. - 4 a.m. time interval
and the average values of the day before (during the period free from the event, i.e. between 12 a.m. and 8 p.m.) were
calculated; results for elements, organic and elemental carbon, and ions are reported in Figure 5. As expected, the most
significant increases were observed for Sr, Mg, Ba, K, and Cu (elements ratios were smaller than those reported for 1-hour
resolution elemental data because the longer sampling time included periods with lower concentrations). Indeed, these
elements can be all considered fireworks tracers.
The nitrate concentration ratio was comparable to the one measured during other summer nights at the same sampling site
(as an example, see the comparison with 6th July night, in Figure 5) because of the lower night-time temperature, which
limited losses due to volatilisation. In agreement with results by Drewnick et al. (2006), in our case study no nitrate
increase due to fireworks was observed.

Accep
ted m
anusc
ript
8
The EC ratios (3.1) found in this work are in good agreement with black carbon increases reported by Babu and Moorthy
(2001) and by Wang et al. (2007).
Opposite to what found by Wang et al (2007), no anomalous growth in secondary components was observed the day after
the pyrotechnical displacement: the increases in sulphate and ammonium were similar to the ones measured during other
summer afternoons at the same sampling site. However, it should be taken into account that secondary compounds
formation may change in relation to local meteorological condition, pollutants mixture and duration and strength of the
episode.
In Figure 6, the fireworks chemical profile obtained by PMF is also reported as an original contribution to the
characterisation of fireworks emissions. Major components are carbon compounds (both EC and OC) and metals. The
fireworks source profile confirms Sr as the best tracer in our case study as, contrarily to other fireworks indicators, it was
found only in this chemical profile while, for example, Ba was also detected in the traffic profile, and K was found in a
number of sources (not shown here). In Table 2 the PMF apportionment for major PM10 components detected during
pyrotechnic displays is reported. As already reported for PM10 mass concentrations, also elements, ions, and carbon
components peaked in the 12 a.m. - 4 a.m. time interval. Total carbon (TC = EC+OC) due to fireworks accounted for 11 µg
m-3 of the PM10 mass (i.e. about 50-55 % of the measured total carbon). Major elemental contributions apportioned by
PMF and due to the pyrotechnic displays were Mg (0.4 µg m-3), K (0.7 µg m-3), Cu (0.07 µg m-3), Sr (0.1 µg m-3), and Ba
(0.1 µg m-3) corresponding to 81%, 77%, 68%, 100% and 91% of their measured concentration, respectively. These results
are in very good agreement with experimental observations discussed so far.
3.4 Number size distribution
During the fireworks night, starting from 11 p.m., the number concentration in all size ranges increased. The growths were
different for each size bin, but the maximum concentration was always found on 12:10 a.m.. The ratios between the number
of particles measured on 12:10 a.m. and 11 p.m. were as follows: 6.7 for particles in the range 0.5<d<1 µm, 2.8 for
particles in the range 2.5<d<10 µm, 2.6 for particles in the range 1 <d<2.5 µm and 1.7 for particles with d<0.5 µm.
The delay (about 1.5 hours) in the occurrence of the maximum concentration compared to end of the match may be
explained considering the distance of our sampling site from the city centre (where the major fireworks exhibition was
performed and the largest traffic volume observed) together with the low wind speed, the wind direction and the
atmospheric stability conditions. From 12:10 a.m. to 1:40 a.m. the particles number concentration in all size ranges
decreased as follows: -20% for particles with d<0.5 µm, -70% for particles in the range 0.5<d<1 µm, -50% for particles in
the 1<d<2.5 µm range and -35% for particles in 2.5<d<10 µm range. Between 1:40 a.m. and 3 a.m. another increase was
observed in all size bins, and particularly in particles with diameters smaller than 0.4 µm. It is interesting to note that a
growth in Cu hourly concentration (fine fraction) and in NO2 concentration (at 1-J monitoring station near the University

Accep
ted m
anusc
ript
9
campus) was also measured between 2 a.m. and 3 a.m. (see Figures 3b and 4). As these increases were contemporary, the
growth in particle number concentration might be ascribed to traffic (contributing to Cu, NO2, and fine particles), because
of people going back home after celebrations. Moreover, these results suggested that traffic emissions were mainly in the
finest fractions. After 3 a.m., particles number concentrations definitively decreased until the next morning, when the
number of particles increased again because of typical working day’s activities.
Particles number temporal pattern in each size range was compared to Sr concentration (taken here as fireworks tracer).
The correlation coefficients between Sr (fine fraction) and number concentration were calculated using hourly-resolved
data between 10 p.m. on 9th July and 10 a.m. on 10th July. The highest correlation coefficients (R>0.95) were registered in
the 0.45 – 1 µm, and particularly in the 0.70 - 0.80 µm, size bin (R=0.98). The high correlation between Sr and the 0.7-0.8
µm size range is consistent with what found by Perry (1999), who reported 0.7 µm as mass mean diameter of potassium (in
that work considered the indicator for fireworks) observed after fireworks emissions transport.
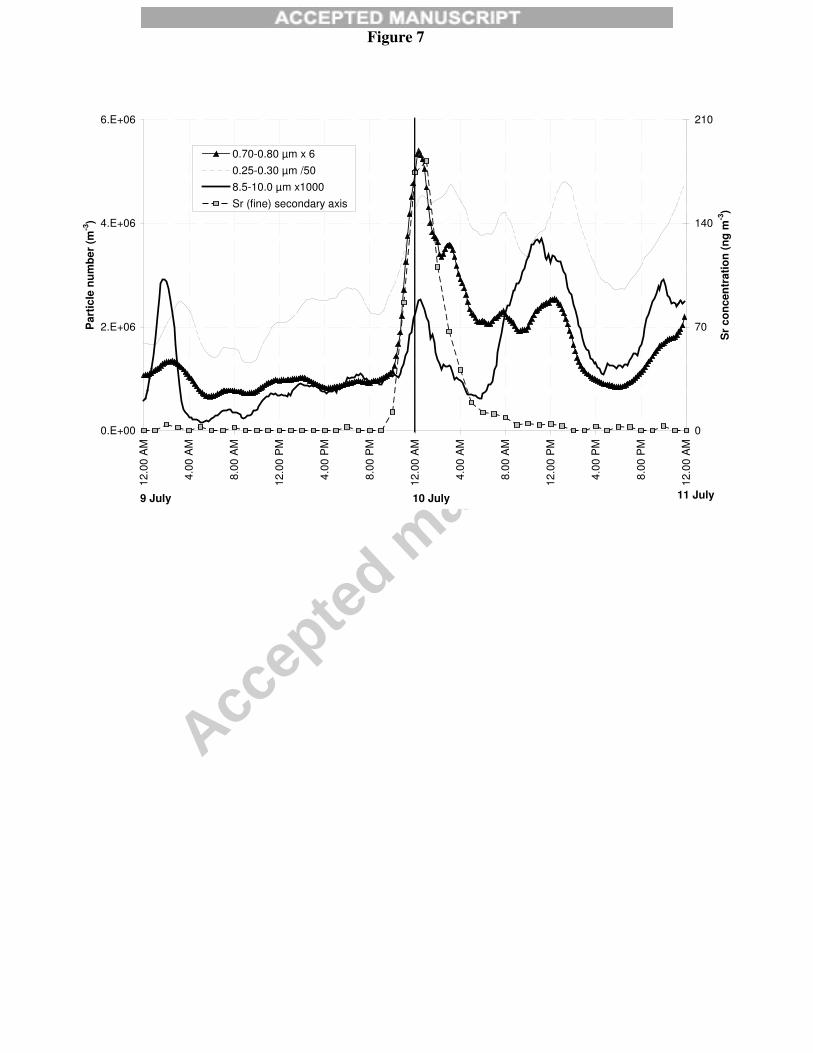
In Figure 7, Sr temporal pattern (1-hour resolution) and particles number concentrations (10-minutes resolution) in the
0.25-0.3 µm, 0.70 - 0.80 µm, and 8.5-10 µm size intervals are shown, as examples. A very good agreement between Sr and
particle number in the 0.70 - 0.80 µm size range in the increase phase and in the first part of the decrease phase was
evident, while differences can be noticed after 2 a.m. However, it must be considered that, in this case study, fireworks
display was the only source of Sr while airborne particles in general can be originated by different sources. In Figure 7 can
also be noted that, even if particles in the 0.25-0.3 µm and 8.5-10 µm size ranges increased during the fireworks period, a
poorer correlation (R=0.72 and R=-0.13, respectively) was found with Sr concentration.
Taking into account the good correlation between Sr and particles in 0.4-1µm size range during the increase phase, and
evaluating the time necessary to Sr to reach values similar to those presented before fireworks, a rough estimate of the time
necessary to particles in this size-range to diffuse (with low wind speed conditions) can be evaluated in about 12 hours.

Accep
ted m
anusc
ript
10
4. Conclusions
The fireworks exhibition was used to study the chemical composition and the size distribution of airborne particles
observed during such events. The influence of additional emissions due to the traffic registered just after the football match
was also discussed.
Atmospheric aerosols originated by fireworks had a typical signature as singled out by the few works on this topic (see
references given in the text). Results obtained by hourly elemental analysis showed that in the fine fraction many metals
(i.e. Sr, Mg, K, Ba and Cu) increased significantly during the celebrations (e.g. Sr up to 120 times in one hour) while no
differences were observed in the coarse fraction concentrations. It is worth noting that, although fireworks cause short-lived
air pollution events, fine particles are responsible for adverse health effects, and the bioreactivity of fine metal aerosols is
of particular concern (Moreno et al, 2007; and therein cited literature).
The availability of a large number of chemically characterised samples allowed the PM10 and major chemical components
apportionment during the pyrotechnic displays. Although our fireworks event had short duration, the PM10 concentration
ascribed by PMF to the fireworks source was not negligible (up to 33.6 µg m-3). In addition, fireworks accounted for a large
part of the metal concentrations (e.g. up to 70-100% of the measured values for Mg, K, Cu, Sr, and Ba). Obviously, the
impact of this source type can vary considerably in relation to fireworks duration and type, being more serious when stable
atmospheric conditions occur (Clark, 1997). The assessment of the fireworks source chemical profile and of the
contribution of fireworks to local environment gives an original contribution towards understanding the aerosol
characteristics and burden during fireworks displays.
Acknowledgements
The authors acknowledge ARPA Lombardia for providing data from the air quality monitoring network.
References
¶ Attri, A.K., Kumar, U., Jain, V.K., 2001. Formation of ozone by fireworks. Nature 411, 1015
¶ Babu, S.S., Moorthy, K.K., 2001. Anthropogenic impact on aerosol black carbon mass concentration at a tropical
coastal station: a case study. Current Science 81, 1208-1214
¶ Birch, M.E., Cary, R.A., 1996. Elemental Carbon-based method for monitoring occupational exposures to particulate
diesel exhaust. Aerosol Science and Technology 25, 221-241
¶ Calzolai, G., Chiari, M., García Orellana, I., Lucarelli, F., Migliori, A., Nava, S., Taccetti, F., 2006. The new external
beam facility for environmental studies at the Tandetron accelerator of LABEC. Nuclear Instruments and Methods in
Physics Research B249, 1-2, 928-931

Accep
ted m
anusc
ript
11
¶ Casadei, S., Giugliano, M., Lonati, G., Pacifico, F., Valli, G., Vecchi, R., 2006. Valutazione dell’altezza dello strato
rimescolato nell’area urbana di Milano nel biennio 2003-2004. Ingegneria Ambientale, XXXV, 4, 155-168 (in Italian)
¶ Clark, H., 1997. Light blue touch paper and retire... Atmospheric Environment 31, 2893-2895
¶ Drewnick, F., Hings, S.S., Cutius, J., Eerdekens, G., Williams, J., 2006. Measurement of fine particulate matter and gas-
phase species during the New Year’s fireworks 2005 in Mainz, Germany. Atmospheric Environment 40, 4316-4327
¶ Dutcher, D.D., Perry, K.D., Cahill, T.A., Copeland, S.A., 1999. Effects of indoor pyrotechnic displays on the air quality
in the Houston Astrodome. Journal of Air & Waste Management Association 49, 156-160
¶ Fermo, P., Piazzalunga, A., Vecchi, R., Valli, G., 2006. Set-up of extraction procedures for ions quantification in
aerosol samples. Chemical Engineering Transactions 10, 203-208
¶ Kim, E., Larson, T.V., Hopke, P.K., Slaughter, C., Sheppard, L.E., Claiborn, C., 2003. Source identification of PM2.5
in an arid Northwest U.S. City by positive matrix factorization. Atmospheric Research 66, 291-305
¶ Kulshrestha, U.C., Rao Nageswara, T., Azhaguvel, S., Kulshrestha, M.J., 2004. Emissions and accumulation of metals
in the atmosphere due to crackers and sparkles during Diwali festival in India. Atmospheric Environment 38, 4421-4425
¶ Liu, D.Y., Rutherford, D., Kinsey, M., Prather, K.A., 1997. Real-Time Monitoring of Pyrotechnically Derived Aerosol
Particles in the Troposphere. Analytical Chemistry 69, 1808-1814
¶ Marcazzan, G.M., Caprioli, E., Valli, G., Vecchi, R., 2003. Temporal variation of 212Pb concentration in outdoor air of
Milan and a comparison with 214Bi. Journal of Environmental Radioactivity, 65, 77-90
¶ Marcazzan, G.M., Ceriani, M., Valli, G., Vecchi, R., 2004. Composition, components and sources of fine aerosol
fractions using multielemental EDXRF analysis. X-Ray Spectrometry 33, 267-272
¶ Moreno, T., Querol, X., Alastuey, A., Minguillón, M.C., Pey, J., Rodriguez, S., Miró, J.V., Felis, C., Gibbons, W.,
2007. Recreational atmospheric pollution episodes: inhalable metalliferous particles from fireworks displays. Atmospheric
Environment 41, 913-922
¶ Paatero, P., 1997. Least squares formulation of robust non-negative factor analysis. Chemometrics and Intelligent
Laboratory Systems 37, 23-35
¶ Paatero, P., Hopke, P.K., Song, X., Ramadan, Z., 2002. Understanding and controlling rotations in factor analytical
models. Chemometrics and Intelligent Laboratory Systems 60, 253-264
¶ Paatero, P., Hopke, P.K., 2003. Discarding or downweighting high-noise variables in factor analytic models. Analytica
Chimica Acta 490, 277-289�
¶ Pacifico, F., 2005. Il Radon come tracciante dell’altezza dello strato rimescolato: sviluppo di un modello a box. Degree
Thesis in Physics, University of Milan, Italy (in Italian)
¶ Perry, K.D., 1999. Effects of outdoor pyrotechnic displays on the regional air quality of Western Washington State.
Journal of Air & Waste Management Association 49, 146-155

Accep
ted m
anusc
ript
12
¶ Polissar, A.V., Hopke, P.K., Paatero, P., Malm, W.C., Sisler, J.F., 1998. Atmospheric aerosol over Alaska. 2. Elemental
composition and sources. Journal of Geophysical Research 103, 19045-19057
¶ Pope Arden III, C., Dockery, D.W., 2006. Health effects of fine particulate air pollution: lines that connect. Journal of
Air and Waste Management Association 56, 709-742
¶ Prati, P., Zucchiatti, A., Tonus, S., Lucarelli, F., Mandò, P.A, Ariola, V., 1998. A testing technique of streaker aerosol
samplers via PIXE analysis. Nuclear Instruments and Methods in Physics Research B136-138, 986-989
¶ Qin, Y., Kim, E., Hopke, P.K., 2006. The concentrations and sources of PM2.5 in metropolitan New York City.
Atmospheric Environment 40, S312-S332
¶ Ravindra, K., Mittal, A.K., Van Grieken, R., 2001. Health risk assessment of urban suspended particulate matter with
special reference to polycyclic aromatic hydrocarbons: a review. Reviews on Environmental Health 16, 3, 169-189
¶ Ravindra, K., Mor, S., Kaushik, C.P., 2003. Short-term variation in air quality associated with fireworks events: a case
study. Journal of Environmental Monitoring 5, 260-264
¶ Vecchi, R., Marcazzan, G., Valli, G., 2007. A study on nighttime-daytime PM10 concentration and elemental
composition in relation to atmospheric dispersion in the urban area of Milan (Italy). Atmospheric Environment 41, 2136-
2144
¶ Wang, Y., Zhuang, G., Xu, C., An, Z., 2007. The air pollution caused by the burning of fireworks during the lantern
festival in Beijing. Atmospheric Environment 41, 417-431

Accep
ted m
anusc
ript
13
Figure captions
Figure 1: map of the monitoring stations.
Figure 2: PM10 mass (in mg m-3) and 222Rn concentration (in Bq m-3) on 9th-10th July 2006 in Milan.
Figure 3: a) CO (in mg m-3) and traffic volume (number of vehicles); b) NO2 (in mg m-3) concentrations at three different
monitoring stations on 9th-10th July 2006 in Milan.
Figure 4: fireworks elemental markers, fine fraction data with hourly resolution (in ng m-3)
Figure 5: Ratios between the concentration of different chemical components registered in the time interval 12 a.m. - 4 a.m.
(fireworks displays) on 9th-10th July night and the average value measured for the same species during the day before
(grey). Similar ratios (white) calculated for the night between 6th and 7th July (free from fireworks) are given for
comparison.
Figure 6: fireworks source profile (in mg mg-1) as resolved by PMF
Figure 7: Sr hourly temporal pattern (in ng m-3) together with particles number concentration (particles m-3) in the 0.25-
0.30 mm, 0.70-0.80 mm and 8.5-10 mm size intervals
Table captions
Table 1: 4-hour resolution chemical components and elemental concentrations (in ng m-3) during the fireworks episode
Table 2: Contribution to PM10 mass and major chemical components concentration (in ng m-3 and as percentage of their
measured concentration) due to the fireworks source obtained by PMF. By convention, concentration values lower than
experimental minimum detection limits have been labelled as <MDL.
Accep
ted m
anusc
ript
Table 1
Date 9/7 9/7 10/7 10/7 10/7 10/7Time interval 4 p.m. - 8 p.m. 8 p.m. - 12 a.m. 12 a.m. - 4 a.m. 4 a.m. - 8 a.m. 8 a.m. - 12 p.m. 12 p.m. - 4 p.m.PM10 mass 46 400 48 200 63 900 51 400 71 100 55 500 SO4
2- 4 232 3 130 3 622 2 687 2 830 5 147 NO3
- <360 1 115 4 499 2 326 2 326 3 683 NH4
+ 1 169 1 102 1 575 868 1 644 2 548 OC 7 870 9 806 13 491 11 672 12 071 10 490 EC 1 293 1 959 5 372 4 070 4 694 1 748 Mg <100 183 598 246 127 182Al 355 519 680 451 720 609Si 802 1 023 1 368 967 1 790 1 344 S 1 303 803 1 176 1 276 1 024 1 759 Cl <70 <70 233 98 115 121K 158 369 991 369 364 267Ca 308 369 645 723 1 475 744Ti 28 32 46 37 53 34V <6 <6 <6 <6 <6 <6Cr <4 <4 11 10 <4 <4Mn 7 16 30 35 30 20Fe 468 847 1 731 1 581 1 374 586Ni 4 2 5 7 6 5Cu 20 43 105 56 65 25Zn 82 85 190 270 276 90Br 5 6 9 12 6 4Pb 9 16 57 25 41 14Sr <3 55 139 18 11 <3Ba <20 41 156 22 31 24
Table

Accep
ted m
anusc
ript
Table 2
9/7 9/7 10/7 10/7 10/7 10/74 p.m. - 8
p.m.8 p.m. - 12
a.m.12 a.m. - 4
a.m.4 a.m. - 8
a.m.8 a.m. - 12
p.m.12 p.m. - 4
p.m.
ECng m-3
(%)<MDL 1 101
(56)2 827 (54)
357(9)
211(6)
<MDL
OCng m-3
(%)<MDL 3 144
(39)8 075 (52)
1 019 (9)
601(5)
<MDL
Mgng m-3
(%)<MDL 168
(62)433(81)
<MDL <MDL <MDL
Alng m-3
(%)<MDL 102
(20)262(38)
<MDL <MDL <MDL
Sing m-3
(%)<MDL 151
(15)387(29)
49(5)
29(2)
<MDL
Kng m-3
(%)<MDL 269
(64)692(77)
87(27)
52(13)
<MDL
Cang m-3
(%)<MDL 111
(30)284(44)
36(5)
21(1)
<MDL
Mnng m-3
(%)<MDL 5.2
(33)13
(44)<MDL <MDL <MDL
Feng m-3
(%)10.3(2)
400(48)
1 028 (57)
130(10)
77(5)
10(1)
Cung m-3
(%)<MDL 27
(66)70
(68)9
(14)5
(9)<MDL
Zn ng m-3
(%)<MDL 38
(45)98
(52)12(5)
7(3)
<MDL
Srng m-3
(%)<MDL 54
(100)140
(100)18
(99)10
(98)<MDL
Bang m-3
(%)<MDL 51
(90)130(91)
16(47)
<MDL <MDL
PM10mass
ng m-3
(%)<MDL 13 087
(27)33 610
(53)4 240
(8)<MDL <MDL
Table

Accep
ted m
anusc
ript
Figure 1
Figure

Accep
ted m
anusc
ript
Figure 2
0
10
20
30
40
50
60
70
80
PM
10 (
g m
-3)
0
5
10
15
20
25
30
222R
n (
Bq
m-3
)
PM10
Rn (secondary axis)
9ju
l 1
2a
.m.
9ju
l 4
a.m
.
9ju
l 8
a.m
.
9ju
l 1
2 p
.m.
9ju
l 4
p.m
.
9ju
l 8
p.m
.
10
jul
12
a.m
.
10
jul
4 a
.m.
10
jul
8 a
.m.
10
jul
12
p.m
.
10
jul
4 p
.m.
10
jul
8 p
.m.

Accep
ted m
anusc
ript
Figure 3
0
300
600
900
1200
1500
1800
9/7/06
12.00 PM
9/7/06
4.00 PM
9/7/06
8.00 PM
10/7/06
12.00 AM
10/7/06
4.00 AM
10/7/06
8.00 AM
10/7/06
12.00 PM
# v
eh
icle
s
0
0.5
1
1.5
2
2.5
3
CO
co
ncen
trati
on
(m
gm
-3)Traffic volume 4-S
CO 2-V
CO 3-L
a
)
0
20
40
60
80
100
120
140
160
9/7/06
12.00 PM
9/7/06
4.00 PM
9/7/06
8.00 PM
10/7/06
12.00 AM
10/7/06
4.00 AM
10/7/06
8.00 AM
10/7/06
12.00 PM
co
ncen
trati
on
(g
m-3
)
0
10
20
30
40
50
co
ncen
trati
on
(g
m-3
)
NO2 1-J
NO2 3-L
NO2 2-V
(secondary axis)
b)
Figure

Accep
ted m
anusc
ript
Figure 4
0
100
200
300
400
500
600
700
800
900
1000
12.0
0 A
M
4.0
0 A
M
8.0
0 A
M
12.0
0 P
M
4.0
0 P
M
8.0
0 P
M
12.0
0 A
M
4.0
0 A
M
8.0
0 A
M
12.0
0 P
M
4.0
0 P
M
8.0
0 P
M
12.0
0 A
M
Concentr
ation (
ng m
-3)
0
20
40
60
80
100
120
140
160
180
200
Concentr
ation (
ng m
-3)
K (fine)
Mg (fine)
Sr (fine), secondary axis
Ba (fine) secondary axis
Cu (fine), seconday axis
9 Jul 10 Jul 11 Jul
Figure

Accep
ted m
anusc
ript
Figure 5
11.49.3
6.8
5.2
3.7 3.4 3.1 3.0 2.9 2.9 2.82.5 2.4 2.3 2.3 2.3 2.1
1.7 1.6 1.5
56.0
4.6
0
1
10
100S
r
Mg
Ba K
NO
3-
Cu
Pb
Zn
EC
Mn
Cr
Cl
Fe Al
Ti
Ni
Br
Si S
OC
Ca
NH
4+
Inc
rea
se
fa
cto
r
0.00-4.00 a.m. 10th July
0.00-4.00 a.m. 6th July
Figure

Accep
ted m
anusc
ript
Figure 6
0.001
0.01
0.1
1
EC
OC
NO
3-
NH
4+
SO
4--
Mg Al
Si
Cl K
Ca Ti
Cr
Mn
Fe Ni
Cu
Zn Br
Pb Sr
Ba
facto
r lo
ad
ing
(m
gm
g-1
)
Accep
ted m
anusc
ript
Figure 7
0.E+00
2.E+06
4.E+06
6.E+06
12.0
0 A
M
4.0
0 A
M
8.0
0 A
M
12.0
0 P
M
4.0
0 P
M
8.0
0 P
M
12.0
0 A
M
4.0
0 A
M
8.0
0 A
M
12.0
0 P
M
4.0
0 P
M
8.0
0 P
M
12.0
0 A
M
Part
icle
nu
mb
er
(m-3
)
0
70
140
210
Sr
co
nc
en
tra
tio
n (
ng
m-3
)
0.70-0.80 µm x 6
0.25-0.30 µm /50
8.5-10.0 µm x1000
Sr (fine) secondary axis
9 July 10 July 11 July