Embed Size (px)
Citation preview

Article title: WHEEL WEAR PERFORMANCE ASSESSMENT AND MODEL VALIDATION USING HAROLD
FULL SCALE TEST RIG
Authors: Pelin Boyacioglu, Ricardo Rail, 30 Eastbourne Terrace, Paddington, London, W2 6LA, UK
E-mail: [email protected]
Adam Bevan, Institute of Railway Research, University of Huddersfield, Queensgate, Huddersfield,
HD1 3DH
Paul Allen, Institute of Railway Research, University of Huddersfield, Queensgate, Huddersfield, HD1
3DH
Barnaby Bryce, Institute of Railway Research, University of Huddersfield, Queensgate, Huddersfield,
HD1 3DH
Abstract:
The railway industry has focused on the improvement of maintenance through the use of novel
technologies. Recently, the utilisation of repair welding to restore the worn area on wheels has been
investigated, as it can bring significant savings in wheelset maintenance. Under an Innovate UK
AURORA project, a worn wheel that previously operated on London Underground (LUL) was restored
using this process. To test its performance and compare with a new standard steel grade wheel, the
HAROLD full scale test rig was used in which an LUL vehicle bogie equipped with both the restored
and R9 grade wheels was operated under the representative lateral and yaw displacements computed
from vehicle dynamics simulations. The wear measurements carried out at the end of test cycles
showed that although the restored wheel suffered from initial higher wear, the levels reduced and
became similar to the R9 grade wheel. Furthermore, the full-scale testing provided an opportunity to
validate the wear model predictions which were conducted using the vehicle dynamics simulations
utilised in testing inputs. It was found that while the flange wear predictions were higher, the tread
wear estimations were smaller than the measurements on the R9 grade wheel.
Keywords: Wheel profile management, wheelset maintenance, wheel wear prediction, validation,
full-scale testing

1. Introduction
The management of wheel damage is crucial in railways, as their maintenance and renewals account
for a large proportion of the whole-life costs in rolling stock. However, the issues with wheelset
maintenance scheduling, depot constraints and limited fleet availability make it challenging which in
turn leads train operators to strive for new technologies and solutions.
The use of repair welding on wheels has been recently investigated in order to restore the area which
is removed by wear during normal operation or to replace the material damaged during the rolling
contact, such as fatigue cracking, shelling and cavities. It is suggested that this technique can bring
significant savings to railways, as it can help to extend the life of wheels and hence, the annual costs
of renewals can be reduced. One of the major wheel providers; Lucchini Unipart Rail (LUR) stated that
they produce approximately 34,000 new wheels for the UK rail sector at a cost of over £20 million
each year.
The Innovate UK AURORA (AUtomated Remanufacturing Of RAil components) project gathered the
industry and academics together to develop and demonstrate a flexible remanufacturing cell for rail
components which included high performance metal cladding and advances in machining and in-
process inspection. Under the scope of this project, the Lucchini Unipart Rail (LUR) investigated the
application of cladding in repairing the worn wheels and The Welding Institute (TWI) implemented
submerged arc welding. This process was selected due to quality of clad material and it can quickly
deposit the material at the required pre-heat and interpass temperature of 400°C. The manufacturing
cell was reconfigurable hence, it could accommodate wheelsets of different diameters.
In this project, the repair welding technique was applied to an LT5 profile wheel which was previously
operated in London Underground (LUL). Since the increased timetables and further reductions in
maintenance and renewal expenditures provides new challenges to their rail-wheel interface
management, they have made several attempts to maximise their asset life such as introducing novel
technologies to monitor defects and conducting vehicle dynamics simulation modelling to predict the
damage1-5. In respect to wheel management, an extensive measurement campaign across each
individual fleet was conducted to establish a preventative turning interval within each Train
Maintenance Regime (TMR). However, while this can help to accurately plan train maintenance
scheduling, more work is still required to ensure sufficient trains are available in service to cope with
increased timetables at lesser life cycle costs. Therefore, the restoration of wheels by advanced
welding methods may allow to increase life of wheels and in turn help to reduce costs.
In order to assess the wheel material performance particularly, against wear and rolling contact
fatigue (RCF) cracking, it is important to carry out testing under representative and realistic loading
conditions. The HAROLD (Huddersfield Adhesion and Rolling Contact Dynamics) test rig located at the
University of Huddersfield’s Institute of Railway Research (IRR) is able to generate a range of contact
conditions under a full-scale vehicle bogie. In this project, a wheel previously operated on LUL was
restored and fitted to an axle alongside a new wheel manufactured from R9 steel grade. This wheelset
was installed in the ex-LUL’s D-Stock bogie and mounted on the HAROLD test rig.
The material characteristics and dimensions of the restored wheel aimed to resemble that of a wheel
manufactured from R9 steel grade. Comparable mechanical and chemical properties were provided
and nominal wheel dimensions, with similar flange thickness and height levels on both the restored
(right) and R9 (left) wheels.
In this paper, the performances of both of the restored wheel and R9 grade wheels under full-scale
testing is presented. Firstly, the full-scale HAROLD test rig is introduced including the bogie
configurations and rig characteristics. Secondly, the input parameters used in the testing are
presented which were calculated from vehicle dynamics route simulations of the Bakerloo line on the
LUL network. After verifying the test set-up and wheelset trajectory, accelerated wear testing was
carried out consisting of multiple repeated test cycles of the entire route. Following each test cycle,
MiniProf6 wheel profile measurements were conducted to examine the wear patterns and the running

surfaces were inspected which included scanning the wheels using the MRX Surface Crack
Measurement (MRX-SCM)7 system.
In addition to use of restored wheels to increase life of wheels, accurate prediction of wear rates is
also beneficial to plan preventative turning intervals and to verify train maintenance scheduling. Since
the full-scale testing in this project generated useful wear data under representative contact
conditions as those seen in the reality and the vehicle dynamics simulations allowed to calculate
wheel-rail contact forces and to implement the different wear prediction models, the predicted worn
areas from these various models were compared with the measured worn areas on the R9 grade wheel
in the last section of the paper.
2. Wheel-Rail Contact Test Rig
The HAROLD test rig consists of a 2 m diameter drum with two circumferential rails, a bogie moving
platform and a loading frame. Figure 1 shows the test rig with its associated components from
different views. As it can be seen, the D-Stock bogie was placed on the movable platform and the
rotating rails are located below to rotate the leading wheelset of the bogie.
During the full-scale testing, servo-actuators rotate the movable platform in lateral and yaw axes to
stimulate the wheel-rail lateral displacement and yaw angle (angle of attack) seen during vehicle
curving. With respect to this, the wheels can experience the range of contact conditions observed in
reality. Additionally, the two vertical hydraulic servo-actuators located on the loading frame enable
the application of the static and dynamic vertical loading. Each actuator integrates load and
displacement measurements that can be used for automatic control of the test parameters.

Figure 1: Full scale HAROLD test rig with its components
In addition to the vehicle curving behaviour, the maximum wheelset (rolling rails) speed is 200 km/h
and a braking torque of 110 kNm can be applied to generate full-slip contact conditions at the wheel-
rail interface. Therefore, it is possible to investigate bogie dynamics in relation to the suspension
characteristics under full-scale loads and realistic speeds. Examples include establishing the true
effective primary yaw stiffness of a bogie which is significant for wear and RCF damage and also
secondary suspension behaviour such as bogie rotational resistance. The vertical performance of the
suspension system can also be characterised through application of dynamic loads via the bogie
centre-pivot. Furthermore, the test rig is fitted with an in-built lathe head, allowing any cross-sectional
profile to be applied to the two rail sections on the rotating drum.
2.1. Bogie Installation
A LUL D-Stock test bogie was used and the test wheelset equipped with restored wheel on the right
and a R9 steel grade wheel on the left, shown in Figure 2.

Figure 2: D-Stock bogie with restored and R9 grade wheels
The test rig’s vertical hydraulic rams were linked together by a loading beam to ensure the correct
interface with the D-Stock bogie’s traction centre and diablo springs. The leading wheelset was
fastened to adaptor plates on each axlebox and these were connected to brackets bolted onto the
movable platform. The brackets ensured that the platform can move the wheelset in lateral and
longitudinal axes, helping to recreate the wheel-rail shifts and yaw angle experienced during normal
operations.
Additionally, the connections between the axlebox adaptor plates and the restraint brackets
contained three load cells with two located in the longitudinal direction and one in the lateral
direction, allowing the longitudinal and lateral forces to be monitored during the test.
3. Full-Scale Testing Methodology
3.1. Simulation of Wheel Trajectory
In order to assess the performance of wheels and to provide a realistic indication for the rate of wear
and any emerging damage, the typical duty conditions which the wheelsets experience in service were
determined and used as an input to the test rig programme. The Bakerloo line was selected since, it

contains high number of tight curves. This helps to generate a representative range of contacts across
the wheel, including both tread and flange contacts.
Vehicle dynamics route simulations of the Bakerloo line were conducted in the Vampire software.
Nevertheless, a number of changes were made to replicate the testing conditions in the simulations,
including the removal of check rails from curves less than 200 m radius and an application of a constant
track gauge of 1440 mm, e.g. distance between rail rollers on the test rig. The check rails on the
Bakerloo line restricts the level of wheel flange contact on the high rail and greater forces are
generated on both high tread and low rail contacts1. Therefore, with the removal of check rails, higher
flange forces occurred under these sharp curve radii (R<200). Most importantly, as the timeframe for
the testing was limited and it was not possible to run typical mileages seen by a wheelset in-service,
accelerated wear testing was carried out using a higher constant running speed of 64.5 km/h in which
the maximum operational speed was 50 km/h in reality.
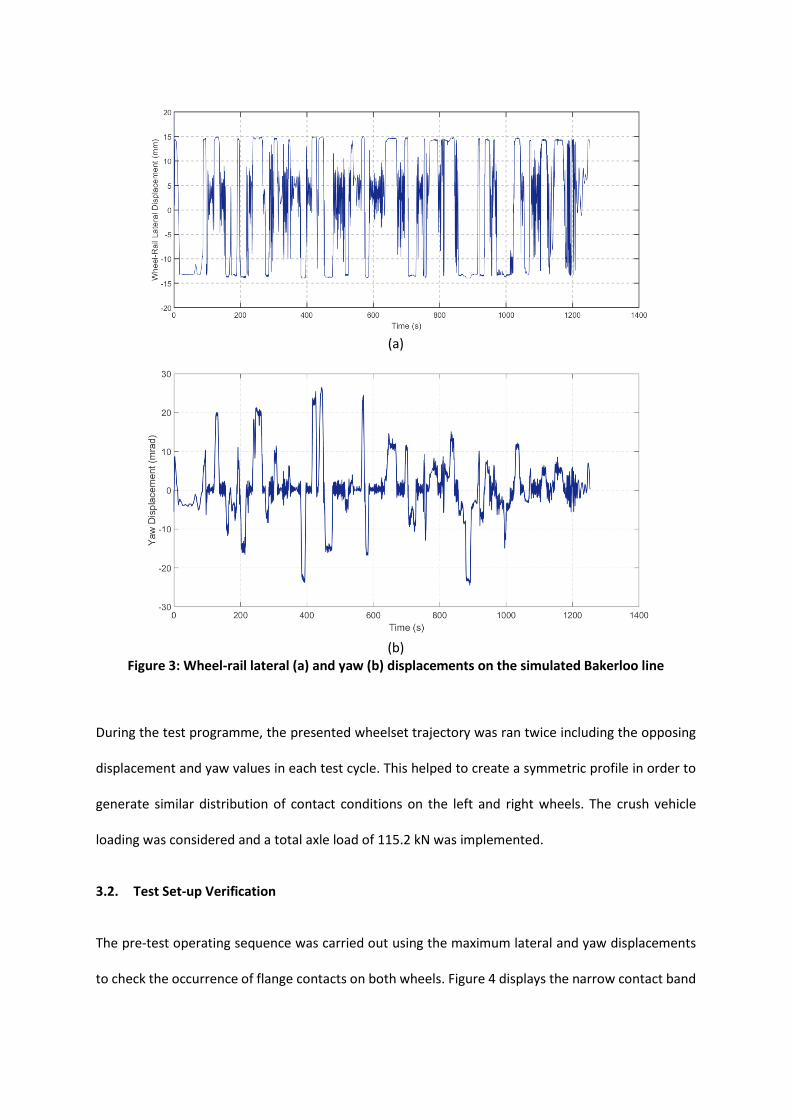
The wheelset lateral and yaw displacements computed from the simulations were used as an input to
provide the wheelset trajectory generating the representative contact conditions seen during the
service operations. As can be seen in Figure 3, both lateral and yaw displacements are relatively high
due to curvaceous track geometry on the Bakerloo line. In order to check whether these given inputs
were within the limits of the test rig, the lateral and yaw velocities were subsequently calculated and
found that the maximum yaw velocity of 28 mrad/s (≈1.65 deg/s) is smaller than HAROLD’s 2 deg/s
(≈35 mrad/s) limit.
(a)
(b)
Figure 3: Wheel-rail lateral (a) and yaw (b) displacements on the simulated Bakerloo line
During the test programme, the presented wheelset trajectory was ran twice including the opposing
displacement and yaw values in each test cycle. This helped to create a symmetric profile in order to
generate similar distribution of contact conditions on the left and right wheels. The crush vehicle
loading was considered and a total axle load of 115.2 kN was implemented.
3.2. Test Set-up Verification
The pre-test operating sequence was carried out using the maximum lateral and yaw displacements
to check the occurrence of flange contacts on both wheels. Figure 4 displays the narrow contact band

produced prior to full testing. While two-point contact can be seen on both flange and tread regions
of the restored wheel, the latter was not observed on the R9 grade wheel.
Figure 4: Comparison of initial running surfaces between restored and R9 grade wheel
3.3. Results
Accelerated wear tests were carried out consisting of 16 repeated cycles. Each cycle contained a test
rig control sequence where the rail speed and vertical loads were maintained constantly and a series
of pre-computed lateral and yaw displacements were applied to the movable platform in order to
enable the wheelset movements in the simulated Bakerloo line route. During the tests, these inputs
in test programme were monitored continuously. The wheelset effectively followed the actual
wheelset trajectory and its reverse in order to provide similar trajectory for both left and right wheels,
as aforementioned in Section 3.1. In total, one cycle lasted for 42 minutes.
To quantify the performance of both restored and R9 grade wheels, the wheel profile measurements
using MiniProf6 were conducted following the completion of each test cycle and any changes in
running surfaces were recorded. Following the completion of the testing, both wheels were scanned
using the MRX-Surface Crack Measurement (SCM)7 system to determine the depth of any damage in
the wheel rim.

3.3.1. Wheel Wear
Following each test cycle, wheel profile measurements were carried out at three different positions
(A, B and C) equally spaced around the circumference (120°/360°) of both wheels. These
measurements were compared with the baseline measurements (prior to testing) to identify the key
wear parameters (e.g. flange height and thickness) and the loss of cross-sectional area across the
profile.
Figure 5(a) presents the initial wheel profile (before testing at Position A) and shows the worn profiles
on both restored and R9 grade wheels at the end of experiment (Test Cycle 16). It can be seen that a
greater wear was generated on the restored wheel particularly on flange face and tread regions. The
differences in flange and tread wear from the R9 grade wheel (Figure 5(b)) also demonstrated that
while the (change in Sd) flange wear is approximately 3.5 times higher, (change in Sh) tread wear is 2.5
times larger than the R9 grade wheel. As expected from the vehicle dynamics simulations, the high
number of tight curves in the Bakerloo line potentially produced damaging flange contacts which in
turn gave rise to larger wear rate in this region. Nevertheless, the higher initial wear experienced at
the beginning which can be seen from the slope of the lines decreased as the number of cycles
increased in the experiment.
(a)

(b)
Figure 5: Comparison of different wheel profile measurements (a) and differences on flange and tread wear between restored and R9 grade wheels (b)
3.3.2. Surface condition and damage
To identify any changes on the surface condition during the tests, photographs were taken following
the test cycles. Figure 6 provides a summary of the key observations and illustrates the photos
following the test cycles 5, 9 and 16. During the tests, a similar running bandwidth was generated on
both wheels which provided confidence that they were subjected to similar trajectory. Compared to
R9 grade wheel, the running surface was relatively smoother and shiny appearance with wear debris
evident as a result of higher wear rate on the restored wheel. However, a band of RCF damage was
also observed to have initiated in the flange root region of the restored wheel.
On the successive test cycles, a short-wavelength irregularity was observed on both wheels as can be
seen from the photos provided for Test 9. This is often caused by a wheel out-of-roundness and/or
higher track stiffness which could be a characteristic of the test rig. It may also be an indicative of
potential sub-surface damage8.

Figure 6: Key surface observations after the test cycles 5, 9 and 16

Additionally, MRX wheel SCM7 inspection device was used to measure the depth of any defects in the
wheel rim at the end of experiment (Test Cycle 16). This device uses magnetic flux leakage to measure
crack depths up to 10 mm in the wheel rim. When a crack or artifact is present in the wheel, the flux
lines cannot travel easily around the wheel and some leakage occurs in which the sensors measure
the depth from changes in strength of flux lines9. Figure 7 illustrates the surface damage
measurements with the observations in the relevant region on both wheels. The SCM can measure 80
mm of the tread from the rim side of the wheel. The maximum artifact depth was reported as 2.9 mm
for the cracking band close to flange root of the R9 grade wheel. In respect to the restored wheel,
while there was no significant cracking apparent on the surface of the wheel, the short-wavelength
irregularities were actually indicative of a sub-surface damage and hence, a higher artifact depth was
measured on the restored wheel. However, it should be noted that these measurements should be
validated by sectioning of the tested wheels.
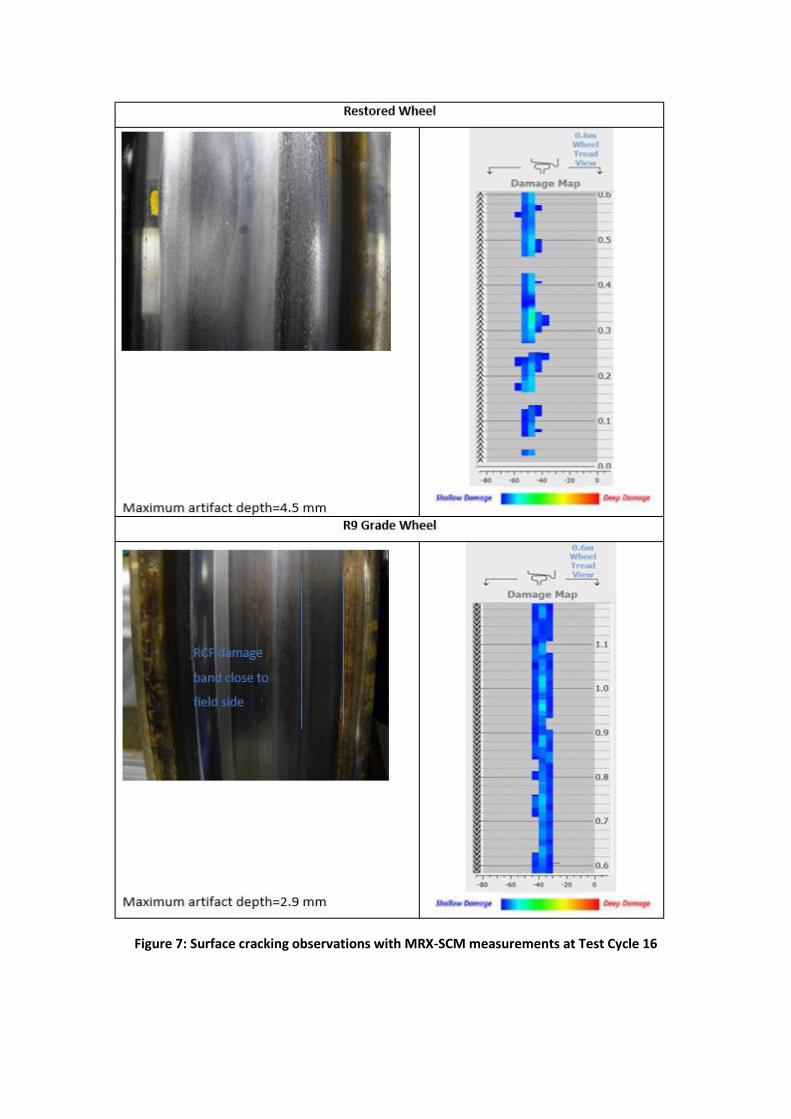
Figure 7: Surface cracking observations with MRX-SCM measurements at Test Cycle 16

4. Wear Modelling and Validation Methodology
Even though several measures have been implemented to optimise wheel reprofiling and associated
costs on LUL, the use of prediction models of wheel wear can provide additional benefits. For instance,
the models can support the optimisation of preventative turning intervals and the verification of depot
scheduling. In addition, they can improve the understanding of damage in both surfaces of the
interface and facilitate the design of more track friendly vehicles. To increase the reliability of the
prediction models and to gain confidence in their application of real scenarios, the full-scale testing
provides the opportunity to validate the models under the contact conditions representative to those
experienced in the field. Under real-world operating conditions, environment, weather and third body
layers (e.g. sand, lubricant, water, leaves, wear debris, etc) have an effect on the rate of wear but,
there is no control over these changes and it is difficult to identify all these influential factors. Thus,
full-scale laboratory tests are beneficial to control these variations and provide a more representative
wear data. Some of the previous work done with full-scale testing can be found in previous works10-12.
While the main aim of this project was to assess the performance of the new restored wheel, the
Vampire vehicle dynamics simulations which were used to define the test input parameters provided
the related wheel-rail contact parameters that are used in the wear prediction modelling. These
simulations were updated to include the number of test cycles known during the experiments, the
contact parameter results of each test simulations were used in wear prediction model calculations.
In literature, there are three common prediction models that are used to estimate wheel wear: BRR
wear function13,14, Tγ/A15 and Archard’s wear model16. As the Tγ/A wear model predictions were
related with the wear rate in terms of weight loss (per unit nominal contact area in unit distance rolled
- (µg/m/mm2)) and this parameter was not measured during testing, the BRR wear function and
Archard’s wear model were considered and their predictions were compared with wear
measurements on the R9 wheel, only.

4.1. BRR wear function
This model describes the changes in wear rates with respect to the wheel-rail contact energy
parameters ‘Tγ (N)’ also known as Wear Number13,17. It is calculated from the sum product of
creepages and creep forces;
𝑇𝛾 = 𝑇𝑥𝛾𝑥 + 𝑇𝑦𝛾𝑦 +𝑀𝑧𝜔𝑧
where 𝑇𝑥, 𝑇𝑦 and 𝛾𝑥, 𝛾𝑦 are the tangential creep forces and the corresponding creepages in the
longitudinal and lateral direction respectively, and 𝑀𝑧 and 𝑤𝑧 are the spin moment and the related
spin creepage.
Figure 8(a) presents the model and the changes in wear rates as a result of increase in Tγ levels. The
function was mainly developed considering the full-scale test results for R8T (wheel) and BS11 (rail)
steels under dry conditions.
Figure 8: BRR wear function13 (a) Wear map for UIC 900 A rail against R7 wheel18(b)
(a) (b)

The global contact parameters are used showing the mean values of creepage and creep forces and
the cumulative sum of Tγ over the whole contact patch area. Therefore, the Vampire contact
calculations in the vehicle dynamics route simulations were directly used in the modelling.
4.2. Archard’s wear model
The Archard’s model16 predicts the wear volume V (m3) using the normal force N (N), sliding distance
s (m) and the hardness of the softer material at the contact H (N/mm2) with a non-dimensional wear
coefficient k;
𝑉𝑤𝑒𝑎𝑟 = 𝑘𝑁 ∗ 𝑠
𝐻
The wear coefficient k is based on the relationship between sliding velocity v (m/s) and contact
pressure P (MPa=N/mm2). The variation of the k coefficients can be found by using a wear map. The
regimes in this map have been defined using twin-disc and pin-on-disc tests with different rail and
wheel materials under mainly dry conditions19-21. Figure 8(b) shows an example of a wear map and the
(dimensionless) k wear coefficients for 900 A rail against R7 wheel. Therefore, certain scaling was
required to apply in full-scale experiments. Previously, the wear rates from small and full-scales tests
were compared using Tγ (Tγ/A) parameters and showed good correlations19,21.
On the contrary to BRR wear function, this model uses the local contact parameters in which the
wheel-rail contact is divided into a number of grids and the creep forces including the related Tγ are
computed for each one individually. To provide this, the FASTSIM22 code was used in conjunction with
the Vampire route simulations and the contact patch is divided into 50 x 50 grid elements. The sliding
velocity v and contact pressure P calculated at each cell helped to find the related wear coefficients
and radial wear depth ∆z (m) was calculated using the below formula23:
∆𝑧 = 𝑘|𝑠|𝑃
𝐻

where |s| (m) is the sliding distance which is computed using the slip velocities at longitudinal and
lateral directions: vx and vy, respectively.
|𝑠| = √𝑣𝑥2 + 𝑣𝑦
2
In this model, an initial wheel profile is provided and the model predicts the amount of material to be
removed from surface and updates to generate a worn profile for a predefined travel distance.
4.3. Wear Modelling Predictions and Comparison with Test Measurements
4.3.1. BRR wear function results
Since the microstructure of the restored wheel was different from the previous tested materials, the
comparisons were only made for R9 grade wheel measurements. However, it should be noted that
the material properties in this R9 wheel also varied from the previous case used to validate the wear
models, specifically R8T wheel steel. For instance, the R9 has slightly larger (minimum) hardness levels
of 255 HB than the 241 HB in R8T material. But, the conditions were also dry and no additional layers
such as lubricant and water were implemented. Thus, the corresponding wear coefficients from this
(dry) wear function were accumulated using the (global) Tγ values generated at each contact during
the simulations. Figure 9 demonstrates the comparisons between the predicted worn areas and loss
of worn area found from measurements at each cycle. As it can be seen from the wheel transversal
profile presented in the Figure 9 a), wear mostly occurred on the flange (root) compared to tread
region over the wheel. The contacts produced over these regions were accumulated to find the total
worn areas on each test cycle.
As there were no significant variations between the flange height and thickness measurements from
different circumferential positions on the R9 wheel, the average worn areas were presented on Figure
9(b) and due to this, using different A, B and C profiles did not alter the predictions.

Figure 9: Transversal wheel profile differences between Pre-test and Test Cycle 16 (a) and comparison of worn area predictions and measurements on the R9 grade wheel (b)
It can be seen that although the greater energy produced at the flange contacts resulted in larger wear
rates and the lower Tγ values generated at tread contacts led to smaller predictions, there were no
major differences between the total results. The higher initial measured worn areas showed a gradual
increase and better agreement with the predictions at the beginning. But, the wear reached steady-
state wear regime (a plateau) around Test 9. As the increase in running distance gave rise to higher
predictions, the differences became larger after reaching this steady-state wear regime which might
be caused from the hardening of the material experienced in reality. Owing to this fact, it was
previously advised that the wear testing should be continued until the values reach this plateau19.
Wheel Transversal
Profile (a)
(b)

4.3.2. Archard’s wear model results
In order to use the Archard’s wear model, one of the pre-Test profiles (A) was entered into the
modelling and the (radial) wear depth ∆z was calculated and implemented to find the resulting
updated worn profiles. This then was used as an input for the subsequent test cycles.
The top plot in Figure 10(a) displays the provided pre-Test profile at position A and the updated worn
profile at Test Cycle 16 whilst, the lower plot (b) presents the comparison of predicted wear depth ∆z
with the measured values across the wheel profile under Tests 8 and 16. Similar to BRR function
predictions, the higher flange and lower tread contact creep forces resulted in over- and-
underestimation of wear, respectively. The steady state wear regime again could not be described by
this model as the differences became larger in the Test 16. In addition, while the measured wear
generated wider contact bands particularly on the flange region, the predictions contacted narrower
area and became limited in the flange root of the wheel.

(a)
(b)
Figure 10: Predicted updated worn profile at Test Cycle 16 (a) and comparison of ∆z wear depth predictions and measurements on the R9 grade wheel (b)
5. Conclusions
The challenges such as increased timetables and reductions in spending lead operators to seek more
novel technologies and materials to reduce wheel-rail interface induced damage. Restoration of
removed material in wheels by advanced welding methods has been recently investigated which could
provide certain benefits to wheelset maintenance by extending the life of a wheelset.

Under the Innovate UK AURORA project, the submerged arcwelding technique was implemented to
restore material (either removed by in-service wear or through turning to remove surface damage) on
the LT5 wheel. To assess the performance of a new material, it is necessary to carry out testing under
representative conditions which are experienced during the real railway operations. Due to changing
track geometry and irregularities, the wheels move over the rails laterally and angle-of-attack also
occurs to guide wheelsets when negotiating a curve. Therefore, to represent these variations, the
performance of the restored wheel was evaluated using the HAROLD full-scale test rig and compared
with the R9 grade wheel which was fitted alongside the LUL’s D-Stock bogie wheelset.
The wheelset underwent multiple accelerated wear cycles over a rolling rail, where its lateral position
and yaw angle was dynamically adjusted to match lateral displacement and angles of attack that were
acquired from vehicle dynamics simulations of a vehicle operating on the Bakerloo line. This was
selected for its high number of tight radius curves which helped to maximise the severity of both flange
and tread contacts.
Following each test cycle, wheel profile and running surface observations were conducted. Based on
the analysis of these outputs, the following conclusions can be drawn:
• Higher levels of flange wear were observed on the restored wheel, decreasing the flange
thickness of the wheel compared to the R9 grade steel.
• As expected, tread wear was not as severe as flange wear with lesser difference between the
two wheels.
• Similar running bands were generated on both wheels, with the restored wheel having a
smoother / shiner appearance than the standard wheel.
• Increased levels of wear debris observed on the surface of the restored wheel. This may
potentially generate abrasive wear and have contributed to the higher wear rates.
• Short-wavelength irregularities were noticed following the Test Cycle 9 on both of the wheels.

• RCF damage was generated on the field side of the R9 grade wheel and the depth of the
damage was measured as 2.9 mm using MRX Surface Crack Measurement device at the end
of Test Cycle 16. Although a maximum damage depth of 4.5 mm into the wheel rim was
reported, no significant damage was visible on the surface of the restored wheel.
Nonetheless, it should be noted that in order to accelerate the wear generation during the testing
programme, special measures were taken such as increasing the maximum operating speeds and
implementing the crush loading condition only. In addition, the number and the severity of flange
contacts were also raised due to no check rail contact and while there are both track-side and on-
board (stick) lubricators were used on the Bakerloo line, the testing was conducted under dry
conditions. All these factors had an impact on the increased wear observed on the restored wheel.
Therefore, it may be expected that the observed high initial wear rate would be lower in practice and
the restored wheel would reach wear limits at a longer period of time.
Future research will continue to investigate these novel technologies in cladding and to test these
newly restored wheels on the HAROLD full-scale test rig.
Furthermore, the availability of the vehicle dynamics simulations results provided an opportunity to
conduct wheel wear predictions. The total predicted worn areas and depths were computed using the
widely applied BRR wear function and Archard’s wear models and the results were compared with the
measured wear for the R9 grade wheel.
• Both models provided reasonable predictions and the differences between the
measurements and predicted levels of wear were relatively small during the initial test cycles.
• However, while the high energy (creep forces) produced at the flange contact resulted in
greater levels of predicted wear, the small Tγ values at tread contacts produced lower wear
predictions than the measurements in both of the models.
• The steady state wear regime which was experienced after Test 9 due to work hardening had
an also effect on these differences between the measurements and predictions.

Therefore, while the accurate wear rate predictions can support to plan preventative turning intervals
and to verify depot scheduling, additional work is required such as prediction of creep forces should
be more accurate using vehicle dynamics simulations and wear coefficients in the modelling should
be calibrated particularly to use for R9 steel grade. It should be also noted that while the dry conditions
were considered in both model development and testing, third body layers (e.g; sand, lubricant,
water) have an influence on the wear rates. Hence, in order to apply wear modelling in reality, all
these factors should be taken into account.
Acknowledgement
The authors would like to thank the UK Research and Innovation and members of the AURORA project;
Lucchini Unipart Rail (lead), TWI, The Manufacturing Technology Centre, Transport for London, Key
Plant & Ultrasonic Sciences Limited [Project Number:102393].
REFERENCES
1. Boyacioglu P., Bevan A., &, Vickerstaff A. Prediction of RCF Damage on Underground Metro Lines. Am Soc Civ Eng. 2017;ICRT 2017:207–25.
2. Boyacioglu P., Bevan A., Vickerstaff A. Use of NDT inspection data to improve rail damage prediction models. In: IET Conference Publications, 2018.
3. Vickerstaff A., Bevan A., & Boyacioglu P. Predictive wheel–rail management in London Underground: Validation and verification. Proceedings of the Institution of Mechanical Engineers, Part F: Journal of Rail and Rapid Transit, 234(4), 393-404, 2020.
4. Boyacioglu P., & Bevan A. Prediction of rail damage using a combination of 5. Shakedown Map and wheel-rail contact energy. Wear, 460, 203457, 2020
5. Boyacioglu P. Prediction of Rail Damage on Underground-Metro Lines (Doctoral dissertation, University of Huddersfield), 2018
6. Greenwood-Engineering. Miniprof© user’s manual, 2010.
7. MRX. Rail Surface Crack Measurement Manual, 2011.
8. Li, Z. Squats on railway rails. In Wheel–rail interface handbook (pp. 409-436). Woodhead Publishing, 2009.
9. Bevan A. & Klecha S. Use of magnetic flux techniques to detect wheel tread damage [Internet]. Vol. 169, Proceedings of the Institution of Civil Engineers: Transport. p. 330–8, 2016.
10. Braghin F., Lewis R., Dwyer-Joyce RS, Bruni S. A mathematical model to predict railway wheel profile evolution due to wear. Wear, 2006.

11. Cantini S., Cervello S. The competitive role of wear and RCF: Full scale experimental assessment of artificial and natural defects in railway wheel treads. Wear, 2016.
12. Buckley-Johnstone L., Harmon M., Lewis R., Hardwick C., Stock R. Assessment of Friction Modifiers Performance using Two Different Laboratory Test-Rigs. In: Proceedings of the Third International Conference on Railway Technology: Research, Development and Maintenance, 2016.
13. McEwen I.J. & Harvey R.F.. Interpretation of Wheel/Rail Wear Numbers, 1986.
14. Pearce T.G. & Sherratt N.D. Prediction of wheel profile wear. In: Mechanics and Fatigue in Wheel/Rail Contact. Elsevier; p. 343–51, 1991.
15. Bolton P.J., Clayton P., McEwen I.J. Wear of Rail and Tire Steels Under Rolling/Sliding Conditions. ASLE Trans; 25(1):17–24, 1982.
16. Jendel T. Prediction of wheel profile wear - Comparisons with field measurements. Wear, 2002.
17. Harvey R.F. & McEwen I.J.. The Relationship Between Wear Number and Wheel/Rail Wear in the Laboratory and the Field, 1986.
18. Lewis R. & Olofsson U. Mapping rail wear regimes and transitions. Wear, 2004.
19. Lewis R., Magel E., Wang W.J., Olofsson U., Lewis S., Slatter T. Towards a standard approach for the wear testing of wheel and rail materials. Proc Inst Mech Eng Part F J Rail Rapid Transit, 2017.
20. Lewis R. & Dwyer-Joyce RS. Wear mechanisms and transitions in railway wheel steels. Proc Inst Mech Eng Part J J Eng Tribology, 2004.
21. Lewis R., Dwyer-Joyce R.S., Olofsson U., Pombo J., Ambrósio J., Pereira M. Mapping railway wheel material wear mechanisms and transitions. Proc Inst Mech Eng Part F J Rail Rapid Transit [Internet], 2010.
22. Kalker, J.J. A fast algorithm for the simplified theory of rolling contact. Vehicle system dynamics, 11(1), 1-13, 1982.
23. Dirks B. & Enblom, R., Prediction model for wheel profile wear and rolling contact fatigue. Wear, 271 (1-2),. 2011.