Embed Size (px)
Citation preview

Author's personal copy
Desalination 235 (2009) 58–87
0011-9164/09/$– See front matter © 2009 Published by Elsevier B.V.
*Corresponding author.
Towards sustainable seawater desalting in the Gulf area
M.A. Darwisha*, N.M. Al-Najema, N. Liorb
aMechanical Engineering Department, Kuwait University, KuwaitTel. +965 498-5789; Fax +965 484-7131; email: [email protected]
bDepartment of Mechanical Engineering and Applied Mechanics, University of Pennsylvania,Philadelphia, PA 19104-6315, USA
Received 26 November 2007; accepted revised 19 July 2008
Abstract
Gulf countries experienced rapid growth in the last four decades from oil production and its price increase.Natural water resources are very limited to meet this growth, and as result, desalted seawater in Kuwait became themain source of potable water, about 93% in 2002. The electric power and desalted water, produced in co-generationpower desalting plants (CPDP), consumptions are continuously increasing, almost doubled every 10 years, due topopulation and standard of living increases. This led to the consumption of huge amounts of fuel, draining thecountry main fuel (and income) resource, and negatively affecting the environment. One tenth of Kuwait’s oilproduction was consumed by the CPDP in 2003. If the trend of almost doubling the consumption every 10 yearsprevails, the total oil production may not be sufficient to desalt seawater for people to drink, and to produce powerto run space air conditioning units (a necessity for Kuwaiti harsh weather). It is essential therefore to look forenergy efficient ways to produce power and desalted water so as to save the nation’s income of these non-renewablefuel resources, to save the environment and indeed life itself in Kuwait, and this is the objective of this paper. Itreviews the presently used desalting methods and their energy demand, and the correctness of fuel allocationformulas for CPDP, to determine the most efficient methods to apply and the less efficient ones to avoid. Fourteendesalting cases are analyzed by using the current practice, with and without combination with power generationplants (using steam or gas or combined gas/steam turbines cycles). The specific fuel energy consumed and theemitted CO2, SOx, and NOx per m3 desalted water were calculated for each case. The results show that operatingthermally driven desalting systems by steam directly supplied from fuel-fired boilers is the most inefficient practice,and should be avoided. The use of the gas/steam turbine combined cycle, which is also the most efficient power-generation cycle, to drive seawater reverse osmosis (SWRO) desalination plants is the most efficient combination.Also, all conservation measures in utilization of both water and power should be applied. Reclamation of wastewater, at least for non-potable water needs must be promoted, because it consumes less energy and at cost muchlower than those of desalting seawater.
Keywords: Water desalination; Steam turbine power plants; Gas turbines power plants; Combined gas/steam powercycles; Dual purpose desalination plants; Energy consumption for water desalination; Sustainability;Air pollution; CO2 emissions
doi:10.1016/j.desal.2008.07.005

Author's personal copy
M.A. Darwish et al. / Desalination 235 (2009) 58–87 59
1. Introduction
Kuwait, like other Gulf countries, experiencedvery rapid growth in electric power and desaltedwater production in the last four decades due tothe evolution of oil production and its price in-crease. One may ask, is this growth sustainable?The most used definition for sustainability [1] isthe growth that meets the present generation needswithout compromising future generations’ abil-ity to meet their own needs. Daly [2] stated thatsustainability requires:1. The use rate of renewable resources (e.g.
groundwater) does not exceed the rate of theirregeneration.
2. The use rate of non-renewable resources (e.g.fossil fuel, mineral ores) does not exceed thedevelopment rate of sustainable substitutes.
3. The pollutants emission rate does not to ex-ceed the capacity of the environment to ab-sorb and render them harmless.
While most of the data used in this paper per-tain to Kuwait, the general situation and trends ofwater and energy use and of their impact on re-sources and the environment are very similar inmost of the Gulf countries. The renewable annualwater resource (ground water) in Kuwait is lessthan 100 m3/capita* (noting that annual 1000 m3/capita marks the water poverty line!), while theextraction (consumption) rate is more than 500 m3/capita/y [5]. Over-extraction depletes the groundwater and deteriorates its quality. While Kuwaithas large amounts of fossil fuel oil, which can beused for producing new water, that resource hasother major uses and is finite, with no practicalalternative for its substitution.
* Water replenishment in Kuwait comes from rain to theDammam limestone aquifers in the Um Ghadir fieldalong the border of Saudi Arabia, and a very small per-centage of the precipitation infiltrates into the ground-water in Kuwait [3,4]. The estimated renewable wateris 75m3/(capita·y) [5], but the current extraction is about510 m3/(capita·y).
Although full sustainability may not seem pos-sible for the time being, efficient power and wa-ter production, alongside with much more mod-est consumption, are essential to allow the presentresources to maintain the country’s developmentover a longer time period, i.e., to make it moresustainable.
In Kuwait, about 93% of potable water needwas secured by desalting seawater in 2002 [6].Table 1 gives the installed capacity of desaltingunits and desalted water consumption in the lastfour decades. The daily-consumed fresh water inl/capita increased from 137 in 1973 to almost 500in 2003, and the population increased from900,000 in 1983 to 2,540,000 in 2003, resultingin a 10-fold water consumption increased in Ku-wait during that 30-year period. This necessitatedthe production of large amounts of desalted sea-water with respectively large fuel consumptionfor it.
The annual population growth, including bothKuwaiti and non-Kuwait residents, is estimatedat 3.8%, which more than double of the worldaverage. Since water consumption obviouslywould increase with the population, it is notewor-thy that in 1994 about 63% of the total popula-tions were estimated to be non-Kuwaiti residents,pointing out that importation of foreign labor hasan important effect on increasing the nationalwater consumption.
Thermally operated desalting units usuallyobtain their heat input as steam supply; eitherextracted from steam turbines or from gas turbineexhaust heat recovery steam generators (HRSG)in combined cycle power generation systems(CC). Thus, the desalted water is produced gen-erally in cogeneration power desalting plants(CPDP) sometimes also called dual-purposeplants.
Some desalination experts (cf. [7]) tend to un-derestimate the impact of the fuel consumed fordesalting seawater on the environment, by con-sidering that thermal desalination in CPDP is mini-mally responsible for flue gases discharged to at-
Author's personal copy
60 M.A. Darwish et al. / Desalination 235 (2009) 58–87
mosphere as these discharges can be completelyallocated to the power production. However, 22%of the fuel consumed in Kuwaiti CPDP in 2003was used for desalting as shown further below.The fuel consumed for desalting depends on thedesalting method and the way energy is suppliedto desalters. Burning fuel for desalting increasesenvironment pollution by producing CO2, NOx,SOx, and other pollutants, with quantities directlyrelated to the amount of fuel consumed. So, de-salting clearly contributes to environmental pol-lution, including global warming. Increasing theefficiency of both power and desalted water pro-ductions thus lowers the impact of fuel combus-tion on the environment.
Tables 1 and 2 show that the consumed powerand desalted water in Kuwait are almost doubledevery 10 years. The oil production, (main sourceof income) was 1.983 million barrels/d (724 mil-
Table 1Installed desalting capacity and daily water consumption in Kuwait [6]
*1 IGD = 4.546 l/d; 1MIGD = 106 IGD = 4,546 m3/d
Year Installed capacity, MIGD*
Daily average consumption, MIGD
Daily per capita fresh water consumption, l/d (IGD)
1963 6.0 5.5 82.8 (18.2) 1973 52.0 25.5 137.4 (30.2) 1983 136.0 86.2 245.0 (53.8) 1993 216.0 136.3 403.0 (88.6) 2003 313.5 279.1 497.3 (109.3)
Table 2Electric power production and consumption in Kuwait [6]
Year Population Installed power capacity, MW
Million kWh Max MW Min MW Annual kWh/capita
Max load/capita kW
1953 30 1963 160 508 2,184 1973 900,965 1,096 4,183 4,643 1983 1,601,521 3,866 12,499 2,740 5,00 6,747 1.711 1993 1,537,714 6,898 20,178 4,120 9,80 11,162 2.679 2003 2,546,684 9,189 38,577 7,480 2,110 12,992 2.938
lion barrels/y) in 2002, and little more than onetenth of this oil production (75.92 million bar-rels) was used in the CPDP in 2003. Followingthe same doubling trend and assuming a constantoil production rate, 20% and 40% of Kuwait totaloil production (or total income) would be con-sumed by the CPDP in 2013 and 2023, respec-tively. Interpolating this trend (Fig. 1), in aboutthirty years the total oil production may not besufficient for providing drinking water (mainlydesalted water) and air-conditioning (using morethan 75% of electric power consumption) in Ku-wait for its population if the present power andwater consumption, and oil production, trendscontinue.
The water consumption in the years 1963,1973, 1983, 1993, and 2003 were (Table 1) 5.5,25.5, 86.2, 136.3, and 279.1 MIGD, respectively,an increase of 463.6% between 1963 and 1973,

Author's personal copy
M.A. Darwish et al. / Desalination 235 (2009) 58–87 61
238% between1973 and 1983, 58% between 1983and 1993, and 105% between 1993 and 2003.
The power consumption increase has paral-leled that of the water consumption: in 1963, 1973,1983, 1993, and 2003 it was (Table 2) 508, 4,183,12,499, 20,178, and 38,577 million kWh, respec-tively, an increase of 723% between 1963 and1973, 199% between1973 and 1983, 61% between1983 and 1993, and 91% between 1993 and 2003.
It is noteworthy that the power and water con-sumption almost more than doubles every 10 yearsexcept for the period between 1983 and 1993,when Iraq invaded Kuwait.
The 2004 Kuwait Ministry of Energy (ME)statistical book [6] reported that the consumed fuelenergy in 2003 by the Kuwaiti power stations is410,870 billion BTU (433,491 billion kJ). If onebarrel of oil produces 5.71 GJ heat, then the fuelconsumed is equivalent to 75.92 million barrels/y.In 2003, Kuwait’s oil production was 1.9825 mil-lion barrels/d or 724 million barrels/y, and theCPDP oil consumption is almost 10.4%. Whilecurrent predictions exist that the world oil maybe depleted in about 40 years at the current rateof consumption [8], and though no definitive prooffor that was given, there should serious concernabout oil production depletion even if the oil sup-ply may last much longer, and more efficient de-
Fig. 1. Percentage of expected fuel consumption by allsectors and by CPDP, and their percentage of total sus-tainable fuel oil production of 2.5 M-bbl/d, for Kuwait.
0
25
50
75
100
125
150
175
1990 2000 2010 2020 2030 2040 2050year
% o
f 2.5
M b
bl/d
% total consumed barrels.% consumed by CPDP2.5 M bbl/d level
salting system as well as more modest rates ofpower and water consumption should be consid-ered to save Kuwait’s income, non-renewable fuelresources, environment, and indeed life itself.
An example of one of the possible solutionsto the problem is the fact that the present Kuwaitipower plants’ average efficiency is below 38%,yet it can be improved in the future to 60% byemploying combined gas/steam turbine cycles(CC). Also, the multi stage flash (MSF) desaltingsystem consumes specific mechanical equivalentenergy (containing both pumping energy of about4 kWh/(m3 desalted water)*, and the heat sup-plied to both the brine heater and steam ejectors)in the range of 20 kWh/m3, but future use of re-verse osmosis desalting systems (with energy re-covery) can reduce this four-fold, to the range of5 kWh/m3.
Furthermore, as described in more detail be-low, dealing with water as a free resource givesno incentive to utilize it efficiently and promotesun-sustainability.
As a first step in looking for efficient use ofenergy, this paper is devoted to review the presentand possibly-used desalting methods and the wayfuel energy passes through to supply the energyneeds (either thermal, mechanical, or both) todesalters, and thereby to point out the most effi-cient systems to adopt, and the less efficient onesto avoid.
2. Fuel consumed by desalting seawater inKuwait in 2003
In 2003, the fuel energy consumed to produceelectric power and desalted water in Kuwait was433.5 million GJ (equivalent to 75.92 million bar-rels of crude oil based on 5.71 GJ energy contentof one barrel). 431 million m3 desalted water and35,577 million kWh electric power were produced[6]. The division of the used fuel between the pro-
* In this paper m3 always refers to the volume of de-salted water

Author's personal copy
62 M.A. Darwish et al. / Desalination 235 (2009) 58–87
duced power and desalination depends strongly on the allocation method (a general discussion is avail-able in [9]), and the energy efficiency definition (cf. [10]). It is the authors’ belief that the power genera-tion efficiency for dual purpose plants, ηp1, should be defined as
1net electric energy output + electric energy loss due to thermal energy input to desalters
energy of fuel consumed by the dual purpose plant steam generatorp (1)
This definition takes into account the fact that the desalination process consumes a lower quality (lowtemperature, pressure, and exergy) steam compared to that supplied by the steam generator of the CPDP.This gives an average power production efficiency ηp1 = 0.38, (heat rate = 9,473 kJ/kWh), and thus thefuel charged to power is 337 million GJ (59 million barrels), and to desalted water it is 96.5 million GJ(16.92 million barrels). So, the average fuel energy charged to produce 1 m3 of water is 224 MJ/m3 (canbe obtained by burning about 5 kg of fuel oil).
The estimated cost of fuel used to desalt seawater in 2003, based on $60/barrel, is 1015.2 milliondollars. Moreover, the consumed fuel in 2003 for power and water added 33,780 tons of CO2 to theenvironment.
It is interesting to compare these numbers with those published by the Kuwait Ministry of Energy(ME) report [6], in which the efficiency of power production is defined as
2power output
fuel energy consumed by the dual purpose plant steam generator thermal energy to desaltingp (2)
with reported ηp2 = 42%, 10.5% higher than ηp1 .This definition implicitly but erroneously assumesthat the desalination process is charged with fuelenergy equal to the heat supplied to the desalters,and charged the balance from the total fuel en-ergy input to the power process. In fact the fuelenergy is used to generate steam which is used inproducing both power from the turbine and ther-mal energy to the desalters. The logic of Eq. (1) isto find the equivalent work of the thermal energysupplied to the desalters, and added to the poweroutput to get the CPDP total output in terms ofwork. It is obvious (cf. [10]) that Eq.(1) is morerational to use than Eq. (2) which charges the de-salination process as if it is operated directly fromfuel fired boilers.
Using that definition, the cost of 433.491×10⁶
GJ (75.92 million barrels) was reported in [6] tobe 1,542.4 million dollars, or $20.32/barrel, whichis rather low relative to international oil marketprices of more than 60$/barrel.
3. A forecast and plan for action
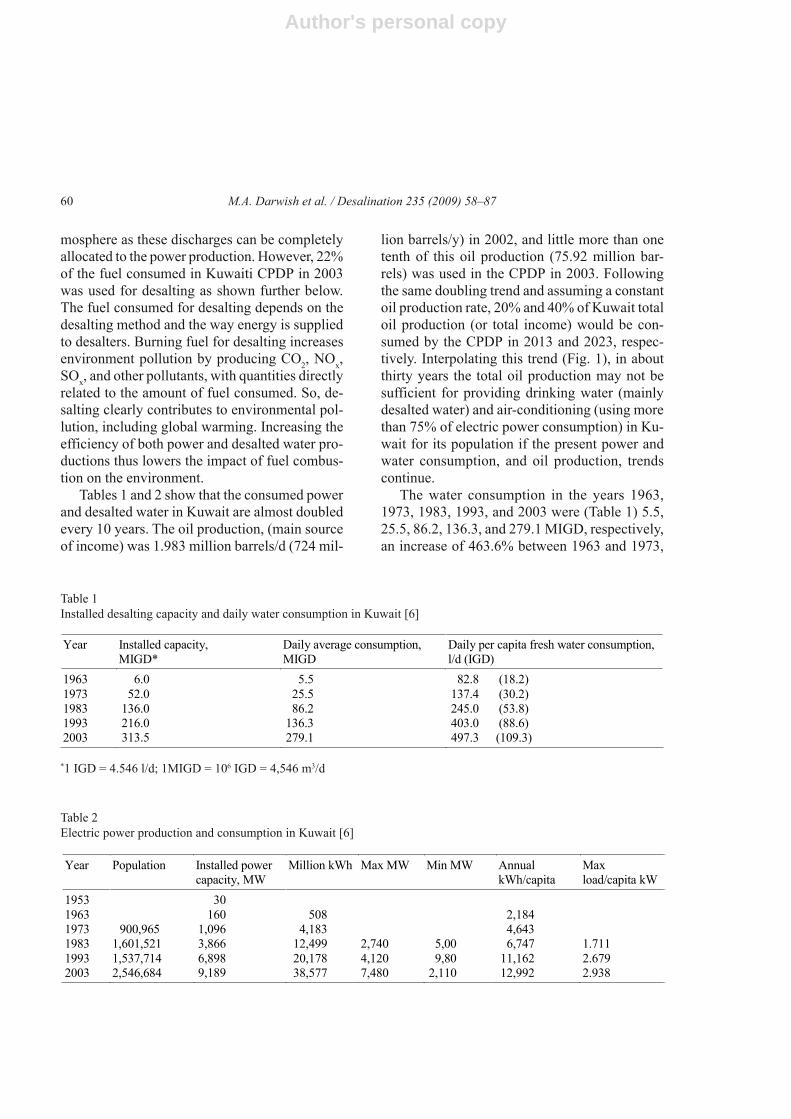
Observing past trends of energy consumptionin Kuwait, including the energy used for desali-nation, it is of great interest to foresee the abilityof Kuwait to supply its overall energy and desali-nation needs if those trends are not changed.Table 3 shows the energy consumption trends, byenergy sector, in the period 1995–2005, clearlydemonstrating exponential growth.
The estimated oil reserves suggest that the sus-tainable fuel oil production rate in Kuwait is2.5 M-bbl/d over a 100 years period. Based onthe last 10 years trend of the fuel consumption,the estimated future consumption is given in Fig. 1and Table 4. These show that the end fuel con-sumption will reach the whole oil production inthe year of 2037. Moreover the consumption bythe CPDP only can reach the end fuel productionrate by the year 2043. To preserve the ability ofthe next generations, and in fact even of the present
Author's personal copy
M.A. Darwish et al. / Desalination 235 (2009) 58–87 63
one, to sustain a satisfactory lifestyle, it is obvi-ous therefore that Kuwait, and most other Gulfcountries dependant on water desalination, mustrapidly start action to drastically reduce the rateof energy consumption in general and the demandfor energy consuming products, with water in par-ticular.
The remainder of this paper focuses on a com-parison of energy consumption and emissions offourteen prevailing desalination processes, topoint out their sustainability in view of this situa-tion and forecast.
4. Energy rating methods of desalting processes
The desalination industry uses a number ofdifferent energy performance criteria, which be-
Table 3Kuwait’s local consumption of energy in the main sectors (in thousands barrels) (The Kuwait Ministry of Energy (ME)website http://www.moo.gov.kw
1995 1996 1997 1998 1999 2000 2001 2002 2003 2004 2005 Electricity general sector
42,943 46,771 49,009 55,123 58,042 60,254 63,903 68,130 70,669 75,684 81,689
Oil sector 25,187 24,096 27,140 30,410 32,520 29,450 32,396 33,708 38,439 44,059 41,354 Transportation sector
16,004 16,693 17,422 17,781 18,113 18,182 18,953 20,174 21,974 23,703 25,382
Household sector
1,100 1,110 1,153 1,147 1,173 1,184 1,218 1,281 1,325 1,340 1,550
Total 85,234 88,670 94,724 104,461 109,848 109,070 116,470 123,293 132,407 144,786 149,975
Table 4Forecasted fuel consumption in thousands of barrels per year by all sectors and by CPDP, and their percentage of totalsustainable fuel oil production of 2.5 M-bbl/d for Kuwait (basic data from [6], further analysis by authors)
Total oil consumption (all sectors) Total oil consumption (CPDP sector) YearBarrels (in 1000s) Percentage of total oil
production Barrels (in 1000s) Percentage of total
oil production 1995 85,234 9.34 42,924 4.70 2005 149,945 16.43 81,689 8.95 2015 263,786 28.91 155,463 17.04 2025 464,056 50.86 295,863 32.42 2035 816,374 89.47 563,059 61.71 2045 1,436,179 157.39 1,071,562 117.43
sides preventing uniformity, also tend to misrep-resent rational evaluation, and especially fuel costallocation to the produced water when dual-pur-pose (power and water) plants are employed. Thegain ratio (GR) and the performance ratio (PR)are the two most commonly applied methods forrating thermal driven desalting systems, such asthe thermal vapor compression TVC, multi stageflash MSF, and multi effect boiling MED desalt-ing units.
The GR is the desalted water output (D) perkg of supplied heating steam (S) defined byGR = D/S. The GR does not consider the actualheat quantity given by each kg of used steam, Δh(the enthalpy difference across the desalinationplant heater), or the actual heat consumed by thedesalter. It is more logical is to calculate the heat

Author's personal copy
64 M.A. Darwish et al. / Desalination 235 (2009) 58–87
required Qd per unit mass of desalted water D,i.e., Qd/D, instead. This was taken into consider-ation by defining another energy rating param-eter, the performance ratio (PR), by changing theS used in the definition of GR to the associatedamount of heat Qd based on the standard value ofthe latent heat of evaporation of water, Δhref= 2,330 kJ/kg (for example, if the supplied steamenters as saturated vapor and leaves as saturatedliquid, at about 70°C, which is the average tem-perature of operating thermally driven desaltingsystem), and thereby PR is the desalted wateroutput D per kg of supplied steam that has thereference latent heat value Δhref = 2,330 kJ/kg,and then PR = GR.
Both the GR and PR are deficient in that theydo not take into consideration the pressure, tem-perature and quality of the specifically used steam,or the pumping energy consumed by the process.The real value of steam lies in its ability to pro-duce work (its exergy), which increases with bothtemperature and pressure. A modified perfor-mance ratio, PR′, which takes the real amount ofheat used by the plant, Qd = SΔh, defined by theactual enthalpy drop Δh of the steam in the brineheater would thus be PR′ = PRH (Δh/2330).
This distinction is especially important whenevaluating TVC units, which usually use highpressure (and exergy) steam (say at 10–20 bar)compared to the well known multi stage flash MSFand multi effect ME desalting system, and the GRor PR rating, which overlook this fact introducesa significant error.
Obviously the best way to evaluate the perfor-mance of any desalting system is to account forthe actual total fuel energy required (consumed)including the heat and work,, to desalt a unit massor volume of desalted water, (Qf / D), say in MJ/m3,kJ/kg, or kg fuel/m3 of desalted water, where thework is calculated in terms of the fuel needed togenerate it in say a power plant of 0.36 standardefficiency or by using its exergy value. The samelogic was used in a previous desalination sustain-ability indicators study [11]. The first indicator is
the resource fuel, defined by amount of fuel in kgper m3 of desalted water.
Other energy-related sustainability indicatorsinclude environmental ones, including the amountof polluting gases emitted during the combustionof the fuel needed for producing one m3 of de-salted water, such as kg CO2/m
3, kg SO2/m3, and
NOx/m3.
5. Water desalination in the Gulf area
The renewable water resources in manyMiddle East counties, especially the Arab Gulfcountries, are highly insufficient to satisfy theirwater needs, and desalination supplies the largeshortfall. Table 5 gives the renewable water re-source (mostly groundwater) and the percentageof its extraction (and thus consumption), total andper capita of installed desalting capacity for year2004. The capacity of the MSF and SWRO de-salting units installed in the last 10 years are givenfor countries, where desalted waters are used ex-tensively. The trend of shifting from completedependence on the MSF systems, to the more ef-ficient SWRO system is clear in the last decadeas shown in Table 6 [5].
6. Water consumption inflation
The fresh water consumption in Kuwait, ofmore than 500 l/capita/d (Table 1), is much higherthan even in the most developed countries in theworld. The potable water consumption per capitaper day in USA, Australia, and Canada is in therange of 250 l/capita/d; in Denmark and France isin the range of 180 l/capita/d, and in Germany, Bel-gium, and Portugal is in the range of 140 l/capita/d[12]. In these countries, the consumed water isrelated to the water price, which is $0.41/m3 inCanada, $0.5/m3 in USA, $1.17/m3 in France, and$1.81/m3 in Germany [12]. In Kuwait, the datafrom [6] shows that the amount of fresh waterconsumed in 2003 was 463.1×10⁶ m3, and the MEincome from selling that water was $75.816×10⁶,

Author's personal copy
M.A. Darwish et al. / Desalination 235 (2009) 58–87 65
which gives a price of $0.1637/m3. This is 2.5–11fold less than the cost in the above listed coun-tries, which are also by many orders of magni-tude more water-rich. This low price is a majorreason for the extremely high rate of water con-sumption in Kuwait and shows that water is ap-parently treated by some as a free common re-source with almost zero economic value. The un-der-valuation is in fact even much worse, becauseas mentioned above, the fuel energy consumedfor desalting is 224 MJ/m3, resulting in a fuel costfor desalination of $1.57/m3 produced fresh wa-ter when considering an oil price of $40/barrel
Table 5Renewable water resources in some Arab countries, 2004 [6]
Country Annual renewable source (m3/capita)
Annual extraction of renewable water (%)
Total installed desalination capacity (m3/d)
Desalination installed capacity/capita (l/capita)
% of the world MSF capacity
Bahrain 516,059 792.7 Egypt 923 97 303,915 4.7 Iraq 5,340 43 397,753 16.7 Jordan 314 32 328,507 65.3 Kuwait 100 510 2,181,026 1,067.0 12.0 Libya 111 767 859,514 158.9 Oman 892 24 334,879 136.6 Qatar 762,932 1,276.0 KSA 254 164 6,569,172 307.0 29.9 UAE 1,047 299 5,532,777 1,586.0 31.0
Table 6Capacities of seawater MSF and SWRO desalination unitsoperated in some Arab countries since 1994 [6]
Capacities (m3/d) Counties MSF SWRO
Bahrain 136,200 3,600 Kuwait 336,104 Libya 44,240 Oman 194,982 2400 Qatar 334,640 KSA 1,337,508 475,516 UAE 2,522,109 2,518,650
($7/GJ) and $3.14 for the current oil prices reach-ing $80/barrel. The fuel cost to produce 1 m3 ofdesalted water is $2.35 for a barrel cost of $60/barrel. If the total water cost is twice that of thefuel, then it is $4.71/m3, or 28 times the sellingprice of $0.1637/m3. Since the total cost of de-salted water includes the capital and other opera-tion expenses, the actual cost allocated to the watermay be at least two-fold higher. This would beabout twenty to thirty times higher than the pricecharged to the customers! Furthermore, the highamount of fuel consumed for producing powerand water leads to environmental damage anddegrades natural resources, all of which shouldbe also considered in the determination of the priceof the water, and may lead to unsustainable eco-nomic development.
The present water production rate in Kuwaitcan meet water needs for many years to come ifthe water is consumed wisely. Based on data fromdeveloped countries, the basic domestic waterneeds do not exceed 150 l/capita/d, less than onethird of the actual consumption rate in 2003. Whilewe note that it is vital to supply the basic needs ofwater to everyone, irrespective of their income, itis vital also to charge a proper price for any amountof water consumed beyond the basic needs, to help

Author's personal copy
66 M.A. Darwish et al. / Desalination 235 (2009) 58–87
curb the wasteful use of water, and its associatenegative impacts on fuel reserves and on the en-vironment. This means that subsidies should befocused and limited to average people’s basicneeds. Limiting quantities to basic needs help inavoiding the typical rebound effect, where gainsfrom efficient water production may easily beoffset by increasing of consumption and waste.
In the present work, the specific fuel energyconsumed and the amounts of emitted CO2, SOx,and NOx per m3 of desalted water are calculatedfor fourteen different cases. Also, the amount ofdesalted water produced in each case for the sameamount of reference fuel consumed rate (used inCase 1) is calculated.
7. Case studies
In view of the sometimes-subtle differencesbetween different performance evaluation and fuelallocation methods, which can lead to very dif-ferent results as mentioned above, we present ourcase study calculations in a very explicit way toavoid any misunderstandings.
To estimate the rate of CO2 emissions, the ra-tio of carbon in the fuel is assumed equal to be0.85 kg/kg of fuel, and burning 1 kg of fuel thusproduces (0.85×44/12=) 3.1167 kg of CO2/(kgfuel).
Similarly the ratio of sulfur in the fuel is as-sumed equal to 0.012 kg/kg of fuel, and burning1 kg of fuel thus produces (0.012×64/32=) 0.024kg of SO2/(kg fuel).
In estimating the NOx emissions, it is assumedthat the plant meets the allowable emission levelin the US, which is 0.258 (kg NOx)/GJ heat out-put [13].
7.1. Case 1: Fuel fired boiler driving a thermalvapor compression desalting TVC system.
There are about 127 thermal vapor compres-sion desalting system (TVC) units [5] having analmost 200 MIGD installed capacity in the MiddleEast Arab countries and Iran. These units are in
general operated with steam supplied directly fromfuel fired boilers, having low top brine tempera-ture in the range of 65°C and using falling filmhorizontal tube evaporators. Most of these unitswere put in service in the last decade. The onlyreported units that use steam extracted from tur-bines are those in Um-Al-Nar and Al-Taweela inUAE [14]. Steam supplied to Al-Taweela units isexhausted from a backpressure turbine at 2.8 bar.In winter, when fewer turbines are in operationand available to supply steam, these desalinationplants are directly supplied from the power plant’ssteam generator through a high pressure (HP) re-ducing station. Fig. 2 shows a schematic diagramof a TVC unit. It consists of multi-evaporators,steam ejector (thermal compressor TC), and endcondenser. The four TVC units at Jebel Dehnna,UAE [5] shown in Fig. 2, is Case 1 of this study.
In the analysis of this Case 1, and of the fol-lowing Case 2, in both of which steam is suppliedto the desalting unit(s) directly from the boiler,the following are assumed:
The heat supplied to the desalting unit(s), Qd,is equal to the boiler heat output Qb, and is equalto the steam mass flow rate Sd multiplied by thedifference between the enthalpy at the inlet hdi andthat at the exit hde, i.e.
d b d di deQ Q S h h
The gain ratio, GR, is defined by the ratio ofthe desalted water output D divided by Sd
GRd
DS
The fuel energy, Qfd, supplied to the boiler toproduce Qb, and qfd, the Qfd per unit desalted wa-ter, are, respectively
/ LHVfd b b fQ Q m
/ /fd fd b bq Q D Q D
where mf is the fuel mass supply to the boiler, andLHV is the low heating value of the fuel (heatgenerated by the combustion of 1 kg of fuel, when

Author's personal copy
M.A. Darwish et al. / Desalination 235 (2009) 58–87 67
Fig. 2. Multi-effect thermal vapor compression (TVC) desalting system (Case 1).
the water in the combustion is in vapor form), andqfd is the specific heat per unit distillate due toheat supplied to the desalting units. LHV is con-sidered in the following calculations equal to40 MJ/kg fuel.
Each desalting system consumes pumping en-ergy Wp to move its streams, and the specificpumping energy per kg of desalted water is ex-pressed by Wp/D. To produce the pumping energyfrom a power plant of thermal efficiency ηc, thespecific fuel energy consumed to produce thepumping energy qfp = (Wp/D)/ηc.
The specific fuel energy for the heat and pump-ing energy is thus qf = qfd + qfp.
The fuel energy cost per m3 desalted water canbe calculated by considering the fuel oil cost perbarrel is $60/barrel (or $10.52 per GJ).
The fuel energy can be transferred to mechani-cal work in a power plant having efficiency ηc,and thus the fuel energy Qf has equivalent me-chanical work capability = ηcQf .
If the specific fuel energy Qf/D is given inMJ/m3, then the CO2 produced by producing 1 m3
of desalted water = (Qf/D)×3.1167/40(MJ/kg fuel)= 0.078 (Qf/D) kg CO2/m3
The SO2 emitted by producing 1 m3 desaltedwater is thus (Qf/D)×0.024/40 = 0.0006 (Qf/D) kgSO2/m3
In Case 1, the total desalted water output DT =7,180 m3/d (314.6 kg/s or 5.98 MIGD), and thegain ratio GR = 9.
This gives:
Sd = 34.956 kg/s.
Sd is supplied to the TVC units as saturated steamof 10 bar, and enthalpy hdi = 2,778.1 kJ/kg, andleaves as saturated liquid of T = 65°C, and en-thalpy hde = 272.06 kJ/kg, then:
87.6 / 0.9 97.33 MWfdQ
97,333/ 309.39 kJ/kg314.6fd fdQ D q
The estimated specific pumping energy to the
34.956(2,778 272.06) 87,600 kW = 78.6 MW
dQ

Author's personal copy
68 M.A. Darwish et al. / Desalination 235 (2009) 58–87
TVC, Wp/D = 2 kWh/m3 (7.2 kJ/kg), and qfp = 7.2/0.36 = 20 kJ/kg.
The total specific fuel energy (Qf / D)T =qf = 20+309.4 = 329.4 kJ/kg = 329.4 MJ/m3, (forboth heat and pumping energy added), and thetotal fuel energy for the specified water produc-tion rate is thus
Qf = 329.4×314.6/1000 = 103.626 MW.
Assuming a power plant of thermal efficiencyηc = 0.36, the work equivalent of this Qf is equalto 103.626×0.36 = 37.3 MW, and the equivalentwork of the specific fuel energy qfd = Qf/D is equalto 329.4×0.36 = 118.8 kJ/g = 32.94 kWh/m3.
The fuel energy cost per m3 desalted waterproduced by this TVC, based on $60/barrel (or$10.526 per GJ) = 10.526×329.4/1000 = $3.467/m3.
The CO2 production/m3 = 0.078 × 329.4= 25.69 kg CO2/m
3.
The SO2 production/m3 = 0.0006 × 329.4= 0.2 kg SO2/m
3
The emitted NOx is 0.3294 × 0.258 = 0.094 kgNOx/m
3.
Fig. 3. Multi-stage flash MSF desalting system.
The amount of fuel energy used in this Case 1(Qf)T = 103.6265 MW will be used in the rest ofthis paper as a reference rate of fuel energy inputto compare the amount of desalted water that canbe obtained from the same fuel energy input bythe different studied cases.
7.2. Case 2: Fuel fired boiler driving a multi stageflash MSF desalting system
The multi-stage flash (MSF) is the main de-salting method used in the Gulf area. Most of theexisting MSF units are supplied with steam ex-tracted from steam turbines. When no operatingturbines (or no turbines at all) exist, steam is sup-plied directly from boiler through reducing pres-sure station. In the Shuwaik desalting plant inKuwait, there are 3 MSF units operated with steamsupplied directly from three fuel-fired boilers(Fig. 3), and this is considered here as Case 2.
The data given for this case are:
D = 342 kg/s (6.5 MIGD)
The gain ratio GR = D/Sd = 9.
Author's personal copy
M.A. Darwish et al. / Desalination 235 (2009) 58–87 69
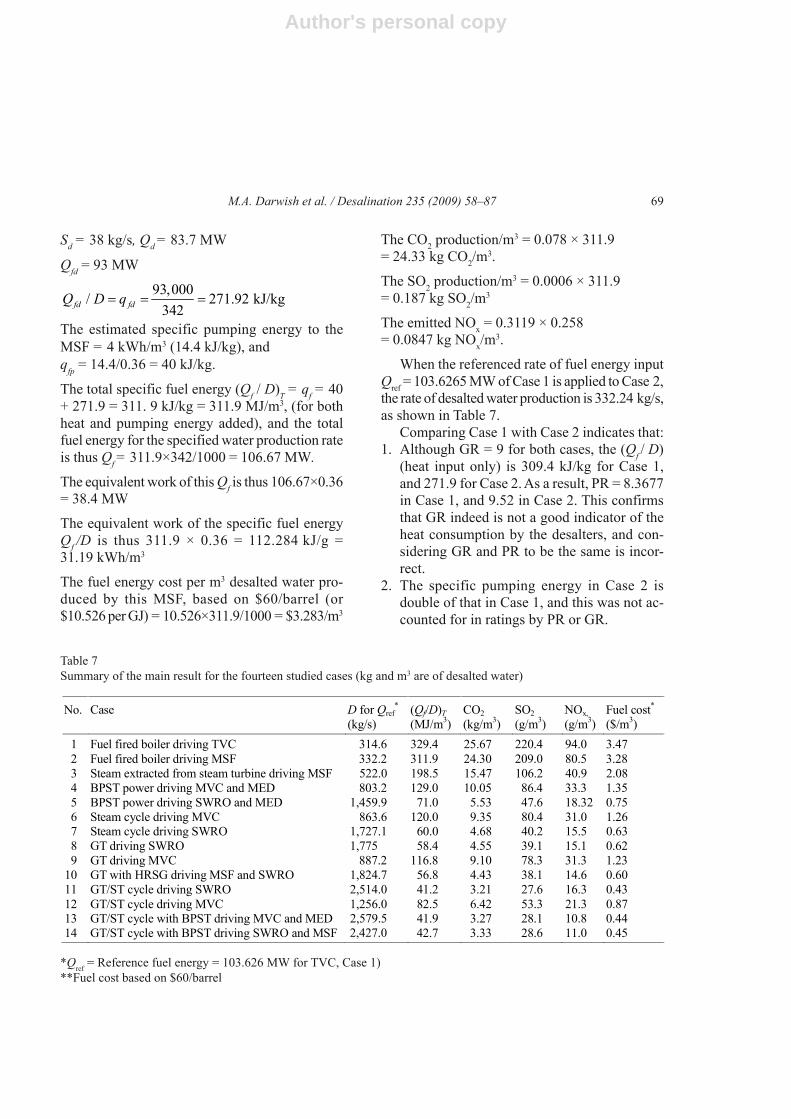
Sd = 38 kg/s, Qd = 83.7 MW
Qfd = 93 MW
93,000/ 271.92 kJ/kg342fd fdQ D q
The estimated specific pumping energy to theMSF = 4 kWh/m3 (14.4 kJ/kg), andqfp = 14.4/0.36 = 40 kJ/kg.
The total specific fuel energy (Qf / D)T = qf = 40+ 271.9 = 311. 9 kJ/kg = 311.9 MJ/m3, (for bothheat and pumping energy added), and the totalfuel energy for the specified water production rateis thus Qf = 311.9×342/1000 = 106.67 MW.
The equivalent work of this Qf is thus 106.67×0.36= 38.4 MW
The equivalent work of the specific fuel energyQf /D is thus 311.9 × 0.36 = 112.284 kJ/g =31.19 kWh/m3
The fuel energy cost per m3 desalted water pro-duced by this MSF, based on $60/barrel (or$10.526 per GJ) = 10.526×311.9/1000 = $3.283/m3
The CO2 production/m3 = 0.078 × 311.9 = 24.33 kg CO2/m
3.
The SO2 production/m3 = 0.0006 × 311.9 = 0.187 kg SO2/m
3
The emitted NOx = 0.3119 × 0.258 = 0.0847 kg NOx/m
3.
When the referenced rate of fuel energy inputQref = 103.6265 MW of Case 1 is applied to Case 2,the rate of desalted water production is 332.24 kg/s,as shown in Table 7.
Comparing Case 1 with Case 2 indicates that:1. Although GR = 9 for both cases, the (Qf / D)
(heat input only) is 309.4 kJ/kg for Case 1,and 271.9 for Case 2. As a result, PR = 8.3677in Case 1, and 9.52 in Case 2. This confirmsthat GR indeed is not a good indicator of theheat consumption by the desalters, and con-sidering GR and PR to be the same is incor-rect.
2. The specific pumping energy in Case 2 isdouble of that in Case 1, and this was not ac-counted for in ratings by PR or GR.
Table 7Summary of the main result for the fourteen studied cases (kg and m3 are of desalted water)
*Qref = Reference fuel energy = 103.626 MW for TVC, Case 1)**Fuel cost based on $60/barrel
No. Case D for Qref*
(kg/s) (Qf/D)T(MJ/m3)
CO2(kg/m3)
SO2(g/m3)
NOx, (g/m3)
Fuel cost*
($/m3)1 Fuel fired boiler driving TVC 314.6 329.4 25.67 220.4 94.0 3.47 2 Fuel fired boiler driving MSF 332.2 311.9 24.30 209.0 80.5 3.28 3 Steam extracted from steam turbine driving MSF 522.0 198.5 15.47 106.2 40.9 2.08 4 BPST power driving MVC and MED 803.2 129.0 10.05 86.4 33.3 1.35 5 BPST power driving SWRO and MED 1,459.9 71.0 5.53 47.6 18.32 0.75 6 Steam cycle driving MVC 863.6 120.0 9.35 80.4 31.0 1.26 7 Steam cycle driving SWRO 1,727.1 60.0 4.68 40.2 15.5 0.63 8 GT driving SWRO 1,775 58.4 4.55 39.1 15.1 0.62 9 GT driving MVC 887.2 116.8 9.10 78.3 31.3 1.23
10 GT with HRSG driving MSF and SWRO 1,824.7 56.8 4.43 38.1 14.6 0.60 11 GT/ST cycle driving SWRO 2,514.0 41.2 3.21 27.6 16.3 0.43 12 GT/ST cycle driving MVC 1,256.0 82.5 6.42 53.3 21.3 0.87 13 GT/ST cycle with BPST driving MVC and MED 2,579.5 41.9 3.27 28.1 10.8 0.44 14 GT/ST cycle with BPST driving SWRO and MSF 2,427.0 42.7 3.33 28.6 11.0 0.45

Author's personal copy
70 M.A. Darwish et al. / Desalination 235 (2009) 58–87
3. Fuel of high exergy was used to generate lowexergy steam in fuel fired boilers for directsupply to the MSF at about 3 bar, or to TVC at10–20 bar. This is an inefficient way of usingfuel, as also demonstrated in the next Case 3.
7.3. Case 3: Cogeneration power desalting plant(CPDP) using condensing–extraction steam tur-bine (CEST) to drive MSF desalination unit(s)
As stated above, the use of the high exergyfuel to generate low exergy steam (as done inCases 1 and 2) is wasteful process from the ther-modynamics viewpoint. It is always better to firstreduce the high exergy of the fuel through powerproduction to the exergy level of the steam neededfor desalination. This is done by first generatingsteam at high temperature and pressure (as re-quired for modern steam power plants), expand-ing it in steam turbines to produce work, and thenusing the turbine extraction or exhaust steam asthe heat supply to the desalting plants. A plant,where steam produces both power (work) anddesalted water is known as a co-generation powerdesalting plant (CPDP), or dual purpose plant. Themain merit of the CPDP is saving fuel as com-pared to two separate plants, one for water de-salination and the other for power.
CPDP using steam turbines and MSF desalt-ing units are extensively used in the Gulf area.The steam turbines are either of the condensingsteam turbine (CST) or backpressure steam tur-bine (BPST) type. Each turbine is combined withone or more MSF units. The steam supply to theMSF unit(s) is extracted from a CST (Fig. 4) orexhausted from a BPST. Examples of some CPDPusing steam turbines and MSF units in the Gulfarea are given in [15]. A typical plant in Kuwait isused here as Case 3. Steam is generated at highpressure around 150 bar and temperature 538°C.The 150 bar pressure is high enough for drivingan efficient steam power plant cycle, and lowenough for using natural circulation steam gen-erators. The 538°C temperature is the highest al-
Fig. 4. Condensing–extraction steam turbine (CEST) pro-ducing power and driving a MSF desalting.
IP LP
8
9 1011
MSF
G
lowable for fuel oil with sulfuric content. TheCPDP plant, shown in Fig. 4 uses a steam genera-tor, a CST steam turbine, and two MSF desaltingunits. The use of CST in CPDP gives more opera-tion flexibility than back pressure steam turbine.The given plant with CST can produce power atdifferent loads from 75 MW to 300 MW, withand without steam extracted to the MSF desalt-ing unit. In other words, it can work as an SPP(separate power plant) producing 300 MW downto 75 MW electric power; or as CPDP producing300 MW down to 75 MW, while supplying heatof 196 MW to two MSF desalting units.
The desalted output is 757.7 kg/s (14.4 MIGD).The thermal energy supplied for the desalinationis 196 MW, having a specific heat demand qfd =(Qf / D) = 258 kJ/(kg desalted water).
Steam is extracted to the desalting unit(s) atrate of 77.22 kg/s from the cross-pipe betweenthe IP and LP (intermediate and low pressures)cylinders. If this extracted steam was expandedin the LP turbine to the condenser, instead of be-ing extracted for desalting, it would have producemore work. This work is considered as turbinework loss due to steam extraction, and its heatequivalent is used in this study as the heat supplyto the MSF units. The data for the LP turbine inthe referenced plant is given in Table 8. The massflow rate to the LP turbine is 133.35 kg/s, its poweroutput is 74.66 MW, and thus the specific powerproduction is 560 kW/(kg/s steam). Thus, the lost

Author's personal copy
M.A. Darwish et al. / Desalination 235 (2009) 58–87 71
work due to the extraction of steam before the LPturbine= 77.22(kg/s)×560(kW/(kg/s) = 43.234 MW.
Considering that the steam has the same en-thalpy at the inlets to the LP turbine and desalters,h8 = 2,961 kJ/kg, and leaves the desalters as con-densate at 100°C, hf = 419 kJ/kg, the heat sup-plied to the desalters = 77.22(kg/s) ×(2961 – 419)(kJ/kg) = 196.29 MW. In other words, the 77.22 kg/ssteam having the energy content of 196.29 MW,used for desalination, could have been used in theLP turbine to produce the above-calculated43.432 MW power. By being introduced into theMSF units instead, the associated specific (per unitproduced water) equivalent work is 57.06 kJ/(kgdesalted water) (i.e. 15.85 kWh/m3) and the asso-ciated specific fuel energy input (Qf / D), againassuming that ηpp = 0.36, is 158.5 kJ/kg. Whenspecific energy for pumping, 14.4 kJ/kg (4 kWh/m3),is added, the total specific work is 71.46 kJ/(kgdesalted water), (19.85 kWh/m3), the total spe-cific fuel energy (Qf / D)T becomes 198.5 MJ/m3.So, the rate of fuel energy used to produce 756.7(kg desalted water)/s is 150.4 MW. The referencedfuel energy rate Qref would produce 522.05 kg/s(9.91 MIGD) of desalted water by this arrange-ment. The fuel cost is $2.085/(m3 desalted wa-ter), based on $60/bbl.
Based on these values, the CO2 produced is15.47 (kg CO2)/m
3.The amount of emitted SO2 is 0.1062 (kg SO2)/
m3, and the emitted NOx is 0.0409 (kg NOx)/m3.
The results for Case 3 are given in Table 7.Compared with Cases 1 and 2, the Case 3 systemsaves more than 50% in the total specific fuel
Table 9Minimum and maximum demand, and installed, water-to-power ratio in some Gulf countries [8]
Country Min. W/P ratio (m3/d)/MW
Max. W/P ratio (m3/d)/MW
Installed W/P ratio (m3/d)/MW
Kuwait 142 837 175 Bahrain 350 1,580 570 UAE 320 1,170 347
consumption (Qf / D)T. We note though that theCPDP are designed and built to produce water atan almost constant rate, while the produced powerchanges according to load, from 27% to full tur-bine rated capacity. Table 9 shows the ratios ofinstalled, minimum, and maximum water to powerdemands in some Gulf countries [15]. Since therate of water demand increase is higher than thatof power demand, water plants that produces wa-ter only, or plants in which the water productionis not related to the power production rate, as givenin the next cases, are needed in most Gulf area.
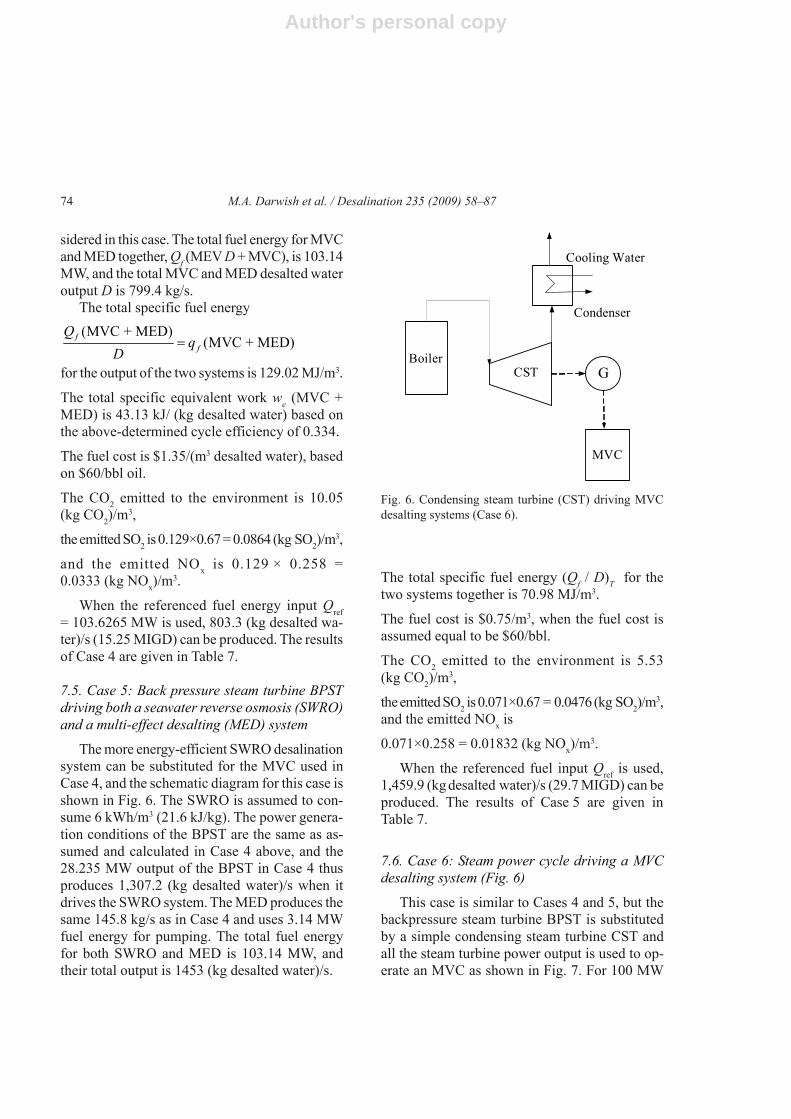
7.4. Case 4: Water-only desalination plants us-ing BPST power to drive both a mechanical va-por compression MVC desalting plant, and, us-ing its exhaust steam heat, a multi effect desalt-ing MED systems (Fig. 5)
In this case, steam from a boiler is supplied toa BPST, with a discharge pressure usually higherthan that of the condenser pressure of a conven-tional condensing turbine. The power output of
Table 8Data for the LP turbine (Case 3)
Mass M (kg/s) Enthalpy (kJ/kg) Mass in LP cylinder M8 = 133.35 H8 = 2,940 Steam extracted to feed heater at point 9 M9 = 7.39 H9 = 2,769 Steam extracted to feed heater at point 10 M10 = 11.13 H10 = 2,608 Steam flow to condenser at point 11 M11 = 114.83 H11 = 2,333

Author's personal copy
72 M.A. Darwish et al. / Desalination 235 (2009) 58–87
Fig. 5. Back pressure steam turbine (BPST) using itspower output to drive mechanical vapor compressionMVC desalting plant, and, using its exhaust steam heatto drive multi effect desalting MED systems (Case 4).
the turbine is used to drive the compressor ofmechanical vapor compression MVC desaltingunit either directly or through its electric poweroutput. In addition, the steam discharged from theturbine at low pressure of 35 kPa is supplied, asthe heat source, to the first effect of a multi effectdesalting MED system. This case is similar to adesalting system installed on a barge [16] usingthe same type of MVC and MED desalters sys-tems but at different conditions.
As given before, the steam enters the BPST at4 MPa and 538 oC, and enthalpy hs = 3,532.7 kJ/kg,and expands in the turbine to 35 kPa, quality of0.95, and enthalpy he = 2,519 kJ/kg, when it isdischarged from the turbine to the MED desalt-ing unit. The steam leaves the MED as conden-sate (saturated liquid at P = 35 kPa, and hf = 303.4kJ/kg), and is directed to the boiler through a de-aerator.
For 100 MW fuel energy supplied to a boilerof 90% efficiency, the boiler heat output
Qb = 90 MW, and
90,000
3534.2 303.4b s s f
s
Q m h h
m
where ms is the steam flow rate from the boiler, hs= 3532.7 kJ/kg is the enthalpy of the steam at theboiler outlet, and hf = 303.4 kJ/kg is the feed wa-ter enthalpy to the boiler.
This gives ms = 27.87 kg/s as the boiler steammass flow rate for that 100 MW fuel heat input tothe boiler.
If the steam leaving the boiler is supplied to acondensing turbine of 90% isentropic efficiency,and expanded to the condenser pressure at Pc =6.3 kPa, the steam enthalpy at the condenser inlethc = 2,333 kJ/kg, the work output, Wc, of this con-densing turbine, thus is
27.87 3532.7 2333 /1000 34.436 MWc s s cW m h h
This gives the efficiency of the condensingturbine cycle as
34.436 0.344100
cc
f
WQ
In the BPST considered here and in Case 5,the steam enters the turbine at hs =3,532.7 kJ/kg,and is discharged at the conditions required by atthe MED of P = 0.35 kP, he = 2,519 kJ/kg, and itswork output is thus
(BPST)27.87(3532.7 2519) / 1000 28.235 MW
s s eW m h h
The BPST work output driving the mechani-cally operated MVC is charged to the desaltedwater produced by the MVC system, while thework of the condensing turbine Wc = 34.346 MWis charged to the two desalting systems. The heatis supplied to the MED by the steam dischargedfrom the turbine, and this is similar to the steamextracted from the CEST to the MSF units inCase 3. The real value of this steam is its abilityto produce work if it has been expanded in a tur-bine to the condensing pressure. This is consid-

Author's personal copy
M.A. Darwish et al. / Desalination 235 (2009) 58–87 73
ered as work loss from the turbine due the extrac-tion (or the discharge) of steam before complet-ing its expansion to the condenser condition. Thiswork loss (or work equivalent We) is charged tothe desalted water produced by the MED in Case 4,and by the MSF in Case 3.
This is different than the case when the steamis supplied to the desalting units directly from aboiler (as in Cases 1 and 2), in which the equiva-lent work was calculated simply by a multiplyingthe fuel energy Qf used to produce Qd (heat sup-plied to the desalting unit) in a boiler of efficiencyηb, which is equal to Qf = Qd/ηb,by a typical powercycle efficiency ηc. The equivalent work whenthe steam is supplied to the desalting units directlyfrom the boiler system is thus ηc Qf /ηb.
Consequently, the equivalent work to becharged to the MED unit is equal to the condens-ing turbine work output minus the BPST workoutput = (34.436 – 28.235) = 5.192 MW.
Based on the above, the fuel energy chargedto the MVC unit is
(BPST) 28.235(MVC) = 10034.436
84.486 MW
f fc
WQ QW
The fuel energy charged to the MED, Qf(MED) = 100 – 84.486 = 15.532 MW
Typical specific work consumed by the MVCsystem is 36 kJ/kg (10 kWh/m3) by the compres-sor, and 7.2 kJ/kg (2 kWh/m3) by the pumps, andthe specific work consumed by the MVC = 36 +7.2 = 43.2 kJ/kg.
So the MVC desalted water output by theBPST work of 28.235 MW is equal to:
28,235(MVC) 653.6 kg/s(36 7.2)
D
and the MVC specific fuel energy= Qf (MVC)/D(MVC) = 84,486/653.6= 129.26 kJ/kg
For the MED, the performance ratio PR is usu-ally less than, but close to, the number of effects.
A typical 6-effect plant operating in the Gulf hasa performance ratio PR = 5.5.
It is noticed here again that there is a differ-ence between the gain ratio
Distillate output (MED)GR =Steam supply s
Dm
and the performance ratio PR defined by
2330 2330PR =/ (MED) ( ) / (MED)(2330) 2330 GR( ) ( )
d s e f
s e f e f
Q D m h h DD
m h h h h
The heat Qd supplied to the MED is equal to:
27.87(2519 303.4)
61,757 kWd s e fQ m h h
ms is the steam mass flow rate to the MED (equalto that through the boiler and the turbine), and itsenthalpy he = 2,519 kJ/kg, (equal to that leavingthe BPST), and hf = 303.4 kJ/kg is the condensateenthalpy leaving the MED (equal to that suppliedto the boiler).
For the assumed PR = 5.5,
(2519 303.4)GR = PR 5.232330 2330e fh h
and then the MED water product D (MED)= ms×GR = 27.87×5.23 = 45.8 kg/s.
Since the equivalent work charged to the MEDis 5.192 MW due to the heat supplied to the MED,then the specific work done due to the heat sup-ply is Qd = 5192/145.8 = 35.6 kJ/kg. The specificpumping energy for the MED is 7.2 kJ/kg, andtotal pumping energy = 7.2×145.8 = 1,050 kW,and its corresponding fuel energy is 1,050/ηc =3,140 kW. Consequently, the total specific me-chanical work is we(MED) = 35.61 + 7.2= 42.81 kJ/kg, and the specific fuel energy for theMED = we(MED/ηc = 42.81/0.344 = 128.1 kJ/kg,where ηc is the condensing cycle efficiency con-
Author's personal copy
74 M.A. Darwish et al. / Desalination 235 (2009) 58–87
sidered in this case. The total fuel energy for MVCand MED together, Qf (MEV D + MVC), is 103.14MW, and the total MVC and MED desalted wateroutput D is 799.4 kg/s.
The total specific fuel energy(MVC + MED)
(MVC + MED)ff
Dfor the output of the two systems is 129.02 MJ/m3.
The total specific equivalent work we (MVC +MED) is 43.13 kJ/ (kg desalted water) based onthe above-determined cycle efficiency of 0.334.
The fuel cost is $1.35/(m3 desalted water), basedon $60/bbl oil.
The CO2 emitted to the environment is 10.05(kg CO2)/m
3,
the emitted SO2 is 0.129×0.67 = 0.0864 (kg SO2)/m3,
and the emitted NOx is 0.129 × 0.258 =0.0333 (kg NOx)/m
3.
When the referenced fuel energy input Qref= 103.6265 MW is used, 803.3 (kg desalted wa-ter)/s (15.25 MIGD) can be produced. The resultsof Case 4 are given in Table 7.
7.5. Case 5: Back pressure steam turbine BPSTdriving both a seawater reverse osmosis (SWRO)and a multi-effect desalting (MED) system
The more energy-efficient SWRO desalinationsystem can be substituted for the MVC used inCase 4, and the schematic diagram for this case isshown in Fig. 6. The SWRO is assumed to con-sume 6 kWh/m3 (21.6 kJ/kg). The power genera-tion conditions of the BPST are the same as as-sumed and calculated in Case 4 above, and the28.235 MW output of the BPST in Case 4 thusproduces 1,307.2 (kg desalted water)/s when itdrives the SWRO system. The MED produces thesame 145.8 kg/s as in Case 4 and uses 3.14 MWfuel energy for pumping. The total fuel energyfor both SWRO and MED is 103.14 MW, andtheir total output is 1453 (kg desalted water)/s.
Fig. 6. Condensing steam turbine (CST) driving MVCdesalting systems (Case 6).
CST
MVC
GBoiler
Cooling Water
Condenser
The total specific fuel energy (Qf / D)T for thetwo systems together is 70.98 MJ/m3.
The fuel cost is $0.75/m3, when the fuel cost isassumed equal to be $60/bbl.
The CO2 emitted to the environment is 5.53(kg CO2)/m
3,
the emitted SO2 is 0.071×0.67 = 0.0476 (kg SO2)/m3,
and the emitted NOx is
0.071×0.258 = 0.01832 (kg NOx)/m3.
When the referenced fuel input Qref is used,1,459.9 (kg desalted water)/s (29.7 MIGD) can beproduced. The results of Case 5 are given inTable 7.
7.6. Case 6: Steam power cycle driving a MVCdesalting system (Fig. 6)
This case is similar to Cases 4 and 5, but thebackpressure steam turbine BPST is substitutedby a simple condensing steam turbine CST andall the steam turbine power output is used to op-erate an MVC as shown in Fig. 7. For 100 MW

Author's personal copy
M.A. Darwish et al. / Desalination 235 (2009) 58–87 75
fuel energy input to a steam generator of a powerplant of net efficiency ηc = 0.36, the total poweroutput is 36 MW. When all this power output isused to operate the mechanically driven MVC,the 100 MW fuel energy is charged to the desaltedwater output by this desalting method. This isequivalent to power output of 36,000 kW).
As given before, the MVC specific work con-sumption is: 10 kWh/m3 for the compressors,2 kWh/m3 for the pumps, and thus the total spe-cific work is 12 kWh/m3 (43.2 kJ/kg).
For 100 MW fuel energy input to the powerplant and total power output of 36 MW, the de-salted water output D(MVC) = 36,000 / 43.2= 833.33 (kg desalted water)/s. The total specificfuel energy input (Qf / D)T = 100,000 / 833.33 =120 kJ/kg or MJ/m3.
The fuel cost based on $60/bbl and 5.7 GJ heat/bbl= (60 / 5.7) × (120 / 1000) = $1.263/m3.
The CO2 emitted to the environment is (9.35 kgCO2)/m
3,
the emitted SO2 is 0.12×0.67 = 0.0804 (kg SO2)/m3,
and
the emitted NOx is 0.12×0.258= 0.031 (kg NOx)/m3.
Fig. 7. Condensing steam turbine (CST) driving a SWROdesalting system (Case 7).
CST
SWRO
GBoiler
Cooling Water
Condenser
The referenced fuel energy input Qref can pro-duce a distillate output of 863.6 kg/s (16.41 MIGD).The results of Case 6 are given in Table 7.
7.7. Case 7: Steam power cycle driving a SWROdesalting system (Fig. 7)
The same CST power plant used in Case 6 isused to drive a SWRO desalting system whichconsumes 6 kWh/(m3 desalted water), (21.6 kJ/kg)(Fig. 7). For the same100 MW fuel energy inputto a steam generator of a power plant of net effi-ciency ηc = 0.36, the system generator output of36 MW can thus desalt at the rate
3 3
(SWRO) = specific work
36,0006(kWh/m ) (3600 kJ/kWh)/1000 kg/m
1666.7 kg/s
WD
with a specific fuel heat input of
3100,000 kW 60 kJ/kg = 60 MJ/m1666.7
f
T
QD
The fuel cost based on $60/bbl and 5.7 GJ heat/bbl= (60 × 60) / (5.7 × 1000) =$0.6316/m3.
The CO2 emitted to the environment is 4.68 (kgCO2)/m
3,
the emitted SO2 is 0.06 × 0.67 = 0.0402 kg/m3,and
the emitted NOx is 0.06 ×0.258 = 0.0155 (kg NOx)/m3.
When the referenced fuel rate input Qref is used,the desalted water rate becomes 1,727.1(kg desalted water)/s (32.82 MIGD). The resultsof Case 7 are given in Table 7.
7.8. Case 8: Gas turbine (GT) driving a seawaterreverse osmosis (SWRO) desalting syste (Fig. 8)
The following Cases 8–14 employ a reference

Author's personal copy
76 M.A. Darwish et al. / Desalination 235 (2009) 58–87
gas turbine power plant [17]. Some general de-scription of the use of GT (cf. [18]), are givenhere preceding the specific analyzed cases. TheGT power output can be used to operate mechani-cally-driven desalting systems such as SWRO orMVC, while its exhaust heat gases can generatesteam. This steam can be used to operate ther-mally-driven desalting system such as MSF,MED, or TVC, as described in the following cases.GT by themselves can be used in simple powercycles producing only power, with cycle effi-ciency up to about 40%.
The power output of the commercially avail-able GT-s ranges from about 0.5 to 250 MW. Theywere typically used by utilities for peaking ca-pacity, and ongoing improvements in GT by rais-ing the unit capacity, efficiency, and reliability,increasingly favor their use as base-load powergenerators.
Large GT-s generate electricity with low NOxemissions, in the single digit ppm range, eitherwith catalytic exhaust cleanup or lean pre-mixedcombustion. Because of their relatively high effi-ciency and reliance on natural gas as the primaryfuel, gas turbines emit substantially less CO2 perkWh generated than any other fossil fuel tech-nologies in general commercial use. They are usedextensively in industry to drive pumps, compres-sors, and other large mechanical equipment, andmany facilities use turbines to generate electric-ity for use on-site. When used to generate poweron-site, GT-s are often used in the CHP mode,with heat used for winter and summer air condi-tioning.
Fig. 8. Gas turbine (GT) driving a SWRO desalting sys-tem (Case 8).
C GT SWRO
CCCombined heat and power (CHP) plants, (usu-
ally called cogeneration power desalting plantCPDP when the process heat is used by desaltingunits), consist of a simple cycle gas turbine com-bined with heat recovery steam generator HRSG(or sometimes called waste heat boiler WHB). TheHRSG recovers the heat content of the hot gasesleaving the GT to useful thermal energy in theform of steam. The CHP utilization factor UF,defined as the heat plus power outputs divided bythe fuel energy input, or
UF = d
f
Q WQ
can reach up to 70–80%.If high-pressure steam is generated in the
HRSG of the GT, it can be used to drive a steambottoming cycle in combined gas/steam turbinecycles (CC), thus adding the steam turbine poweroutput to that of the GT, and producing a higheroverall power output. Such gas/steam combinedpower cycles are the most efficient power plants,with current efficiencies up to 60%, and rising.
A well-known gas turbine GE model LM6000is used in the following Cases to show how a com-mercial GT can be used to operate different typesof desalting system [17]. The data of the LM6000GT are given in Table 10 for the simple and CHPGT systems.
In Case 8, the typical General Electric LM6000GT is used to operate a SWRO desalting system.The SWRO consumes 6 kWh/m3 (Fig. 9). Theturbine has a 40 MW net power output, 37% effi-ciency, and thus its fuel input rate is Qf = 108.108MW at the ISO conditions. The SWRO desaltedwater output is thus
40,000 1581 (kg desalted water)/s(6 3.6)
D
(35.2 MIGD), and the total specific fuel energy
3108,108 58.4 kJ/kg (MJ/m )1852
f
T
QD .

Author's personal copy
M.A. Darwish et al. / Desalination 235 (2009) 58–87 77
The fuel cost is $0.615/(m3 desalted water), whencalculated for $60/bbl and 5.7 GJ heat/bbl.
The emitted CO2 is 4.55 (kg CO2)/m3,
the emitted SO2 is 0.0584 × 0.67 = 0.03913(kg SO2)/m3, and
the emitted NOx is 0.0584×0.258 = 0.01507(kg NOx)/m
3.
Fig. 9. Gas turbine (GT) driving a MVC desalting system (Case 9).
C GT MVC
CC
When the referenced fuel rate input Qref= 103.6265 MW is used, the desalted water rateis
103,626 35.2 (kg desalted water)/s108,108
= 33.74 MIGD.
D
The results of Case 8 are given in Table 7.
7.9. Case 9: Gas turbine GT power plant drivingan MVC desalting system (Fig. 9)
In this case, the 40 MW power output of theLM6000 GT is used to drive an MVC desaltingsystem, which consumes 12 kWh/m3 by the com-pressor and pumps. The rate of fuel input is108.108 MW at the ISO conditions. So, the MVCdesalted water output is
40,000 926 (kg desalted water)/s(12 3.6)
(17.6 MIGD)
D
and the total specific fuel energy
3108,108 116.8 kJ/kg (MJ/m ).926
f
T
QD
The fuel cost based on $60/bbl and 5.7 GJ heat/bbl= (60/5.7) × (116.8/1000) = $1.23/m3.
The CO2 emitted to the environment is 9.1(kg CO2)/m
3,
Cost and performance characteristic LM6000
Electricity generation capacity (MW) 40 Total installed cost (year 2000 $/kW) $785 Electric heat rate (kJ/kWh) HHV 9,729.72 Electrical efficiency (%) 37 Fuel input (MW) 108.108 Required fuel gas pressure (bar) 30
CHP characteristics
Exhaust flow (kg/s) 120.20 GT exit temperature (°C) 456.67 HRSG exhaust temperature (°C) 137.78 Steam output, kg/s 16.19 Steam output, MW 40.1 Total CHP efficiency (%) HHV 74 Power to heat ratio 1.00 Net heat rate (kJ/kWh) 5,217.19 Effective electrical efficiency (%) 69
Table 10Data for the General Electric Co. LM6000 CHF gas tur-bines
Author's personal copy
78 M.A. Darwish et al. / Desalination 235 (2009) 58–87
the emitted SO2 is 0.1168 × 0.67 = 0.0783(kg SO2)/m
3, and
the emitted NOx is 0.1168 × 0.258 = 0.0313(kg NOx)/m
3.
The amount of desalted water for the referencedfuel input is 887.2 (kg desalted water)/s (16.87MIGD).
The results of Case 9 are given in Table 7.
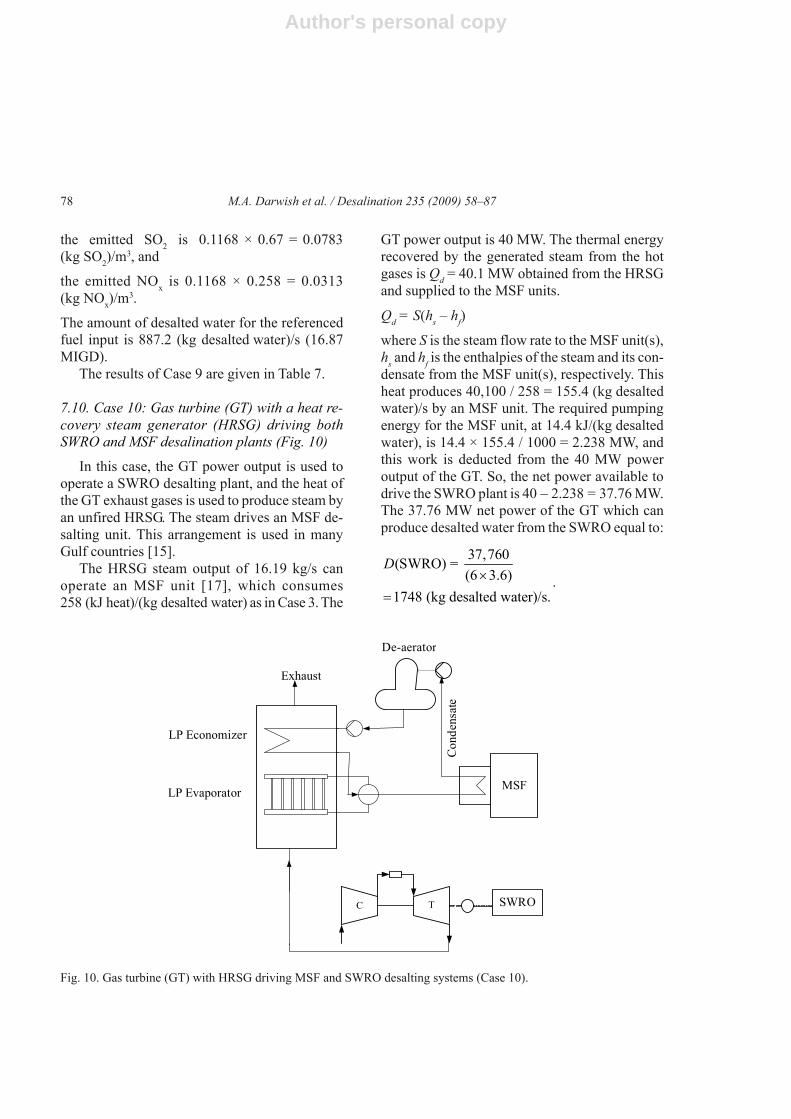
7.10. Case 10: Gas turbine (GT) with a heat re-covery steam generator (HRSG) driving bothSWRO and MSF desalination plants (Fig. 10)
In this case, the GT power output is used tooperate a SWRO desalting plant, and the heat ofthe GT exhaust gases is used to produce steam byan unfired HRSG. The steam drives an MSF de-salting unit. This arrangement is used in manyGulf countries [15].
The HRSG steam output of 16.19 kg/s canoperate an MSF unit [17], which consumes258 (kJ heat)/(kg desalted water) as in Case 3. The
Fig. 10. Gas turbine (GT) with HRSG driving MSF and SWRO desalting systems (Case 10).
De-aerator
Exhaust
LP Economizer
LP Evaporator
C T SWRO
MSF
Cond
ensa
te
GT power output is 40 MW. The thermal energyrecovered by the generated steam from the hotgases is Qd = 40.1 MW obtained from the HRSGand supplied to the MSF units.
Qd = S(hs – hf)
where S is the steam flow rate to the MSF unit(s),hs and hf is the enthalpies of the steam and its con-densate from the MSF unit(s), respectively. Thisheat produces 40,100 / 258 = 155.4 (kg desaltedwater)/s by an MSF unit. The required pumpingenergy for the MSF unit, at 14.4 kJ/(kg desaltedwater), is 14.4 × 155.4 / 1000 = 2.238 MW, andthis work is deducted from the 40 MW poweroutput of the GT. So, the net power available todrive the SWRO plant is 40 – 2.238 = 37.76 MW.The 37.76 MW net power of the GT which canproduce desalted water from the SWRO equal to:
37,760(SWRO) = (6 3.6)
1748 (kg desalted water)/s.
D.
Author's personal copy
M.A. Darwish et al. / Desalination 235 (2009) 58–87 79
The total desalted water output by both MSF andSWRO is 1,903.6 kg/s (36.18 MIGD), and thetotal specific fuel energy
3108,108 56.8 MJ/m .1903.6
f
T
QD
The fuel cost based on $60/bbl and 5.7 GJ heat/bbl = (60/5.7) × (56.8/1000) = $0.598 m3/m3.
The CO2 emitted to the environment is 4.425 (kgCO2)/m
3,
the emitted SO2 is 0.0568 × 0.67 = 0.0381 (kg SO2)/m3, and
Fig. 11. Combined gas/steam power cycle (CC) driving a SWRO desalting system (Case 11).
C T SWRO
Exhaust
LP Economizer
HP Economizer
LP Evaporator
LP Super-eater
HP Economizer
LP Superheater
HP Evaporator G
De-aerator
Condenser
Cooling Water
CST
the emitted NOx is 0.0568 × 0.258 = 0.01465(kg NOx)/m
3.When the referenced fuel rate input Qref =
103.6265 MW is used, the desalted water ratebecomes (103,626/108,108) × 36.18 (kg desaltedwater)/s = 34.616 MIGD.
The results of Case 10 are given in Table 7.
7.11. Case 11: Combined gas/steam power cycle(CC) driving a SWRO desalting system (Fig. 11)
In this arrangement, a bottoming steam cycle,containing a HRSG, is added to the GT to form a

Author's personal copy
80 M.A. Darwish et al. / Desalination 235 (2009) 58–87
combined cycle. The combined cycle power out-put operates a reverse osmosis SWRO desaltingsystem. The HRSG can be single or dual pres-sure. The pressure of the generated steam is cho-sen such that the steam condition at the turbineexit (at condenser inlet) has a dryness fraction(quality) ≥ 0.88, as well as reasonable HRSG andsteam cycle efficiencies. Raising the steam pres-sure in a single pressure HRSG increases the steamcycle efficiency, but lowers HRSG efficiency.
The use of a double pressure HRSG as shownin Fig. 12 gives sufficient thermal energy to thebottom steam turbine to produce a power outputof 16.645 MW [17]. Added to the turbine’s 40 MWoutput, the total power output thus is 56.645 MW.
Fig. 12. Combined gas/steam power cycle (CC) driving a MVC desalting system (Case 12).
C T MVC
Exhaust
LP Economizer
HP Economizer
LP Evaporator
LP Super-eater
HP Economizer
LP Superheater
HP Evaporator G
De-aerator
Condenser
Cooling Water
CST
When this power output operates a SWRO de-salting plant, it produces D = (56,645) / (6 × 3.6)= 2622.45 (kg desalted water)/s (49.84 MIGD).
The only fuel added is that to GT (i.e., 108.108MW). Consequently, the total specific fuel input(Qf/D)T = (108,108/2622.45) = 41.2 MJ/m3.The fuel cost based on $60/bbl and 5.7 GJ heat/bbl = (60/5.7) × (41.2/1000) = $0.4337/m3.The CO2 emitted to the environment is 3.21 (kgCO2)/m
3,the emitted SO2 is 0.0412 × 0.67 = 0.0276(kg SO2)/m
3, and
the emitted NOx is 0.0412 × 0.258 = 0.0163(kg NOx)/m3.

Author's personal copy
M.A. Darwish et al. / Desalination 235 (2009) 58–87 81
When the referenced fuel rate input refQ =103.6265 MW is used, the desalted water ratebecomes (103,626/108,108) × 49.84 (kg desaltedwater)/s = 47.75 MIGD.
The results of Case 11 are given in Table 7.
7.12. Case 12: Combined gas/steam power cycle(CC) driving a MVC desalting system (Fig. 12)
In this arrangement, the same combined cycleof Case 11 drives a MVC desalting system. Thetotal power output is 56.645 MW and the desaltedwater output is 1,311.2 (kg desalted water)/s(24.92 MIGD), based on the 12 kWh/(m3 desaltedwater) compressor and pumping energy require-ment. The fuel added to the GT is 108.108 MWand consequently, the total specific fuel input is82.5 MJ/m3.
The fuel cost based on $60/bbl and 5.7 GJ heat/bbl = (60/5.7) × (82.5/1000) = $0.868/m3.
The CO2 emitted to the environment is 6.42 (kgCO2)/m
3,
the emitted SO2 is 0.0825 × 0.67 = 0.0553 (kg SO2)/m3, and
the emitted NOx is 0825 × 0.258 = 0.0213(kg NOx/m3.
When the referenced fuel rate input refQ=103.6265 MW is used, the desalted water ratebecomes (103,626/108,108) × 24.92 (kg desaltedwater)/s = 23.887 MIGD.
The results of this Case are given in Table 7.
7.13. Case 13: Combined gas/steam power cycle(CC) with backpressure steam turbine BPST driv-ing both a SWRO and a MED desalting system(Fig. 13)
This case is similar to Case 12 but the steamturbine is a BPST, exhausting steam at 30 kPa todrive a low temperature multi effect boiling MED
system. The characteristics of the MED is similarto that in Case 4, namely, 6 effects, PR = 5.5,2 kWh/m3 pumping energy, brine top temperature= 60°C, and steam supply equal to 16 kg/s. Thesteam turbine power output is 14.45 MW, lowerthan the 16.465 MW of condensing turbine Case12, because the steam in this case exits the tur-bine at P = 30 kPa and not at the condenser pres-sure of 10 kPa. The MED distillate output is 88(kg desalted water)/s. The pumping power re-quired for the MED unit is 0.634 MW. So, the netsteam turbine power output after supplying thepumping energy to the MED system is 13.82 MW.The SWRO output due the power input of 40 MWby GT and 13.82 MW by BPST is 2,491.5 kg/s.The total desalted water production rate is 2579.5(kg desalted water)/s (49.02 MIGD).
The total specific fuel energy is 41.91 MJ/m3.For the referenced fuel input Qref, the desaltedoutput is corrected to 2472.6 kg/s (44.99 MIGD).It is noted here that the decrease of steam poweroutput due to use of the backpressure steam tur-bine, of 2.015 MW, can be considered as the realwork loss due to the use of MED desalting plant,and specific equivalent work due the heat addedis 22.9 kJ/kg (6.36 kWh/m3), and when addingthe 2 kWh/m3 for pumping, the total equivalentwork of MED product is 8.36 kWh/m3.
The fuel cost based on $60/bbl and 5.7 GJ heat/bbl = (60/5.7) × (41.91/1000) = $0.4412 m3.
The CO2 emitted to environment is 3.27 (kg CO2)/m3,
the emitted SO2 is 0.04191 × 0.67 = 0.0281(kg SO2)/m
3, and
the emitted NOx is 0.04191 × 0.258 = 0.0108(kg NOx)/m
3.
When the referenced fuel rate input Qref=103.6265 MW is used, the desalted water ratebecomes(103,626/108,108) × 49.02 (kg desaltedwater)/s = 46.997 MIGD.
The results of Case 13 are given in Table 7.

Author's personal copy
82 M.A. Darwish et al. / Desalination 235 (2009) 58–87
Fig. 13. Combined gas/steam power cycle (CC) with backpressure steam turbine BPST exhaust driving MED desalting,while the net power output driving SWRO system (Case. 13).
C T SWRO
MED
Exhaust
LP Economizer
HP Economizer
LP Evaporator
LP Super-eater
HP Economizer
LP Superheater
HP Evaporator G
De-aerator
Con
dens
ate
BPST
7.14. Case 14: Combined gas/steam power cycle(CC) with backpressure steam turbine (BPST)driving both SWRO and MSF desalting systems(Fig. 14)
This case is similar to the Al-Taweela plant[19], where combined gas/steam turbines cycleshave bottoming backpressure steam turbines thatexhaust their steam to drive multi-stage flash MSFdesalting units. The plant has three gas turbineswith power output equal to 228 MW each at ISOconditions and 185 MW at the corrected 46°Cambient temperature, 1190°C turbine inlet tem-
perature (TIT), compressor pressure ratio of 16with 17 stages, and the GT turbine has 4 stages.The GT can operate with distilled oil or naturalgas.
Three HRSG-s produce 115 kg/s steam eachat 70 bar and 522°C. Two backpressure steam tur-bines are used, and each has power output of111 MW, throttling conditions (i.e. the turbine in-let condition) of 520°C, 66.5 bar, and exhaust pres-sure of steam supply to the MSF unit of 3.5 bar.
Four MSF desalting units are used, and eachhas a 12.5-MIGD (657.7 kg/s) capacity, gain ra-tio (GR) = 7.7, specific heat consumption of

Author's personal copy
M.A. Darwish et al. / Desalination 235 (2009) 58–87 83
Fig. 14. Combined gas/steam power cycle (CC) with backpressure steam turbine (BPST) driving both SWRO and MSFdesalting systems (Case 14).
C T SWRO
MSF
Exhaust
LP Economizer
HP Economizer
LP Evaporator
LP Super-eater
HP Economizer
LP Superheater
HP Evaporator G
De-aerator
Con
dens
ate
BPST
290 kJ/(kg desalted water), rated top brine tem-perature of 110°C, feed water salinity of 45,100mg/l, and reported extremely low specific pump-ing work of 3.3 kWh/m3, (the typical cases inKuwait reporting 4–4.5 kWh/m3 pumping energy,and it seems here that the recirculation pumps aredriven directly by variable steam turbine, whichconsumes less energy, but not used typically atleast in Kuwait.)
The plant power output from the gas turbinesis 555 MW with fuel energy input = 1,586.71 MW.The MSF units of total 50 MIGD (2,630 kg/s)capacity consume 31.2444 MW pumping energy.The backpressure steam turbine BPST power out-
put is 222 MW. Deducting the MSF pumping workfrom the BPST power output, the BPST net workis 190.7556 MW. The net total power output avail-able from the gas turbines and BPST is thus745.7556 MW. While this power output of theAl-Taweela plant is not intended to drive a SWROdesalting plant, it is capable of producing34,525.72 (kg desalted water)/s from a SWROsystem if it were used for that. Consequently, thetotal desalted water that can be obtained from thisplant by MSF and SWRO desalting systems to-gether is 37,155.72 kg/s (706.17 MIGD), by thefuel heat input of 1,586.71 MW. This gives an over-all specific fuel energy demand of 42.68 MJ/m3.

Author's personal copy
84 M.A. Darwish et al. / Desalination 235 (2009) 58–87
Fuel cost based on $60/bbl and 5.7 GJ heat/bbl =(60/5.7) × (42.68/1000) = $0.4493/m3.
The amount of CO2 emitted is 3.3 (kg CO2)/m3,
the emitted SO2 is 0.0427 × 0.67 = 0.02861(kg SO2)/m
3, and
the emitted NOx is 0.0427 × 0.258 = 0.011(kg NOx)/m3.
When the referenced fuel rate input Qref=103.6265 MW is used, the desalted water ratebecomes (103,626/1586.71) × 706.17 (kg desaltedwater)/s = 46.14 MIGD.
The results of Case 14 are given in Table 7.
8. General comments on the energy consump-tions by desalting systems
It is well known that:1. The single purpose thermal desalination plants
that utilize boiler raised steam directly are lessefficient than dual purpose water and powerplants that expand the boiler raised steamwithin a turbine before feeding it to the de-salination plant. However single purpose de-salting plant, like MSF Shuwaikh plant, is stillin operation. Also other TVC units in the Gulfarea and Libya are still operated with steamdirectly supplied directly from fuel fired boil-ers such as Case 1.
2. The seawater reverse osmosis SWRO desalt-ing method is the most energy efficient desalt-ing system. However, the only seawater de-salting method used in Kuwait is the multistage flash system MSF system (of 1.5 Mm3/dtotal capacity), while only 30 MIGD (137×103 m3/d) SWRO is under construction now.
3. The combined cycle gas turbine–steam turbine(GT/ST) power plant has a higher thermal ef-ficiency than any other power plant. However,more recent power plants addition is a simplegas turbine cycle.
4. The specific energy consumptions used in thispaper is not for the most efficient desaltingplants. Examples are:
a TVC plants are capable of utilizing motivesteam with pressures as low as 2 bar and,with a suitable number of effects, can reachgain ratios (GR) of 12–14. The paper itself(page 17) reports that the Al Taweela TVCunits use turbine extraction steam at 2.8 bar.The TVC fuel consumption figures in thestudy, however, are based on a GR of 9 andenthalpies corresponding to a motive steamsupply pressure of 10 bar (page 19). Also,since as thermal plants’ GRs increase theircooling water requirements and pumpingenergy consumptions decrease, figures of1.2–1.5 kWh/m3, rather than 2 kWh/m3,should apply.
b MED plants, also with a suitable numberof effects, as would be warranted withtoday’s high fuel costs (that are even higherthan the paper’s utilized fuel cost, 90–100US$/barrel vs. 60 US$/barrel) can provideGRs of 9–10 rather than 5.5, as used in thepaper’s calculations (a huge difference!).
c MVC plants are available today with totalelectrical energy consumptions of 8-9 kWh/m3, yet the paper bases its MVC fuel con-sumption calculations on 12 kWh/m3.
d Even with the higher salinity Gulf seawa-ter, current SWRO plants achieve specificenergy consumption figures on the orderof 4 kWh/m3, rather than the 6 kWh/m3 usedin the study.
The results obtained strongly depend on theassumed typical desalination plant efficiencies,and we used the best current information on theirvalues. These efficiencies are gradually improv-ing, and in the same way that SWRO efficiencyimproved with the introduction of energy recov-ery equipment, the efficiency of distillation pro-cesses may increase significantly, by such im-provements as, for one example, nano-filtrationpretreatment which may more than double thecurrent distillation top temperatures and conse-quently the process efficiencies. While changes

Author's personal copy
M.A. Darwish et al. / Desalination 235 (2009) 58–87 85
in these efficiencies would change the results, theywould not change the conclusion that higher effi-ciency power generation systems, such as the com-bined GT/ST cycles studied here, are the mostdesirable for efficient use of fuel.
While the current study focused on the envi-ronmental sustainability effects of the fuel use fordesalination, it should be kept in mind that otherimportant sustainability criteria for water desali-nation include the brine discharges from the plants.These discharges will be at temperatures higherthan that of the sea, and will have concentrationsof seawater salts, heavy metals, and various wa-ter treatment chemicals, that are much larger thanthe feed seawater. These should, of course, bestudied further.
9. Conclusions
The paper presents series of energy and fuelconsumption calculations for 14 combinations ofpower and desalination plants and comparing theirnumerical results.
The energy consumed by each desaltingmethod was calculated based on the real fuel en-ergy consumed to generate the thermal energy and/or the pumping work required by the desaltingunits. It was shown that the present rating meth-ods of performance ratio or the gain ratio are notsuitable to take into account the pumping workand the exergy of the thermal energy supplied tothe desalting units. The corresponding equivalentwork of the consumed fuel energy (for both ther-mal and pumping work) was than calculated andused for rating each method.
The study focuses on energy use and its cost;and related emissions. It does not consider over-all plant economics that would include capital andnon-energy operating costs. An overall economicanalysis would be necessary for choosing plants,but there are two important reasons why a focuson energy alone is of sufficient importance: (1)the future availability of fuel sources for satisfy-ing the rapidly increasing demand, including thatfor fresh water, and (2) the rapidly increasing cost
of fuel which makes the energy portion of thedesalted water cost more dominant. In fact, othereconomic considerations may dilute the main pur-pose of this study.
It was shown how non-uniform and improperdefinitions of dual purpose desalination plant per-formance criteria and fuel/cost allocation meth-ods could underestimate the true costs of desaltedwater and of the associated impact of emissions.
General comparison between all the cases con-sidered (Table 7) indicates the following:1. Operation of the TVC, MSF, and MED by
steam directly supplied from fuel operatedboilers, as cases 1, and 2 is inefficient shouldbe avoided.
2. The SWRO is currently the most energy effi-cient desalting system and all the efforts shouldbe devoted to solve its pretreatment problemsand its full applications.
3. The MVC is the most efficient distillation sys-tem, and more effort should be done towardsincreasing its unit capacity by developing com-pressors of large sizes, and decreasing its me-chanical energy consumptions by raising theheat transfer coefficients in their evaporatorsand pre-heaters.
4. Using high efficiency combined GT/ST powerproduction integrated with any of the consid-ered desalination system consumes the leastenergy and thus incurs the lowest energy cost:the lowest of all the 14 cases considered, at$0.43/m3 is a GT/ST driving SWRO desalina-tion (Case 11). However, GT/ST driving com-bined SWRO/MSF desalination systems (Case14), or with combined MVC/MED systems(Case 13), produce an energy efficiency andwater costs nearly the same as that, at $0.43/m3 and $0.45/m3, respectively, but with some-what higher system complexity.
Symbols
BPST — Back pressure steam turbineCC — Combined gas/steam turbine power
cycles

Author's personal copy
86 M.A. Darwish et al. / Desalination 235 (2009) 58–87
CHP — Combined heat and power plantCPDP — Cogeneration power desalting plantCST — Condensed type steam turbineD — Distillate (product water) flow rate,
kg/sGR — Gain ratio, distillate/steam D/SGT — Gas turbineh — Enthalpy, kJ/kgHHV — Fuel high heating valueHRSG — Heat recovery steam generatorIP — Intermediate pressuresL — Latent heat, kJ/kgLP — Low pressure steam turbine cylinder
or low pressurems — Steam flow rate, kg/sPR — Performance ratioQb — Heat supplied by the boiler, kJ/s
(kW), or MJ/s (MW)Qd — Heat input to desalting system, kJ/s
(kW), or MJ/s (MW)Qf — Fuel heat, kJ/s (kW), or MJ/s (MW)Qref — Reference fuel energy = 103,626.5
kW (Qf for fuel fired boiler drivingTVC, Case 1).
(Qf / D)T— Total specific fuel energy, kJ/kg orMJ/m3
S — Steam supply mass flow rates (kJ/s)SPD — Single purpose desalting plantSPPP — Single purpose power plantST — Steam turbineTC — Thermal compressor (steam ejector)W — Work output or consumed, kJWe — Equivalent work. kJwe — Specific equivalent work, kJ/(kg
desalted water)WHB — Waste heat boilerη — Efficiency
Subscripts
d — For desalting unitf — Fuelpp — Power plants — SteamT — Total
References[1] WCED, Our Common Future: World Commission
on Environment and Development, New York, Ox-ford University Press, 1987.
[2] H.E. Daly, Towards Steady State Economy, SanFrancisco, WH Freeman and Company.
[3] KISR (Kuwait Institute for Scientific Research),Geohydrological studies of Al-Wafra and AlAbdallyfarm areas, Vol. 1. Prepared by the Hydrology De-partment, Water Resources Division, Kuwait, 1994.
[4] F. Al Ruwaih and J.Almedeij, The future sustain-ability of water supply in Kuwait, Water Intern. J.,accepted.
[5] Wangnick Consulting, 2004 IDA Worldwide Desalt-ing Plant inventory, Report number 18, WangnickConsulting and IDA, 2004.
[6] Kuwait Ministry of Energy, The Statistical yearbook, Water and Electricity, 2004, http://www.moo.gov.kw/facts/en/.
[7] C. Sommariva, H. Hogg and K. Callister, Environ-mental impact of seawater desalination: relationsbetween improvement in efficiency and environmen-tal impact, Desalination, 167 (2004) 439–444.
[8] British Petroleum, Statistical Review of World En-ergy 2007, http://www.bp.com/productlanding.do?categoryId=6848&contentId=7033471http://www.bp.com/productlanding.do?categoryId=6842&contentId=7021390.
[9] Y. Wang and N. Lior, Fuel allocation in a combinedsteam-injected gas turbine and thermal seawaterdesalination system, Desalination, 214 (2007) 306–325.
[10] N. Lior and N. Zhang, Energy, exergy, and secondlaw performance criteria, Energy, 32 (2007) 281–296.
[11] N. Afgan, M. Darwish and M.G. Carvalho, Sustain-ability assessment of desalination plants, Desalina-tion, 124 (1999) 19–31.
[12] K. Ringskag, International trends in water pricingand use, 5th Water Science and Technology Asso-ciation (WSTA) Gulf Water Conference, Doha,Qatar, March 24–28, 2000.
[13] T.C. Koss and R.A. Jonardi, Clean air act legisla-tion and regulated pollutants, in Standard Handbookof Power Plant Engineering, T.C. Elliot, ed.,McGraw-Hill, 1989.
[14] J.W. Vermey and D. Beraud-Sudreau, Breakthroughof MED technology in very large scale applications,
Author's personal copy
M.A. Darwish et al. / Desalination 235 (2009) 58–87 87
The Al-Taweela-A1 Case, Proc. IDA World Con-gress on Desalination and Water Reuse, Manama,Bahrain, March 2002.
[15] D. Hoffman and A. Zfati, Hybrid Desalination Sys-tems — Effective Integration of Membrane-Ther-mal Desalination and Power Technology, MEDRCProject: 97-AS-008a, Middle East Desalination Re-search Center, Muscat, Oman.
[16] B. Ohlemann and D. Emmermann, Advanced bargemounted VTE/VC seawater desalting plant, Desali-nation, 45 (1983) 39–47.
[17] M.A. Darwish and N.M. Al-Najem, Co-generationpower desalting plants: new outlook with gas tur-bines, Desalination, 161 (2004) 1–12.
[18] Environmental Protection Agency, Climate Protec-
tion Partnership Division, prepared by Energy NexusGroup, Technology characterization: gas turbines,http://www.epa.gov/CHP/pdf/tech_tubines.pdf,Washington, DC, 2002.
[19] N. Wade, J. Willis and J. McSorley, Al Taweela A-2independent water and power project, Desalination,125 (1999) 191–202.
[20] M.A. Darwish and N. Al Najem, The water prob-lem in Kuwait, Desalination, 177 (2005) 167–177.
[21] A.D. Kawaji, I. Kutubkhana and J.M. Wie, A 13.3MGD seawater RO desalination plant for YanbuIndustrial City, Desalination, 203 (2007) 176–188.
[22] M.A. Darwish, Desalting fuel energy cost in viewof $75/barrel oil, Desalination, 208 (2007) 306–320.