Embed Size (px)
Citation preview

This article appeared in a journal published by Elsevier. The attachedcopy is furnished to the author for internal non-commercial researchand education use, including for instruction at the authors institution
and sharing with colleagues.
Other uses, including reproduction and distribution, or selling orlicensing copies, or posting to personal, institutional or third party
websites are prohibited.
In most cases authors are permitted to post their version of thearticle (e.g. in Word or Tex form) to their personal website orinstitutional repository. Authors requiring further information
regarding Elsevier’s archiving and manuscript policies areencouraged to visit:
http://www.elsevier.com/copyright

Author's personal copy
Impairment of radio wave signal by rainfall on fixed satellite service onearth–space path at 37 stations in Nigeria
T.V. Omotosho �, C.O. Oluwafemi
Department of Physics, Covenant University, Ota, Ogun State, Nigeria
a r t i c l e i n f o
Article history:
Received 7 August 2008
Received in revised form
18 February 2009
Accepted 8 March 2009Available online 1 April 2009
Keywords:
TRMM and AIRS satellite data
Ku, Ka and V bands
Slant-path rain attenuation
Fixed satellite services
a b s t r a c t
This study investigates the effect of rainfall on horizontally polarized radio waves for fixed satellite
service at Ku, Ka and V bands for links to the recently launched Nigeria Communication Satellite one
(NigComSat-1), for annual time availabilities of 99–99.99% in an average year for 37 stations in Nigeria.
The results obtained at Ku-band downlink shows that 99.99% availability is possible in all the 37-
stations in Nigeria. At Ka-band downlink the results also show that only 99.9% availability is practicable
in all the 37 stations in Nigeria. At V-band downlink, 99.99% availability is also not possible in all the 37
stations in Nigeria. An availability level of 99.9% is only practicable in the North–West (NW) and
North–East (NE) regions, where the attenuation is between 14 and 17.9 dB. Total fade out of signals
during rainfall are probable in the South–South (SS), South–East (SE), South–West (SW) and
Middle–Belt (MB) regions at 99.9% availability.
& 2009 Elsevier Ltd. All rights reserved.
1. Introduction
The performance of radio (wireless) communication systemsdepends on the propagating medium between the transmitter andthe receiver, the atmosphere. Unlike wired channels that arestationary and predictable, the radio channels are extremelyrandom, because they depend on the physical characteristics ofthe atmosphere such as temperature, pressure, humidity, hydro-meteors-suspended particles and atmospheric constituents andalso the propagating wave itself depend on the wavelength and itspolarization as it travels through the atmosphere (Margarita,2005). The effect of the propagating medium (atmosphere)increases as the frequency of the signal increases (Gibson,2002). Electromagnetic wave propagating characteristics varysignificantly over different frequency bands; therefore, it is vital tothoroughly understand the propagating characteristics and devel-op (use or modify an existing) a channel model for the proposedwireless communication system before site-specific planning anddeployment can be initiated. Absorption and scattering by rain(and to a lesser extent hail, ice crystals or wet snow) atfrequencies above 10 GHz can cause a reduction in transmittedsignal amplitude (attenuation), which in turn reduce the relia-
bility, availability and performance of the communications link(Sarkar, 1998).
Other degradation caused by these hydrometeors along theearth–space paths to microwave signals includes depolarization,rapid amplitude and phase fluctuation (scintillation), antennagain degradation and bandwidth coherence reduction. The NASAAdvanced Communication Satellite (ACTS) had completed a verysuccessful five-year campaign of measurements in the 20 and30 GHz bands (Ka and V bands) at seven North America locations(Ippolito, 1986) also similar propagation campaigns in Europe(at Ka and V bands) had been completed successfully (Olympusand Italsat). Concise modeling and prediction procedures forpropagation factors based on data from satellite beacons havebeen successfully applied in the design and performance ofsatellite telecommunication systems for several years (Ippolito,and Bauer 2000). The main objective of this study is to estimateimpairments by rainfall on earth–space path for 0.01–1% unavail-ability of an average year in Nigeria for links to recently launchedNigeria Communication Satellite One (NigComSat-1) by usingrecent meteorological data from satellites such as the TRMMsatellite, the AIRS satellite (from NASA, USA) and GTOPO30 (USA)covering 1998–2006, 2002–2006 and 2004, respectively. For easeof data analyses in this work, the 37 stations (Fig. 1) in Nigeriahave been divided into six distinct regions namely: South–West(SW), South–East (SE), South–South (SS), Middle–Belt (MB),North–West (NW) and North–East (NE). Table 1 gives a briefdescription of the topographic features along with the climatesummary of each region.
ARTICLE IN PRESS
Contents lists available at ScienceDirect
journal homepage: www.elsevier.com/locate/jastp
Journal ofAtmospheric and Solar-Terrestrial Physics
1364-6826/$ - see front matter & 2009 Elsevier Ltd. All rights reserved.
doi:10.1016/j.jastp.2009.03.016
� Corresponding author. +23408050401655 (Mobile).
E-mail address: [email protected] (T.V. Omotosho).
Journal of Atmospheric and Solar-Terrestrial Physics 71 (2009) 830–840

Author's personal copy
2. Computational methods
2.1. Data source (rainfall archives)
TRMM Data from EOS DAAC NASA Goddard space flight centreMaryland US were used. They included:
(a) Monthly TMI rain product (3A12 V6) containing surface,convective and stratiform rain rates in mm/h. As it applies toTRMM satellite, stratiform rain is a widespread continuousprecipitation produced by large-scale ascent due to frontal ortopographic lifting or large-scale horizontal air convergencecaused by other means, while convective rain is a localized,rapidly changing, showery precipitation produced by cumu-lus-scale convection in an unstable air. The third typecompromises all rain that is not included in these twocategories. When the bright band does exist, rain is classifiedas stratiform. When the bright band does not exist, but anyvalue of Z along the range exceeds a predetermined value, rainis classified as convective. When the bright band does notexist and all values of Z along the range are less than thepredetermined value, rain is classified as others (Nirala andCracknell, 2002). The 3A12 V6 data set was based on 11latitude by 11 longitude spacing.
(b) Monthly TRMM and other satellite data sources. Rainfallestimate (3B43 V6) is one of the operational products ofTRMM based on rain gauge measurements and satelliteestimates of rainfall. The algorithm was developed by theTRMM science team and the data were processed by the
TRMM science data and information system. The griddedestimates are on a temporal resolution of 0.251 latitude by0.251 longitude spacing. The combined data set is basedon the concepts of Huffman et al., (1995) combiningprecipitation data sets. The TRMM best estimates method isa combination of data from the TMI, PR and VIRS, with SSM/I,IR and rain gauge data.
2.2. Data processing
For each of the 37 stations, the thunderstorm ratio b wascalculated using the method of Rice and Holmberg (1973). Themodel divided the rainfall into two types to permit the predictionof rainfall rate statistic from the total rainfall accumulationmeasured in an average year. The two types are termed mode 1rain (M1) and mode 2 rain (M2). Mode 1 contained the highrainfall rates associated with strong convective activity andthunderstorms. Mode 2 was simply everything else. Therefore,the total average rainfall accumulation M is
M ¼M1þM2 mm: (1a)
Since TRMM, PR and TMI are able to detect and log stratiformrain and convective rain mode associated with thunderstormseparately. Therefore, the ratio of thunderstorm rain accumulationto the total rainfall accumulation, namely
b ¼M1=M: (1b)
The one-minute rainfall rate was computed using the methoddeveloped by Chieko and Yoshio (2002) in which regional climatic
ARTICLE IN PRESS
Fig. 1. Map of Nigeria showing the 37 stations used in the study.
T.V. Omotosho, C.O. Oluwafemi / Journal of Atmospheric and Solar-Terrestrial Physics 71 (2009) 830–840 831

Author's personal copy
parameters such as the thunderstorm ratio b was taken intoaccount in the estimation of the one-minute rainfall rate. Thismodel was found to give the best prediction accuracy amongexisting models, especially for small percentage of time(0.001–1%) which is important for radio system design. Fromtheir result, it was found that the thunderstorm ratio was animportant parameter. As the results of their analysis, one-minuterain rates for arbitrary percentage of time P (%), Rp (mm/h), can beestimated by using only the average annual total rainfall and thethunderstorm ratio. The model is given by Eqs. (2)–(5) usingcoefficients ap, bp, cp, with x ¼ log (P). The equations weredetermined by multiple regression analyses of databank of rainattenuation on satellite links of 290 data sets from 84 locations in
30 countries and the databank of different integration time rainrates which contains data sets from 54 locations in 23 countries.
Rp ¼ apMbpbcp (2)
logðapÞ ¼ 0:1574155x4 þ 1:348171x3 þ 3:528175x2
þ 1:479566x� 2:302276 (3)
bp ¼ � 4:583266� 10�2x4 � 0:4098161x3 � 1:162387x2
� 0:8261178xþ 0:911857 (4)
ARTICLE IN PRESS
Table 1Topographic and climate date: heights above mean sea level (m), zero degree isotherm height (m), rain height (km), annual rainfall and surface temperature, derived from
GTOPO30, TRMM and AIRS satellite for the 37 stations.
Regions State capitals Climate Latitude Longitude Station
height above
sea level (m)
0C isotherm
height(m)
Rain heightt
(Km)
Annual
rainfall
(mm)
Surface
temperature
South West Abeokuta Tropical wet 7.07 3.21 74.0 4411.0 4.77 1100.0 28.6
Adoekiti Tropical wet 7.42 5.13 363.0 4392.0 4.75 1242.0 27.6
Akure Tropical wet 7.18 5.12 303.0 4392.0 4.75 1314.0 27.6
Ibadan Tropical wet 7.21 4.01 134.0 4402.0 4.76 1245.0 27.7
Ikeja Tropical wet 6.35 3.20 38.0 4398.0 4.76 1217.0 27.2
Osogbo Tropical wet 7.42 4.31 229.0 4402.0 4.76 1245.0 27.7
South East Abakaliki Tropical wet 6.18 8.70 149.0 4408.0 4.77 2394.0 28.7
Akwa Tropical wet 6.12 7.04 159.0 4395.0 4.75 1899.0 28.4
Enugu Tropical wet 6.24 7.24 139.0 4395.0 4.75 1899.0 25.1
Owerri Tropical wet 5.19 7.07 158.0 4387.0 4.75 2397.0 27.4
Umuahai Tropical wet 5.30 7.33 165.0 4387.0 4.75 2397.0 27.4
South South Asaba Tropical wet 6.10 6.44 152.0 4377.0 4.74 1900.0 27.9
Benin Tropical wet 6.22 5.39 42.0 4379.0 4.74 1948.0 27.2
Calabar Tropical wet 4.55 8.25 370.0 4404.0 4.76 3748.0 26.6
Port
harcourt
Tropical wet 4.43 7.02 18.0 4381.0 4.74 2817.0 26.7
Uyo Tropical wet 5.00 7.57 163.0 4387.0 4.75 2429.0 27.4
Yenagao Tropical wet 4.55 6.16 93.0 4379.0 4.74 2766.0 26.4
Middle Belt Abuja Savanna
North
9.04 7.28 334.0 4402.0 4.76 1258.0 30.1
Iiorin Savanna
North
8.32 4.34 304.0 4415.0 4.78 1132.0 29.7
Lafia Savanna
North
8.29 8.34 403.0 4405.0 4.77 1146.0 30.6
Lokoja Savanna
North
7.47 6.44 204.0 4389.0 4.75 1334.0 28.8
Markurdi Savanna
North
7.41 8.35 142.0 4405.0 4.76 1398.0 29.7
Minna Savanna
North
9.33 6.33 152.0 4426.0 4.79 1049.0 30.9
Jos Savanna
North
9.58 8.57 1110.0 4397.0 4.76 1184.0 30.1
North West Birini kebbi Semi-arid 12.28 4.08 244.0 4421.0 4.78 764.0 33.9
Gusau Semi-arid 12.18 6.27 440.0 4420.0 4.78 721.0 33.3
Kaduna Savanna
North
10.32 7.25 605.0 4410.0 4.77 1112.0 30.7
Kano Semi-arid 11.56 8.26 566.0 4411.0 4.77 754.0 31.6
Kastina Semi-arid 12.56 7.33 590.0 4415.0 4.77 600.0 32.7
Sokoto Semi-arid 13.05 5.15 247.0 4430.0 4.79 564.0 33.9
North East Bauchi Savanna
North
10.18 9.46 665.0 4416.0 4.78 863.0 31.2
Damaturu Semi-arid 11.44 11.58 451.0 4412.0 4.77 598.0 33.2
Dutse Semi-arid 11.43 9.25 452.0 4422.0 4.78 649.0 32.8
Gombe Savanna
North
10.19 11.02 422.0 4428.0 4.79 759.0 32.6
Jalingo Savanna
North
8.54 11.22 304.0 4389.0 4.75 1417.0 30.1
Maiduguri Semi-arid 11.51 13.09 343.0 4416.0 4.78 650.0 33.8
Yola Semi-arid 9.07 12.24 207.0 4414.0 4.77 1027.0 33.1
T.V. Omotosho, C.O. Oluwafemi / Journal of Atmospheric and Solar-Terrestrial Physics 71 (2009) 830–840832

Author's personal copy
cp ¼ 2:574688� 10�2x4 þ 0:1549031x3 þ 0:1747827x2
� 0:2846313xþ 1:255081� 10�2 (5)
For the computation of the derived one-minute rainfall rates, aprogram named Rain rate was written in Matlab 7.0, which can becalled in Microsoft excel as a function, taking input parameterslike annual rainfall accumulation M in mm, thunderstorm ratio band percentage of time unavailability P in %, respectively.
2.3. Validation of TRMM data with measured rainguage data
in Nigeria
Rainguage data from January 1991 to December 2000 werecollected for 14-locations for the validation of TRMM data. TheTRMM satellite started its mission in November 27, 1997; grounddata from January 1998 to December 2000 were used to validatethe closeness of the TRMM satellite data with the rainguage datain the selected locations, which cover the entire six regions inNigeria. Table 1 shows the seasonal variation of mean precipita-tion, mean bias error and correlation coefficients of TRMM3B43V6 Data with the ground data collected at the NationalMeteorological Centre Oshodi Lagos. The results show that TRMMdata were positively correlated with the rainguage data in all the14-locations. In the SW region, the seasonal correlation coeffi-cients from December to November varies from 0.58 to 0.99, 0.75to 0.99 in the SE, 0.83 to 0.99 in the SS, 0.56 to 0.96 in the MB, 0.76to 0.99 in the NW and 0.76 to 0.96 in the NE regions. Table 2 alsoshows the seasonal mean bias error of TRMM 3B43V6 data withground data. Mean bias errors greater than �25 mm occurred inMarch, April, May (MAM) in two locations, Adoekiti and Kano (theend of dry months). During June, July, August (JJA, the wettestmonths), the mean bias errors less than �50 mm occurred in onelocation Kano. The mean bias errors were smallest in the peak ofraining season (JJA) for 13-locations. In September, October,November (SON), the seasonal mean bias errors greater than+25 mm occurred in five locations: Adoekiti, Port hacourt,Yenagoa, Kaduna and Jalingo. Adeyewa and Nakamura (2003)had observed similar seasonal mean bias error (for latitudes 41 to141N in Africa) of 25–40, 28–53, 38–54 and 35–45 mm of TRMM
3B43V6 data with rainguage data for MAM, JJA and SON,respectively.
The worst bias errors (greater than +100 mm) occur in (thedriest months) December, January, February (DJF), at ten stations.
2.4. Cumulative distribution of rainfall rates in the six regions
The average cumulative distributions of rain rate observationsfor the 9-year period for the six regions are shown in Fig. 2.The rain rates were plotted against percentage of timeunavailability, from 0.001% to 1% which corresponds to5.26 min–8.76 h of exceedance of the indicated one-minuterainfall rates in an average year. The cumulative graphs showthat the SE (Abakaliki and Umahia) and SS (Uyo) regions have thehighest cumulative (of 4–192 mm/h), followed in descendingorder by the MB (Markudi, 2–164 mm/h) SW (Akure and Osogbo,2–162 mm/h). The cumulative distribution was the lowest in theNW and NE with values of 1–153 and 1–162 mm/h, respectively.
2.5. Validation of the derived rainfall rate from TRMM
with other works
Table 3 shows the correlation coefficient of the derived rainfallrates with International Telecommunication Union Radio wavesPropagation Study Group 3 digital maps (ITU_RP SG3) and withthe work of Ajayi and Ezekpo (1988) which relied on the RiceHolmberg (1973) method to predict 1 min rainfall rate from 30-year rainguage data for 37 stations in Nigeria. Ajayi and Ezekpoderived a contour map of rainfall rate for Nigeria. The correlationcoefficients between this present work and ITU-RP is positive inall regions except in the Middle–Belt, where there is negativecorrelation (of 0.20). In Table 3, two outliers in the ITU-RP rain ratedata for Lokoja and Minna seem to be the cause of the negativecorrelation. There is also a weak correlation (0.09) between thiswork and ITU-RP only at the South–South region, due to lowvalues of ITU-RP rain rate data for Uyo and Yenagoa. This suggeststhat where local measured data is not available, ITU-RP digitalmap is applicable only in the SW, SE, NW and NE. The correlationcoefficient of this work with Ajayi-Ezekpo (1988) is positive in allregions, but there are also two weak correlations (of 0.17) at the
ARTICLE IN PRESS
Table 2The seasonal variation of mean precipitation, percentage mean bias error and overall correlation coefficients of TRMM 3B43V6 data with ground data at 14 locations in
Nigeria for the period January 1998–December 2000.
Regions/climate Locations (A) Ground data mean
precipitation (mm)
(B) TRMM 3B43V6 data mean
precipitation (mm)
(B�A)/A�100 percentage mean
bias error
Overall correlation coefficients of
(A) with (B)
DJF MAM JJA SON DJF MAM JJA SON DJF MAM JJA SON DJF MAM JJA SON
South West Adoekiti 16.6 187.3 200.7 83.4 12.1 130.6 179.2 146.1 �27.1 �30.3 �10.7 75.2 0.58 0.93 0.97 0.81
Tropical wet Ibadan 14.9 90.2 187.7 145.0 14.3 130.9 166.7 152.0 �4.0 45.1 �11.2 4.8 0.57 0.93 0.94 0.99
Ikeja 14.2 85.0 160.1 167.4 11.5 126.4 178.3 108.4 �19.0 48.7 11.4 �35.2 0.90 0.95 0.99 0.97
South East Enugu 8.1 147.2 244.5 174.8 23.4 137.2 310.6 152.0 188.9 �6.8 27.0 �13.0 0.75 0.91 0.95 0.99
Tropical wet
South South Calabar 85.9 190.5 387.6 336.2 61.4 217.3 555.3 411.7 �28.5 14.1 43.3 22.5 0.91 0.89 0.95 0.99
Tropical wet Port Harcourt 24.5 176.8 305.7 287.6 70.9 153.8 426.2 374.3 189.4 �13.0 39.4 30.1 0.85 0.94 0.98 0.96
Yenagoa 28.8 131.6 193.1 211.0 76.5 190.3 264.3 333.1 165.6 44.6 36.9 57.9 0.71 0.92 0.83 0.94
Middle Belt Ilorin 5.6 91.6 206.5 154.6 26.2 104.4 163.2 108.6 367.9 14.0 �21.0 �29.8 0.83 0.90 0.93 0.94
Savanna North Minna 0.0 45.3 247.1 88.7 6.2 92.1 184.6 98.5 ** 103.3 �25.3 11.0 0.56 0.77 0.96 0.87
Jos 0.0 91.7 211.6 93.3 7.2 82.4 212.2 96.7 ** �10.1 0.3 3.6 0.79 0.90 0.96 0.96
North West Kaduna 0.0 46.9 217.1 67.7 6.7 41.7 204.6 120.4 ** �11.1 �5.8 77.8 0.76 0.86 0.97 0.73
Savanna North Kano 0.0 25.2 363.2 104.1 3.5 5.8 174.2 55.5 ** �77.0 �52.0 �46.7 0.75 0.99 0.98 0.99
North East
Savanna North Jalingo 0.0 56.2 204.8 65.7 5.3 87.3 240.6 125.4 ** 55.3 17.5 90.9 0.76 0.90 0.97 0.96
Semi-Arid Maiduguri 0.0 7.1 181.3 57.4 0.4 11.9 163.1 69.1 ** 67.6 �10.0 20.4 1.00 1.00 0.94 0.96
Note: DJF ¼ December, January, February; MAM ¼March, April, May; JJA ¼ June, July, August; and SON ¼ September, October, November.
T.V. Omotosho, C.O. Oluwafemi / Journal of Atmospheric and Solar-Terrestrial Physics 71 (2009) 830–840 833

Author's personal copyARTICLE IN PRESS
Fig. 2. Cumulative distribution of rainfall rates derived from TRMM Satellite for the 37 stations in Nigeria.
Table 3Correlation of the derived one-minute rainfall rates with other works.
Regions State capitals ITU-RP SG3
digital map
based data (A)
mm/h
Present work
based on
TRMM
3B43V6, data
(B) mm/h
Ajayi-Ezekpo
contour map
data (C) mm/h
Mean
differences in
region basis
(A) and (B)
mm/h
Mean
differences in
region basis
(C) and (B)
mm/h
Regional
correlation
coefficient of
(A) with (B)
Regional
correlation
coefficient of
(B) with (C)
South West Abeokuta 90.0 87.0 118.0
Adoekiti 93.0 92.0 117.0
Akure 95.0 94.0 116.0 3.5 27.0 0.91 0.17
Ibadan 96.0 93.0 117.0
Ikeja 88.0 79.0 116.0
Osogbo 98.0 94.0 117.0
South East Abakaliki 106.0 125.0 123.0
Akwa 96.0 11.0 122.0
Enugu 93.0 11.0 121.0 �18.6 3.8 0.98 0.87
Owerri 105.0 125.0 125.0
Umuahia 104.0 125.0 125.0
South South Asaba 99.0 112.0 124.0
Benin 100.0 105.0 123.0
Calabar 114.0 105.0 125.0
Port Harcourt 110.0 116.0 125.0 �8.2 10.2 0.09 0.58
Uyo 108.0 124.0 125.0
Yenagoa 106.0 124.0 125.0
Middle Belt Abuja 95.0 94.0 112.0
Ilorin 91.0 89.0 114.0
Lafia 87.0 89.0 115.0
Lokoja 79.0 93.0 118.0 �2.4 23.6 �0.2 0.41
Markurdi 88.0 94.0 117.0
Minna 91.0 84.0 112.0
Jos 86.0 91.0 111.0
North West Birini kebbi 84.0 67.0 92.0
T.V. Omotosho, C.O. Oluwafemi / Journal of Atmospheric and Solar-Terrestrial Physics 71 (2009) 830–840834
Author's personal copy
SW and (0.41) at the MB regions, due to high deminly contourlines of rainfall rates across the two regions. The overallcorrelation coefficients of the derived rainfall rates from all sitesbetween this present work and the ITU_RP SG3 digital maps is0.84, while with that of Ajayi-Ezekpo (1988) is 0.89. The work ofAjayi and Ezekpo was based on a 30-year data set, while thispresent work is based on a 9-year satellite data set. Long-termdata is expected to smoothen out large variations, and these willimprove agreement. The overall correlation coefficients of thederived rainfall rates from all sites between this present work andthe ITU_RP SG3 digital maps is 0.84, while with that of Ajayi-Ezekpo (1988) is 0.89.
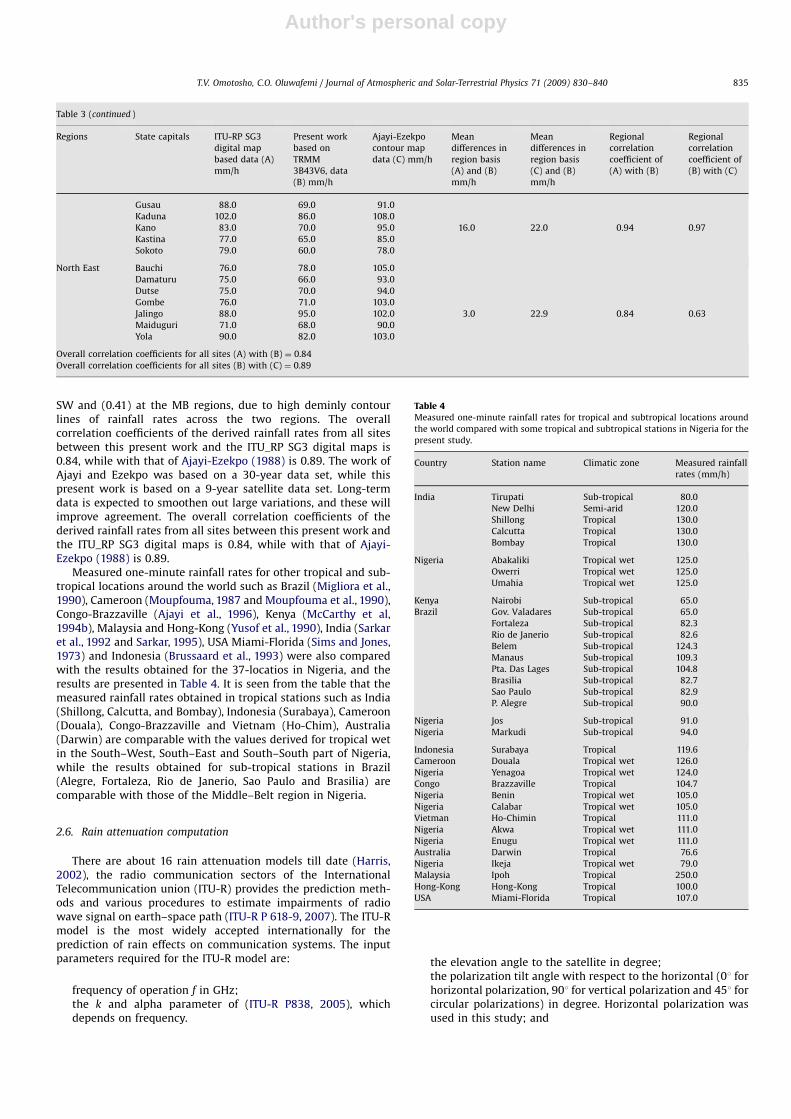
Measured one-minute rainfall rates for other tropical and sub-tropical locations around the world such as Brazil (Migliora et al.,1990), Cameroon (Moupfouma, 1987 and Moupfouma et al., 1990),Congo-Brazzaville (Ajayi et al., 1996), Kenya (McCarthy et al,1994b), Malaysia and Hong-Kong (Yusof et al., 1990), India (Sarkaret al., 1992 and Sarkar, 1995), USA Miami-Florida (Sims and Jones,1973) and Indonesia (Brussaard et al., 1993) were also comparedwith the results obtained for the 37-locatios in Nigeria, and theresults are presented in Table 4. It is seen from the table that themeasured rainfall rates obtained in tropical stations such as India(Shillong, Calcutta, and Bombay), Indonesia (Surabaya), Cameroon(Douala), Congo-Brazzaville and Vietnam (Ho-Chim), Australia(Darwin) are comparable with the values derived for tropical wetin the South–West, South–East and South–South part of Nigeria,while the results obtained for sub-tropical stations in Brazil(Alegre, Fortaleza, Rio de Janerio, Sao Paulo and Brasilia) arecomparable with those of the Middle–Belt region in Nigeria.
2.6. Rain attenuation computation
There are about 16 rain attenuation models till date (Harris,2002), the radio communication sectors of the InternationalTelecommunication union (ITU-R) provides the prediction meth-ods and various procedures to estimate impairments of radiowave signal on earth–space path (ITU-R P 618-9, 2007). The ITU-Rmodel is the most widely accepted internationally for theprediction of rain effects on communication systems. The inputparameters required for the ITU-R model are:
frequency of operation f in GHz;the k and alpha parameter of (ITU-R P838, 2005), whichdepends on frequency.
the elevation angle to the satellite in degree;the polarization tilt angle with respect to the horizontal (01 forhorizontal polarization, 901 for vertical polarization and 451 forcircular polarizations) in degree. Horizontal polarization wasused in this study; and
ARTICLE IN PRESS
Table 3 (continued )
Regions State capitals ITU-RP SG3
digital map
based data (A)
mm/h
Present work
based on
TRMM
3B43V6, data
(B) mm/h
Ajayi-Ezekpo
contour map
data (C) mm/h
Mean
differences in
region basis
(A) and (B)
mm/h
Mean
differences in
region basis
(C) and (B)
mm/h
Regional
correlation
coefficient of
(A) with (B)
Regional
correlation
coefficient of
(B) with (C)
Gusau 88.0 69.0 91.0
Kaduna 102.0 86.0 108.0
Kano 83.0 70.0 95.0 16.0 22.0 0.94 0.97
Kastina 77.0 65.0 85.0
Sokoto 79.0 60.0 78.0
North East Bauchi 76.0 78.0 105.0
Damaturu 75.0 66.0 93.0
Dutse 75.0 70.0 94.0
Gombe 76.0 71.0 103.0
Jalingo 88.0 95.0 102.0 3.0 22.9 0.84 0.63
Maiduguri 71.0 68.0 90.0
Yola 90.0 82.0 103.0
Overall correlation coefficients for all sites (A) with (B) ¼ 0.84
Overall correlation coefficients for all sites (B) with (C) ¼ 0.89
Table 4Measured one-minute rainfall rates for tropical and subtropical locations around
the world compared with some tropical and subtropical stations in Nigeria for the
present study.
Country Station name Climatic zone Measured rainfall
rates (mm/h)
India Tirupati Sub-tropical 80.0
New Delhi Semi-arid 120.0
Shillong Tropical 130.0
Calcutta Tropical 130.0
Bombay Tropical 130.0
Nigeria Abakaliki Tropical wet 125.0
Owerri Tropical wet 125.0
Umahia Tropical wet 125.0
Kenya Nairobi Sub-tropical 65.0
Brazil Gov. Valadares Sub-tropical 65.0
Fortaleza Sub-tropical 82.3
Rio de Janerio Sub-tropical 82.6
Belem Sub-tropical 124.3
Manaus Sub-tropical 109.3
Pta. Das Lages Sub-tropical 104.8
Brasilia Sub-tropical 82.7
Sao Paulo Sub-tropical 82.9
P. Alegre Sub-tropical 90.0
Nigeria Jos Sub-tropical 91.0
Nigeria Markudi Sub-tropical 94.0
Indonesia Surabaya Tropical 119.6
Cameroon Douala Tropical wet 126.0
Nigeria Yenagoa Tropical wet 124.0
Congo Brazzaville Tropical 104.7
Nigeria Benin Tropical wet 105.0
Nigeria Calabar Tropical wet 105.0
Vietman Ho-Chimin Tropical 111.0
Nigeria Akwa Tropical wet 111.0
Nigeria Enugu Tropical wet 111.0
Australia Darwin Tropical 76.6
Nigeria Ikeja Tropical wet 79.0
Malaysia Ipoh Tropical 250.0
Hong-Kong Hong-Kong Tropical 100.0
USA Miami-Florida Tropical 107.0
T.V. Omotosho, C.O. Oluwafemi / Journal of Atmospheric and Solar-Terrestrial Physics 71 (2009) 830–840 835

Author's personal copy
the altitude of the ground station above sea level in km;(see Appendix A for the procedure)
R0.01 point rainfall rate for the location of interest for 0.01% onan average year in mm/h. Table 3 shows the rainfall rate R0.01, foreach station for 0.01% on an average year (Omotosho, 2008). Thealtitudes of each station above sea level were derived fromGTOPO30 (NASA USA) with a Matlab program, while the zero-degree isotherm height for each station were derived from AIRSsatellite (5 years) data and rain height for each station werecomputed using ITU-RP 839 (2001) model, see Table 1. Theelevation and azimuthal angle to the Nigeria CommunicationSatellite-1 (NigComSat-1) in degree was estimated with a Matlabprogram. Other Matlab programs named EffPL, and RP618 werewritten to calculate the effective path length through rain and toimplement the ITU-R P 618-9, (2007) procedure. These Matlabprograms can be linked to Microsoft Excel and called as a functionto generate and plot results for frequencies between 10 and55 GHz.
3. Results
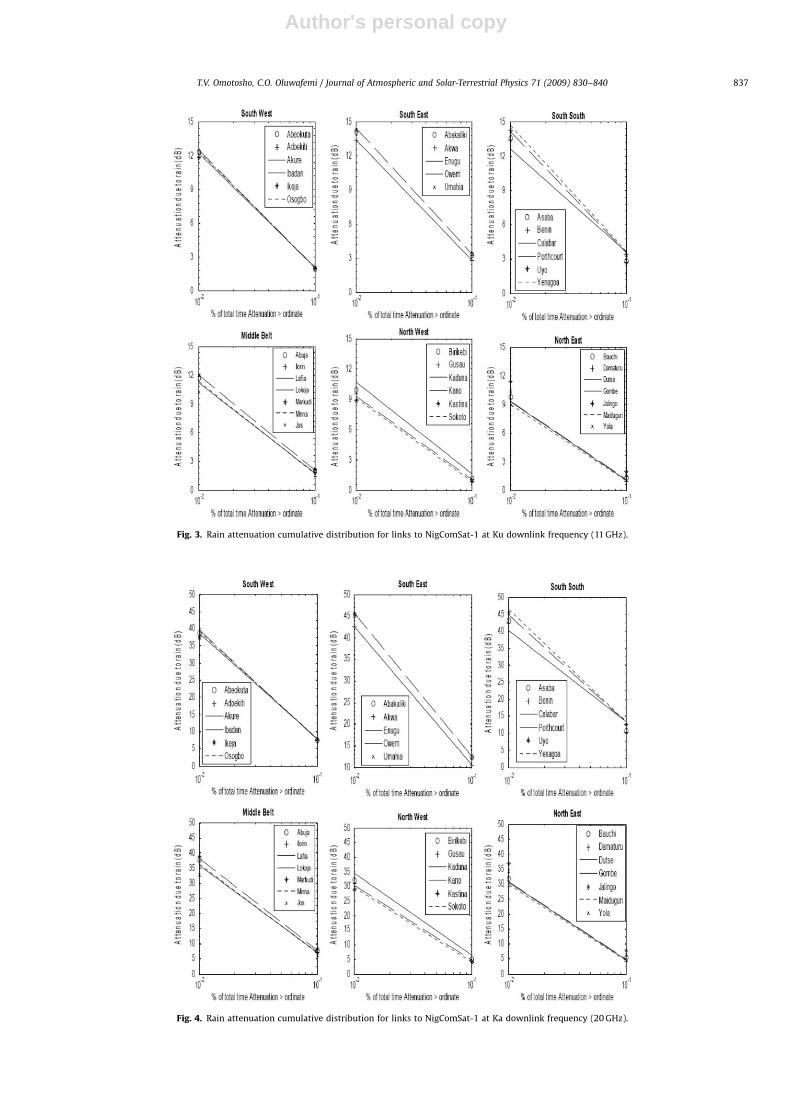
Table 5 shows some geometrical parameters relevant for linksto NigComSat-1 downlink frequencies at Ku, Ka and extended to Vbands (for future Nigerian communication satellite operating on aV-band) at the 37 stations. The elevation and azimuth angles toNigComSat-1 were calculated for each location (Rogers et al.,1997). The frequency-dependent effective path lengths throughthe rain-filled regions were also calculated for 0.01%unavailability. Figs. 3–5 show rain attenuation cumulativedistribution for links to NigComSat-1 downlink frequencies, forhorizontal polarization for a very small aperture terminal (VSAT)at Ku (11 GHz), Ka (20 GHz) and V-band (40 GHz) for 0.01–10%unavailability. At Ku-band downlink, Fig. 1 shows that 99.99%availability (about 53 min outage in a year ¼ 8.7 s outage per day)is possible in all the 37 stations in Nigeria, since NigComSat-1carries three Ku antenna spot beams of EIRP between 48 and52 dBW and rain attenuation for all the six regions ranges from8.8 dB in NE (Damaturu) to 15 dB in SS (Yenagoa). The antenna
ARTICLE IN PRESS
Table 5Some geometrical parameters relevant to NigComSat-1 at downlink frequencies at Ku, Ka and extended to V bands for future communication satellite at 0.01%
unavailability.
Regions State
capitals
Station
latitude
Station
longitude
Station
height
hS(km)
Rain
height
hR (km)
One-
minute
rain rate
R0.01(mm/h)
Dish
elevation
to satellite
Dish
azimulth
to satellite
Slant
path
length
Horizontal
projection
length
Effective path-length through rain
LS(km) LG(km) Ku_down
f ¼ 11 GHz
LE(km)
Ka_down
f ¼ 20 GHz
LE(km)
V_down
f ¼ 40 GHz
LE(km)
South
West
Abeokuta 7.07 3.21 0.074 4.77 87.0 44.4 261.2 6.71 4.80 1.92 3.91 4.90
Adoekiti 7.42 5.13 0.363 4.75 92.0 46.5 260.2 6.05 4.16 1.76 3.61 4.58
Akure 7.18 5.12 0.303 4.75 94.0 46.5 260.5 6.13 4.22 1.75 3.60 4.59
Ibadan 7.21 4.01 0.134 4.76 93.0 45.3 260.8 6.51 4.58 1.82 3.73 4.73
Ikeja 6.35 3.20 0.038 4.76 79.0 44.5 262.1 6.74 4.81 2.05 4.12 5.08
Osogbo 7.42 4.31 0.229 4.76 94.0 45.6 260.5 6.34 4.44 1.78 3.66 4.65
South
East
Abakaliki 6.18 8.70 0.149 4.77 125.0 50.7 260.6 5.97 3.78 1.45 3.15 4.24
Akwa 6.12 7.04 0.159 4.75 111.0 48.8 261.3 6.10 4.02 1.58 3.36 4.41
Enugu 6.24 7.24 0.139 4.75 111.0 49.0 261.0 6.11 4.01 1.58 3.36 4.42
Owerri 5.19 7.07 0.158 4.75 125.0 49.0 262.6 6.08 3.99 1.48 3.18 4.24
Umuahia 5.30 7.33 0.165 4.75 125.0 49.3 262.3 6.05 3.94 1.48 3.18 4.24
South
South
Asaba 6.10 6.44 0.152 4.74 112.0 48.2 261.5 6.15 4.10 1.57 3.33 4.39
Benin 6.22 5.39 0.042 4.74 105.0 47.1 261.7 6.41 4.37 1.68 3.53 4.57
Calabar 4.55 8.25 0.370 4.76 105.0 50.4 263.2 5.70 3.63 1.6 3.36 4.37
Port
harcourt
4.43 7.02 0.018 4.74 116.0 49.0 263.7 6.26 4.10 1.58 3.36 4.43
Uyo 5.00 7.57 0.163 4.75 124.0 49.6 262.7 6.02 3.90 1.48 3.18 4.25
Yenagoa 4.55 6.16 0.093 4.74 124.0 48.1 263.7 6.24 4.17 1.52 3.24 4.30
Middle
Belt
Abuja 9.04 7.28 0.334 4.76 94.0 48.5 257.2 5.91 3.92 1.68 3.52 4.53
Ilorin 8.32 4.34 0.304 4.78 89.0 45.4 259.3 6.29 4.41 1.82 3.72 4.69
Lafia 8.29 8.34 0.403 4.77 89.0 49.8 257.7 5.72 3.69 1.72 3.57 4.57
Lokoja 7.47 6.44 0.204 4.75 93.0 47.9 259.6 6.13 4.11 1.75 3.63 4.65
Markurdi 7.41 8.35 0.142 4.76 94.0 50.0 259.0 6.03 3.87 1.71 3.60 4.66
Minna 9.33 6.33 0.152 4.79 84.0 47.4 257.0 6.30 4.26 1.85 3.83 4.85
Jos 9.58 8.57 1.110 4.76 91.0 49.7 255.8 4.79 3.10 1.55 3.18 4.04
North
West
Birini
Kebbi
12.28 4.08 0.244 4.78 67.0 44.2 254.7 6.51 4.66 2.11 4.23 5.17
Gusau 12.18 6.27 0.440 4.78 69.0 46.5 253.6 5.98 4.12 1.98 4.00 4.94
Kaduna 10.32 7.25 0.605 4.77 86.0 48.1 255.5 5.60 3.74 1.71 3.53 4.48
Kano 11.56 8.26 0.566 4.77 70.0 48.8 253.2 5.59 3.68 1.9 3.86 4.80
Kastina 12.56 7.33 0.590 4.77 65.0 47.5 252.5 5.67 3.83 1.99 3.99 4.90
Sokoto 13.05 5.15 0.247 4.79 60.0 45.0 253.2 6.42 4.54 2.21 4.40 5.33
North
East
Bauchi 10.18 9.46 0.665 4.78 78.0 50.5 254.5 5.33 3.39 1.77 3.62 4.57
Damaturu 11.44 11.58 0.451 4.77 66.0 52.4 251.3 5.45 3.33 1.94 3.96 4.94
Dutse 11.43 9.25 0.452 4.78 70.0 49.9 252.8 5.66 3.64 1.91 3.91 4.88
Gombe 10.19 11.02 0.422 4.79 71.0 52.2 253.5 5.53 3.39 1.89 3.88 4.88
Jalingo 8.54 11.22 0.304 4.75 95.0 52.9 256.0 5.57 3.36 1.62 3.45 4.51
Maiduguri 11.51 13.09 0.343 4.78 68.0 53.9 250.0 5.49 3.24 1.91 3.95 4.98
Yola 9.07 12.24 0.207 4.77 82.0 53.9 254.5 5.65 3.33 1.77 3.73 4.80
T.V. Omotosho, C.O. Oluwafemi / Journal of Atmospheric and Solar-Terrestrial Physics 71 (2009) 830–840836
Author's personal copyARTICLE IN PRESS
Fig. 3. Rain attenuation cumulative distribution for links to NigComSat-1 at Ku downlink frequency (11 GHz).
Fig. 4. Rain attenuation cumulative distribution for links to NigComSat-1 at Ka downlink frequency (20 GHz).
T.V. Omotosho, C.O. Oluwafemi / Journal of Atmospheric and Solar-Terrestrial Physics 71 (2009) 830–840 837

Author's personal copy
spot beam (of 48–52 dBW) power is enough to overcomeattenuation due to rain at Ku-band. Measurements at Ku-bandwith INTELSAT VI at 11 GHz in Singapore, a tropical region likeNigeria (Timothy et al., 2000) shows several classes of rain fadelevels from 2 to 15 dB.
For the Ka-band downlink, the cumulative distribution of rainattenuations in Fig. 2 shows that 99.99% availability is possible inall the 37-locations in Nigeria. Rain attenuations at Ka-band in allthe 37 stations ranges from 28.9 to 46.4 dB, with NW regions(Kastina) being the lowest and SS regions (Yenagoa) the highest.The Ka-band antenna spot beam (EIRP) is between 52 and 55 dBWand allowances have to be made for other losses such as gas,scintillation, cloud, system loss, noise figure and free space loss,etc. The only practicable availability is 99.9% (0.1% unavailabilityand 8.76 h outage in a year) as the loss at this availability for alllocations is between 3.99 dB (in Kastina) to 13.47 dB (in Yenagoa).Studies on Ka-band rain attenuation with ACTS satellite (VSATbeacon receivers) for a 10-year period in the USA show that at Ka-band (27.5 GHz) under moderate elevation angles, rain attenua-tion exceeds 20 dB for 99.9% of a typical year and that fadingbecomes worse for low-elevations and for higher rainfall climatesin the US (Roberto, 1997).
For the V-band downlink, Fig. 3 shows that 99.99% availabilityis most improbable at all the 37 stations in Nigeria, as rainattenuation is between 79.2 and 121.7 dB. Availability level of99.9% is only practicable in the NW (except Kaduna) and the NE(except Jalingo and Yola), with attenuation between 14 and17.9 dB. There will be total fade out of signals during rain in the SS,SE, SW and MB regions at 99.9% availability as attenuation isbetween 20 and 41 dB. The only possible availability level for all
regions at V-band is 99.8% (17.52 h outage in a year ¼ 2.88 minoutage per day) as rain attenuation is between 6.3 dB (at Kastinaand Sokoto) and 24.1 dB (in Calabar). The V-band is still atexperimental stage and has not been commercialized. Measure-ment with ITALSAT (at a beacon frequency of 40 and 50 GHz)shows a minimum rain fade level (in 10 years of measurements) of
ARTICLE IN PRESS
Fig. 5. Rain attenuation cumulative distribution for links to NigComSat-1 at V downlink frequency (40 GHz).
Fig. 6. Pattern of rain impairment of satellite signal in the six regions in Nigeria.
Red ¼ very high, yellow ¼ high, green ¼medium, blue ¼ low attenuation.
T.V. Omotosho, C.O. Oluwafemi / Journal of Atmospheric and Solar-Terrestrial Physics 71 (2009) 830–840838

Author's personal copy
25 dB at 40 GHz (Van de Kamp and Castanet, 2002). Fig. 6 showsthe patterns and summaries of the impairment by rain in all thesix regions of Nigeria. The arrows point in the direction ofdecreasing effect of rain attenuation. A red arrow means very high,yellow high, green medium and blue low attenuation.
4. Conclusion
The effect of rainfall on fixed satellite service at Ku, Ka and Vbands has been investigated for links to Nigeria CommunicationSatellite one (NigComSat-1) based on local input data, for timeavailability of 99–99.99% (87.6 h to 53 min outage of signal) in anaverage year for 37 stations in Nigeria. The results reveal theregional patterns of rain impairment in Nigeria. In general,impairments decrease from the south to the north.
Acknowledgements
The support of NASA Goddard Space Flight Centre DistributedActive Archive Centre (DAAC) for sending 60 CDs, 1 data tape ofTRMM (50 GB of) data covering 1997–2006 and AIRS Satellite2002–2006, for Ph. D. research in satellite to ground radio wavespropagation modeling in Nigeria, is gratefully acknowledged.
Appendix A. : Calculation of long-term rain attenuation statisticsfrom point rainfall rate
The following ITU-RP 618, 2007 procedure provides estimatesof the long-term statistics of the slant-path rain attenuation at agiven location for frequencies up to 55 GHz. The followingparameters are required:
R0.01 point rainfall rate for the location for 0.01% of an averageyear (mm/h)
hs height above mean sea level of the earth station (km)y elevation angle (degrees)j latitude of the earth station (degrees)f frequency (GHz)Re effective radius of the Earth (8500 km) (Fig. A1)
Step 1: determination of the rain height, hR, as given inRecommendation ITU-R P.839.
Step 2: for yX51, the slant-path length, LS, below the rainheight is computed from
LS ¼ðhR � hSÞ
sin ykm (A.1)
For o51y, the following formula is used:
LS ¼2ðhR � hSÞ
ðsin2 yþ 2ðhR � hSÞ=ReÞ1=2þ sin y
km (A.2)
If hR�hSp0, then predicted rain attenuation for any timepercentage is zero and the following steps are not required.
Step 3: the horizontal projection, LG, of the slant-path length iscalculated from
LG ¼ LS cos ykm (A.3)
Step 4: the rainfall rate, R0.01, exceeded for 0.01% of an averageyear (with an integration time of 1 min) was obtained fromTRMM data. If R0.01 is equal to zero, the predicted rain attenuationis zero for any time percentage and the following steps are notrequired.
Step 5: obtain the specific attenuation, gR, using the frequency-dependent coefficients given in recommendation ITU-R P.838 andthe rainfall rate, R0.01, determined from Step 4, by using
gR ¼ kðR0:01ÞaðdB=kmÞ (A.4)
Step 6: the horizontal reduction factor, r0.01, for 0.01% of the timeis given by
r0:01 ¼1
1þ 0:78ffiffiffiffiffiffiffiffiffiffiffiffiffiffiffiLGgR=f
p� 0:38ð1� e�2LG Þ
(A.5)
Step 7: the vertical adjustment factor, v0.01, for 0.01% of the timeis given by
x ¼ tan�1 hR � hS
LGr0:01
� ��
For x4y,
LR ¼LGr0:01
cos ykm
Else,
LR ¼ðhR � hSÞ
sin ykm
ARTICLE IN PRESS
Fig. A1. Schematic presentation of an Earth–space path giving the parameters to be input into the attenuation prediction process.
T.V. Omotosho, C.O. Oluwafemi / Journal of Atmospheric and Solar-Terrestrial Physics 71 (2009) 830–840 839

Author's personal copy
If |j|o361,
w ¼ 36� jjj�
Else,
w ¼ 0�
v0:01 ¼1
1þffiffiffiffiffiffiffiffiffiffiffisin yp
ð31ð1� e�ðy=ð1þwÞÞÞ½ffiffiffiffiffiffiffiffiffiffiLRgR
p=f 2� 0:45�Þ
Step 8: the effective path length is
LE ¼ LRv0:01 km (A.6)
Step 9: the predicted attenuation exceeded for 0.01% of anaverage year is obtained from
A0:01 ¼ gRLE dB (A.7)
Step 10: the estimated attenuation to be exceeded for otherpercentages of an average year, in the range 0.001–5%, isdetermined from the attenuation to be exceeded for 0.01% foran average year
if pX1% or jjjX36� : b ¼ 0
if po1% and jjjo36� and yX25� : b ¼ �0:005ðjjj � 36Þ
Otherwise : b ¼ �0:005ðjjj � 36Þ þ 1:8� 4:25 sin y
AP ¼ A0:01p
0:01
� ��ð0:655þ0:033 lnðpÞ�0:045 lnðA0:01Þ�bð1�pÞ sin yÞdB (A.8)
Reference
Adeyewa, Z. Debo, Nakamura, Kenji, 2003. Validation of TRMM radar data overmajor climatic regions in Africa. J. Appl. Meteorol. Am. Metrol. Soc..
Ajayi, G.O., Ezekpo, S.U.B., 1988. Development of climatic maps of rainfall rate andattenuation for microwave applications in Nigeria. Niger. Eng. 23 (4), 13–30.
Ajayi, G.O., Feng, S., Radicella, S.M., Reddy B.M., 1996. Hand Book on radiopropagation related to satellite communications in tropical and sub-tropicalcountries UNESCO and ICTP, U. R. S. I Standing committee on developingcountries.
Brussaard, G., Dijk, J., Wijdemans, L., 1993. 11 GHz satellite Beacon Data in theWestern Pasific Basin, final report INTELSAT 770-B, Eindoven University ofTechnology and Surabaya Institute of Technology.
Chieko Ito, Yoshio Hosoya, 2002. The Thunderstorm ratio as a regional Climaticparameter: its effects on different-integration-time rain rate conversion, rainattenuation, site-diversity and rain depolarization. The proceedings of URSI2002, GA02 paper P0181.
Gibson, J.D. (Ed.), 2002. The Communication Handbook, second ed.. CRC Press, LCC,pp. 59-1–59-16.
Harris, R.A. (Ed.), 2002. COST Action 255, Radio waves Propagation Modeling forSATCOM Services at Ku-band and Above. European Space Agency publicationDivision Noordwijk, Netherlands.
Huffman, G.J., Alder, R.F., Rudolf, B., Schneider, U., Keehn, P.R., 1995. Globalprecipitation estimates based on a technique for combining satellite-based
estimates, rain gauge analysis, and NWP model information. J. Clim. 8,1284–1295.
Ippolito, L.J., 1986. Radio wave Propagation in Satellite Communication. VanNostrans, Reinhold, New York.
Ippolito, L.J., Bauer, R., 2000. Summary of ACTS propagation Experiment,Proceedings of Sixth Ka-band utilization conference, Cleveland Ohio.
ITU-R P 618-9, 2007. Propagation data and prediction methods required for thedesign of Earth–space telecommunication system.
ITU-R; Recommendation P.838, 2005. Specific attenuation model for rain used inprediction methods.
ITU-R; Recommendation P.839, 2001. Rain height model for prediction methods.Margarita, B.F., 2005. DSD variation on rain rate estimate algorithms of X-band
polarimetric and radar and rainfall characterization in tropical environmentsusing 2DVD, rain gauges and TRMM Data, M. Sc. Thesis University of PuertoRico.
McCarthy, D.K., Allnutt, J.E., Salazar, W.E., Omeata, E.C., Owolabi, B.R., Oladiran, T.,Ojeba, E.B., Ajayi, G.O., Raji, T.I., Zaks, C., 1994. Results of 11.6 GHz radiometricexperiment in Nigeria: second year. Electron. Lett. 30 (17).
McCarthy, D.K., Allnutt, J.E., Salazar, W.E., Sitati, R.w., Okoth, M., Mutungi, M.J.,Odhiambo, C.D., Zaks, C., 1994b. Results of an 11.6 GHz radiometric experimentin Kenya. Second Year Electron. Lett. 30 (17), 1450–1452.
Migliora, C.G.S., Pontes, M.S., Silva Mello, L.A.R. 1990. Rain rate and attenuationmeasurements in Brazil, Preprint of URSI Comm. F, Open symposium onregional factors in predicting radio wave attenuation due to rain, Rio deJaneiro, Brazil, pp. 8–13.
Moupfouma, F., 1987. Etude des precipitations et de leurs effects sur les liaisonshertziennes en visibility et par satellite dans les regions tropicales, These deDoctorat d Etat es-sciences physiques, CMET u Universite Paris Nord.
Moupfouma, F., Martin, M., Spanjaard, N., Hughes, K., 1990. Rainfall ratecharacteristics for microwave system in tropical and equatorial areas. Int.J. Satell. Commun. 8, 151–161.
Nirala, M.L., Cracknell, A.P., 2002. The determination of the three distribution ofrain from the tropical rainfall measuring mission (TRMM) precipitation radar.Int. J. Remote Sensing 23 (20), 4263–4304.
Omotosho, T.V., 2008. Studies of Propagation Impairments for Fixed SatelliteCommunication Links at the Microwave Frequencies in Nigeria, Ph. D. Thesis,(Unpublished) Department of Physics, Covenant University, Ota, Nigeria.
Rice, P.L., Holmberg, N.R., 1973. Cumulative time Statistics of Surface-point Rainfallrates. IEEE Trans. Com-21, 1131–1136.
Roberto J.A., 1997. Rain Fade Compensation Alternatives for Ka-band Communica-tion Satellite, Third Ka-band Utilization Conference Sorrento Italy.
Rogers, D.V., Ippolito, L.J., Davarian, F., 1997. System requirement for Ka-bandEarth–satellite propagation data. Proc. IEEE 1985, 810–820.
Sarkar, 1998. Some studies on attenuation and atmospheric water vapourmeasurement in India. Int. J. Remote Sensing 19 (3), 473–480.
Sarkar, S.K., Ahmed, I., Prasad, M.V.S.M., Dutta, H.M., Reddy, B.M. 1992. Rain ratedistribution over the Indian subcontinent—reference data manual.
Sarkar, S.K., 1995. Characterization of rain rate and water vapour for satellitecommunication, Hand Book on Radio propagation Related to satellitecommunications in Tropical and Subtropical countries UNESCO and ICTP, U.R. S. I, Standing committee on developing countries.
Sims, A.L., Jones, D.M.A., 1973. Climatology of instantaneous precipitationrates—Report AFCRL-TR-73-0171, National Technical Service (Springfeild, VA).
Timothy, K.I., Ong, J.T., Choo, E.B.L., 2000. Descriptive fade slope statistics onINTELSAT Ku-band communication link. Electron. Lett. 36 (20), 1733–1734.
Van de Kamp, Castanet, L., 2002. Fade Dynamics Review, In: Proceedings of theFirst International Workshop COST Action 280.
Yusof, M.A., Mohd, M., Hassan, S.I., 1990. Recommended conversion factors forMalaysian based on one year measured rainfall data. In: Proceedings of URSIComm. F, open sympt on regional factors in predicting radiowave attenuationdue to rain, Rio de Janeiro, Brazil, pp. 47–52.
ARTICLE IN PRESS
T.V. Omotosho, C.O. Oluwafemi / Journal of Atmospheric and Solar-Terrestrial Physics 71 (2009) 830–840840