Embed Size (px)
Citation preview

This article appeared in a journal published by Elsevier. The attachedcopy is furnished to the author for internal non-commercial researchand education use, including for instruction at the authors institution
and sharing with colleagues.
Other uses, including reproduction and distribution, or selling orlicensing copies, or posting to personal, institutional or third party
websites are prohibited.
In most cases authors are permitted to post their version of thearticle (e.g. in Word or Tex form) to their personal website orinstitutional repository. Authors requiring further information
regarding Elsevier’s archiving and manuscript policies areencouraged to visit:
http://www.elsevier.com/copyright

Author's personal copy
Evaluation of the Kinect� sensor for 3-D kinematic measurementin the workplace
Tilak Dutta*
Toronto Rehabilitation Institute, Technology R&D Team, 550 University Avenue, 13th Floor, Toronto, ON M5G 2A2, Canada
a r t i c l e i n f o
Article history:Received 23 March 2011Accepted 30 September 2011
Keywords:Portable motion captureKinectKinematics
a b s t r a c t
Recording posture and movement is important for determining risk of musculoskeletal injury in theworkplace, but existing motion capture systems are not suited for field work. Estimates of the 3-Drelative positions of four 0.10 m cubes from the Kinect were compared to estimates from a Viconmotion capture system to determine whether the hardware sensing components were sensitive enoughto be used as a portable 3-D motion capture system for workplace ergonomic assessments. The root-mean-squared errors (SD) were 0.0065 m (0.0048 m), 0.0109 m (0.0059 m), 0.0057 m (0.0042 m) inthe x, y and z directions (with x axis to the right, y axis away from the sensor and z axis upwards). Thesedata were collected over a range of 1.0e3.0 m from the device covering a field of view of 54.0 degreeshorizontally and 39.1 degrees vertically. Requirements for software, hardware and subject preparationwere also considered to determine the usability of the Kinect in the field.
� 2011 Elsevier Ltd and The Ergonomics Society. All rights reserved.
1. Background
Recording posture and movement is important for determiningrisk of musculoskeletal injury in the workplace (Vieira and Kumar,2004). Existing lab-based three-dimensional (3-D) motion capturesystems are of limited use for performing ergonomic assessmentsin the field. Both active (e.g. NDI; Waterloo, Ontario) and passive(e.g. Vicon Motion Systems; Los Angeles, California) video basedsystems are difficult to use in real-world applications due tocomplexity, bulk and space requirements (Best and Begg, 2006).Magnetic tracking systems (e.g. Polhemus; Colchester, Vermont)are not as bulky and require less space but they tend to have limitedaccuracy due to magnetic field distortions caused by large metalobjects common to industrial environments (Best and Begg, 2006).Inertial measurement systems (e.g. Xsens; Enschede, Netherlands)are a possible alternative for portable 3-D motion capture but arealso susceptible to measurement error due to nearby metal (Brodieet al., 2008). As a result of these limitations, task analysis in theworkplace is commonly limited to 2-D video analysis (Waters et al.,2006).
The Kinect� sensor add-on for the Xbox 360� video gameplatform (Microsoft; Redmond, Washington) may offer portable3-D motion capture capabilities that overcome the limitations of
existing systems. The Kinect was designed to allow users to interactwith the gaming system without the need for a traditional hand-held controller. Instead, the sensor recognizes the user’s gesturesand voice commands. The key to gesture recognition is the device’s“depth camera”which consists of an infrared laser projector and aninfrared video camera mounted within the sensor bar (Fig. 1). Thesystem uses the infrared camera to detect a speckle pattern pro-jected onto objects in the sensor’s field of view (Fig. 2). The Kinect isable to create a 3-D map of these objects by measuring deforma-tions in the reference speckle pattern. The sensor bar also housesa colour video camerawhich provides colour data to the depthmap.The sensor bar also contains an array of four microphones and isconnected to a motorized base that allows the sensor bar to betilted up and down. The technology was developed by PrimeSense(Tel-Aviv, Israel) and is disclosed in detail in their patents(Freedman et al., 2010; Shpunt, 2010; Spektor et al., 2010).
The Kinect may be a leap forward in 3-D motion capture tech-nology. If the Kinect sensor has comparable accuracy of existing lab-based systems, it will provide a compact, portable motion capturesystem allowing workplace ergonomic assessments to be donesimply and inexpensively. The objective of this work is to determinethe range, field of view and accuracy of the Kinect to allow occu-pational ergonomists to decide if the sensor could be used asa portable 3-D motion capture system for performing workplacebiomechanical assessments. A Vicon motion capture system wasused as a gold standard reference to determine the Kinect’s 3-Ddepth mapping capabilities. This initial investigation focused
* Tel.: þ1 416 597 3422x7956; fax: þ1 416 597 3027.E-mail addresses: [email protected], [email protected].
Contents lists available at SciVerse ScienceDirect
Applied Ergonomics
journal homepage: www.elsevier .com/locate/apergo
0003-6870/$ e see front matter � 2011 Elsevier Ltd and The Ergonomics Society. All rights reserved.doi:10.1016/j.apergo.2011.09.011
Applied Ergonomics 43 (2012) 645e649

Author's personal copy
mainly on the capabilities and characteristics of hardware sensingcomponents of the Kinect sensor, but some considerationwas givento the software, hardware and subject preparation requirementsthat would be needed to make it an effective motion capture tool.
2. Materials and methods
A Kinect sensor was connected to the USB port of a Dell XPS600desktop computer with 2GB ram, 2.8 GHz dual core Intel Pentiumprocessor running the Ubuntu 10.10 operating system. Data fromthe Kinect was collected using Kinect RGB Demo v0.3.0 software(Burrus, 2011). The software included drivers for communicatingwith the sensor via USB, a utility for calibrating the sensor as well asthe ability to save the 3-D image data and later export the data fromeach depth map to a text file. The Kinect sensor was calibratedusing an A3 size checkerboard pattern (printed and glued on a pieceof 0.005 m thick foamcore) as shown in Fig. 2. The checkerboardwas held in front of the sensor while its image was simultaneouslycaptured by the Kinect’s colour and depth cameras at 32 differentpositions. The calibration process removed lens distortion fromboth the colour and depth cameras as well as determined themapping between depth and colour images such that the colourimage could be overlaid on top of the depth image. The resulting
pixel projection error was found to be 0.942. A seven camera Viconmotion capture system (3 MX 3þ cameras and 4 MX 40þ camerasall collecting at 100 Hz) was also calibrated using a 0.390 m wand.
To create motion capture markers, white card stock was used toconstruct four 0.100 m cubes. A 0.100 m by 0.100 m square offlorescent green card stock was glued to the front face of each cubeand a 0.0254 m diameter reflective marker was attached to thecentre of the top face of each cube using double sided tape. Thesefour marker cubes were designed such that the front green facecould be tracked by the Kinect sensor while the reflective markercould be simultaneously tracked by the Vicon system. The Kinectsensor was located at a height of 0.50 m from the floor. Fig. 3 isa 3-D reconstruction, captured using the Kinect, that demonstrateshow the four markers were typically positioned. Three of themarkers were placed on the floor creating x and y axes (The x axis ispointed to the right of the origin marker and the y axis is pointedaway from the Kinect as shown in Fig. 4. Choosing a right handedcoordinate system resulted in the positive z axis pointing upwards).The x and y axis markers were each located 0.920 m away from theorigin marker. These three markers remained in the same fixedposition for the duration of the study. The fourth marker, or the“target”, was then consecutively placed at each of the black circleson the floor (shown in Fig. 4). The 3-D coordinates of all fourmarkers were recorded by the Vicon and the Kinect at each posi-tion. Next the target marker was mounted on top of a height-adjustable tripod using double sided tape. The target marker wasagain positioned over each of the black circles shown in Fig. 4 withthe height of the tripod set to 0.40 m, 0.80 m, 1.20 m and 1.70 m,and 3-D position data was collected for all markers with bothsystems. Microsoft specified the depth sensor range of the Kinect as1.2 m to 3.5 m (Play.com, 2010). Pilot testing found that the Kinectwas able to detect objects as close as 0.477 m. However, at thisdistance, the field of view was only w0.50 m wide and w0.37 mhigh, and therefore too small to be practical for data acquisition.This investigation tested the accuracy of the Kinect over the rangeof 1.0 m to 3.6 m (Fig. 4). The testing space was designed such thatthere would be enough space for a person to stand and performa stationary task in the resulting field of view.
In some cases, one of the origin, x or y axis markers wereoccluded by either the tripod or the target marker mounted on top
Fig. 1. The Kinect sensor bar shownwith laser light source, colour camera and infraredcamera.
Fig. 2. Speckle pattern from the Kinect’s laser projector on the checkerboard patternused for calibration (as seen by the infrared camera).
Fig. 3. A depth map showing locations of the reference coordinate axes cubes and thetarget marker (mounted on a tripod). Depths were recorded using the Kinect sensor.The black areas represent gaps in the depth map where light sent from the laserprojector was not reflected back to the Kinect’s infrared camera.
T. Dutta / Applied Ergonomics 43 (2012) 645e649646

Author's personal copy
of the tripod. In these cases, the tripod was moved slightly to oneside or the tripod’s height was adjusted to ensure all four targetswere visible to the Kinect sensors. In a number of cases the targetmarker was positioned outside the Kinect’s field of view. In thesecases no data was collected. In total, 104 different target markerpositions were collected with both the Vicon and Kinect systems.This investigation was limited to capturing markers in static posi-tions to avoid the need for synchronization of the Kinect and Viconsystems. The Vicon system acquired for one second (100 samples@100 Hz) for each target position. A 3-D depth map of the samemarker positions was also captured using the Kinect sensor withKinect RGB Demo v0.3.0 software (Burrus, 2011) and was subse-quently exported to a text file. Vicon Nexus 1.4.115 was used toprocess and export 3-D coordinates collected by the Vicon systemto a comma separated variable (.csv) file.
A custom Matlab program was written and used to read in anddisplay the Kinect depth map. The 3-D coordinates of the centre ofeach green face of the four target cubes were found. A coordinatetransformation was performed on the Kinect data so that thecoordinates of the target marker were determined relative to thethree axis markers. The custom Matlab program was also used toread in the Vicon coordinate data. The 100 samples for each markerwere averaged and again a coordinate transformation was per-formed to find the target marker coordinates relative to the axismarkers. Finally, the x, y and z coordinates determined by theKinect and Vicon system were compared by calculating the root-mean-squared (RMS) error between the two systems for each ofthe 104 different positions of the target marker using the Viconsystem as the gold standard.
A second coordinate transformation was done to shift the RMSerrors to a coordinate system with the Kinect located at the originas represented by x0, y0 and z0 in Fig. 4. This transformationwas doneto simplify the description of the results and discussion in thesections that follow.
3. Results and discussion
Stem plots of the RMS errors of the 104 data points collected bythe Vicon and Kinect systems are shown in Fig. 5. RMS errors in thex and y directions are shownwith respect to the x and y position inthe capture volume. RMS errors in the z direction are shown withrespect to their y and z positions in the capture volume.
3.1. Accuracy
The RMS errors (SD) were found to be 0.0169 m (0.0299 m),0.0348 m (0.0765 m) and 0.0141 m (0.0250 m) in the x, y and z
directions, respectively. As shown in Fig. 5aec, the largest errorswere measured for marker positions that were furthest away fromthe Kinect (large values of y). When points where y> 3.0 m weredisregarded, mean RMS errors (SD) dropped to 0.0074 m(0.0061 m), 0.0120 m (0.0112 m), 0.0074 m (0.0075 m) in the x, yand z directions, respectively (N¼ 67). Also, errors were found to beconsiderably larger when the fourth target camewithin 25 pixels ofthe edge of the depth image (when the absolute values of the x andz coordinates were large). These larger errors near the edges werelikely due to decreased coverage of the checkerboard near theedges of the depth image during calibration. Therefore, with pointswithin 25 pixels from any edge removed, the accuracy of the systemfurther increased. The RMS errors were reduced to 0.0065 m(0.0048 m), 0.0109 m (0.0059 m), 0.0057 m (0.0042 m) in the x, yand z directions, respectively (N¼ 60). It is possible these calibra-tion errors could be reduced with improved calibration techniques.
3.2. Effective field of view
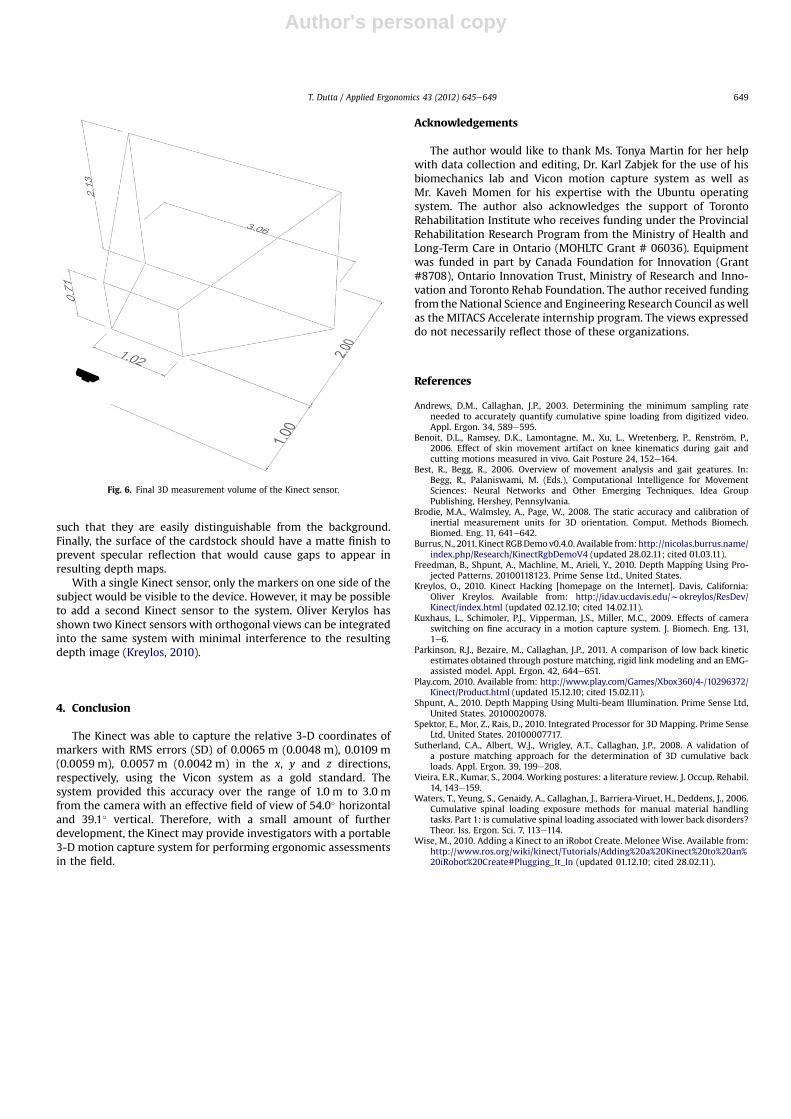
The field of view of the Kinect’s raw colour camera output was61.8� in the horizontal plane and 47.4� in the vertical plane. Thedepth sensor had a smaller field of view than the colour camera andtherefore defined the overall field of view of the systemwhich was58.6� and 43.6� in the horizontal plane and vertical planes,respectively. These measurements agreed well with Microsoft’sadvertised 57� and 43� horizontal and vertical fields of view(Play.com, 2010). However, the effective field of view decreased to54.0� horizontally and 39.1� vertically when the 25 pixel wideregions at the edges of the view were excluded as discussed insection 3.1. This effective field of view corresponds to the 3Dmeasurement volume shown in Fig. 6.
3.3. Object detection
Pilot testing indicated that detecting an object in front of theKinect was dependent on the reflectivity of the object’s surface. TheKinect had trouble detecting dark surfaces that absorbed light. Itwas also blind to shiny surfaces that resulted in specular reflectionand even rough surfaces if the angle of incidence of incoming lightwas too large. In all these cases, laser light sent from the laserprojector was not reflected back to the Kinect’s infrared cameraresulting in gaps in the 3-D reconstruction. The probability of anobject being detected by the Kinect decreased as the object wasmoved further from the sensor.
A related problem of poor object edge detection was also noted.Objects were often represented with ragged edges in the Kinect’s3-D reconstructions (as shown on the edge of the target marker inFig. 3). These ragged regions were typically 2e3 pixels wide in thedepth image. This indicated there was increased uncertaintyregarding the 3-D locations of object edges compared to the broaderflat areas of the object. This investigation was designed to avoidthese edge effects by determining the coordinates at the centre ofthe green face of the marker cube. Similar techniques could be usedfor data collection with human subjects as discussed in section 3.4.
3.4. Usability as a 3-D motion capture system
The results of this study indicated the accuracy of a Kinectmotion capture systemwould be at least an order of magnitude lessthan that of a Vicon system (Kuxhaus et al., 2009). However,considering skin movement artifacts can introduce errors as largeas 0.0161 m (Benoit et al., 2006), the Kinect’s accuracy may beacceptable as it falls in a similar range. Users may also considersacrificing some accuracy for portability. At the very least, theKinect would provide more information to investigators who
Fig. 4. Diagram of the target locations relative to the Kinect sensor as well as thecoordinate reference frames used for this study. All dimensions are in metres.
T. Dutta / Applied Ergonomics 43 (2012) 645e649 647

Author's personal copy
currently utilize posture matching techniques from 2-D videorecordings for their assessments using software like 3DMatch(Parkinson et al., 2011; Sutherland et al., 2008). Incorporating theKinect could dramatically reduce the amount of manual labourinvolved in binning postures for various body parts frame by frame.However, before the Kinect can be deployed in the field, a numberof practical usability issues must be addressed.
3.4.1. Software requirementsThe largest limitation to using the Kinect as a 3-Dmotion capture
system in its current form is the software interface. The softwareused for this investigation, Kinect RGB Demo v0.3.0, could be used fordata collection as it includes the ability to automatically capturedepth maps at 3 Hz. This frame rate has been shown to be sufficientfor analyzing work in industrial environments with posturematching software (Andrews and Callaghan, 2003). Howevera customapplication is needed to improve thedata processingphasebyautomating somepartswhich are repetitive and time consuming.Such an application could be developed easily. Another simpleimprovement would be to increase the capture speed beyond 3 Hz.Evenwith the existing Kinect RGB Demo software, the refresh rate isreported as>20 Hz. It is onlywhen these depthmaps are to be savedthat the rate drops to 3 Hz. This indicates that some coding effi-ciencies could easily increase the capture rate closer to 20 Hz.
3.4.2. Hardware requirementsThis investigation was done with the Kinect connected to
a desktop PC. However, pilot testing indicated that an Acer AspireOne D150-1358 netbook PC containing a 1.6GHz Intel Atom N270processor with 1GB RAM running Ubuntu 10.10 was also able tosupport data collection, though at a slower frame rate (w1 frameper second rather than 3). A faster laptop PC could easily provideequivalent if not better performance than our desktop PC andprovide a portable motion capture solution. For a fully portableand wireless embodiment, the 110 V AC power source wouldsimply need to be replaced with a battery capable of providing12 V DC at 1A as has been shown for robotics applications (Wise,2010).
3.4.3. Subject preparation for motion capture with the KinectThe Kinect’s limitations with surface and edge detection, dis-
cussed in section 3.3 above, can be minimized simply by usingmarkers of appropriate size made from appropriate materials. Itmay take some trial and error to find optimal methods for markerdesign and placement for usewith the Kinect. A reasonable startingpoint would be to attach 10 cmwide circular discs or squares madeof brightly coloured cardstock over a subject’s clothing. The point ofinterest on the subject’s body would be aligned with the centre ofthe coloured disc. The colour of these markers should be chosen
Fig. 5. a. Stem plot of RMS errors for the x coordinate plotted with respect to the x and y coordinates of the target marker position. ‘x’ stems represent discarded data points while ‘o’stems denote points that remain within the final 3D capture volume. b. Stem plot of RMS errors for the y coordinate plotted with respect to the x and y coordinates of the targetmarker position. ‘x’ stems represent discarded data points while ‘o’ stems denote points that remain within the final 3D capture volume. c. Stem plot of RMS errors for the zcoordinate plotted with respect to the y and z coordinates of the target marker position. ‘x’ stems represent discarded data points while ‘o’ stems denote points that remain withinthe final 3D capture volume.
T. Dutta / Applied Ergonomics 43 (2012) 645e649648
Author's personal copy
such that they are easily distinguishable from the background.Finally, the surface of the cardstock should have a matte finish toprevent specular reflection that would cause gaps to appear inresulting depth maps.
With a single Kinect sensor, only the markers on one side of thesubject would be visible to the device. However, it may be possibleto add a second Kinect sensor to the system. Oliver Kerylos hasshown two Kinect sensors with orthogonal views can be integratedinto the same system with minimal interference to the resultingdepth image (Kreylos, 2010).
4. Conclusion
The Kinect was able to capture the relative 3-D coordinates ofmarkers with RMS errors (SD) of 0.0065 m (0.0048 m), 0.0109 m(0.0059 m), 0.0057 m (0.0042 m) in the x, y and z directions,respectively, using the Vicon system as a gold standard. Thesystem provided this accuracy over the range of 1.0 m to 3.0 mfrom the camera with an effective field of view of 54.0� horizontaland 39.1� vertical. Therefore, with a small amount of furtherdevelopment, the Kinect may provide investigators with a portable3-D motion capture system for performing ergonomic assessmentsin the field.
Acknowledgements
The author would like to thank Ms. Tonya Martin for her helpwith data collection and editing, Dr. Karl Zabjek for the use of hisbiomechanics lab and Vicon motion capture system as well asMr. Kaveh Momen for his expertise with the Ubuntu operatingsystem. The author also acknowledges the support of TorontoRehabilitation Institute who receives funding under the ProvincialRehabilitation Research Program from the Ministry of Health andLong-Term Care in Ontario (MOHLTC Grant # 06036). Equipmentwas funded in part by Canada Foundation for Innovation (Grant#8708), Ontario Innovation Trust, Ministry of Research and Inno-vation and Toronto Rehab Foundation. The author received fundingfrom the National Science and Engineering Research Council as wellas the MITACS Accelerate internship program. The views expresseddo not necessarily reflect those of these organizations.
References
Andrews, D.M., Callaghan, J.P., 2003. Determining the minimum sampling rateneeded to accurately quantify cumulative spine loading from digitized video.Appl. Ergon. 34, 589e595.
Benoit, D.L., Ramsey, D.K., Lamontagne, M., Xu, L., Wretenberg, P., Renström, P.,2006. Effect of skin movement artifact on knee kinematics during gait andcutting motions measured in vivo. Gait Posture 24, 152e164.
Best, R., Begg, R., 2006. Overview of movement analysis and gait geatures. In:Begg, R., Palaniswami, M. (Eds.), Computational Intelligence for MovementSciences: Neural Networks and Other Emerging Techniques. Idea GroupPublishing, Hershey, Pennsylvania.
Brodie, M.A., Walmsley, A., Page, W., 2008. The static accuracy and calibration ofinertial measurement units for 3D orientation. Comput. Methods Biomech.Biomed. Eng. 11, 641e642.
Burrus, N., 2011. Kinect RGBDemov0.4.0. Available from:http://nicolas.burrus.name/index.php/Research/KinectRgbDemoV4 (updated 28.02.11; cited 01.03.11).
Freedman, B., Shpunt, A., Machline, M., Arieli, Y., 2010. Depth Mapping Using Pro-jected Patterns. 20100118123. Prime Sense Ltd., United States.
Kreylos, O., 2010. Kinect Hacking [homepage on the Internet]. Davis, California:Oliver Kreylos. Available from: http://idav.ucdavis.edu/wokreylos/ResDev/Kinect/index.html (updated 02.12.10; cited 14.02.11).
Kuxhaus, L., Schimoler, P.J., Vipperman, J.S., Miller, M.C., 2009. Effects of cameraswitching on fine accuracy in a motion capture system. J. Biomech. Eng. 131,1e6.
Parkinson, R.J., Bezaire, M., Callaghan, J.P., 2011. A comparison of low back kineticestimates obtained through posture matching, rigid link modeling and an EMG-assisted model. Appl. Ergon. 42, 644e651.
Play.com, 2010. Available from: http://www.play.com/Games/Xbox360/4-/10296372/Kinect/Product.html (updated 15.12.10; cited 15.02.11).
Shpunt, A., 2010. Depth Mapping Using Multi-beam Illumination. Prime Sense Ltd,United States. 20100020078.
Spektor, E., Mor, Z., Rais, D., 2010. Integrated Processor for 3D Mapping. Prime SenseLtd, United States. 20100007717.
Sutherland, C.A., Albert, W.J., Wrigley, A.T., Callaghan, J.P., 2008. A validation ofa posture matching approach for the determination of 3D cumulative backloads. Appl. Ergon. 39, 199e208.
Vieira, E.R., Kumar, S., 2004. Working postures: a literature review. J. Occup. Rehabil.14, 143e159.
Waters, T., Yeung, S., Genaidy, A., Callaghan, J., Barriera-Viruet, H., Deddens, J., 2006.Cumulative spinal loading exposure methods for manual material handlingtasks. Part 1: is cumulative spinal loading associated with lower back disorders?Theor. Iss. Ergon. Sci. 7, 113e114.
Wise, M., 2010. Adding a Kinect to an iRobot Create. Melonee Wise. Available from:http://www.ros.org/wiki/kinect/Tutorials/Adding%20a%20Kinect%20to%20an%20iRobot%20Create#Plugging_It_In (updated 01.12.10; cited 28.02.11).
Fig. 6. Final 3D measurement volume of the Kinect sensor.
T. Dutta / Applied Ergonomics 43 (2012) 645e649 649