Embed Size (px)
Citation preview
London Borough of Camden
Regeneration and Planning
Authority Monitoring Report 2017/18
Image: King’s Cross Central development March 2018.
Planning Policy Team
LB Camden, 2019

Camden Authority Monitoring Report 2017/18
2
Contents
Introduction ................................................................................................................... 4
Policy documents .......................................................................................................... 6
Partnership working and Duty to Co-operate ................................................................. 8
Development Management statistics ........................................................................... 11
Housing....................................................................................................................... 13
1. Housing trajectory 13 2. Net additional dwellings – in previous years 13 3. Net additional dwellings – for the reporting year 13 4. Net additional dwellings – in future years (including five-year housing land
supply) 14 5. Managed delivery target 14 6. Affordable housing completions 22 7. Completed non-self contained homes by type (student accommodation and
hostels) 24 8. Mix of dwelling sizes in developments 25 9. Vacant dwellings 29 10. Net additional Gypsy and Traveller pitches 29 11. Number and proportion of permitted wheelchair homes 30 12. Permitted development change of use from office to residential 31 13. Housing Quality – Building for Life Assessments 32
Employment ................................................................................................................ 35
14. Employment floorspace completed 35 15. Employment land available 36 16. Jewellery workshops in Hatton Garden 39 17. Change in VAT registered businesses 40 18. Local training scheme places achieved from completed development 40
Town Centres and retail .............................................................................................. 42
19. Vacancy in shopping streets 42 20. Retail and food, drink and entertainment uses in shopping streets 44 21. Retail and food, drink and entertainment floorspace completed 47 22. Hotel accommodation 49
Sustainable development ............................................................................................ 50
23. Sustainable design assessment, BREEAM, BREEAM non-domestic refurbishment 50
24. Energy 51 25. Sustainable urban drainage systems (SUDS) 52 26. Air Quality 53 27. Open spaces and nature conservation sites 59 28. Areas of biodiversity importance 62 29. Safeguarding of the Regis Road waste site 63 30. Municipal waste arisings and household recycling rates 64
Transport .................................................................................................................... 65
31. Proportion of the population travelling to work on foot or bicycle 65
Camden Authority Monitoring Report 2017/18
3
32. Traffic flows 66 33. Car free and car capped developments 67 34. Travel Plans 68
Heritage ...................................................................................................................... 70
35. Heritage at risk 70
Basements .................................................................................................................. 72
36. Basements 72 37. Basement schemes with SUDS 73
Planning obligations (Section 106 agreements) .......................................................... 74
38. Section 106 agreements signed 74 39. Section 106 financial activity 74
Infrastructure ............................................................................................................... 75
40. Delivery of identified infrastructure projects (Appendix 1 of the Local Plan) 75

Camden Authority Monitoring Report 2017/18
4
Introduction
Under the Planning regulations local planning authorities must publish information that:
shows how the implementation of their adopted plans is progressing
reports on local plan preparation
reports any activity relating to the duty to co-operate
provides up-to-date information on neighbourhood plans.
Every year Camden Council monitors and analyses the performance of its planning policies and progress on planning policy documents, publishing the details in the Authority Monitoring Report (AMR). This AMR reports on the period 1 April 2017 to 31 March 2018.
The Council adopted the new Camden Local Plan in July 2017 and this monitoring report assesses the performance of the policies in the Local Plan.
We monitored 40 indicators in 2017/18 to track our performance against our planning policies. Where possible we link indicators to existing planning policies and targets, although not all indicators are directly related to planning activity. Some, such as air quality and recycling indicators, monitor the significant effects of activities on which planning has limited influence but which nevertheless provide an insight into the borough and its environment.
Key Trends
Housing
In 2017/18, 945 net additional self-contained homes and net loss of 91 hostel/student bedrooms were completed (854 net completions) in the borough falling short of our Local Plan yearly target of 1,120. During 2017/18 the number of long term vacant homes has also increased by 91. Camden’s five-year supply of deliverable sites for housing amounts to 6,308 homes (or circa 1,262 homes per year). This exceeds our target of 1,120 homes per year for 2016-2031 as set out in the adopted Camden Local Plan and target of 1,176 homes per year for the next five years (with a 5% buffer) as adjusted in line with the National Planning Policy Framework.
In 2017/18, 252 net affordable dwellings were completed comprising 27% of all net additional self-contained homes completed in the borough. This is below Camden’s overall target for 50% of housing to be provided as affordable housing. However, it should be noted that the proportion of affordable housing completions varies greatly year on year due to affordable housing primarily being provided through the completion of a relatively small number of large schemes. In addition to the completion of affordable homes, the Council also secured £2.9m of affordable housing contributions in 2017/19 to be used towards building or enabling development of more affordable homes.
Employment floorspace
In 2017/18 a total 32,173 sqm of B1 floorspace was completed and 24,812 sqm was lost resulting in a net gain of 7,361 sqm. The vast majority of this change was in B1(a) office use class and permitted development rights allowing change of use of office premises into C3 residential without the need for a planning permission resulted in the loss of 264 sqm which is much less when compared to losses of 30,000 sqm in 2016/17. (The Council has introduced Article 4 Directions to remove this right - see para 12.8.) Of the schemes completed in 2017/18 a total of 28 resulted in a loss of B1 and 12 resulted in a gain.
Camden Authority Monitoring Report 2017/18
5
Camden has a significant supply of office floorspace projected for development with 383,411 sqm net additional office floorspace expected to be created over the next five to ten years. The majority of this floorspace will be provided at King’s Cross Central.
The last five years have seen a gradual conversion of industrial and storage and distribution space to other uses. In 2017/18 this trend continued with small losses in both B2 industrial floorspace and B8 storage and distribution floorspace.
Permitted development rights to allow a change of use from B1(a) offices to C3 residential which came into force on 30 May 2013 was removed by camden via the introduction of Article 4 Direction on 31 March 2017. Between those dates total of 74 conversions from office to residential were completed under the permitted development right, resulting in a loss of 44,686 sqm of office floorspace and providing 613 homes.
Town centres and retailing
Vacancy rates were on a downward trend between 2012 (7.7%) and 2015 where it reached 5%. The percentage of vacant premises have increased in the last three years from 5.2% in 2016 to 6.1% in 2018. However, Camden’s vacancy rate is still low compared to the England’s average of 11.2%.1
In the period 2007 to 2011, following the economic downturn, the proportion of food, drink, and entertainment uses on protected frontages in Camden increased, and the proportion of A1 shops decreased. Since 2011 the proportion of A1 shops in creased from 45% to 47% in 2014 and down to 41% in 2018. In 2017/18, 41% of the premises across Camden's designated centres were A1 shops, 24% were food, drink, and entertainment uses (A3, A4, A5), with the remaining 36% comprising all other uses.
Sustainable development
In 2017/18 the majority of new developments met their targets for sustainable design and construction. All of permitted schemes that would result in a net increase of 500sqm or more non-residential floorspace included a predicted BREEAM rating within their overall sustainability assessment. 5 of the schemes had a predicted rating of Excellent and 2 had a predicted rating of outstanding.
Transport
There has been a considerable change in transport modes used within the borough over recent years, with a clear decrease in car usage and increase in bicycle travel. In the period 2009 to 2018 cycle flows increased from 10% to 15% of the proportion of traffic. During the same time period, all motorised traffic has decreased, including motorcycle traffic by 21 percent, car traffic by 8 percent, taxis by 39 percent, and goods vehicles by 5 percent, and bus/coach traffic by 11 percent.
Heritage
Buildings at Risk are listed buildings which are in a poor condition and often, but not necessarily, vacant. They are in need of repair and, if vacant, need to be put to a suitable use. In 2017/18, five buildings in Camden were removed from the register as a result of repairs or being brought back into use and two new entries were added.
1 Local Data Company, http://blog.localdatacompany.com/infographic-retail-leisure-trends-in-h1-2017-turning-point
Camden Authority Monitoring Report 2017/18
6
Policy documents
Planning policy documents being prepared or recently adopted
This section provides an update on the progress of all planning policy documents being prepared or recently adopted in relation to the indicative timetables in the 2016 Local Development Scheme.
Local Plan
In July 2017 the Council adopted the Camden Local Plan to ensure the borough has robust and up-to-date planning policies to deliver sustainable growth, sustainable communities and other local priorities. The Local Plan then replaced the Camden Core Strategy and the Development Policies documents.
Further details are available at: www.camden.gov.uk/localplan
North London Waste Plan
The seven North London Local Planning Authorities of Barnet, Camden, Enfield, Hackney, Haringey, Islington and Waltham Forest (‘North London Boroughs’) are working together to prepare the North London Waste Plan.
The North London Waste Plan (NLWP) will set out the planning framework for waste management in the North London Boroughs for the next 15 years. It will identify sites for waste management use and set out policies for determining waste planning applications.
The pre-submission (Regulation 19) version of the NLWP was consulted on between March and April 2019. Submission is expected to take place in summer 2019 and the examination in late 2019. The Plan is expected to be adopted in 2020. For further details
please visit: www.nlwp.net
Community Infrastructure Levy (CIL) Charging Schedule
Camden’s CIL Charging Schedule was adopted by the Council in March 2015 and came into force in April 2015 when the CIL commenced. The schedule was adopted in accordance with the timetable set out in the LDS. During 2017/18 approximately £4.3 million of CIL for Camden was received by the Council, 70% of which will be spent on strategic infrastructure projects (‘strategic CIL’) and 25% will be spent in the local area to the development (‘local CIL’). The remaining 5% will be used to cover the costs of collecting and administering the CIL. For further details please visit: www.camden.gov.uk/cil
Camden Planning Guidance
Camden Planning Guidance (CPG) is a series of documents that provide further advice and information on how we will apply our planning policies.
Following the adoption of the Local Plan in July 2017, we have started a review of all the Camden Planning Guidance documents in order to ensure up to date advice and to support the effective delivery of the Local Plan policies. Phase 1 CPG documents were adopted by the Council in March 2018. Phase 2 CPG documents were adopted by the Council in March 2019.
For further details please visit www.camden.gov.uk/cpg

Camden Authority Monitoring Report 2017/18
7
Statement of Community Involvement
The SCI sets out how the Council involves local people when considering planning applications and preparing our planning policies. The SCI was updated to reflect the impacts of the Council’s financial strategy and the opportunities that have arisen from increased electronic working practices. The current SCI was adopted in July 2016.
Current planning documents
The current statutory development plan for Camden, which forms the starting point our planning decisions consists of the following documents:
Camden Local Plan (July 2017)
Fitzrovia Area Action Plan (March 2014)
Euston Area Plan (January 2015)
Camden Site Allocations (September 2013)
Fortune Green and West Hampstead Neighbourhood Plan (September 2015)
Kentish Town Neighbourhood Plan (September 2016)
Highgate Neighbourhood Plan (September 2017)
Hampstead Neighbourhood Plan (October 2018)
London Plan (2016)
In addition, we have produced additional planning policy documents (known as supplementary planning documents or SPDs) to provide further guidance on our approach to specific topics, areas or sites. Along with the Local Plan 2017 and London Plan they make up Camden’s Development Plan, the group of documents that set out our planning strategy and policies. Our current supplementary planning documents are listed below.
Camden Goods Yard Planning Framework (July 2017)
Mount Pleasant SPD (February 2012)
King’s Cross Opportunity Area Planning and Development Brief (January 2004)
Camden Authority Monitoring Report 2017/18
8
Partnership working and Duty to Co-operate
Partnership working
The Council actively seeks to work in partnership with the Mayor of London/GLA, neighbouring authorities and other stakeholders, to deliver planning and regeneration outcomes.
The North London Waste Plan is being prepared by the seven boroughs within the North London Waste Authority, comprising Camden, Barnet, Enfield, Hackney, Haringey, Islington and Waltham Forest.
Neighbourhood planning
Neighbourhood plans are planning documents, prepared by the community, supported by the Council, to influence the future of their area by setting out their vision and general planning policies to shape and direct development in their neighbourhood.
Neighbourhood plans have to be in line with the overall strategic approach in Camden’s existing adopted plans and national policy. Once communities interested in neighbourhood planning have both their area and forum designated by the Council they can start the process of preparing a neighbourhood plan for their area.
As of March 2018 there were eleven designated neighbourhood areas and forums and one designated area in the borough, these are:
Camley Street
Church Row and Perrins Walk
Dartmouth Park
Fitzrovia East (area only)
Fortune Green and West Hampstead
Hampstead
Highgate (also covers part of Haringey)
Kilburn (also covers part of Brent)
Kentish Town
Mount Pleasant (with Islington)
Redington and Frognal
Somers Town
Neighbourhood Forums are valid for 5 years from the date of designation. When the five years are up forums need to be redesignated if they are to continue working on neighbourhood planning matters. To be redesingated a forum needs to demonstrate that they continue to meet the requirements set out in legislation.
Camden have adopted (‘made’) four Neighbourhood Plans, following independent examinations and public referendums:
Fortune Green and West Hampstead Neighbourhood Plan (September 2015)
Kentish Town Neighbourhood Plan (September 2016)
Highgate Neighbourhood Plan (September 2017)
Hampstead Neighbourhood Plan (October 2018)
Camden Authority Monitoring Report 2017/18
9
During this period the Council continued to work with LB Haringey to support the delivery of the Highgate Neighbourhood Plan which was adopted in 2017. The Forum was redesignated in March 2018, following a statutory consultation period (15 January and 26 February 2018) and was approved by both Councils.
The Council continued to work with LB Islington to support the Mount Pleasant Forum and area which covers parts of Camden and Islington, including support on preparing an initial draft neighbourhood plan.
The Council also continued to work with LB Brent to support the Kilburn Neighbourhood Forum.
Duty to co-operate
Under the Localism Act 2011, councils are required “to engage, constructively, actively and on an ongoing basis” with neighbouring planning authorities and a list of prescribed bodies in the preparation of development plan and other local development documents concerning matters of strategic significance’. The prescribed bodies include:
The Environment Agency,
Historic England,
Natural England,
The Mayor of London,
The Civil Aviation Authority,
The Homes and Communities Agency,
NHS (Joint Commissioning Bodies),
Office of Rail Regulation,
The Highways Agency,
Transport for London,
Integrated Transport Authorities,
Highways Authorities, and
The Marine Management Organisation.
(Prescribed in Regulation 4. of the Town and Country Planning (Local Planning) (England) Regulations 2012)
The Council maintains a full record of Duty to Co-operate actions which is presented at public examinations for the preparation of all relevant documents. A list of key Duty to Co-operate actions for the reporting year is set out below.
Duty to co-operate actions 2017/18
Key actions included:
Meetings with GLA and London Councils to discuss the SHMA feeding into the London Plan update. (May 2017)
Met with GLA and education providers at Academic Forum to discuss issue of student housing. ( July 2017)
Met with the GLA to discuss general strategic issue arising from their City for all Londoners consultations. (May 2017)
Joint meeting with Camden, Corporation of City of London, Westminster and Kensington and Chelsea (June 2017) to key discuss strategic issues.

Camden Authority Monitoring Report 2017/18
10
Officers regularly attended ALBPO meetings with London authorities to discuss general strategic issues including SHLAA matters, housing initiatives, brownfield register and London Plan updates
Note: Meetings with our neighbouring authorities were undertaken both immediately before and after this review period.
North London Waste Plan
The North London boroughs of Barnet, Camden, Enfield, Hackney, Haringey, Islington and Waltham Forest are working together as planning authorities to prepare the North London Waste Plan (NLWP). The boroughs have a duty to co-operate with waste planning authorities (WPAs) where there is a “significant impact” on the area where the waste is received.
During 2017/18 the North London boroughs continued working together on the NLWP, with WPAs who receive ‘significant’ waste exports from north London and with other prescribed bodies. The North London boroughs regularly attended regional waste planning forums in London and the wider South East.
Camden Planning Guidance
Following the adoption of the Local Plan, the Council's Camden Planning Guidance documents required updating. This is being carried out in two phases. The first phase included updating CPG 4 Basements, CPG 5 Town centres, parts of CPG 2 -Housing, CPG6 Amenity and CPG 8 Planning obligations. Consultation was undertaken on updated CPG drafts in Nov 2017 – Jan 2018.
As part of consultations for changes to Camden Planning Guidance 2017/18 emails were sent to all Councillors, statutory consultees and individuals and groups on our planning policy database. This database comprises people who have previously commented on planning policy matters (including Camden Planning Guidance) and
other interested parties who have requested email notifications we also consulted all
neighbouring authorities (Barnet, Brent, City of London, Haringey, Islington and
Westminster).
Neighbourhood Planning
Although the statutory duty to co-operate does not apply for neighbourhood plans, Camden has a number of designated cross boundary neighbourhood areas and the Council therefore works closely with relevant neighbouring boroughs in providing support and advice to cross boundary forums.
This includes with LB Brent in the Kilburn Neighbourhood Planning Area, LB Haringey in the Highgate Neighbourhood Area and LB Islington in the Mount Pleasant Area.

Camden Authority Monitoring Report 2017/18
11
Development Management statistics
In 2017/18 Camden approved 76% of all planning applications. Major developments comprised less than 1% of all applications.
Table 1. Planning decisions – all applications 2007/08-2017/18
Period Decisions % of total Granted % granted
2007/08 3,357 100% 2,784 83%
2008/09 2,884 100% 2,467 86%
2009/10 2,644 100% 2,278 86%
2010/11 3,320 100% 2,880 87%
2011/12 3,372 100% 2,958 88%
2012/13 3,409 100% 2,843 83%
2013/14 4,019 100% 3,152 78%
2014/15 4,399 100% 3,333 76%
2015/16 4,466 100% 3,288 74%
2016/17 4,544 100% 3,390 75%
2017/18 3,804 100% 2,903 76%
Source: Development Management, RPT5, LB Camden
Table 2. Planning decisions – major applications 2007/08-2017/18
Period Decisions % of total Granted % granted
2007/08 30 0.90% 15 50%
2008/09 28 1.00% 19 68%
2009/10 45 1.70% 32 71%
2010/11 68 2.00% 54 79%
2011/12 42 1.20% 32 76%
2012/13 55 1.61% 42 76%
2013/14 59 1.47% 35 59%
2014/15 70 1.59% 61 87%
2015/16 41 0.92% 37 90%
2016/17 49 1.08% 41 84%
2016/17 33 0.87% 30 91%
Source: Development Management, RPT5, LB Camden

Camden Authority Monitoring Report 2017/18
12
Table 3. Planning decisions – minor applications 2007/08-2017/18
Period Decisions % of total Granted % granted
2007/08 907 27% 708 78%
2008/09 777 27% 649 84%
2009/10 868 33% 751 87%
2010/11 1,383 42% 1,187 86%
2011/12 1,459 43% 1,247 85%
2012/13 1,527 45% 1,230 81%
2013/14 1,511 38% 1,142 76%
2014/15 1,640 37% 1,167 71%
2015/16 1,717 38% 1,186 69%
2016/17 1,747 38% 1,205 69%
2017/18 1,434 38% 995 69%
Source: Development Management, RPT5, LB Camden
Table 4. Planning decisions – other applications 2007/08-2017/18
Period Decisions % of total Granted % granted
2007/08 2,420 72% 2,061 85%
2008/09 2,079 72% 1,799 87%
2009/10 1,731 65% 1,495 86%
2010/11 1,869 56% 1,639 88%
2011/12 1,871 55% 1,679 90%
2012/13 1,827 54% 1,571 86%
2013/14 2,449 61% 1,975 81%
2014/15 2,689 61% 2,105 78%
2015/16 2,708 61% 2,065 76%
2016/17 2,748 60% 2,144 78%
2017/18 2,337 61% 1,878 80%
Source: Development Management, RPT5, LB Camden

Camden Authority Monitoring Report 2017/18
13
Housing
The Council’s planning policy documents seek to make full use of Camden’s capacity for housing to establish a supply that reflects demand and provides a broad range of homes, with particular emphasis on securing affordable housing. In addition to meeting or exceeding Camden’s housing targets, the Council seeks to ensure that new homes are built to a high standard and provide well-designed accommodation that meets the needs of a range of occupiers.
The following housing indicators seek to monitor past and projected housing delivery against our housing targets.
1. Housing trajectory
OBJECTIVE Meeting the housing needs of Camden’s population
TARGET See housing trajectory
TARGET MET Yes
RELATED POLICIES
H1 Maximising housing supply H2 Maximising the supply of self-contained housing from mixed-use schemes H3 Protecting existing homes
2. Net additional dwellings – in previous years
OBJECTIVE Meeting the housing needs of Camden’s population
TARGET Relevant housing targets for the preceding 5 years
TARGET MET Yes
RELATED POLICIES
H1 Maximising housing supply H2 Maximising the supply of self-contained housing from mixed-use schemes H3 Protecting existing homes
3. Net additional dwellings – for the reporting year
OBJECTIVE Meeting the housing needs of Camden’s population
TARGET 1,120 net additional homes (including conventional homes and non-self contained homes)
TARGET MET Target not met. 854 additional homes were completed in total (945 additional self-contained homes completed, net loss of 91 non-self contained homes). There was also an increase in the number of long term vacant homes by 96. Please see tables 5 and 14 for further details
RELATED POLICIES
H1 Maximising housing supply H2 Maximising the supply of self-contained housing from mixed-use schemes H3 Protecting existing homes

Camden Authority Monitoring Report 2017/18
14
4. Net additional dwellings – in future years (including five-year housing land supply)
OBJECTIVE Meeting the housing needs of Camden’s population
TARGET 11,200 homes between 2016 and 2026 (Local Plan target)
TARGET MET On course to meet these targets
RELATED POLICIES
H1 Maximising housing supply H2 Maximising the supply of self-contained housing from mixed-use schemes H3 Protecting existing homes
5. Managed delivery target
OBJECTIVE Meeting the housing needs of Camden’s population
TARGET To keep the annual managed delivery requirement below the annual housing target set by the London Plan
TARGET MET On course to meet overall target.
RELATED POLICIES
H1 Maximising housing supply H2 Maximising the supply of self-contained housing from mixed-use schemes H3 Protecting existing
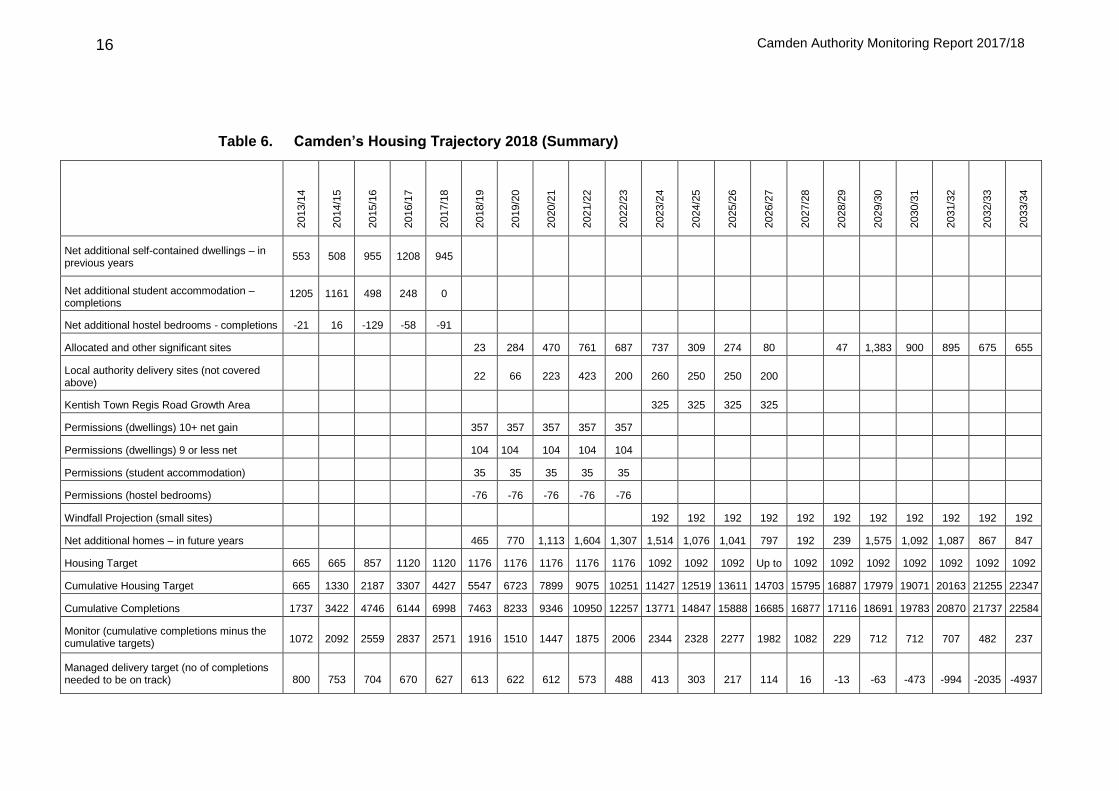
5.1. The housing indicators above (indicators 1 to 5) are included in the Council’s housing trajectory which is presented in Table 6 and Figure 1 below. The Council produces and updates a housing trajectory each year as part of the Authority Monitoring Report. It shows how sites are expected to come forward to deliver self-contained homes over the next 15 years, and measures Camden's anticipated performance against our monitoring target for additional homes. The housing trajectory relates to the creation of conventional self-contained homes and non-self contained dwellings through the planning process. The 2011 London Plan annual target for 2011 - 2021 was 665 homes (500 conventional self-contained and 165 non-self contained). This target was later updated by the Further Alterations to the London Plan adopted in March 2015 to an annual monitoring target of 889 homes between 2015/16 and 2024/25, made up of 742 self-contained homes, 116 non-self-contained homes and 32 long term vacant homes returning to use. With the adoption of the Camden Local Plan the borough monitoring target is 1,120 homes per year between 1 April 2016 and 31 March 2026. During 2017/18, there was a net increase of 854 homes from completions (945 additional conventional self-contained homes, loss of 91 non-self contained homes), falling short of the Local Plan and London Plan targets. There was also an increase in the number of long term vacant homes by 96).
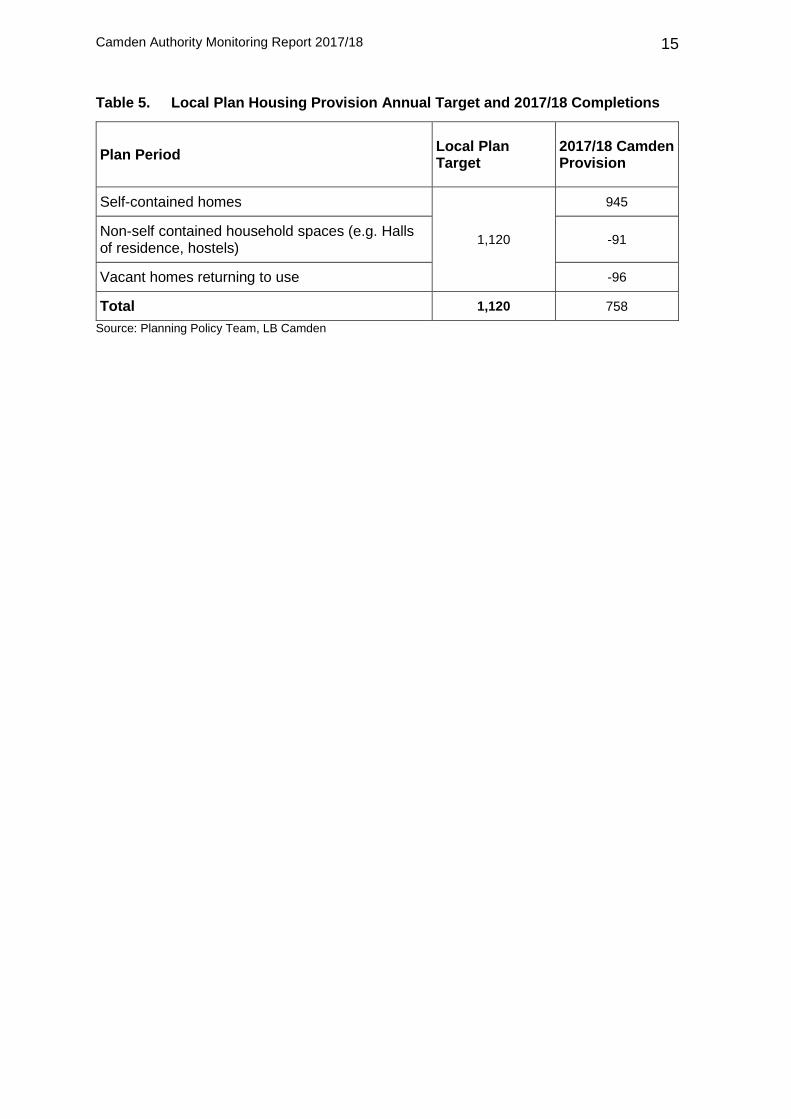
5.2. Table 5 below shows Camden’s housing target for the year of assessment. Figure 1 shows the housing provided in Camden up to 2017/18 and gives a projection of likely future provision set against the Local Plan housing targets. The bottom chart on Figure 1 shows that after taking into account delivery within the last five years Camden is on target to meet and exceed its housing delivery targets before the end of the Local Plan period 2016/17 – 2030/31.
Camden Authority Monitoring Report 2017/18
15
Table 5. Local Plan Housing Provision Annual Target and 2017/18 Completions
Plan Period Local Plan Target
2017/18 Camden Provision
Self-contained homes
1,120
945
Non-self contained household spaces (e.g. Halls of residence, hostels)
-91
Vacant homes returning to use -96
Total 1,120 758
Source: Planning Policy Team, LB Camden
Camden Authority Monitoring Report 2017/18
16
Table 6. Camden’s Housing Trajectory 2018 (Summary)
2013/1
4
2014/1
5
2015/1
6
2016/1
7
2017/1
8
2018/1
9
2019/2
0
2020/2
1
2021/2
2
2022/2
3
2023/2
4
2024/2
5
2025/2
6
2026/2
7
2027/2
8
2028/2
9
2029/3
0
2030/3
1
2031/3
2
2032/3
3
2033/3
4
Net additional self-contained dwellings – in previous years
553 508 955 1208 945
Net additional student accommodation – completions
1205 1161 498 248 0
Net additional hostel bedrooms - completions -21 16 -129 -58 -91
Allocated and other significant sites 23 284 470 761 687 737 309 274 80 47 1,383 900 895 675 655
Local authority delivery sites (not covered above)
22 66 223 423 200 260 250 250 200
Kentish Town Regis Road Growth Area 325 325 325 325
Permissions (dwellings) 10+ net gain 357 357 357 357 357
Permissions (dwellings) 9 or less net 104 104 104 104 104
Permissions (student accommodation) 35 35 35 35 35
Permissions (hostel bedrooms) -76 -76 -76 -76 -76
Windfall Projection (small sites) 192 192 192 192 192 192 192 192 192 192 192
Net additional homes – in future years 465 770 1,113 1,604 1,307 1,514 1,076 1,041 797 192 239 1,575 1,092 1,087 867 847
Housing Target 665 665 857 1120 1120 1176 1176 1176 1176 1176 1092 1092 1092 Up to 1092 1092 1092 1092 1092 1092 1092
Cumulative Housing Target 665 1330 2187 3307 4427 5547 6723 7899 9075 10251 11427 12519 13611 14703 15795 16887 17979 19071 20163 21255 22347
Cumulative Completions 1737 3422 4746 6144 6998 7463 8233 9346 10950 12257 13771 14847 15888 16685 16877 17116 18691 19783 20870 21737 22584
Monitor (cumulative completions minus the cumulative targets) 1072 2092 2559 2837 2571 1916 1510 1447 1875 2006 2344 2328 2277 1982 1082 229 712 712 707 482 237
Managed delivery target (no of completions needed to be on track) 800 753 704 670 627 613 622 612 573 488 413 303 217 114 16 -13 -63 -473 -994 -2035 -4937

Camden Authority Monitoring Report 2017/18
17
Figure 1. Camden’s Housing Trajectory for self-contained homes, student accommodation and hostels includes windfall assumptions for self-contained only and excludes reduction in the number of long term vacant homes)

Camden Authority Monitoring Report 2017/18
18
25BFive Year Housing Land Supply
5.3. The National Planning Policy Framework (NPPF) states that local planning authorities should identify and update annually a supply of specific deliverable sites sufficient to provide five years’ worth of housing against their housing requirements with an additional buffer of 5% (moved forward from later in the plan period) to ensure choice and competition in the market for land.
5.4. Camden’s five-year land supply has been included in our housing trajectory above. To inform and underpin Camden’s five-year housing land supply the Council has undertaken the following tasks:
assessed the likely level of housing that could be provided if unimplemented planning permissions are implemented;
assessed land availability by identifying buildings or areas of land that have development potential for housing, including those within mixed use developments, and the potential level of housing that can be provided on identified land;
evaluated past trends in 'windfall' land coming forward for development and estimated the likely future implementation rate;
identified constraints and issues that might make a particular site unavailable, unviable or unsuitable for development.
5.5. We estimate that the amount of windfall housing will remain relatively constant throughout the Local Plan period 2016/17 – 2030/31 (although this will be annually reassessed through the housing trajectory), while the proportion of dwellings built on identified sites will fluctuate.
5.6. We have identified sites that have the potential to deliver housing during the next 5 years, following the government’s assessment criteria. Potential sites include sites that have planning permission (outline or a full planning permission that has not been implemented), sites in the Site Allocations Development Plan, the Fizrovia Area Action Plan, the Euston Area Plan, the Council’s Community Investment Programme and any other deliverable site that have the potential to make a significant contribution to housing delivery during the 5 year period. It should be noted that the number of homes anticipated on an Allocated Site is based on a very broad estimate about capacity also taking into account any planning permission on the site and should not be taken as an indication that this is the number of homes which will be permitted as part of future planning applications.
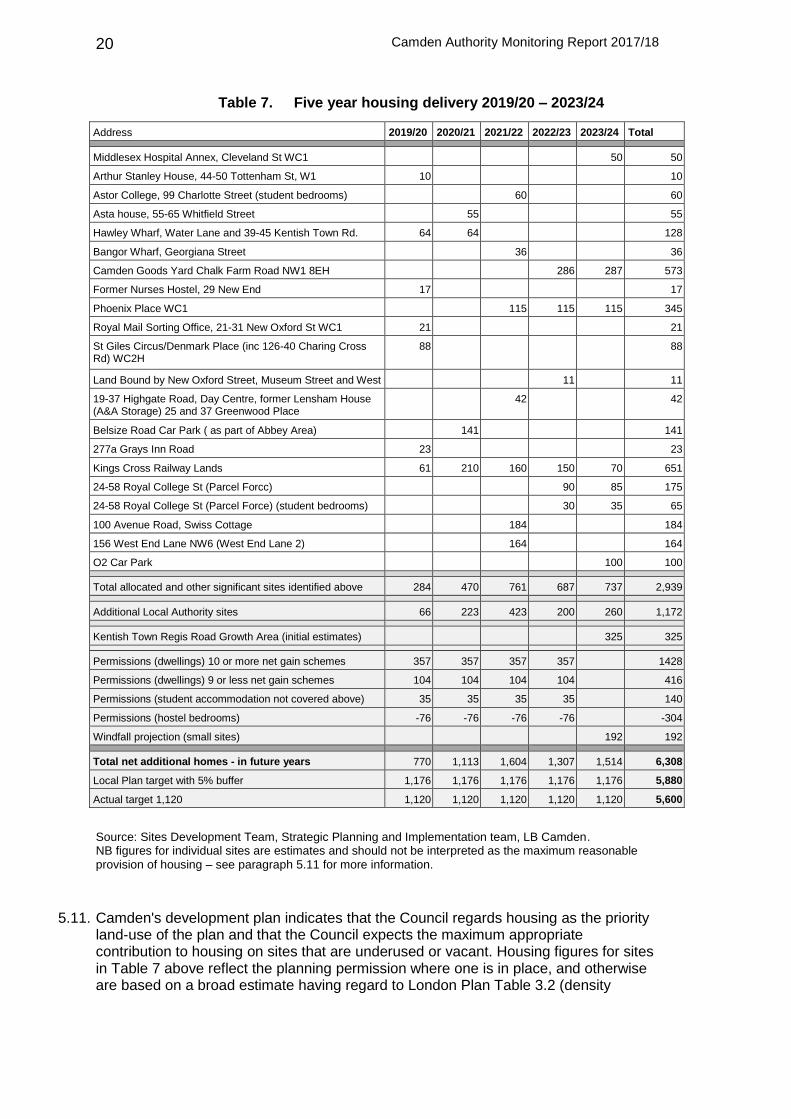
5.7. Taking into account all of the sources mentioned above, Camden’s five-year supply (2019/20 – 2023/24) of deliverable sites for housing amounts to 6,308 homes (or circa 1,262 homes per year). This exceeds our target of 1,120 homes for the period in the adopted Camden Local Plan and the adjusted target of 1,176 homes for the period (with a 5% buffer). Table 8 outlines the proposed sites that Camden expects to be developed in the next five years. ‘Permissions’ refer to unallocated sites that had planning permission or prior approval (see paragraph 12.4) at the end of March 2018. These include 47 sites that each provide 10 or more additional homes and have been assessed as deliverable: 28 these are already under construction. Sites with permission for 10 or more additional homes are expected to deliver 1,784 net additional homes in total. Just over 5% of those homes are expected to be delivered by schemes that have prior approval under permitted development rights.
5.8. With regards to self-contained homes, the majority of the schemes propose nine or fewer homes. The number of sites providing nine or fewer self-
Camden Authority Monitoring Report 2017/18
19
contained dwellings represent over 92% of the number of existing schemes (542 schemes out of 589 total schemes). It would not be feasible to predict delivery dates for so many individual sites at that scale. Therefore, to calculate the number of homes deliverable, we applied the past ratio of completions to permissions for small sites (72%) to current small-site permissions. We therefore expect that sites with permission for 9 or fewer net additional homes will deliver 519 homes in total or around 104 homes a year between 2018/19 and 2022/23.
5.9. The overall number of permitted homes which are assessed as deliverable between 2018/19 and 2022/23 (excluding allocated sites) is 2,303.
5.10. Due to Camden’s central London location the Council expects a certain amount of housing to come forward as windfalls every year. For the first five years of the period starting from 1st April 2018 we use the above information about permissions and deliverable sites to predict housing delivery. For the remaining ten years of the 15 year housing trajectory we also include windfall assumptions of 192 homes a year. This figure is based on delivery of housing schemes providing less than 10 additional homes between 2008/09 and 2017/18.
Camden Authority Monitoring Report 2017/18
20
Table 7. Five year housing delivery 2019/20 – 2023/24
Address 2019/20 2020/21 2021/22 2022/23 2023/24 Total
Middlesex Hospital Annex, Cleveland St WC1 50 50
Arthur Stanley House, 44-50 Tottenham St, W1 10 10
Astor College, 99 Charlotte Street (student bedrooms) 60 60
Asta house, 55-65 Whitfield Street 55 55
Hawley Wharf, Water Lane and 39-45 Kentish Town Rd. 64 64 128
Bangor Wharf, Georgiana Street 36 36
Camden Goods Yard Chalk Farm Road NW1 8EH 286 287 573
Former Nurses Hostel, 29 New End 17 17
Phoenix Place WC1 115 115 115 345
Royal Mail Sorting Office, 21-31 New Oxford St WC1 21 21
St Giles Circus/Denmark Place (inc 126-40 Charing Cross Rd) WC2H
88 88
Land Bound by New Oxford Street, Museum Street and West 11 11
19-37 Highgate Road, Day Centre, former Lensham House (A&A Storage) 25 and 37 Greenwood Place
42 42
Belsize Road Car Park ( as part of Abbey Area) 141 141
277a Grays Inn Road 23 23
Kings Cross Railway Lands 61 210 160 150 70 651
24-58 Royal College St (Parcel Forcc) 90 85 175
24-58 Royal College St (Parcel Force) (student bedrooms) 30 35 65
100 Avenue Road, Swiss Cottage 184 184
156 West End Lane NW6 (West End Lane 2) 164 164
O2 Car Park 100 100
Total allocated and other significant sites identified above 284 470 761 687 737 2,939
Additional Local Authority sites 66 223 423 200 260 1,172
Kentish Town Regis Road Growth Area (initial estimates) 325 325
Permissions (dwellings) 10 or more net gain schemes 357 357 357 357 1428
Permissions (dwellings) 9 or less net gain schemes 104 104 104 104 416
Permissions (student accommodation not covered above) 35 35 35 35 140
Permissions (hostel bedrooms) -76 -76 -76 -76 -304
Windfall projection (small sites) 192 192
Total net additional homes - in future years 770 1,113 1,604 1,307 1,514 6,308
Local Plan target with 5% buffer 1,176 1,176 1,176 1,176 1,176 5,880
Actual target 1,120 1,120 1,120 1,120 1,120 1,120 5,600
Source: Sites Development Team, Strategic Planning and Implementation team, LB Camden. NB figures for individual sites are estimates and should not be interpreted as the maximum reasonable provision of housing – see paragraph 5.11 for more information.
5.11. Camden's development plan indicates that the Council regards housing as the priority land-use of the plan and that the Council expects the maximum appropriate contribution to housing on sites that are underused or vacant. Housing figures for sites in Table 7 above reflect the planning permission where one is in place, and otherwise are based on a broad estimate having regard to London Plan Table 3.2 (density

Camden Authority Monitoring Report 2017/18
21
matrix) and other potential uses on the site. They should not be interpreted as detailed assessments of the maximum appropriate contribution to housing for each site.
5.12. The Council is also aware of other sites and schemes through pre application discussions which may make additional contributions to the Council’s five-year housing land supply 2019/20 to 2023/24. These sites will be added to the five-year land supply when they are reassessed as deliverable during that period.
Camden Authority Monitoring Report 2017/18
22
6. Affordable housing completions
OBJECTIVE Meeting the housing needs of Camden’s population
TARGET Borough wide strategic target of 5,300 additional affordable homes from 2016/17 - 2030/31 (equivalent to 353 additional affordable homes per year)
TARGET MET No
RELATED POLICIES
H4 - Maximising the supply of affordable housing
H5 - Protecting and improving affordable housing
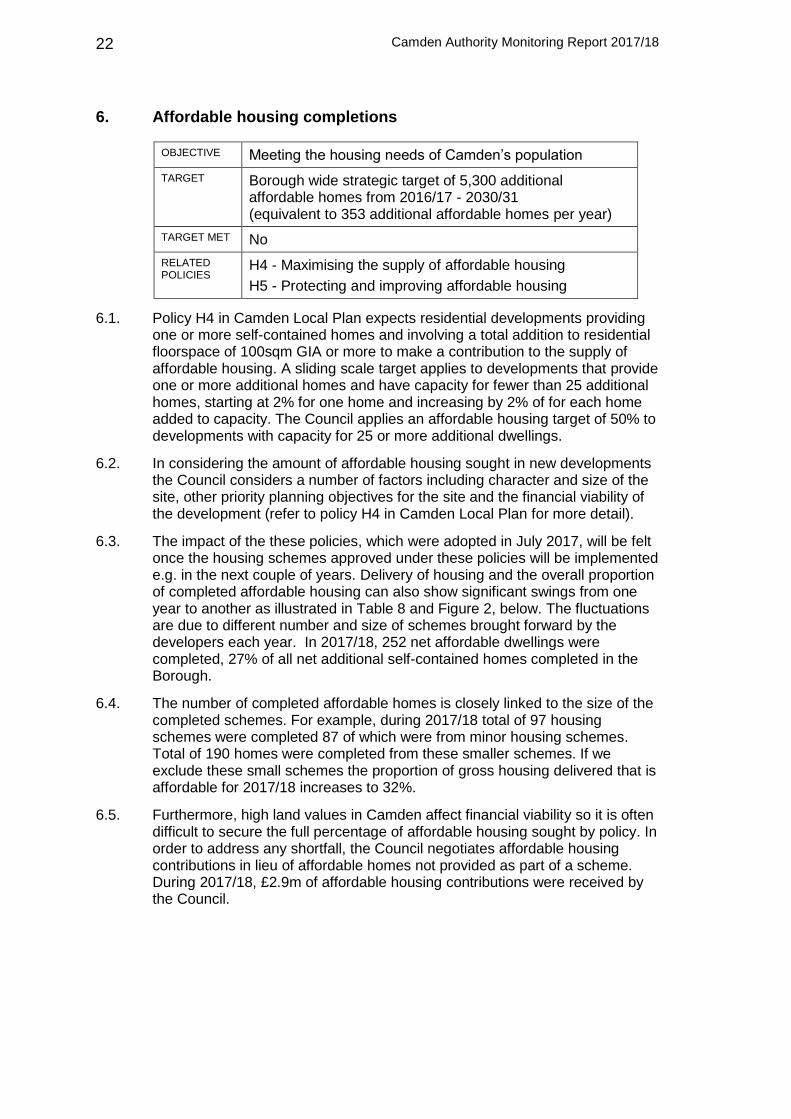
6.1. Policy H4 in Camden Local Plan expects residential developments providing one or more self-contained homes and involving a total addition to residential floorspace of 100sqm GIA or more to make a contribution to the supply of affordable housing. A sliding scale target applies to developments that provide one or more additional homes and have capacity for fewer than 25 additional homes, starting at 2% for one home and increasing by 2% of for each home added to capacity. The Council applies an affordable housing target of 50% to developments with capacity for 25 or more additional dwellings.
6.2. In considering the amount of affordable housing sought in new developments the Council considers a number of factors including character and size of the site, other priority planning objectives for the site and the financial viability of the development (refer to policy H4 in Camden Local Plan for more detail).
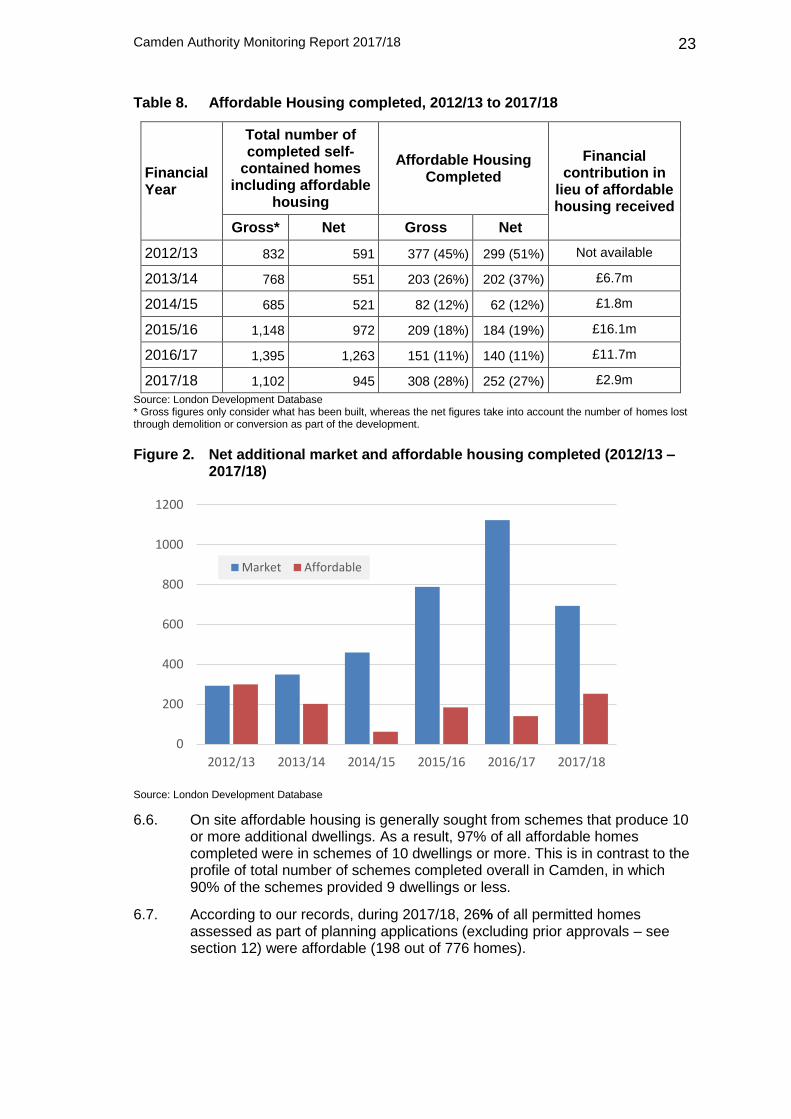
6.3. The impact of the these policies, which were adopted in July 2017, will be felt once the housing schemes approved under these policies will be implemented e.g. in the next couple of years. Delivery of housing and the overall proportion of completed affordable housing can also show significant swings from one year to another as illustrated in Table 8 and Figure 2, below. The fluctuations are due to different number and size of schemes brought forward by the developers each year. In 2017/18, 252 net affordable dwellings were completed, 27% of all net additional self-contained homes completed in the Borough.
6.4. The number of completed affordable homes is closely linked to the size of the completed schemes. For example, during 2017/18 total of 97 housing schemes were completed 87 of which were from minor housing schemes. Total of 190 homes were completed from these smaller schemes. If we exclude these small schemes the proportion of gross housing delivered that is affordable for 2017/18 increases to 32%.
6.5. Furthermore, high land values in Camden affect financial viability so it is often difficult to secure the full percentage of affordable housing sought by policy. In order to address any shortfall, the Council negotiates affordable housing contributions in lieu of affordable homes not provided as part of a scheme. During 2017/18, £2.9m of affordable housing contributions were received by the Council.
Camden Authority Monitoring Report 2017/18
23
Table 8. Affordable Housing completed, 2012/13 to 2017/18
Financial Year
Total number of completed self-
contained homes including affordable
housing
Affordable Housing Completed
Financial contribution in
lieu of affordable housing received
Gross* Net Gross Net
2012/13 832 591 377 (45%) 299 (51%) Not available
2013/14 768 551 203 (26%) 202 (37%) £6.7m
2014/15 685 521 82 (12%) 62 (12%) £1.8m
2015/16 1,148 972 209 (18%) 184 (19%) £16.1m
2016/17 1,395 1,263 151 (11%) 140 (11%) £11.7m
2017/18 1,102 945 308 (28%) 252 (27%) £2.9m
Source: London Development Database * Gross figures only consider what has been built, whereas the net figures take into account the number of homes lost through demolition or conversion as part of the development.
Figure 2. Net additional market and affordable housing completed (2012/13 – 2017/18)
Source: London Development Database
6.6. On site affordable housing is generally sought from schemes that produce 10 or more additional dwellings. As a result, 97% of all affordable homes completed were in schemes of 10 dwellings or more. This is in contrast to the profile of total number of schemes completed overall in Camden, in which 90% of the schemes provided 9 dwellings or less.
6.7. According to our records, during 2017/18, 26% of all permitted homes assessed as part of planning applications (excluding prior approvals – see section 12) were affordable (198 out of 776 homes).
0
200
400
600
800
1000
1200
2012/13 2013/14 2014/15 2015/16 2016/17 2017/18
Market Affordable
Camden Authority Monitoring Report 2017/18
24
7. Completed non-self contained homes by type (student accommodation and hostels)
OBJECTIVE Meeting the housing needs of Camden’s population
TARGET Gain of 160 student huousing places as year
TARGET MET No. Recorded gain of 8 bedrooms
RELATED POLICIES
H9 Student housing
7.1. The Camden Local Plan sets a minimum requirement for additional student housing over the Plan as 160 places per year, or 2,400 places in total (14% of the overall target for housing delivery).
7.2. From 1 April 2010 to 31 March 2018 the Council recorded 2,574 additional non-self contained housing units in Camden, mostly from student accommodation. During the same period there was an overall net loss of 673 hostel bedrooms, a net loss of 71 care home bedrooms and gain of 3,318 student bedrooms. During 2017/18, a net loss of 91 bedrooms (no additional student bedrooms, loss of 99 hostel bedrooms and gain of 8 care home bedrooms) were completed in the borough, falling below the 160 non-self contained housing figure from the SHLAA.
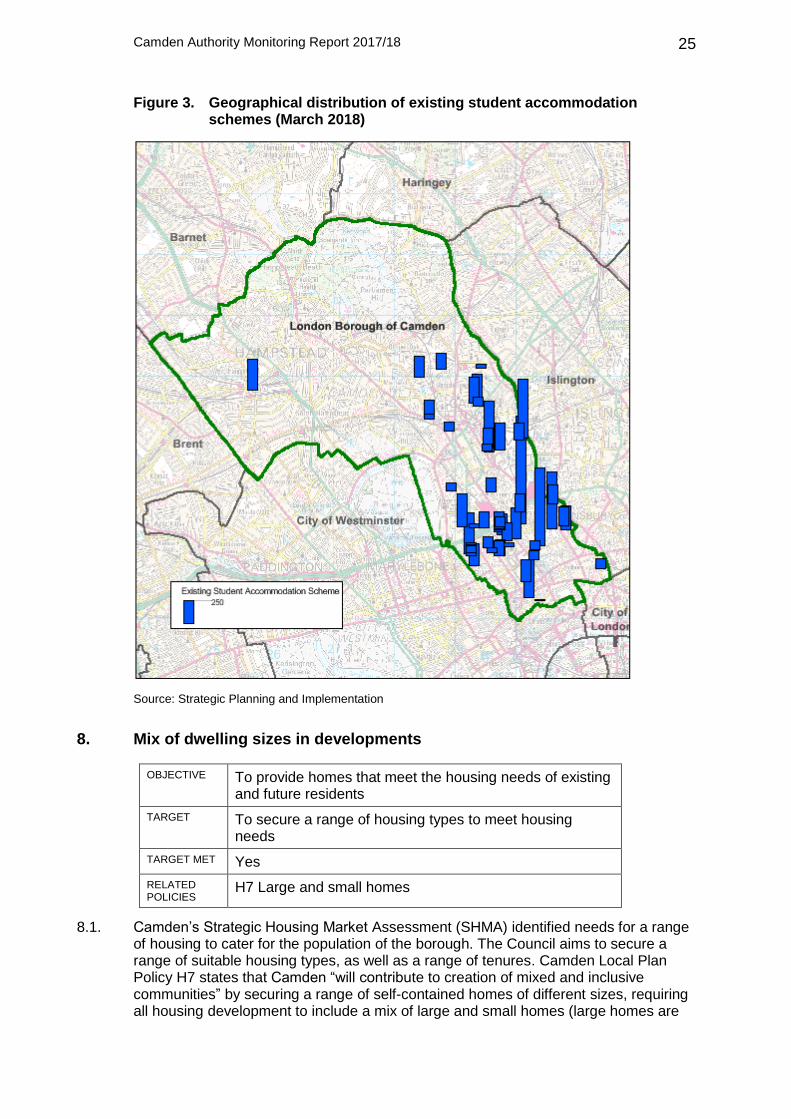
7.3. The distribution of existing student accommodation schemes is shown in Figure 3 below. As of 1st April 2018 the pipeline of non-self-contained housing bedrooms was as follows:
Table 9. Pipeline of non-self-contained housing units
Pipeline
Student bedrooms 173
Care home bedrooms -7
Hostel bedrooms -372
Total bedrooms -206
Camden Authority Monitoring Report 2017/18
25
Figure 3. Geographical distribution of existing student accommodation schemes (March 2018)
Source: Strategic Planning and Implementation
8. Mix of dwelling sizes in developments
OBJECTIVE To provide homes that meet the housing needs of existing and future residents
TARGET To secure a range of housing types to meet housing needs
TARGET MET Yes
RELATED POLICIES
H7 Large and small homes
8.1. Camden’s Strategic Housing Market Assessment (SHMA) identified needs for a range of housing to cater for the population of the borough. The Council aims to secure a range of suitable housing types, as well as a range of tenures. Camden Local Plan Policy H7 states that Camden “will contribute to creation of mixed and inclusive communities” by securing a range of self-contained homes of different sizes, requiring all housing development to include a mix of large and small homes (large homes are
Camden Authority Monitoring Report 2017/18
26
home with 3-bedrooms or more) and contribute to meeting the priorities set out in our Dwelling Size Priorities Table (republished in this report in table 12 below).
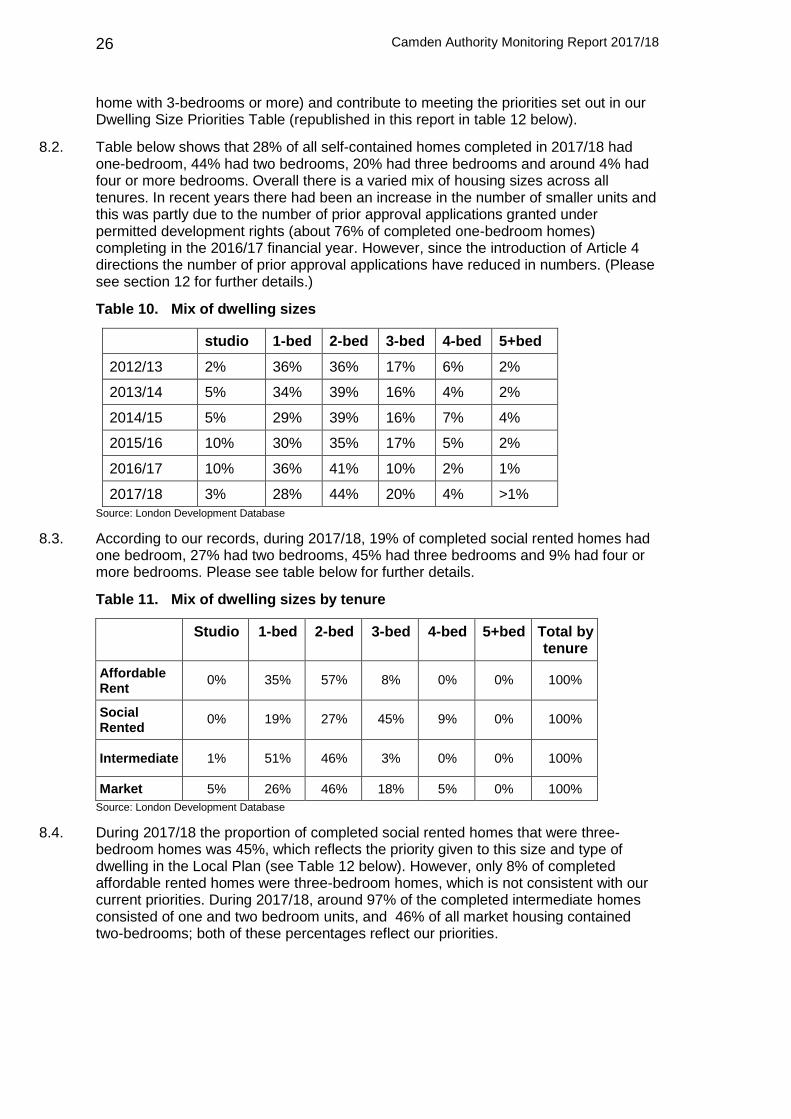
8.2. Table below shows that 28% of all self-contained homes completed in 2017/18 had one-bedroom, 44% had two bedrooms, 20% had three bedrooms and around 4% had four or more bedrooms. Overall there is a varied mix of housing sizes across all tenures. In recent years there had been an increase in the number of smaller units and this was partly due to the number of prior approval applications granted under permitted development rights (about 76% of completed one-bedroom homes) completing in the 2016/17 financial year. However, since the introduction of Article 4 directions the number of prior approval applications have reduced in numbers. (Please see section 12 for further details.)
Table 10. Mix of dwelling sizes
studio 1-bed 2-bed 3-bed 4-bed 5+bed
2012/13 2% 36% 36% 17% 6% 2%
2013/14 5% 34% 39% 16% 4% 2%
2014/15 5% 29% 39% 16% 7% 4%
2015/16 10% 30% 35% 17% 5% 2%
2016/17 10% 36% 41% 10% 2% 1%
2017/18 3% 28% 44% 20% 4% >1%
Source: London Development Database
8.3. According to our records, during 2017/18, 19% of completed social rented homes had one bedroom, 27% had two bedrooms, 45% had three bedrooms and 9% had four or more bedrooms. Please see table below for further details.
Table 11. Mix of dwelling sizes by tenure
Studio 1-bed 2-bed 3-bed 4-bed 5+bed Total by tenure
Affordable Rent
0% 35% 57% 8% 0% 0% 100%
Social Rented
0% 19% 27% 45% 9% 0% 100%
Intermediate 1% 51% 46% 3% 0% 0% 100%
Market 5% 26% 46% 18% 5% 0% 100%
Source: London Development Database
8.4. During 2017/18 the proportion of completed social rented homes that were three-bedroom homes was 45%, which reflects the priority given to this size and type of dwelling in the Local Plan (see Table 12 below). However, only 8% of completed affordable rented homes were three-bedroom homes, which is not consistent with our current priorities. During 2017/18, around 97% of the completed intermediate homes consisted of one and two bedroom units, and 46% of all market housing contained two-bedrooms; both of these percentages reflect our priorities.

Camden Authority Monitoring Report 2017/18
27
Table 12. Dwelling Size Priorities Table
1-bedroom (or studio)
2-bedroom 3-bedrooms 4-bedroom or more
Social-affordable rented
lower high high medium
Intermediate affordable
high medium lower lower
Market lower high high lower
Source: Camden Local Plan 2017
8.5. In 2017, a Housing and Adult Social Care Scrutiny Panel was convened to consider how the Council's services and the borough's housing stock support people with adult social care needs, and how older people can be supported to stay in their own homes for longer. The Panel asked whether the local plan encouraged the creation of mixed-age communities, and proposed that the Council should monitor the mix of dwelling sizes in individual new developments.
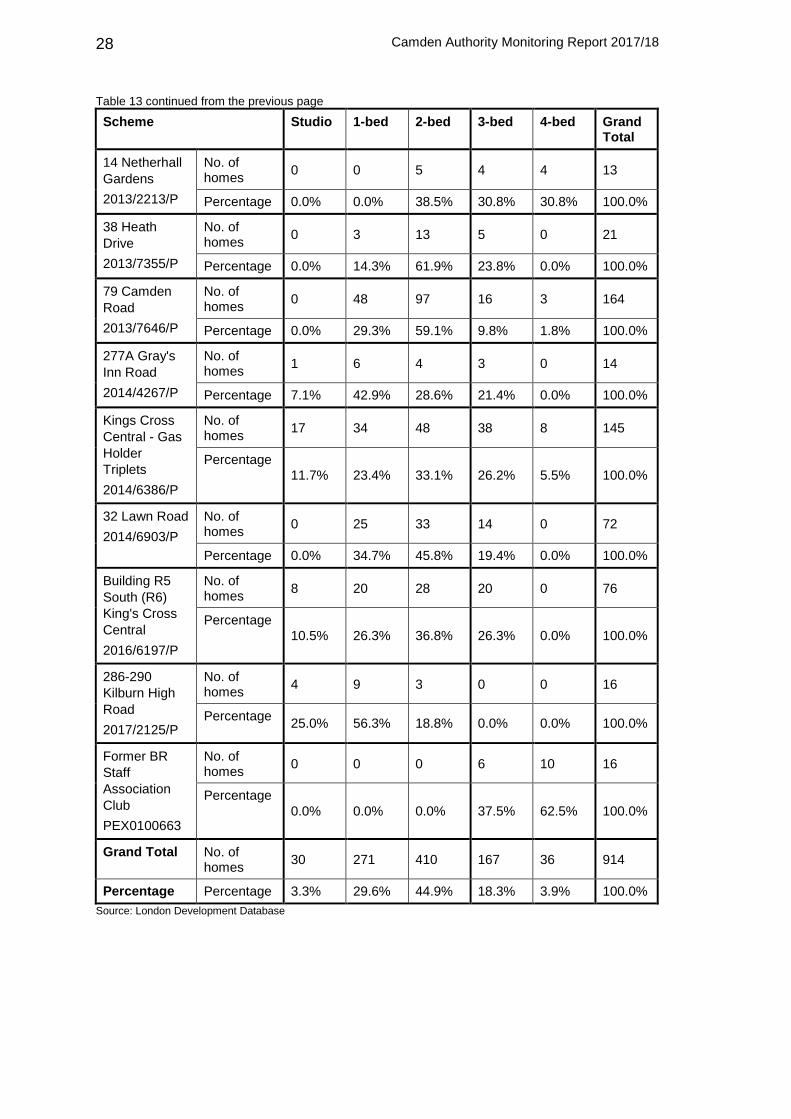
8.6. In response to the panel's proposal, Table 13 sets out the mix of dwelling sizes in each major development completed during 2017/18 (major developments are those involving 10 or more dwellings, or 1,000 sqm floorspace or more). Of the 13 major developments completed in 2017/18, 11 contained a mix of large and small homes, and could potentially accommodate mixed-age communities (large homes are homes with 3-or-more bedrooms). One scheme, containing only small homes, was an alteration to a scheme previously granted prior approval under permitted development rights, and therefore the Council was unable to control the mix of units. The final listed scheme, containing only large homes, was permitted in 2003 and has not been fully built out (a number of homes were omitted, including two 1-bed homes).
Table 13. Dwelling size mix for major schemes
Scheme Studio 1-bed 2-bed 3-bed 4-bed Grand Total
57-84 & 85-
112
Makepeace
Mansions
2011/4902/P
No. of homes
0 0 12 4 0 16
Percentage
0.0% 0.0% 75.0% 25.0% 0.0% 100.0%
Maiden Lane
Estate
2012/5552/P
No. of homes
0 99 129 37 8 273
Percentage 0.0% 36.3% 47.3% 13.6% 2.9% 100.0%
Bourne Estate
(south)
2012/6372/P
No. of homes
0 23 35 14 3 75
Percentage 0.0% 30.7% 46.7% 18.7% 4.0% 100.0%
328-338
Finchley Road
2013/0685/P
No. of homes
0 4 3 6 0 13
Percentage 0.0% 30.8% 23.1% 46.2% 0.0% 100.0%
Table 13 continued on the next page
Camden Authority Monitoring Report 2017/18
28
Table 13 continued from the previous page
Scheme Studio 1-bed 2-bed 3-bed 4-bed Grand Total
14 Netherhall
Gardens
2013/2213/P
No. of homes
0 0 5 4 4 13
Percentage 0.0% 0.0% 38.5% 30.8% 30.8% 100.0%
38 Heath
Drive
2013/7355/P
No. of homes
0 3 13 5 0 21
Percentage 0.0% 14.3% 61.9% 23.8% 0.0% 100.0%
79 Camden
Road
2013/7646/P
No. of homes
0 48 97 16 3 164
Percentage 0.0% 29.3% 59.1% 9.8% 1.8% 100.0%
277A Gray's
Inn Road
2014/4267/P
No. of homes
1 6 4 3 0 14
Percentage 7.1% 42.9% 28.6% 21.4% 0.0% 100.0%
Kings Cross
Central - Gas
Holder
Triplets
2014/6386/P
No. of homes
17 34 48 38 8 145
Percentage
11.7% 23.4% 33.1% 26.2% 5.5% 100.0%
32 Lawn Road
2014/6903/P
No. of homes
0 25 33 14 0 72
Percentage 0.0% 34.7% 45.8% 19.4% 0.0% 100.0%
Building R5
South (R6)
King's Cross
Central
2016/6197/P
No. of homes
8 20 28 20 0 76
Percentage
10.5% 26.3% 36.8% 26.3% 0.0% 100.0%
286-290
Kilburn High
Road
2017/2125/P
No. of homes
4 9 3 0 0 16
Percentage 25.0% 56.3% 18.8% 0.0% 0.0% 100.0%
Former BR
Staff
Association
Club
PEX0100663
No. of homes
0 0 0 6 10 16
Percentage
0.0% 0.0% 0.0% 37.5% 62.5% 100.0%
Grand Total No. of homes
30 271 410 167 36 914
Percentage Percentage 3.3% 29.6% 44.9% 18.3% 3.9% 100.0%
Source: London Development Database
Camden Authority Monitoring Report 2017/18
29
9. Vacant dwellings
OBJECTIVE Meeting the housing needs of Camden’s population
TARGET Reduction in the number of dwellings which are vacant for more than 6 months
TARGET MET No
RELATED POLICIES
London Plan target
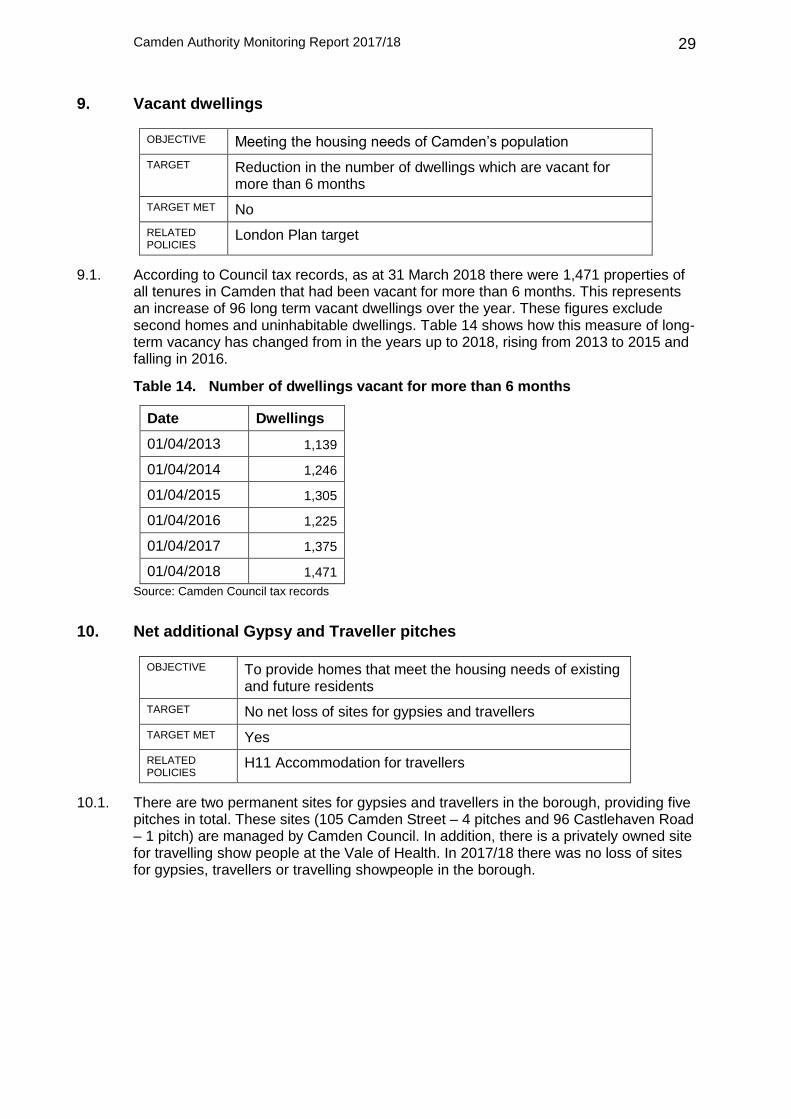
9.1. According to Council tax records, as at 31 March 2018 there were 1,471 properties of all tenures in Camden that had been vacant for more than 6 months. This represents an increase of 96 long term vacant dwellings over the year. These figures exclude second homes and uninhabitable dwellings. Table 14 shows how this measure of long-term vacancy has changed from in the years up to 2018, rising from 2013 to 2015 and falling in 2016.
Table 14. Number of dwellings vacant for more than 6 months
Date Dwellings
01/04/2013 1,139
01/04/2014 1,246
01/04/2015 1,305
01/04/2016 1,225
01/04/2017 1,375
01/04/2018 1,471
Source: Camden Council tax records
10. Net additional Gypsy and Traveller pitches
OBJECTIVE To provide homes that meet the housing needs of existing and future residents
TARGET No net loss of sites for gypsies and travellers
TARGET MET Yes
RELATED POLICIES
H11 Accommodation for travellers
10.1. There are two permanent sites for gypsies and travellers in the borough, providing five pitches in total. These sites (105 Camden Street – 4 pitches and 96 Castlehaven Road – 1 pitch) are managed by Camden Council. In addition, there is a privately owned site for travelling show people at the Vale of Health. In 2017/18 there was no loss of sites for gypsies, travellers or travelling showpeople in the borough.
Camden Authority Monitoring Report 2017/18
30
11. Number and proportion of permitted wheelchair homes
OBJECTIVE To provide homes that meet the housing needs of existing and future residents
TARGET 90% of all new build homes to meet M4(2) requirements and
10% of all new build homes to meet M4(3) requirements
TARGET MET Not yet monitored separately for new build homes
RELATED POLICIES
H6 Housing choice and mix
11.1. Camden recognises that housing should be built to be accessible to everyone, regardless of their ease of mobility. Therefore, Local Plan policy H6 requires 90% of new-build self-contained homes in each development to be accessible and adaptable in accordance with Building Regulation M4(2) and requires 10% of new-build self-contained homes in each development to be suitable for occupation by a wheelchair user or easily adapted for occupation by a wheelchair user in accordance with Building Regulation M4(3). (The requirements of Part M4(2) of the Building Regulations are broadly equivalent to the former 'Lifetime Homes' criteria.)
11.2. Parts M4(2) and M4(3) can only be applied to new build dwellings. Consequently, accessible, adapatable and wheelchair user dwellings cannot be required where homes are created through conversion of an existing building. Our monitoring data is currently unable to distinguish between the homes arising from conversions and new build homes. Consequently we are not yet able to fully monitor compliance with Local Plan Policy H6. However, an indication is provided by looking at the proportion of all proposed homes that will be subject to M4(2) and M4(3).
11.3. During 2017/18, a total of 426 out of 776 proposed homes that were permitted in the borough included a condition of planning permission relating to the provision of M4(2) or M4(3) compliant dwellings (55%). During the same period, 29 out of 776 homes proposed to comply with M4(3) for wheelchair user dwellings (accessible or adaptable) (4%).
Camden Authority Monitoring Report 2017/18
31
12. Permitted development change of use from office to residential
12.1. In May 2013 the government introduced a right to convert offices into homes without the need to apply for a planning permission. This right applied to all office premises in Camden outside of the Central Acivities Zone (CAZ). Applicants seeking to convert premises in office use into residential ask the Council whether a ‘prior approval’ is needed for the permitted change of use. In receipt of the prior approval application, the Council then decides whether the proposed change of use requires prior approval from the Council and if it does whether to approve or dismiss the application.
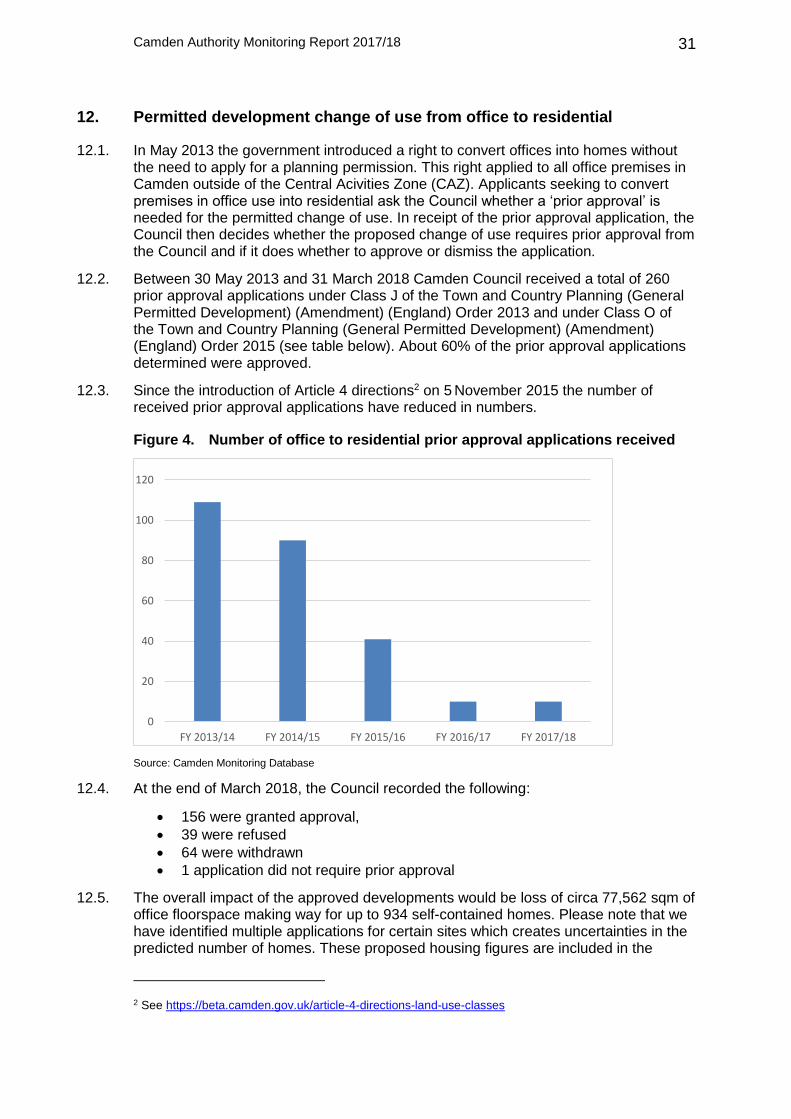
12.2. Between 30 May 2013 and 31 March 2018 Camden Council received a total of 260 prior approval applications under Class J of the Town and Country Planning (General Permitted Development) (Amendment) (England) Order 2013 and under Class O of the Town and Country Planning (General Permitted Development) (Amendment) (England) Order 2015 (see table below). About 60% of the prior approval applications determined were approved.
12.3. Since the introduction of Article 4 directions2 on 5 November 2015 the number of received prior approval applications have reduced in numbers.
Figure 4. Number of office to residential prior approval applications received
Source: Camden Monitoring Database
12.4. At the end of March 2018, the Council recorded the following:
156 were granted approval,
39 were refused
64 were withdrawn
1 application did not require prior approval
12.5. The overall impact of the approved developments would be loss of circa 77,562 sqm of office floorspace making way for up to 934 self-contained homes. Please note that we have identified multiple applications for certain sites which creates uncertainties in the predicted number of homes. These proposed housing figures are included in the
2 See https://beta.camden.gov.uk/article-4-directions-land-use-classes
0
20
40
60
80
100
120
FY 2013/14 FY 2014/15 FY 2015/16 FY 2016/17 FY 2017/18

Camden Authority Monitoring Report 2017/18
32
housing trajectory. Housing completions and permissions that arise through the prior approvals process are included in our figures for net addituional housing in past years, the current year, and future years (the housing trajectory) – see sections 2 to 6 above.
12.6. During 2017/18, four prior approvals applications were approved, one refused and five were withdrawn. According to our records 613 homes were completed as a result of prior approval from B1a office to C3 residential use (1 in 2013/14, 37 in 2014/15, 108 in 2015/16 and 463 in 2016/17 and 4 in 2017/18).
13. Housing Quality – Building for Life Assessments
OBJECTIVE To show the level of quality in new housing development
TARGET Majority of assessed developments scoring 9 ‘greens’ (capable of being awarded Building for Life accreditation).
TARGET MET Yes
RELATED POLICIES
Camden Local Plan 2017
Policy H1 Maximising housing supply
Policy H4 Maximising the supply of affordable housing
Policy H6 Housing choice and mix
Policy H7 Large and small homes
Policy C1 Health and wellbeing
Policy C2 Community facilities
Policy C5 Safety and security
Policy A1 Managing the Impact of development
Policy D1 Design
Policy D2 Heritage
Policy C6 Access for all
Policy CC1 Climate change mitigation
Policy CC5 Waste
Policy T1 Prioritising walking, cycling and public transport
Policy T2 Parking and car-free development
13.1. Building for Life 12 is a government endorsed industry standard for well designed homes and neighbourhoods. Building for Life 12 (BfL12) was developed by Cabe at the Design Council, Design for Homes and the Home Builders Federation, supported by Nottingham Trent University.
13.2. Local authorities are encouraged to use BfL12 to guide discussions about creating good places to live and it is also designed to help local planning authorities assess the quality of proposed and completed developments. Building for Life 12 focuses on schemes between 25 to 50 homes per hectare which generally are located in suburban or rural locations. So the standard can be used in urban locations six of the twelve questions now have an alternative prompt to suit urban situations.
13.3. BfL12 has a traffic light system, where schemes can be scored red, amber or green on each of the criteria. Developments that achieve 9 green are eligible for Built for Life accreditation. Our latest analysis covers the schemes completed in 2017/18. Camden officers undertook 7 informal Building for Life assessments, which covers major residential schemes completed in 2017/18. Out of the 7 schemes only one scored below 9 greens in the assessment, with one scoring the maximum 12 green points

Camden Authority Monitoring Report 2017/18
33
meaning all but one scheme assessed is eligible for Built for Life accreditation. The majority of schemes scoring positively against the criteria is a promising result indicating that a good standard and quality of development is being achieved in the borough. The results are set out in Table 15 below.
Table 15. Building for life assessments 2017/18
Source: LB Camden
1 2 3 4 5 6 7 8 9 10 11 12
Connections
Facilities
and
services
Public
transport
Meeting local
housing
requirements
Character
Working
with the
site and its
context
Creating
well
defined
streets and
spaces
Easy to
find
your
way
around
Active
streets
Cycle
and car
parking
Shared
spaces
Private
amenity
and
storage
2012/5552/P
Redevelopm
ent of
Maiden Lane
G G G G G G A A A G G G 9 Yes
2013/7646/P
79 Camden
Road and
86-100 St
Pancras
Way
G G G R G G G G G G G G 11 Yes
2014/6386/P
Kings Cross
Central, Gas
Holder
Triplets,
York Way
G A G A G G G G G G A G 9 Yes
2014/6903/P
32 Lawn
Road
G G G A G G G G G A G G 10 Yes
2012/6372/P
Bourne
Estate
(South),
Portpool
Lane
G G G G G G G G A G G A 10 Yes
2013/7355/P
38 Heath
Drive
G G G A A A A G G G G G 8 No
2016/6197/P
Building R5
South (R6),
Kings Cross
Central
G G G G G G G G G G G G 12 Yes
Integrating into the neighbourhood Creating a place Street and home
Number
of green
Eligible for
Building for
Life
accreditation
Scheme


Camden Authority Monitoring Report 2017/18
35
Employment
14. Employment floorspace completed
OBJECTIVE Provide adequate employment floorspace in the most appropriate and sustainable locations to meet demand.
TARGET No target
RELATED POLICIES
E1 Economic development
E2 Employment premises and sites
B1 business floorspace
14.1. The B1 business use class includes offices B1(a), research and development B1(b), and light industrial uses B1(c).
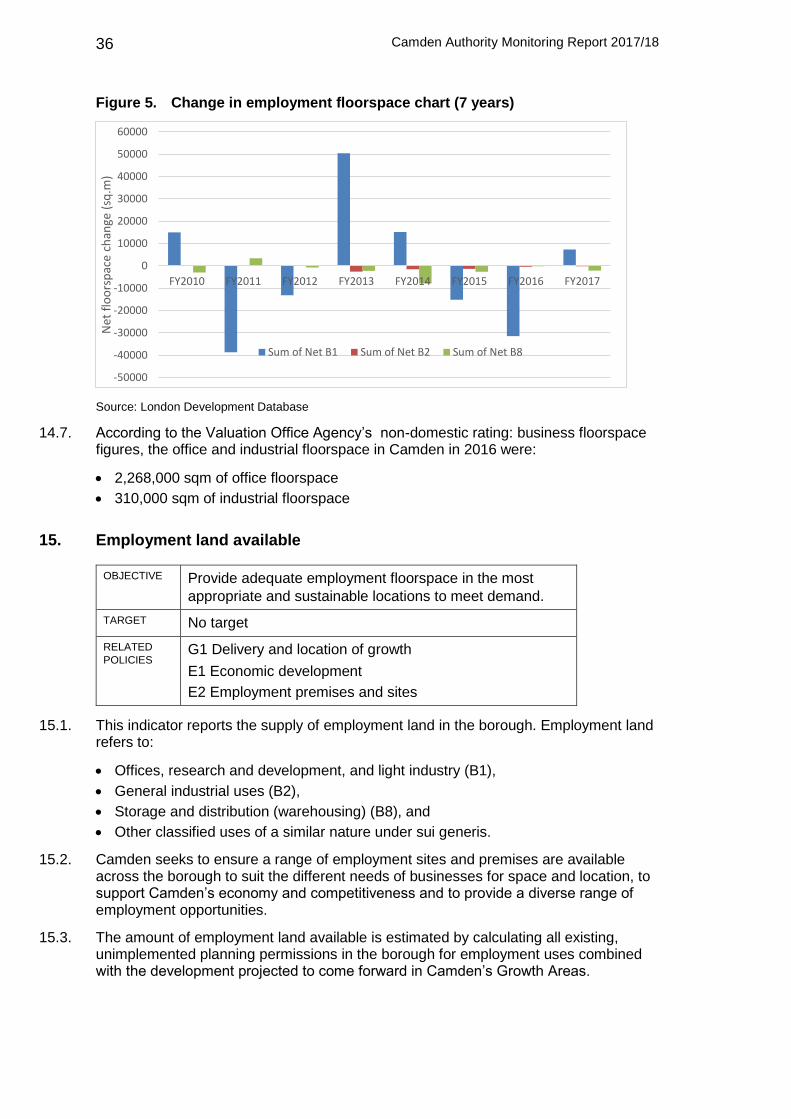
14.2. In 2017/18 a total of 32,173 sqm of B1 floorspace was completed and 24,812 sqm was lost resulting in a net gain of 7,361 sqm. Of the schemes completed in 2017/18 a total of 28 resulted in a loss of B1 and 12 resulted in a gain.
14.3. The vast majority of this change was in B1(a) office use class and permitted development rights allowing change of use of office premises into C3 residential without the need for a planning permission resulted in the loss of 264 sqm. None of the schemes involved change of B1(b) research and development use in the 2017/18.
14.4. In 2017/18 there were 3 schemes which resulted in a change of B1(c) light industrial floorspace. One of these schemes resulted in gain and 2 resulted in loss of B1(c) floorspace, with a net loss of 1,347 sqm of B1(c) overall in that year.
14.5. Trends in B1 floorspace vary year by year however and overall the last 8 years have seen a loss in B1 floorspace of approximately 10,507 sqm (see Figure 5X below).
B2 general industrial floorspace
There was one scheme completed in 2017/18 which resulted in change to B2 general industrial floorspace:
Change of use from car repair workshops (Class B2) to offices (Class B1) with associated replacement of ground floor street frontage garage doors. 2015/0600/P
B8 storage and warehousing floorspace
14.6. There were five schemes completed in 2017/18 which resulted in a redevelopment of B8 (storage and warehousing) floorspace which involved a net loss of 2,123 sqm of warehouse use.
Camden Authority Monitoring Report 2017/18
36
Figure 5. Change in employment floorspace chart (7 years)
Source: London Development Database
14.7. According to the Valuation Office Agency’s non-domestic rating: business floorspace figures, the office and industrial floorspace in Camden in 2016 were:
2,268,000 sqm of office floorspace
310,000 sqm of industrial floorspace
15. Employment land available
OBJECTIVE Provide adequate employment floorspace in the most
appropriate and sustainable locations to meet demand.
TARGET No target
RELATED
POLICIES G1 Delivery and location of growth
E1 Economic development
E2 Employment premises and sites
15.1. This indicator reports the supply of employment land in the borough. Employment land refers to:
Offices, research and development, and light industry (B1),
General industrial uses (B2),
Storage and distribution (warehousing) (B8), and
Other classified uses of a similar nature under sui generis.
15.2. Camden seeks to ensure a range of employment sites and premises are available across the borough to suit the different needs of businesses for space and location, to support Camden’s economy and competitiveness and to provide a diverse range of employment opportunities.
15.3. The amount of employment land available is estimated by calculating all existing, unimplemented planning permissions in the borough for employment uses combined with the development projected to come forward in Camden’s Growth Areas.
-50000
-40000
-30000
-20000
-10000
0
10000
20000
30000
40000
50000
60000
FY2010 FY2011 FY2012 FY2013 FY2014 FY2015 FY2016 FY2017
Net
flo
ors
pac
e ch
ange
(sq
.m)
Sum of Net B1 Sum of Net B2 Sum of Net B8
Camden Authority Monitoring Report 2017/18
37
Growth Areas projected floorspace
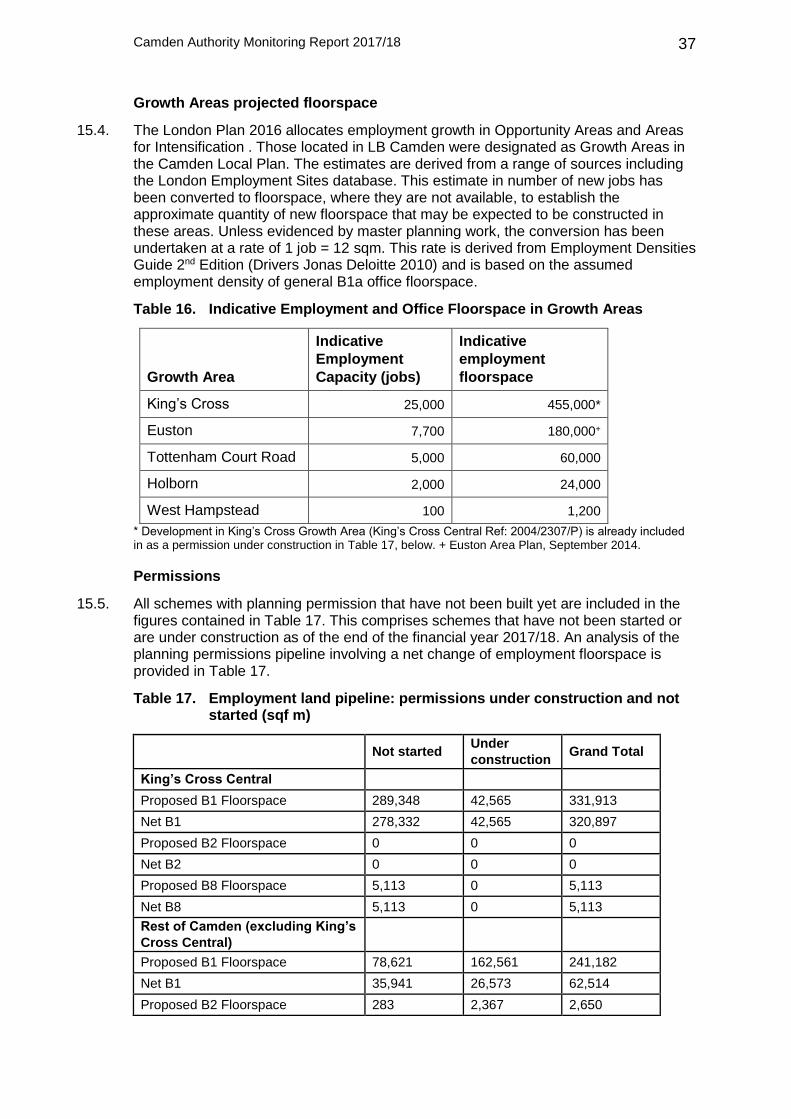
15.4. The London Plan 2016 allocates employment growth in Opportunity Areas and Areas for Intensification . Those located in LB Camden were designated as Growth Areas in the Camden Local Plan. The estimates are derived from a range of sources including the London Employment Sites database. This estimate in number of new jobs has been converted to floorspace, where they are not available, to establish the approximate quantity of new floorspace that may be expected to be constructed in these areas. Unless evidenced by master planning work, the conversion has been undertaken at a rate of 1 job = 12 sqm. This rate is derived from Employment Densities Guide 2nd Edition (Drivers Jonas Deloitte 2010) and is based on the assumed employment density of general B1a office floorspace.
Table 16. Indicative Employment and Office Floorspace in Growth Areas
Growth Area
Indicative
Employment
Capacity (jobs)
Indicative
employment
floorspace
King’s Cross 25,000 455,000*
Euston 7,700 180,000+
Tottenham Court Road 5,000 60,000
Holborn 2,000 24,000
West Hampstead 100 1,200
* Development in King’s Cross Growth Area (King’s Cross Central Ref: 2004/2307/P) is already included in as a permission under construction in Table 17, below. + Euston Area Plan, September 2014.
Permissions
15.5. All schemes with planning permission that have not been built yet are included in the figures contained in Table 17. This comprises schemes that have not been started or are under construction as of the end of the financial year 2017/18. An analysis of the planning permissions pipeline involving a net change of employment floorspace is provided in Table 17.
Table 17. Employment land pipeline: permissions under construction and not started (sqf m)
Not started Under
construction Grand Total
King’s Cross Central
Proposed B1 Floorspace 289,348 42,565 331,913
Net B1 278,332 42,565 320,897
Proposed B2 Floorspace 0 0 0
Net B2 0 0 0
Proposed B8 Floorspace 5,113 0 5,113
Net B8 5,113 0 5,113
Rest of Camden (excluding King’s
Cross Central)
Proposed B1 Floorspace 78,621 162,561 241,182
Net B1 35,941 26,573 62,514
Proposed B2 Floorspace 283 2,367 2,650

Camden Authority Monitoring Report 2017/18
38
Net B2 -3,745 -594 -4,339
Proposed B8 Floorspace 421 7,054 7,475
Net B8 -2,731 -6,584 -9,315
Totals
Proposed B1 Floorspace 367,969 205,126 573,095
Net B1 314,273 69,138 383,411
Proposed B2 Floorspace 283 2,367 2,650
Net B2 -3,745 -594 -4,339
Proposed B8 Floorspace 5,534 7,054 12,588
Net B8 2,382 -6,584 -4,202
Source: London Development Database
15.6. The planning application for King’s Cross Opportunity Area (2004/2307/P) accounts for the majority of B1 uplift and loss of B2 industrial and B8 storage and distribution floorspace. Development at King's Cross will result in:
444,327 sqm additional B1 business floorspace;
9,162 sqm less B2 general industrial floorspace; and
28,044 sqm less B8 storage / distribution floorspace.
15.7. Some of this floorspace has been completed, with the remainder to be built shown in Table 17 above.
15.8. Redevelopment anticipated in Camden's Site Allocations plan has not been included in this calculation because:
Many of the redevelopments included will not result in a net increase in employment floorspace.
For those that will, it is difficult to estimate the quantity or composition of floorspace uplift at this stage.
Permitted development rights for office to residential use
15.9. Permitted development rights allow certain limited forms of development without planning permission, as set out in the Town and Country Planning (General Permitted Development) Order 1995 (which has been subject to a number of subsequent amendments).
15.10. Permitted development rights to allow a change of use from B1(a) offices to C3 residential came into force on 30 May 2013. Camden Council secured an exemption from the permitted development right for Camden’s part of the Central Activities Zone.
15.11. The Council has received a number of prior approval applications for change of use to office to residential use. Between 30 May 2013 and 31 March 2018 the Council has granted 152 prior approval applications. There were a number of duplicate applications for certain sites creating difficulty in determining the potential true impact of those applications. However, when duplicates are taken away the analysis tells us that 68,488 sqm of office floorspace could have been lost as a result (although it should be noted that not all schemes were/will be implemented). Table 18 below shows the implementation status of these schemes. Prior approval schemes are included within the employment land pipeline above.

Camden Authority Monitoring Report 2017/18
39
Table 18. Prior approval applications granted for B1a office to C3 residential use between 30 May 2013 and 31 March 2018
Prior approval schemes
Estimated loss of office floorspace (GIA) (sqm)
Residential units (to be) built
Completed 78 44,686 613
Started 9 5,796 32
Not started 19 3,630 73
Source: London development Databse
15.12. In October 2015 the Council made Article 4 Directions to restrict this permitted development right for large parts of the borough where it was considered expedient on planning grounds. The Article 4 Directions came into force on 19th October 2015 and were subsequently modified by the Secretary of State on the 5th November 2015. The areas subject to the modified Direction can be viewed on the Council’s webpages (www.camden.gov.uk/officetoresidential).
15.13. During 2017/18, four prior approvals applications were approved, one refused and five were withdrawn. If all of the 2017/18 approved prior approvals are implemented Camden could gain 16 homes and lose 580 sqm of office floorspace.
16. Jewellery workshops in Hatton Garden
OBJECTIVE Provide adequate employment floorspace in the most
appropriate and sustainable locations to meet demand.
To promote and protect the jewellery industry in Hatton
Garden
TARGET No target
RELATED
POLICIES H2 Maximising the supply of self-contained housing from mixed-use schemes
E1 Economic development
E2 Employment premises and sites
16.1. The Council promotes and protects the jewellery industry in Hatton Garden. Under the Camden Local Plan policy E2 the Council will only permit the conversion of office premises where it can be demonstrated that they have been vacant and marketed for at least two years and that they are replaced by a mixed use development that includes jewellery workshops and residential uses. Policy H2 requires that developments in Hatton Garden are mixed use with their secondary uses being provided as premises suitable for the jewellery industry. Monitoring for the securing of jewellery workshop space in Hatton Garden began in 2010/11. In 2017/18 no loss or gain of jewellery workshop space was completed in Hatton Garden. During the same period two schemes proposing total gain of 101 sq m of jewellry workspace were permitted (2016/3239/P and 2016/4143/P).

Camden Authority Monitoring Report 2017/18
40
17. Change in VAT registered businesses
OBJECTIVE To monitor economic prosperity and diversity
TARGET No net loss in the number of businesses
TARGET MET Met
RELATED
POLICIES CS8 Promoting a successful and inclusive Camden
economy
DP13 Employment sites and premises
17.1. According to this measure Camden in 2018 had the second largest number of businesses in London (30,960 enterprises), with Westminster having the most (48,935 enterprises).
17.2. The number of business in Camden grew by 1% in 2018, the same as for London (see Table 18).
Table 19. Business Enterprises
Camden Greater London
2008 24,150 398,430
2009 24,420 401,445
2010 24,060 392,540
2011 23,990 394,055
2012 25,195 394,055
2013 25,495 432,095
2014 26,930 461,020
2015 29,100 505,140
2016 27,370 476,890
2017 29,440 505,655
2018 30,960 506,180
Source: Office for National Statistics, UK Business; activity, size and location https://www.ons.gov.uk/businessindustryandtrade/business/activitysizeandlocation/datasets/ukbusinessactivitysizeandlocation
18. Local training scheme places achieved from completed development
OBJECTIVE To ensure that new development provides training
opportunities for Camden residents
TARGET No target
RELATED
POLICIES E1 Economic development
E2 Employment premises and sites
18.1. The Council's Camden Planning Guidance indicates that developers should provide one apprentice per £3m build cost. Table 20 below provides information on the number of apprenticeship places negotiated in the last five years.

Camden Authority Monitoring Report 2017/18
41
Table 20. Apprenticeship places negotiated through s106 agreements
Year Places
2012/13 75
2013/14 132
2014/15 150
2015/16 168
2016/17 76
2017/18 167
Source: LB Camden Economic Development
18.2. It is worth noting that there are schemes where the Council has resolved to grant planning permission but for which apprenticeship numbers have yet to be clarified, as Section 106 agreements are not yet signed / readily available. Those apprenticeships are therefore not included within the above figure.
18.3. From the beginning of the Camden Plan timeframe (2012) to 31st March 2018, legal agreements have been signed securing:
881 construction apprenticeships
66 end-use apprenticeships
£4,775,000 towards employment and training initiatives
£115,000 towards initiatives to improve the competitiveness of jewellery businesses in Hatton Garden
485 work experience placements (mostly construction)
Approximately 20% local recruitment on all major sites; and
10% local procurement on all major sites

Camden Authority Monitoring Report 2017/18
42
Town Centres and retail
18.4. Camden’s centres remain a strong focus for activity and community life and provide character and identity to local areas and the borough as a whole. They are places of employment, shopping, leisure, and services. Camden’s centres also have strengths in terms of their location, accessibility by public transport, walking and cycling, character and offer (including many independent and specialist shops).
18.5. Traditional high streets are facing many challenges due to changing circumstances and shopping habits. Vacancy and occupation levels and the proportion of uses within centres usually provide an indication of their vitality and viability.
18.6. Some of the factors influencing town centres and retailing are:
economic conditions,
increasing online sales,
increasing consumer mobility and changing shopping preferences: consumers seeking locations with greater choice and which provide a shopping ‘experience’, leading to fewer, longer trips to reach larger centres3, and
increasing market share of large retailers and a decline of share for the small independent retail sector4.
18.7. Camden monitors three indicators related to its town centres and retailing:
the proportion of retail uses, and food, drink and entertainment uses in protected frontages in the borough,
the proportion of vacant premises on protected frontages in the borough, and
the change in the amount of floor space through development for all A use class uses (retail, professional services, cafes and restaurants, drinking establishments and hot food takeaways) across the borough.
19. Vacancy in shopping streets
OBJECTIVE Minimise the number of vacant premises.
RELATED POLICIES
TC1 Quantity and location of retail development
TC2 Camden’s centres and other shopping areas
19.1. The proportion of shops vacant on shopping streets is an important indicator of the health of that centre. Camden’s centres have relatively low levels of vacancy, being between 5% and 6.2% vacant over the last six years. The average vacancy rate for England in 2017 was 11.2%5.
3 CBRE, UK Shoppers Spend More But Take Less Trips, Press Release, 24 October 2011
4 Page 24-25 House of Commons, All-Party Parliamentary Small Shops Group, High Street Britain: 2015
5 http://blog.localdatacompany.com/infographic-retail-leisure-trends-in-h1-2017-turning-point
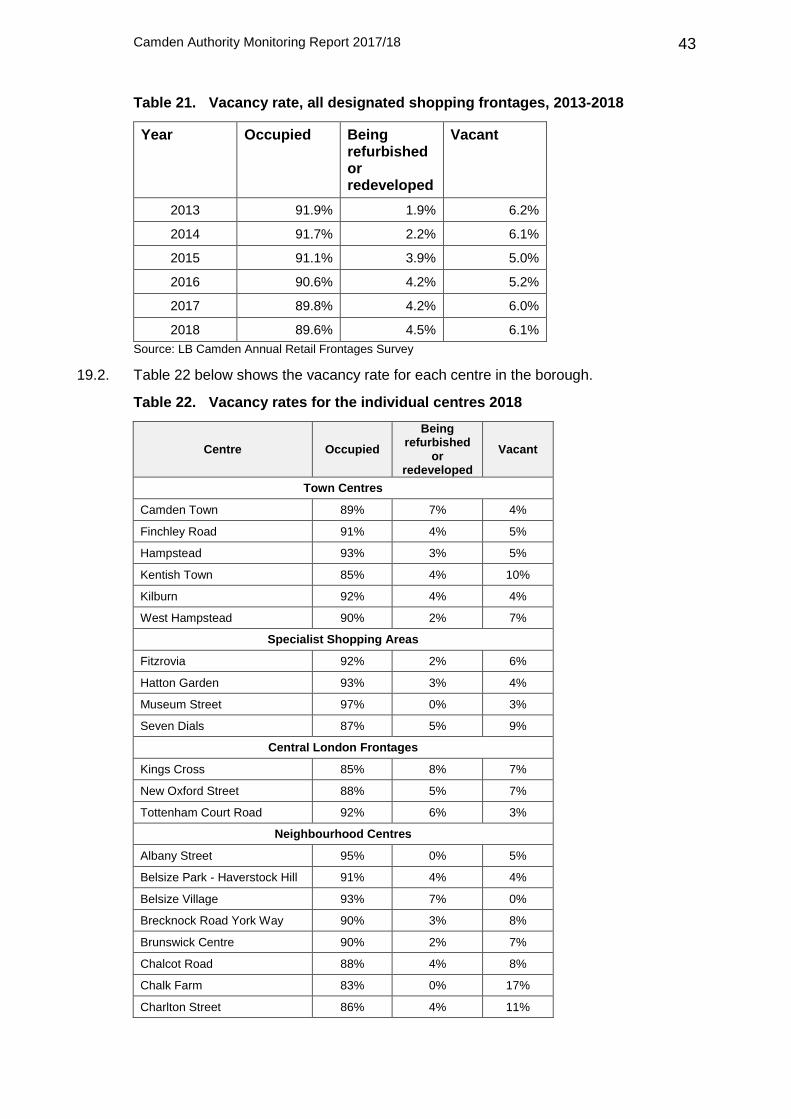
Camden Authority Monitoring Report 2017/18
43
Table 21. Vacancy rate, all designated shopping frontages, 2013-2018
Year Occupied Being refurbished or redeveloped
Vacant
2013 91.9% 1.9% 6.2%
2014 91.7% 2.2% 6.1%
2015 91.1% 3.9% 5.0%
2016 90.6% 4.2% 5.2%
2017 89.8% 4.2% 6.0%
2018 89.6% 4.5% 6.1%
Source: LB Camden Annual Retail Frontages Survey
19.2. Table 22 below shows the vacancy rate for each centre in the borough.
Table 22. Vacancy rates for the individual centres 2018
Centre Occupied
Being refurbished
or redeveloped
Vacant
Town Centres
Camden Town 89% 7% 4%
Finchley Road 91% 4% 5%
Hampstead 93% 3% 5%
Kentish Town 85% 4% 10%
Kilburn 92% 4% 4%
West Hampstead 90% 2% 7%
Specialist Shopping Areas
Fitzrovia 92% 2% 6%
Hatton Garden 93% 3% 4%
Museum Street 97% 0% 3%
Seven Dials 87% 5% 9%
Central London Frontages
Kings Cross 85% 8% 7%
New Oxford Street 88% 5% 7%
Tottenham Court Road 92% 6% 3%
Neighbourhood Centres
Albany Street 95% 0% 5%
Belsize Park - Haverstock Hill 91% 4% 4%
Belsize Village 93% 7% 0%
Brecknock Road York Way 90% 3% 8%
Brunswick Centre 90% 2% 7%
Chalcot Road 88% 4% 8%
Chalk Farm 83% 0% 17%
Charlton Street 86% 4% 11%
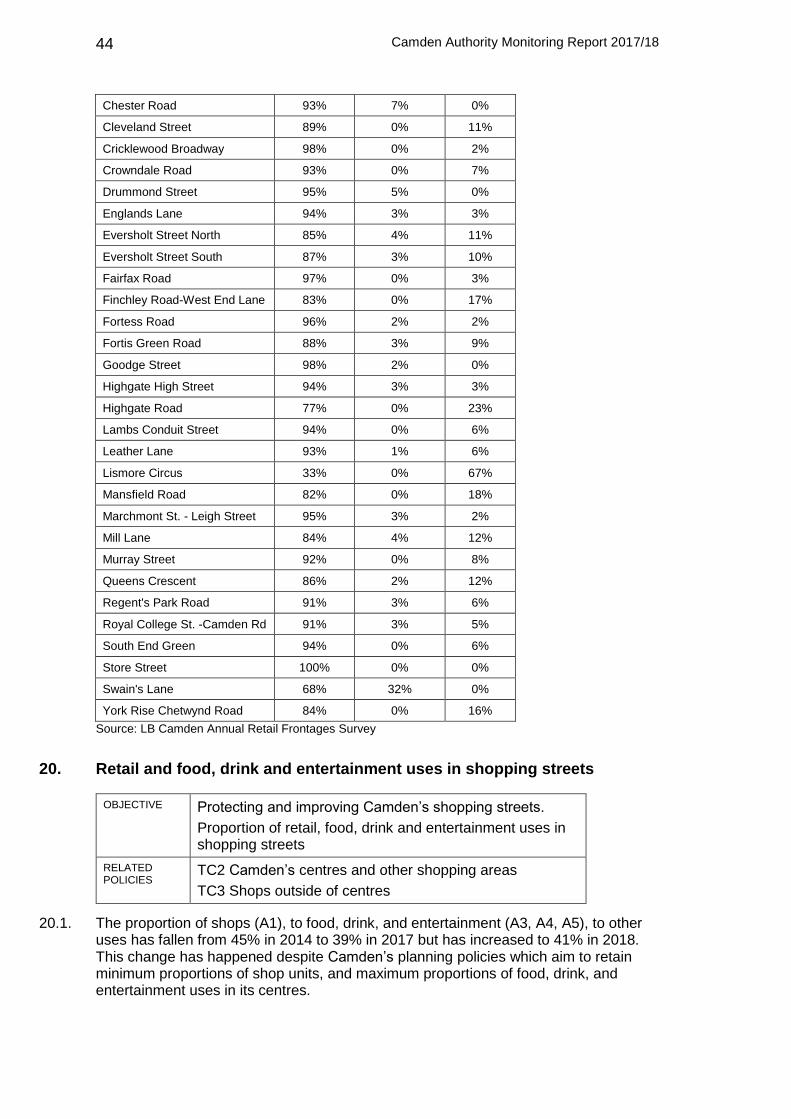
Camden Authority Monitoring Report 2017/18
44
Chester Road 93% 7% 0%
Cleveland Street 89% 0% 11%
Cricklewood Broadway 98% 0% 2%
Crowndale Road 93% 0% 7%
Drummond Street 95% 5% 0%
Englands Lane 94% 3% 3%
Eversholt Street North 85% 4% 11%
Eversholt Street South 87% 3% 10%
Fairfax Road 97% 0% 3%
Finchley Road-West End Lane 83% 0% 17%
Fortess Road 96% 2% 2%
Fortis Green Road 88% 3% 9%
Goodge Street 98% 2% 0%
Highgate High Street 94% 3% 3%
Highgate Road 77% 0% 23%
Lambs Conduit Street 94% 0% 6%
Leather Lane 93% 1% 6%
Lismore Circus 33% 0% 67%
Mansfield Road 82% 0% 18%
Marchmont St. - Leigh Street 95% 3% 2%
Mill Lane 84% 4% 12%
Murray Street 92% 0% 8%
Queens Crescent 86% 2% 12%
Regent's Park Road 91% 3% 6%
Royal College St. -Camden Rd 91% 3% 5%
South End Green 94% 0% 6%
Store Street 100% 0% 0%
Swain's Lane 68% 32% 0%
York Rise Chetwynd Road 84% 0% 16%
Source: LB Camden Annual Retail Frontages Survey
20. Retail and food, drink and entertainment uses in shopping streets
OBJECTIVE Protecting and improving Camden’s shopping streets.
Proportion of retail, food, drink and entertainment uses in shopping streets
RELATED POLICIES
TC2 Camden’s centres and other shopping areas
TC3 Shops outside of centres
20.1. The proportion of shops (A1), to food, drink, and entertainment (A3, A4, A5), to other uses has fallen from 45% in 2014 to 39% in 2017 but has increased to 41% in 2018. This change has happened despite Camden’s planning policies which aim to retain minimum proportions of shop units, and maximum proportions of food, drink, and entertainment uses in its centres.

Camden Authority Monitoring Report 2017/18
45
Figure 6. Retail (A1 shops), food, drink and entertainment (A3, A4, A5), all protected shopping frontages in LB Camden, 2011 to 2018
Source: LB Camden Annual Retail Survey
Table 23. Retail (A1 shops), food, drink and entertainment (A3, A4, A5), all protected shopping frontages in LB Camden, 2011 to 2018
Year A1 A3, A4, A5 All other uses
2011 45% 20% 35%
2012 45% 20% 35%
2013 46% 20% 34%
2014 47% 19% 34%
2015 45% 20% 35%
2016 42% 22% 37%
2017 39% 24% 37%
2018 41% 24% 36%
Source: LB Camden Annual Retail Survey
20.2. The breakdown of these uses by each centre is shown on the charts on the following pages.
Table 24. Retail (A1 shops), food, drink and entertainment (A3, A4, A5) in Town Centres, Central London Frontages, Central London Local Areas, 2018
Centre A1 A3, A4, A4 All other uses
Town Centres
Camden Town 39% 24% 38%
Finchley Road 40% 16% 44%
Hampstead 48% 15% 37%

Camden Authority Monitoring Report 2017/18
46
Kentish Town 38% 23% 39%
Kilburn 41% 21% 38%
West Hampstead 40% 27% 34%
Specialist Shopping Areas
Fitzrovia 24% 40% 36%
Hatton Garden 68% 3% 30%
Museum Street 52% 27% 21%
Seven Dials 51% 25% 24%
Central London Frontages
Kings Cross 19% 33% 47%
New Oxford Street 33% 28% 39%
Tottenham Court Road 50% 24% 27%
Neighbourhood Centres
Albany Street 81% 5% 14%
Belsize Park - Haverstock Hill 48% 22% 30%
Belsize Village 25% 36% 39%
Brecknock Road York Way 56% 15% 28%
Brunswick Centre 52% 38% 10%
Chalcot Road 42% 12% 46%
Chalk Farm 33% 25% 42%
Charlton Street 36% 18% 46%
Chester Road 7% 0% 93%
Cleveland Street 24% 35% 41%
Cricklewood Broadway 46% 26% 28%
Crowndale Road 36% 14% 50%
Drummond Street 28% 40% 33%
Englands Lane 44% 25% 31%
Eversholt Street North 52% 15% 33%
Eversholt Street South 35% 13% 52%
Fairfax Road 56% 21% 24%
Finchley Rd. - West End Lane 48% 3% 48%
Fortess Road 43% 35% 22%
Fortis Green Road 24% 15% 61%
Goodge Street 49% 36% 16%
Highgate High Street 55% 10% 35%
Highgate Road 41% 14% 45%

Camden Authority Monitoring Report 2017/18
47
Lambs Conduit Street 62% 19% 19%
Leather Lane 47% 33% 19%
Lismore Circus 33% 0% 67%
Mansfield Road 64% 18% 18%
Marchmont St. - Leigh Street 48% 32% 20%
Mill Lane 45% 9% 46%
Murray Street 42% 8% 50%
Queens Crescent 61% 16% 23%
Regent's Park Road 52% 20% 28%
Royal College St - Camden Rd 36% 24% 40%
South End Green 59% 26% 15%
Store Street 53% 20% 27%
Swain's Lane 28% 36% 36%
York Rise Chetwynd Road 37% 21% 42%
Source: Annual LB Camden Retail frontages survey
21. Retail and food, drink and entertainment floorspace completed
OBJECTIVE Protecting and improving Camden’s shopping streets.
Net change in retail, food, drink and entertainment floorpsace
RELATED POLICIES
G1 Delivery and location of growth
TC1 Quantity and location of retail development
21.1. In 2017/18 there was an overall gain in floorspace across the “A” use classes, as set out in the table below.

Camden Authority Monitoring Report 2017/18
48
Table 25. ‘A’ uses change 2008/09 to 2017/18
Year A1 shops (sq m net)
A2 financial and professional services (sq m net)
A3 Restaurants and cafes (sq m net)
A4 Drinking establishments (sq m net)
A5 Hot food take away (sq m net)
2008/09 4,347 177 318 -1,635 0
2009/10 -2,669 -293 888 -157 0
2010/11 -4,116 -623 1,556 -436 0
2011/12 1,492 1,947 2,293 1,803 1,947
2012/13 -1,378 502 218 292 -85
2013/14 360 -190 1,802 -291 146
2014/15 -742 888 1932 -316 406
2015/16 2374 -27 983 -447 -91
2016/17 2549 689 976 -408 445
2017/18 668 220 2271 633 511
Source: London Development Database
21.2. There were twenty schemes in 2017/18 which involved a change in A1 shop floorspace. Half of these schemes resulted in a gain of shop floorspace, and the other half resulted in a loss.
21.3. The change in A2 floorspace in 2017/18 was spread out over three schemes. Two of these schemes resulted in a gain of A2 floorspace and the other one resulted in a loss.
21.4. There were sixteen schemes in 2017/18 which involved a change in A3 cafes or restaurants. Nine of these schemes resulted in an increase of A3 floorspace and seven resulted in a loss.
21.5. The A4 use class (drinking establishments) includes pubs. In 2017/18 Camden gained five pubs. Three of these are located at St. Pancras and Somers Town. With the remaining two gained on Cantelowes and Kentish Town.

Camden Authority Monitoring Report 2017/18
49
22. Hotel accommodation
OBJECTIVE Protecting existing visitor accommodation in appropriate locations.
Ensuring large scale tourism development is located in highly accessible locations.
TARGET Contribute to the London Plan target of achieving 40,000 net additional hotel bedrooms by 2026 across London
TARGET MET Part met
RELATED POLICIES
E3 Tourism
22.1. According to a GLA study, with 25,440 rooms, Camden has the second highest number of visitor rooms of London boroughs. Neighbouring Westminster has the highest number with around 42,190 rooms (Understanding the demand for and supply of visitor accommodation in London to 2036, GLA Economics - August 2013).
22.2. The London Plan sets a target of achieving 40,000 net additional hotel bedrooms across London by 2031. Camden’s development policies aim to maintain and encourage a range of attractions and accommodation in the borough for Camden’s visitors.
Table 26. Net hotel rooms completed
Year
Net hotel rooms completed
2006/07 149
2007/08 -47
2008/09 124
2009/10 18
2010/11 261
2011/12 215
2012/13 84
2013/14 100
2014/15 590
2015/16 45
2016/17 -17
2017/18 503
Source: London Development Database
22.3. The majority of net additional hotel rooms in the last three years were created either as a result of refurbishments or via change of use of office floorspace into hotel use.
22.4. In 2017/18, 200 rooms Point A Hotel London - Kings Cross St Pancras (2011/3890/P) and 168 rooms Hub by Premier Inn London Goodge Street, Bloomsbury (2013/2934/P) contributed to the most of hotel bedroom completions.
22.5. All of the above schemes are located in highly accessible areas.

Camden Authority Monitoring Report 2017/18
50
Sustainable development
23. Sustainable design assessment, BREEAM, BREEAM non-domestic refurbishment
OBJECTIVE Protecting and enhancing our environment
TARGET Achieve BREEAM Excellent on all non-residential development of 500sqm or more floorspace.
Developments of five or more dwellings or 500 sqm of residential floorspace or above resulting from conversions, extensions and changes of use to achieve an excellent rating in BREEAM domestic refurbishment.
TARGET MET Met
RELATED POLICIES CC2 Adapting to climate change
23.1. The majority of relevant major developments approved in 2017/18 included a sustainability plan to demonstrate the environmental performance of the proposal. These sustainability plans include BREEAM assessments (Building Research Establishment Environmental Assessment Method) for commercial buildings and domestic refurbishment. Sustainable assessment tools such as BREEAM measure the performance of buildings against set sustainability criteria. Buildings that achieve high ratings use less energy, consume less water and have lower running costs than those designed to building regulations alone.
23.2. BREEAM schemes are scored (awarded credits) for their performance in specific categories. The categories are: energy, health and well-being, management, water, materials, waste, pollution, transport, land use and ecology. As it is relatively easy to obtain credits in transport and management in Camden we have been requiring developments to achieve particular credit levels in the energy, water and materials categories (stated above) which are considered to have the greatest environmental benefits. Development can be awarded the following ratings of pass, good, very good, excellent and outstanding.
23.3. In 2017/18, the Council approved 7 applications that would result in a net increase of 500sqm or more non-residential floorspace. All of these schemes included a predicted BREEAM rating within their overall sustainability assessment. 5 of the schemes had a predicted rating of Excellent and 2 had a predicted rating of outstanding.
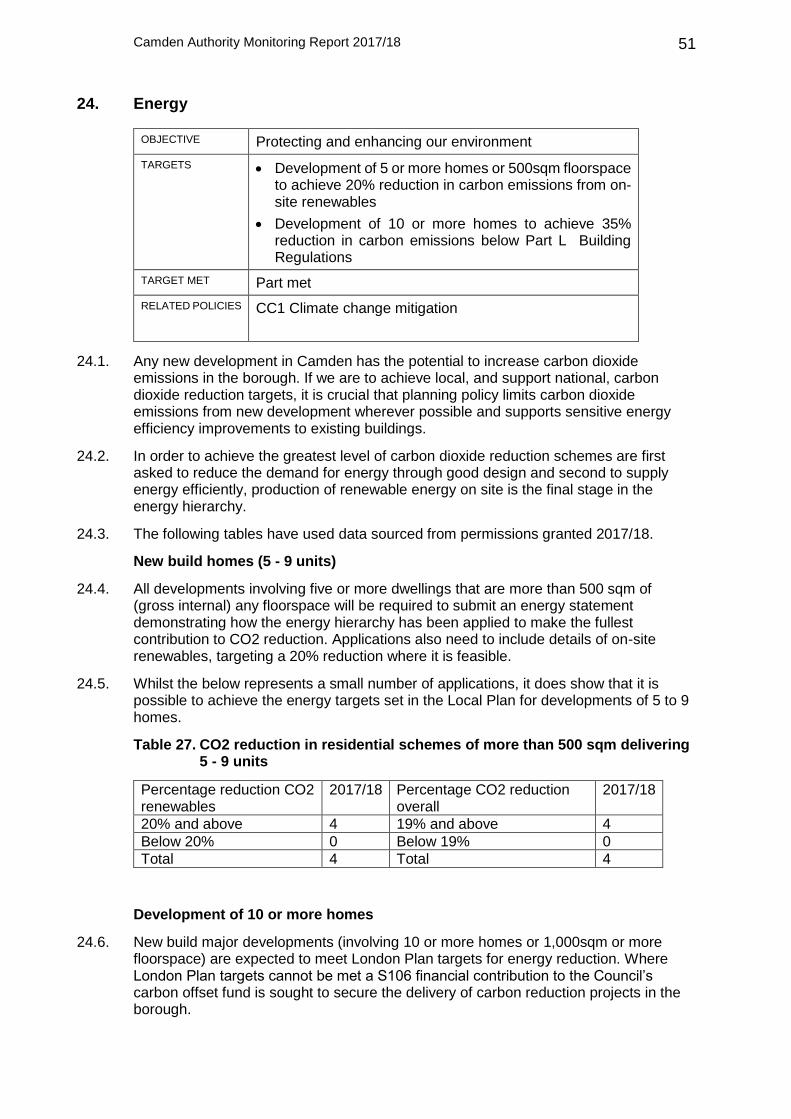
Camden Authority Monitoring Report 2017/18
51
24. Energy
OBJECTIVE Protecting and enhancing our environment
TARGETS Development of 5 or more homes or 500sqm floorspace to achieve 20% reduction in carbon emissions from on-site renewables
Development of 10 or more homes to achieve 35% reduction in carbon emissions below Part L Building Regulations
TARGET MET Part met
RELATED POLICIES CC1 Climate change mitigation
24.1. Any new development in Camden has the potential to increase carbon dioxide emissions in the borough. If we are to achieve local, and support national, carbon dioxide reduction targets, it is crucial that planning policy limits carbon dioxide emissions from new development wherever possible and supports sensitive energy efficiency improvements to existing buildings.
24.2. In order to achieve the greatest level of carbon dioxide reduction schemes are first asked to reduce the demand for energy through good design and second to supply energy efficiently, production of renewable energy on site is the final stage in the energy hierarchy.
24.3. The following tables have used data sourced from permissions granted 2017/18.
New build homes (5 - 9 units)
24.4. All developments involving five or more dwellings that are more than 500 sqm of (gross internal) any floorspace will be required to submit an energy statement demonstrating how the energy hierarchy has been applied to make the fullest contribution to CO2 reduction. Applications also need to include details of on-site renewables, targeting a 20% reduction where it is feasible.
24.5. Whilst the below represents a small number of applications, it does show that it is possible to achieve the energy targets set in the Local Plan for developments of 5 to 9 homes.
Table 27. CO2 reduction in residential schemes of more than 500 sqm delivering 5 - 9 units
Percentage reduction CO2 renewables
2017/18 Percentage CO2 reduction overall
2017/18
20% and above 4 19% and above 4
Below 20% 0 Below 19% 0
Total 4 Total 4
Development of 10 or more homes
24.6. New build major developments (involving 10 or more homes or 1,000sqm or more floorspace) are expected to meet London Plan targets for energy reduction. Where London Plan targets cannot be met a S106 financial contribution to the Council’s carbon offset fund is sought to secure the delivery of carbon reduction projects in the borough.

Camden Authority Monitoring Report 2017/18
52
24.7. The table below shows that the majority of majors were able to demonstrate that a 35% reduction below Part L 2013 Building Regulations could be met.
Table 28. CO2 reduction in schemes new build homes (less than 10 units)
Percentage reduction of energy from onsite renewable sources
2017/18 London Plan carbon emissions target (35%) reduction
2017/18
20% or more 3 35% or more 4
Less than 20% 4 25% - 34% 1
Unspecified percentage 0 15% - 24% 1
No renewables 0 Below 15% 1
Total 7 Total 7
25. Sustainable urban drainage systems (SUDS)
OBJECTIVE To mitigate against surface water flooding
TARGET No target
RELATED POLICIES CC1 Climate change mitigation
CC2 Adapting to climate change
CC3 Water and flooding
A5 Basements
25.1. Sustainable drainage systems are designed to control surface water run off close to where it falls and mimic natural drainage as closely as possible. In 2017/18 Camden required 63 schemes to provide SUDS, secured through condition. In some instances it may not be necessary to secure SUDS through condition where they have been designed into the scheme at the planning application stage. The number of schemes where the Council has required SUDS secured through condition is shown in Table 29 below.

Camden Authority Monitoring Report 2017/18
53
Table 29. Planning schemes permitted with conditions for Sustainable Urban Drainage Systems (SUDS)
Year Schemes
2010/11 35
2011/12 20
2012/13 20
2013/14 15
2014/15 44
2015/16 9
2016/17 57
2017/18 63
Source: Strategic Planning and Implementation Team (Conditions search FY2017 - SUDS - no link to LDD)
26. Air Quality
OBJECTIVE Protecting and enhancing our environment
Reduction in the level of identified air pollutants in the National Air Quality Strategy
TARGET Multiple. See details below.
TARGET MET Part met
RELATED POLICIES CC4 Air quality
26.1. An Air Quality Management Area (AQMA) has been established across the borough in response to the air quality in the borough failing to meet the Government’s objectives for nitrogen dioxide (NO2) and fine particles (PM10). The Council has produced a Clean Air Action Plan that identifies actions to reduce the level of nitrogen oxides and particulate matter.
26.2. Six airborne pollutants are measured in Camden: sulphur dioxide (SO2), nitrogen dioxide (NO2), fine particulates (PM10), ozone (O3) and carbon monoxide (CO), These are presented in Table below, along with Camden’s compliance with EU limit levels for these pollutants.

Camden Authority Monitoring Report 2017/18
54
Table 30. Air Pollutants measured in Camden
Pollutant Target 2005 2006 2007 2008 2009 2010 2011 2012 2013 2014 2015 2016 2017
Nitrogen Dioxide (NO2)*
Annual Mean Objective of 40 µg/m3
× × × × × x x x x x x x x
Hourly Objective of 200 µg/m3 × × × x x x x x x x x
Sulphur Dioxide (SO2) **
Hourly mean of no more than 24 occurrences greater than 350 µg/m3
Daily mean of no more than 3 days greater than 125 µg/m3
15 minute mean objective of no more than 35 occurrences greater than 267 µg/m3
Particulate Matter (PM10)*
Annual Mean Objective of 40 µg/m3
×
Daily objective of no more 35 days with a daily mean of 50 µg/m3
Ozone (O3)**
Hourly objective of no more than 18 days where the maximum rolling 8hour mean is greater than 100 µg/m3
×
Benzene ** Annual Mean Objective of 5 µg/m3
n/a†
Carbon Monoxide (CO)**
Annual Mean Objective of 10 µg/m3
n/a¥
Source: Air Quality Projects & Policy, LB Camden
* Average measurement from Swiss Cottage, Shaftsbury Avenue and Bloomsbury Monitoring Sites (NO2 levels also measured at Euston Road Monitoring Site)
** Measurement from Bloomsbury Monitoring Site
† Benzene not measured in Camden since 2007 as historic modelling has shown levels for this pollutant to be negligible.
¥ Carbon monoxide no longer measured at the Bloomsbury monitoring station.
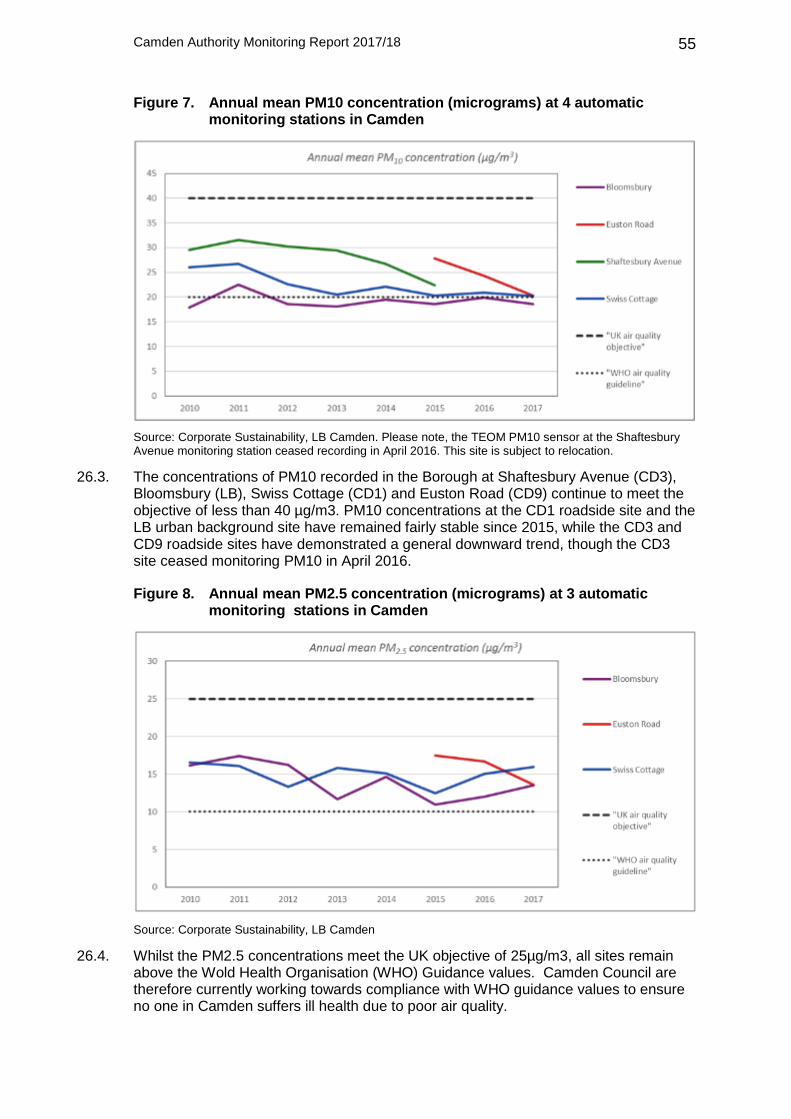
Camden Authority Monitoring Report 2017/18
55
Figure 7. Annual mean PM10 concentration (micrograms) at 4 automatic monitoring stations in Camden
Source: Corporate Sustainability, LB Camden. Please note, the TEOM PM10 sensor at the Shaftesbury Avenue monitoring station ceased recording in April 2016. This site is subject to relocation.
26.3. The concentrations of PM10 recorded in the Borough at Shaftesbury Avenue (CD3), Bloomsbury (LB), Swiss Cottage (CD1) and Euston Road (CD9) continue to meet the objective of less than 40 µg/m3. PM10 concentrations at the CD1 roadside site and the LB urban background site have remained fairly stable since 2015, while the CD3 and CD9 roadside sites have demonstrated a general downward trend, though the CD3 site ceased monitoring PM10 in April 2016.
Figure 8. Annual mean PM2.5 concentration (micrograms) at 3 automatic monitoring stations in Camden
Source: Corporate Sustainability, LB Camden
26.4. Whilst the PM2.5 concentrations meet the UK objective of 25µg/m3, all sites remain above the Wold Health Organisation (WHO) Guidance values. Camden Council are therefore currently working towards compliance with WHO guidance values to ensure no one in Camden suffers ill health due to poor air quality.
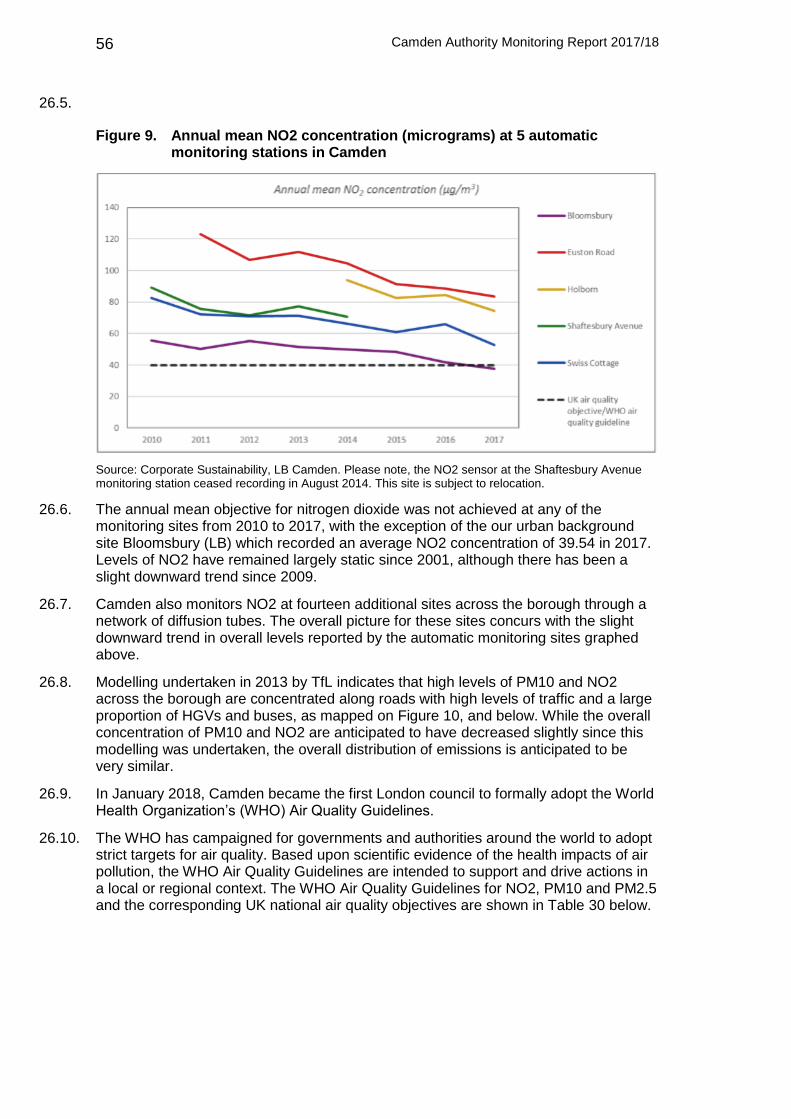
Camden Authority Monitoring Report 2017/18
56
26.5.
Figure 9. Annual mean NO2 concentration (micrograms) at 5 automatic monitoring stations in Camden
Source: Corporate Sustainability, LB Camden. Please note, the NO2 sensor at the Shaftesbury Avenue monitoring station ceased recording in August 2014. This site is subject to relocation.
26.6. The annual mean objective for nitrogen dioxide was not achieved at any of the monitoring sites from 2010 to 2017, with the exception of the our urban background site Bloomsbury (LB) which recorded an average NO2 concentration of 39.54 in 2017. Levels of NO2 have remained largely static since 2001, although there has been a slight downward trend since 2009.
26.7. Camden also monitors NO2 at fourteen additional sites across the borough through a network of diffusion tubes. The overall picture for these sites concurs with the slight downward trend in overall levels reported by the automatic monitoring sites graphed above.
26.8. Modelling undertaken in 2013 by TfL indicates that high levels of PM10 and NO2 across the borough are concentrated along roads with high levels of traffic and a large proportion of HGVs and buses, as mapped on Figure 10, and below. While the overall concentration of PM10 and NO2 are anticipated to have decreased slightly since this modelling was undertaken, the overall distribution of emissions is anticipated to be very similar.
26.9. In January 2018, Camden became the first London council to formally adopt the World Health Organization’s (WHO) Air Quality Guidelines.
26.10. The WHO has campaigned for governments and authorities around the world to adopt strict targets for air quality. Based upon scientific evidence of the health impacts of air pollution, the WHO Air Quality Guidelines are intended to support and drive actions in a local or regional context. The WHO Air Quality Guidelines for NO2, PM10 and PM2.5 and the corresponding UK national air quality objectives are shown in Table 30 below.
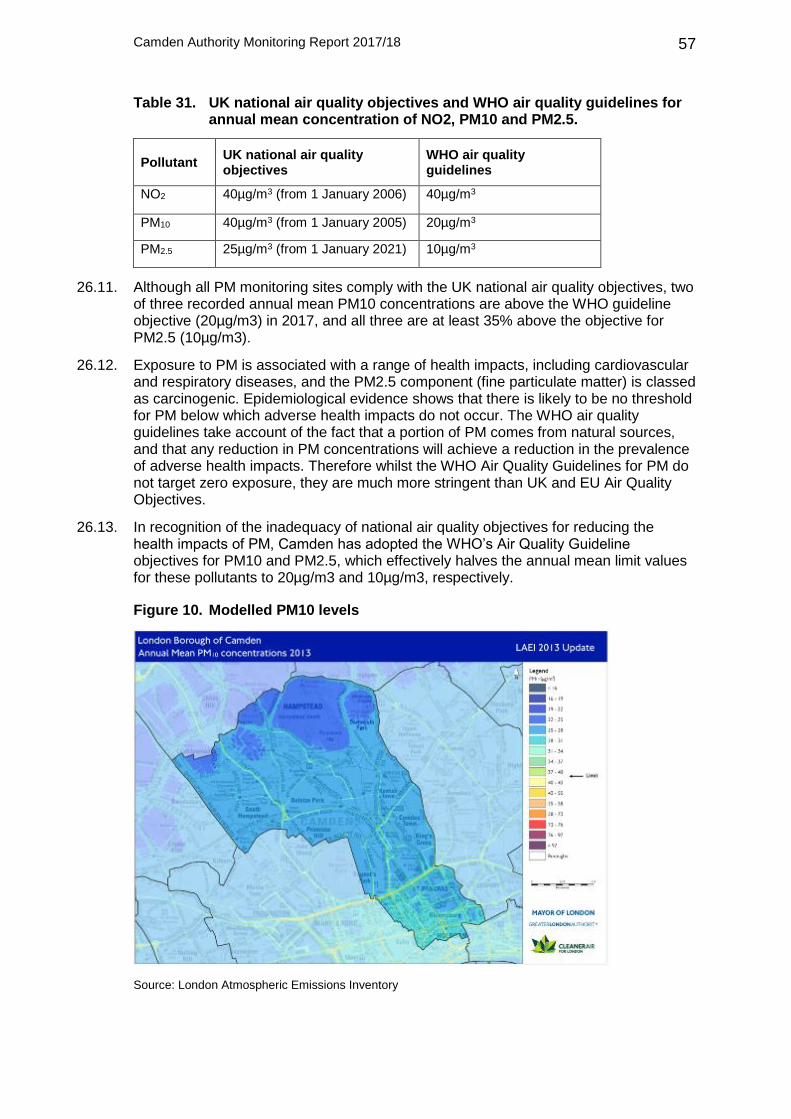
Camden Authority Monitoring Report 2017/18
57
Table 31. UK national air quality objectives and WHO air quality guidelines for annual mean concentration of NO2, PM10 and PM2.5.
Pollutant UK national air quality objectives
WHO air quality guidelines
NO2 40µg/m3 (from 1 January 2006) 40µg/m3
PM10 40µg/m3 (from 1 January 2005) 20µg/m3
PM2.5 25µg/m3 (from 1 January 2021) 10µg/m3
26.11. Although all PM monitoring sites comply with the UK national air quality objectives, two of three recorded annual mean PM10 concentrations are above the WHO guideline objective (20µg/m3) in 2017, and all three are at least 35% above the objective for PM2.5 (10µg/m3).
26.12. Exposure to PM is associated with a range of health impacts, including cardiovascular and respiratory diseases, and the PM2.5 component (fine particulate matter) is classed as carcinogenic. Epidemiological evidence shows that there is likely to be no threshold for PM below which adverse health impacts do not occur. The WHO air quality guidelines take account of the fact that a portion of PM comes from natural sources, and that any reduction in PM concentrations will achieve a reduction in the prevalence of adverse health impacts. Therefore whilst the WHO Air Quality Guidelines for PM do not target zero exposure, they are much more stringent than UK and EU Air Quality Objectives.
26.13. In recognition of the inadequacy of national air quality objectives for reducing the health impacts of PM, Camden has adopted the WHO’s Air Quality Guideline objectives for PM10 and PM2.5, which effectively halves the annual mean limit values for these pollutants to 20µg/m3 and 10µg/m3, respectively.
Figure 10. Modelled PM10 levels
Source: London Atmospheric Emissions Inventory
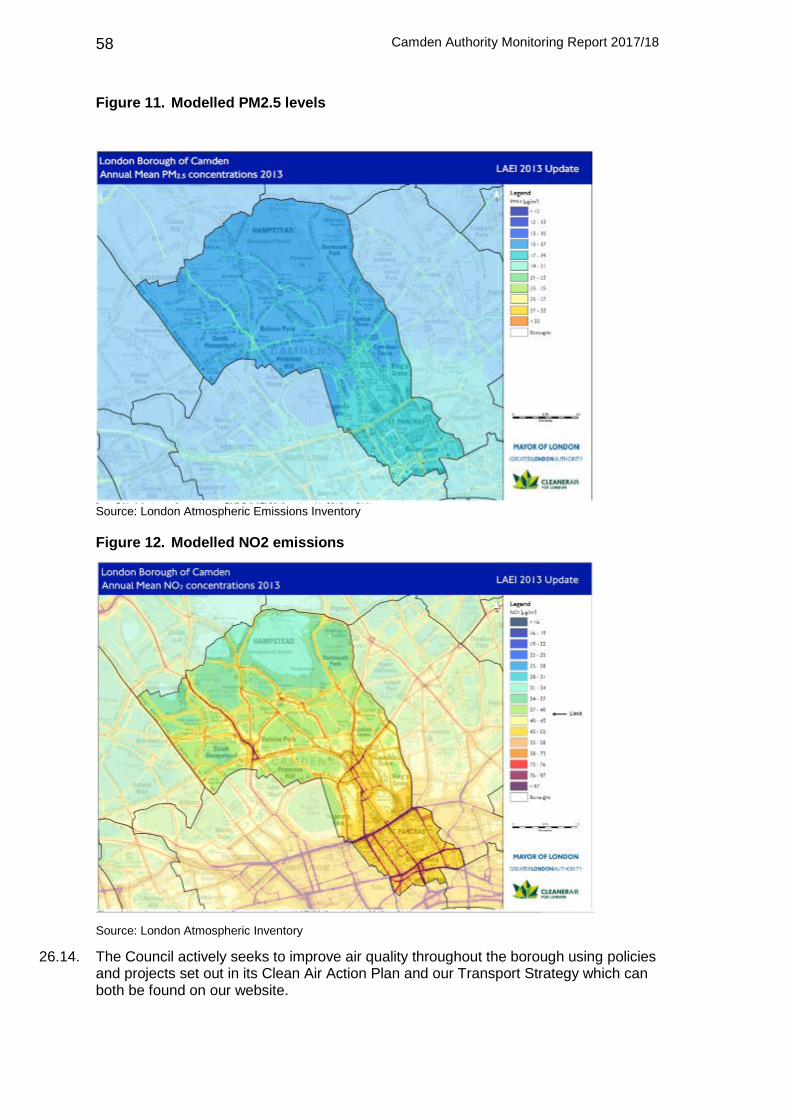
Camden Authority Monitoring Report 2017/18
58
Figure 11. Modelled PM2.5 levels
Source: London Atmospheric Emissions Inventory
Figure 12. Modelled NO2 emissions
Source: London Atmospheric Inventory
26.14. The Council actively seeks to improve air quality throughout the borough using policies and projects set out in its Clean Air Action Plan and our Transport Strategy which can both be found on our website.

Camden Authority Monitoring Report 2017/18
59
27. Open spaces and nature conservation sites
OBJECTIVE To protect and enhance the Borough’s open spaces
TARGET No net loss of open space
TARGET MET Not met (due to HS2 construction works)
RELATED POLICIES A2 Open space
Total open space
27.1. The Council’s 2014 Open Space, Sport and Recreation Study (part of the Local Plan evidence base) identified 293 open spaces in Camden, totalling an area of 588.8 hectares and representing about 27% of the borough’s land area. Of these, 258 of the spaces (88%) are accessible to the public. Hampstead Heath constitutes 46% of the total open space area in the Borough. Monitoring open space typologies helps the Council to focus resources to where they are most needed and survey any changes over time.
Table 32. Open Space Typologies in Camden 2014
Typology No. of
Sites
Area
(Ha.)
% Open
Space
area
Regional Park 0 0 0%
Metropolitan Park 1 272.9 46%
District Park 2 54.2 9%
Local Park 6 23.9 4%
Small local park / open space 34 26.4 4%
Pocket Park 33 4.9 1%
Linear open space / green corridors 22 14.1 2%
Allotments, community gardens and urban farms 12 3.4 1%
Amenity green space 83 41.0 7%
Cemeteries and Churchyards 8 25.6 4%
Civic spaces / pedestrianised areas 15 3.3 1%
Greenspaces within grounds of institution 20 55.8 9%
Natural or semi-natural urban greenspace 31 49.4 8%
Outdoor sports facilities / playing fields (education) 4 1.3 0%
Outdoor sports facilities / playing fields (private) 6 6.1 1%
Outdoor sports facilities / playing fields (public) 5 1.6 0%
Other 11 5.0 1%
Total Open Space 293 588.8 100%
Source: Camden Open Space, Sport and Recreation Study Review 2014

Camden Authority Monitoring Report 2017/18
60
Open space changes
Permissions
27.2. During 2017/18, 3 schemes were permitted which will provide new open space, delivering approximately 975 sqm (0.01 hectares). 1-6 Centric Close (2016/6891/P) (Camden Town with Primrose Hill) involves the demolition of six low-rise industrial buildings and their replacement with 1,219sqm of B1 floorspace and 76 residential units. A ‘doorstep’ play area has been secured by the Council of approx. 125 sqm which will be accessible to all the residential properties within this scheme. It is located at 4th floor level.
27.3. A second scheme (2017/0414/P) – Middlesex Hospital Annex, 44 Cleveland Road involves alterations to a former workhouse in Fitzrovia to provide 12 residential units with redevelopment of part of the site to provide 4,535 sqm of floorspace (flexible B1/D1) and 38 residential units. The proposal reinstates an historic east-west route known as Bedford Passage which will be lined with planting and seating. To the rear of the former workhouse, a new public courtyard will be created. Although this will experience some overshadowing, the design seeks to maximise sunlight and daylight by being south facing. Approximately 700sqm of additional public open space will be provided by this scheme.
27.4. A proposal involving the demolition of Castlewood House and partial demolition of Medius House, New Oxford Street (2017/0618/P) (Holborn and Covent Garden) includes provision of approximately 150sqm of public open space as a plaza on the Castlewood House site, fronting onto New Oxford Street.
Completions
27.5. In July 2017, the Somers Town bridge opened which created a new link between Gasholder Park and Camley Street. An attractive landscaped path (approx. 0.2 hectares) leads to the bridge’s entrance on the King’s Cross side. This forms part of the wider public realm and landscaping works secured as part of the King’s Cross Central development. The path connects with Gasholder Park (completed in 2016/17) which provides space for sitting and recreation.
27.6. Two major Community Investment Programme (CIP) schemes led by Camden Council were completed in 2017/18 which involve changes to open space: Maiden Lane Estate and Bourne Estate (south). More information about the CIP can be found here: https://cip.camden.gov.uk/.
27.7. The Maiden Lane scheme (2012/5552/P) (Cantelowes) is the redevelopment of the eastern part of the estate and the north western industrial estate to provide 265 dwellings and mixed employment/retail/food and drink and community uses. An objective of this scheme was to deliver an improvement to the quality and functionality of the open spaces within the development site. This delivers a small increase in the provision of open space of 140 sqm, with a total of 6,643sqm of open space being retained, enhanced or reconfigured as part of the scheme. This corresponded to an open space requirement of 4,413 sqm when calculated against the open space requirement set out in the Council’s adopted CPG6: Amenity.
27.8. The Bourne Estate scheme (2012/6372/P), Portpool Street (Holborn and Covent Garden) is a mixed-use development with 75 new dwellings, replacement community facilities and reprovision of a Multi-Use Games Area and children’s play space. The approved scheme increases the quantity of useable open space by 29% or 1,133 sqm, including an increase of 81sqm in children’s playspace. This compared to an open space requirement of 972.6 sqm as set out on the Council’s adopted CPG6: Amenity.
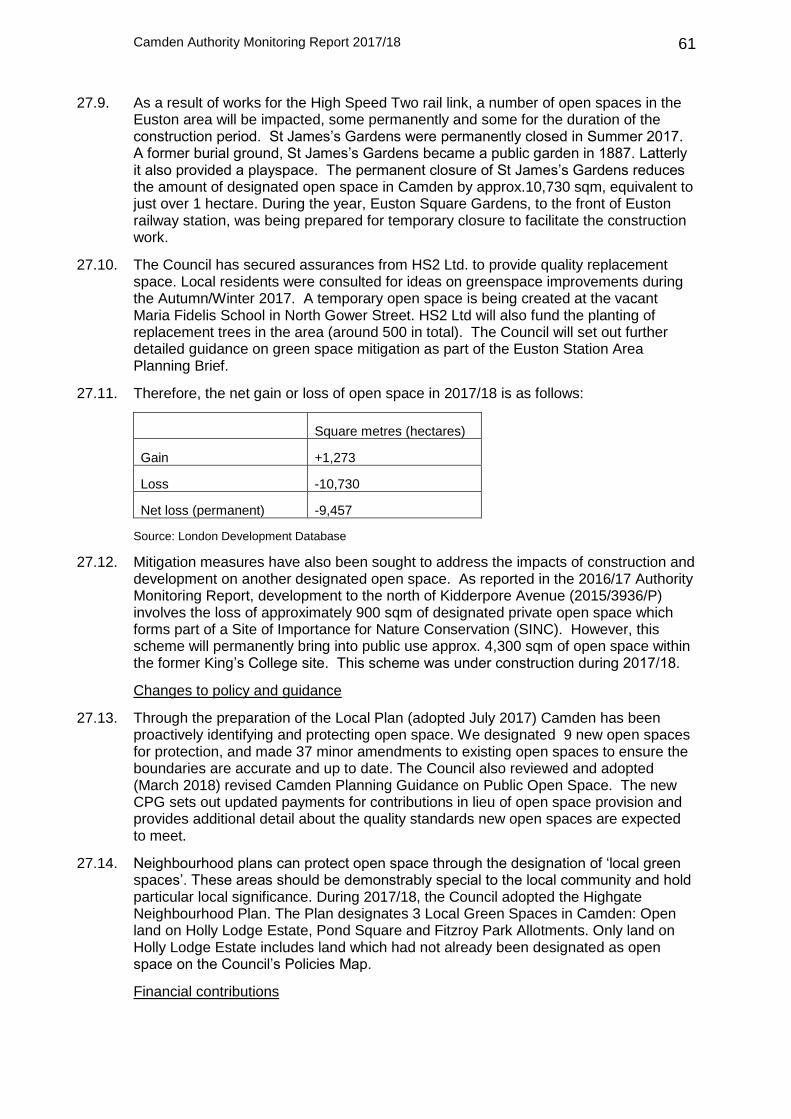
Camden Authority Monitoring Report 2017/18
61
27.9. As a result of works for the High Speed Two rail link, a number of open spaces in the Euston area will be impacted, some permanently and some for the duration of the construction period. St James’s Gardens were permanently closed in Summer 2017. A former burial ground, St James’s Gardens became a public garden in 1887. Latterly it also provided a playspace. The permanent closure of St James’s Gardens reduces the amount of designated open space in Camden by approx.10,730 sqm, equivalent to just over 1 hectare. During the year, Euston Square Gardens, to the front of Euston railway station, was being prepared for temporary closure to facilitate the construction work.
27.10. The Council has secured assurances from HS2 Ltd. to provide quality replacement space. Local residents were consulted for ideas on greenspace improvements during the Autumn/Winter 2017. A temporary open space is being created at the vacant Maria Fidelis School in North Gower Street. HS2 Ltd will also fund the planting of replacement trees in the area (around 500 in total). The Council will set out further detailed guidance on green space mitigation as part of the Euston Station Area Planning Brief.
27.11. Therefore, the net gain or loss of open space in 2017/18 is as follows:
Square metres (hectares)
Gain +1,273
Loss -10,730
Net loss (permanent) -9,457
Source: London Development Database
27.12. Mitigation measures have also been sought to address the impacts of construction and development on another designated open space. As reported in the 2016/17 Authority Monitoring Report, development to the north of Kidderpore Avenue (2015/3936/P) involves the loss of approximately 900 sqm of designated private open space which forms part of a Site of Importance for Nature Conservation (SINC). However, this scheme will permanently bring into public use approx. 4,300 sqm of open space within the former King’s College site. This scheme was under construction during 2017/18.
Changes to policy and guidance
27.13. Through the preparation of the Local Plan (adopted July 2017) Camden has been proactively identifying and protecting open space. We designated 9 new open spaces for protection, and made 37 minor amendments to existing open spaces to ensure the boundaries are accurate and up to date. The Council also reviewed and adopted (March 2018) revised Camden Planning Guidance on Public Open Space. The new CPG sets out updated payments for contributions in lieu of open space provision and provides additional detail about the quality standards new open spaces are expected to meet.
27.14. Neighbourhood plans can protect open space through the designation of ‘local green spaces’. These areas should be demonstrably special to the local community and hold particular local significance. During 2017/18, the Council adopted the Highgate Neighbourhood Plan. The Plan designates 3 Local Green Spaces in Camden: Open land on Holly Lodge Estate, Pond Square and Fitzroy Park Allotments. Only land on Holly Lodge Estate includes land which had not already been designated as open space on the Council’s Policies Map.
Financial contributions

Camden Authority Monitoring Report 2017/18
62
27.15. It should be noted that for most schemes in Camden, it is difficult to create new areas of open space on-site. Subject to a threshold, the Council will seek a financial contribution in lieu of provision (once the option of providing open space on or off-site has been explored). Some smaller open space projects are now also being funded by the local proportion of the Community Infrastructure Levy (CIL).
27.16. The payments in lieu are invested by the Council, through its ‘Greenspace Improvement Programme’, in projects to help manage the pressure of development on existing open spaces. During 2017/18, planning obligations secured through Section 106 part or fully funded a number of these projects. Examples (and level of contribution) include:
- Improvements to accessibility at Cumberland Market in Regents Park ward (45k)
- Renovation of Bucklebury Multi-Use Games Area in Regents Park Estate (94k) - Iverson Road Open Space (West Hampstead) – renewal of the neighbourhood
play area, with new fitness provision and resurfaced ball court. (187k, part S106)
- Sumatra Road Open Space (West Hampstead) – renewal of the neighbourhood play area (122k, part S106)
- Wicklow Street Open Space (King’s Cross) – renewal of the neighbourhood play space, including new fitness equipment (93k, mainly S106)
- Goldington Crescent Gardens (Somers Town) – more sustainable planting, renewal of paths and damaged perimeter railings, and River Fleet interpretation plaque (108k)
- Elm Village Open Space (Somers Town) – accessibility improvements to open space (98k)
- Tennis Court upgrades at Lincolns Inn Fields, Kilburn Grange Park and Waterlow Park (180k)
- Lismore Circus (Gospel Oak) – general repairs (6k)
28. Areas of biodiversity importance
OBJECTIVE To protect and enhance the environment
TARGET No net loss in area and populations of biodiversity
TARGET MET No / unknown
RELATED POLICIES A3 Biodiversity
28.1. Natural habitats and species are protected by Local Plan policy A3: Biodiversity. As part of the evidence base for the Local Plan, LB Camden commissioned the London Wildlife Trust to undertake a review of the Sites of Importance for Nature Conservation (SINC) within the Borough.
28.2. Surveys of the SINCs and the identification of additional sites were undertaken in April - June 2014. This considered the need for boundary changes (loss or gain of SINC valued habitat) using the GLA Open Space and Habitat Survey for Greater London SINC Status Criteria. The adoption of the Local Plan in July 2017 brought into effect changes to the boundaries of 14 SINCs and the designation of new SINCs at Fitzroy Park Allotments, Hampstead Green and St. Martin’s Gardens. We also deleted land designated as SINC at Midland Crescent, West Hampstead (part of the West Hampstead Railsides, Medley Orchard and Westbere Copse SINC). This corrected an error on the Policies Map as the role of this land had already been considered at the examination of the Local Development Framework and in connection with a proposed development scheme (2014/5527/P). Detailed explanation for the site changes is set

Camden Authority Monitoring Report 2017/18
63
out in the London Wildlife Trust’s SINC Review, which can also be found on the Council’s website: https://beta.camden.gov.uk/evidence-and-supporting-documents. Table 32 below summarises the areas of biodiversity importance.
28.3. As stated in the previous section on open space, development of land to the north of Kidderpore Avenue (2015/3936/P) (the former King’s College Hampstead campus) will result in the loss of open space forming a designated SINC. During 2017/18, construction works on this extensive site were underway. To offset the loss of approx. 900sqm (0.09 ha.) of SINC, the Council secured a package of mitigation measures to ensure that habitats will continue to thrive within the site and it retains its biodiversity value. Commitments made by the applicants include the creation of a new pond, large enough for amphibians to inhabit; the planting of native species across the site to provide structural and species diversity and the engagement of residents and the wider community to develop a volunteer workforce for managing the habitats (this builds on the Council’s approach of managing nature reserves through the establishment of a ‘Green Gym’).
Table 33. Areas of biodiversity importance
Designation type
Number of
sites
Area
(ha)
Sites of Special scientific Interest 1 16.1
Sites of Metropolitan Importance 5 323.8
Sites of Borough Importance Grade 1 7 39.8
Sites of Borough Importance Grade 2 9 31.9
Sites of Local Importance 15 18.4
Total 37 430.0
Source:Greenspace Information for Greater London 2014.
29. Safeguarding of the Regis Road waste site
29.1. No new waste management facilities were permitted or constructed in Camden in 2017/18. Camden has one waste management facility safeguarded under Local Plan Policy CC5 – Waste, the Regis Road waste site. Regis Road is a civic amenity site, recycling and reuse centre accepting both household waste and recyclable materials.
OBJECTIVE To reduce, plan for and manage Camden’s waste
TARGET Safeguard Camden’s existing waste site at Regis Road unless a suitable compensatory waste site is provided that replaces the maximum throughput achievable at the existing site
TARGET MET Yes
RELATED POLICIES
CC5 Waste

Camden Authority Monitoring Report 2017/18
64
30. Municipal waste arisings and household recycling rates
OBJECTIVE To reduce, plan for and manage Camden’s waste
TARGET Reduce the amount of waste produced
Recycle and compost 50% of household waste by 2020 and aspiring to achieve 60% by 2031
TARGET MET Partly
RELATED POLICIES CC5 Waste
30.1. The Camden Local Plan (2017) sets out the aim of increasing recycling and composting in the borough to meet the London Plan target of 50% of household waste recycled by 2020 and 60% by 2031.
30.2. The total local authority collected waste for Camden in 2017/18 was 94,441 tonnes, down from 128,104 tonnes in 2008/09, a reduction of 26 percent.
30.3. The total amount of household waste collected was 60,470, of which 18,340 tonnes (30%) was reused, recycled or composted. The rate of reuse, recycling and composting for household waste has fluctuated between 28 and 33 percent since 2008/09, remaining substantially below the 2020 target of 50 percent.
30.4. The total amount of non-household waste collected was 33,971, of which 5,101 tonnes (15%) was reused, recycled or composted, an increase by 5% from 2008/09, but down from 20% in 2015/16.
Figure 13. LB Camden Municipal Waste Arisings
Year
Total
local
authority
collecte
d waste
(tonnes)
Househol
d - total
waste
(tonnes)
Household -
waste sent
for
recycling/
composting
/ reuse
(tonnes)
Househol
d - waste
not sent
for
recycling
(residual
household
waste)
(tonnes)
% of
househol
d waste
recycled
Non-
household
- total
waste
(tonnes)
Non-
household -
waste sent
for
recycling/
composting
/ reuse
(tonnes)
% of non-
househol
d waste
recycled
2008/09 128,104 72,122 20,391 51,730 28% 53,139 2,843 5%
2009/10 124,416 70,163 20,875 49,287 30% 53,482 2,831 5%
2010/11 121,358 76,518 24,691 51,827 32% 44,840 3,075 7%
2011/12 117,687 76,266 25,184 51,082 33% 41,421 2,912 7%
2012/13 111,514 68,900 21,349 47,551 31% 42,614 2,445 6%
2013/14 111,694 72,732 21,327 51,405 29% 38,962 2,051 5%
2014/15 114,684 82,371 21,627 60,744 26% 32,313 4,942 15%
2015/16 113,687 79,730 19,795 59,935 25% 33,957 6,719 20%
2016/17 108,813 74,602 19,871 54,732 27% 34,210 4,513 13%
2017/18 94,441 60,470 18,340 42,130 30% 33,971 5,101 15%
Source: ENV18 - Local authority collected waste: annual results tables. https://www.gov.uk/government/statistical-data-
sets/env18-local-authority-collected-waste-annual-results-tables#history
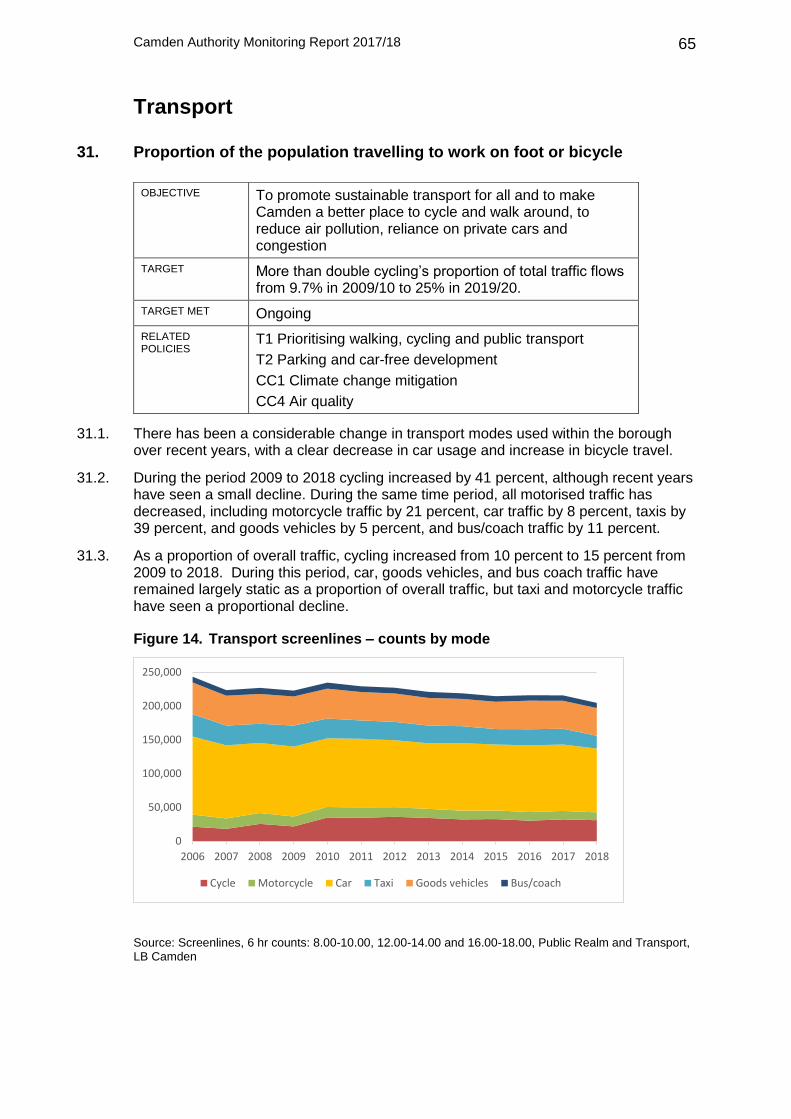
Camden Authority Monitoring Report 2017/18
65
Transport
31. Proportion of the population travelling to work on foot or bicycle
31.1. There has been a considerable change in transport modes used within the borough over recent years, with a clear decrease in car usage and increase in bicycle travel.
31.2. During the period 2009 to 2018 cycling increased by 41 percent, although recent years have seen a small decline. During the same time period, all motorised traffic has decreased, including motorcycle traffic by 21 percent, car traffic by 8 percent, taxis by 39 percent, and goods vehicles by 5 percent, and bus/coach traffic by 11 percent.
31.3. As a proportion of overall traffic, cycling increased from 10 percent to 15 percent from 2009 to 2018. During this period, car, goods vehicles, and bus coach traffic have remained largely static as a proportion of overall traffic, but taxi and motorcycle traffic have seen a proportional decline.
Figure 14. Transport screenlines – counts by mode
Source: Screenlines, 6 hr counts: 8.00-10.00, 12.00-14.00 and 16.00-18.00, Public Realm and Transport, LB Camden
0
50,000
100,000
150,000
200,000
250,000
2006 2007 2008 2009 2010 2011 2012 2013 2014 2015 2016 2017 2018
Cycle Motorcycle Car Taxi Goods vehicles Bus/coach
OBJECTIVE To promote sustainable transport for all and to make Camden a better place to cycle and walk around, to reduce air pollution, reliance on private cars and congestion
TARGET More than double cycling’s proportion of total traffic flows from 9.7% in 2009/10 to 25% in 2019/20.
TARGET MET Ongoing
RELATED POLICIES
T1 Prioritising walking, cycling and public transport
T2 Parking and car-free development
CC1 Climate change mitigation
CC4 Air quality

Camden Authority Monitoring Report 2017/18
66
Figure 15. Transport screenlines – percentage of counts by mode
Source: Screenlines, 6 hr counts: 8.00-10.00, 12.00-14.00 and 16.00-18.00, Public Realm and Transport, LB Camden
Note: The reductions in the levels of cycle usage in 2008 and 2009 may be attributed to the fact that 2008 surveys were carried out in May and 2009 surveys in March when the weather conditions were unfavourable for cyclists.
32. Traffic flows
32.1. Traffic in Camden has decreased significantly since 1994 in contrast to the national trends of increasing traffic. Traffic has declined at faster pace in Camden than London as a whole.
32.2. Recent years traffic levels have seen a small increase. Camden reached a low point of 443 million vehicle kilometres in 2013, which increased to 450 million vehicle kilometres in 2015, and then fell marginally to 447 vehicle kilometres by 2017.
32.3. In the 10 year period 2007 to 2017 traffic in Camden reduced by 13%, putting it in the top 10 largest reductions of traffic in the 33 London Boroughs. Figure 3 shows the longer term trends from 1994. The sharp decline for Camden observed in 2004 is due to introduction of the congestion charging zone.
0
10
20
30
40
50
60
70
80
90
100
2006 2007 2008 2009 2010 2011 2012 2013 2014 2015 2016 2017 2018
%
Cycle Motorcycle Car Taxi Goods vehicles Bus/coach
OBJECTIVE To promote sustainable transport for all and to make Camden a better place to cycle and walk around, to reduce air pollution, reliance on private cars and congestion
TARGET To reduce motor vehicle traffic
TARGET MET Ongoing
RELATED POLICIES
T1 Prioritising walking, cycling and public transport
T2 Parking and car-free development
CC1 Climate change mitigation
CC4 Air quality

Camden Authority Monitoring Report 2017/18
67
Figure 16. Motor vehicle traffic, percentage change from 1994 levels
Source: Department for Transport statistics, Motor vehicle traffic (vehicle kilometres) by local authority in Great Britain, annual from 1993, annual from 1993 to 2016 (Table TRA8904).
33. Car free and car capped developments
OBJECTIVE To promote sustainable transport for all and to make Camden a better place to cycle and walk around, to reduce air pollution, reliance on private cars and congestion
TARGET All new developments in the borough to be car free
TARGET MET? Ongoing
RELATED POLICIES
T1 Prioritising walking, cycling and public transport
T2 Parking and car-free development
A1 Managing the impact of development
CC1 Climate change mitigation
CC4 Air quality
33.1. Camden’s Local Plan (2017), Policy T2 Parking and car-free development, expects all new developments to be car free.
33.2. Car-free development means that no car parking spaces are provided within the site other than those reserved for disabled people and businesses and services reliant upon parking, where this is integral to their nature, operational and/or servicing requirements (e.g. emergency services, storage and distribution uses). In addition, current and future occupiers are not issued with on-street parking permits. Car capped refers to restricting any increase in on-site spaces or additional on street permits from the level of existing provision.
33.3. In redevelopment schemes, the Council will consider retaining or reproviding existing parking provision where it can be demonstrated that the existing occupiers are to return to the address when the development is completed.
0%
20%
40%
60%
80%
100%
120%
140%
19
95
19
96
19
97
19
98
19
99
20
00
20
01
20
02
20
03
20
04
20
05
20
06
20
07
20
08
20
09
20
10
20
11
20
12
20
13
20
14
20
15
20
16
20
17
Great Britain London Camden

Camden Authority Monitoring Report 2017/18
68
33.4. In 2017-18 688 dwellings were completed in schemes with car free or car capped agreements - that is, that do not have a parking space or permit in addition to any existing car parking spaces available on the site.
Figure 17. Net dwellings completed with a car free/car capped agreement
Source: Section 106 database, London Development Database
34. Travel Plans
OBJECTIVE To promote sustainable transport for all and to make Camden a better place to cycle and walk around, to reduce air pollution, reliance on private cars and congestion
TARGET Increase in the total number of travel plans agreed for new developments
TARGET MET Ongoing
RELATED POLICIES
T1 Prioritising walking, cycling and public
transport
T2 Parking and car-free development
A1 Managing the impact of development
CC1 Climate change mitigation
CC4 Air quality
34.1. Schemes have to produce a travel plan if the development significantly increases transport demand or if any increase is likely to be using unsustainable forms of transport. In 2017/18, 21 schemes were permitted with travel plans.
378 351273 240
424526
943
688
0
100
200
300
400
500
600
700
800
900
1000
2010-11 2011-12 2012-13 2013-14 2014-15 2015-16 2016-17 2017-18
Ne
t d
we
llin
gs c
om
ple
ted
wit
h a
car
fre
e
or
car
cap
pe
d a
gre
em
en
t
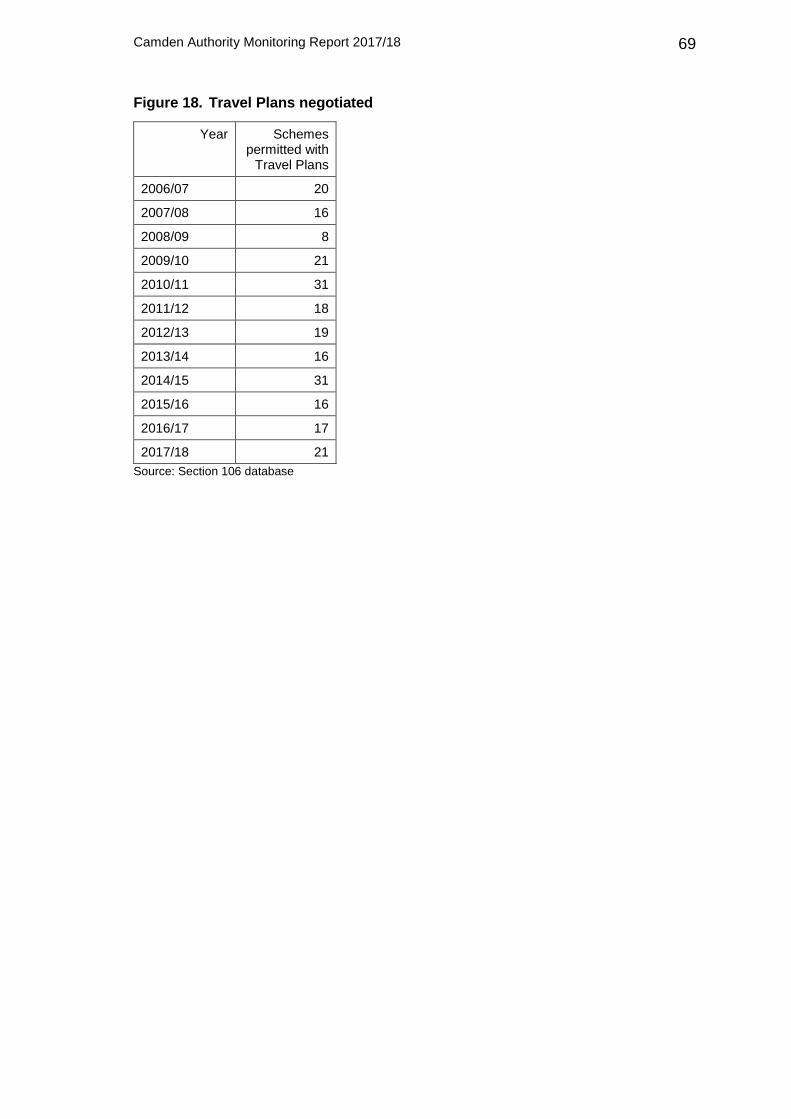
Camden Authority Monitoring Report 2017/18
69
Figure 18. Travel Plans negotiated
Year Schemes permitted with
Travel Plans
2006/07 20
2007/08 16
2008/09 8
2009/10 21
2010/11 31
2011/12 18
2012/13 19
2013/14 16
2014/15 31
2015/16 16
2016/17 17
2017/18 21
Source: Section 106 database
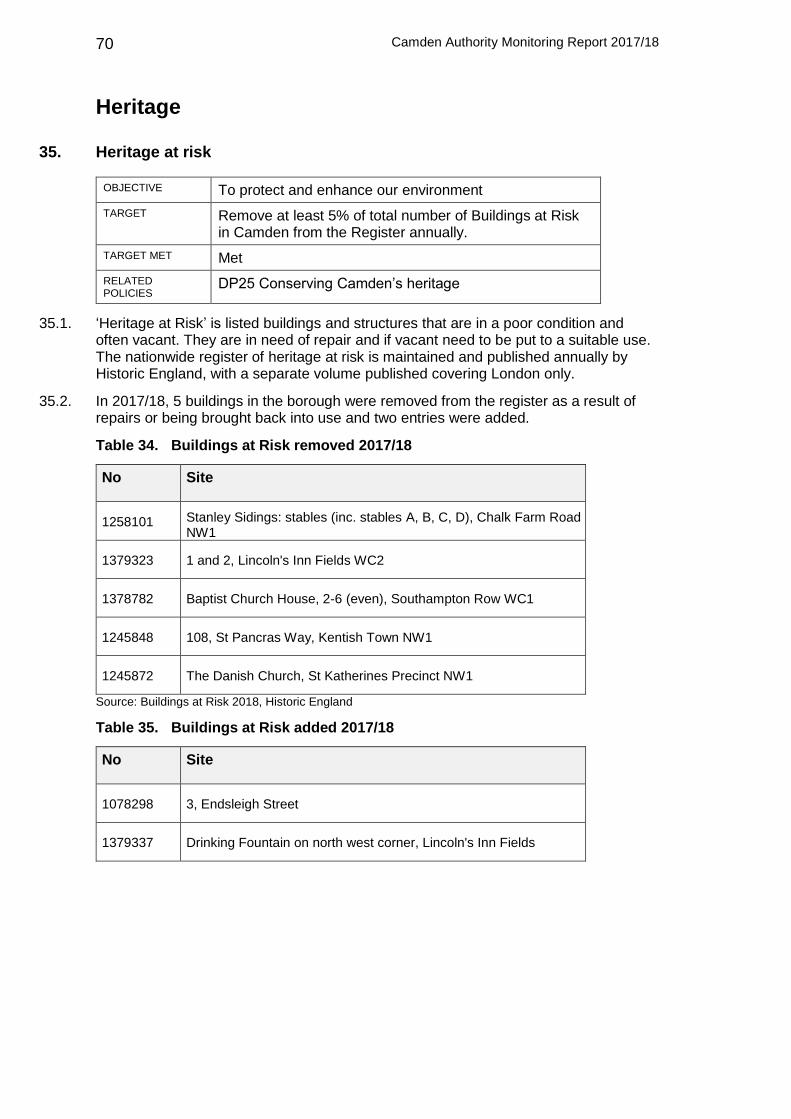
Camden Authority Monitoring Report 2017/18
70
Heritage
35. Heritage at risk
OBJECTIVE To protect and enhance our environment
TARGET Remove at least 5% of total number of Buildings at Risk in Camden from the Register annually.
TARGET MET Met
RELATED POLICIES
DP25 Conserving Camden’s heritage
35.1. ‘Heritage at Risk’ is listed buildings and structures that are in a poor condition and often vacant. They are in need of repair and if vacant need to be put to a suitable use. The nationwide register of heritage at risk is maintained and published annually by Historic England, with a separate volume published covering London only.
35.2. In 2017/18, 5 buildings in the borough were removed from the register as a result of repairs or being brought back into use and two entries were added.
Table 34. Buildings at Risk removed 2017/18
No Site
35.3. 1258101 Stanley Sidings: stables (inc. stables A, B, C, D), Chalk Farm Road NW1
35.4. 1379323 35.5. 1 and 2, Lincoln's Inn Fields WC2
35.6. 1378782 35.7. Baptist Church House, 2-6 (even), Southampton Row WC1
35.8. 1245848 35.9. 108, St Pancras Way, Kentish Town NW1
35.10. 1245872 35.11. The Danish Church, St Katherines Precinct NW1
Source: Buildings at Risk 2018, Historic England
Table 35. Buildings at Risk added 2017/18
No Site
35.12. 1078298 35.13. 3, Endsleigh Street
35.14. 1379337 35.15. Drinking Fountain on north west corner, Lincoln's Inn Fields

Camden Authority Monitoring Report 2017/18
71
Table 36. Buildings at Risk in Camden 2009–2018
Year Buildings removed since previous year
Buildings added since previous year
Buildings at Risk entries
2009 4 3 55
2010 4 2 53
2011 6 3 49
2012 10 4 43
2013 6 3 40
2014 5 8 43
2015 3 2 42
2016 2 4 44
2017 7 0 37
2018 5 2 34
Source: Buildings at Risk 2018, English Heritage
35.16. Please note that entries on the statutory list of buildings of special architectural or historic interest may comprise a number of separate buildings.
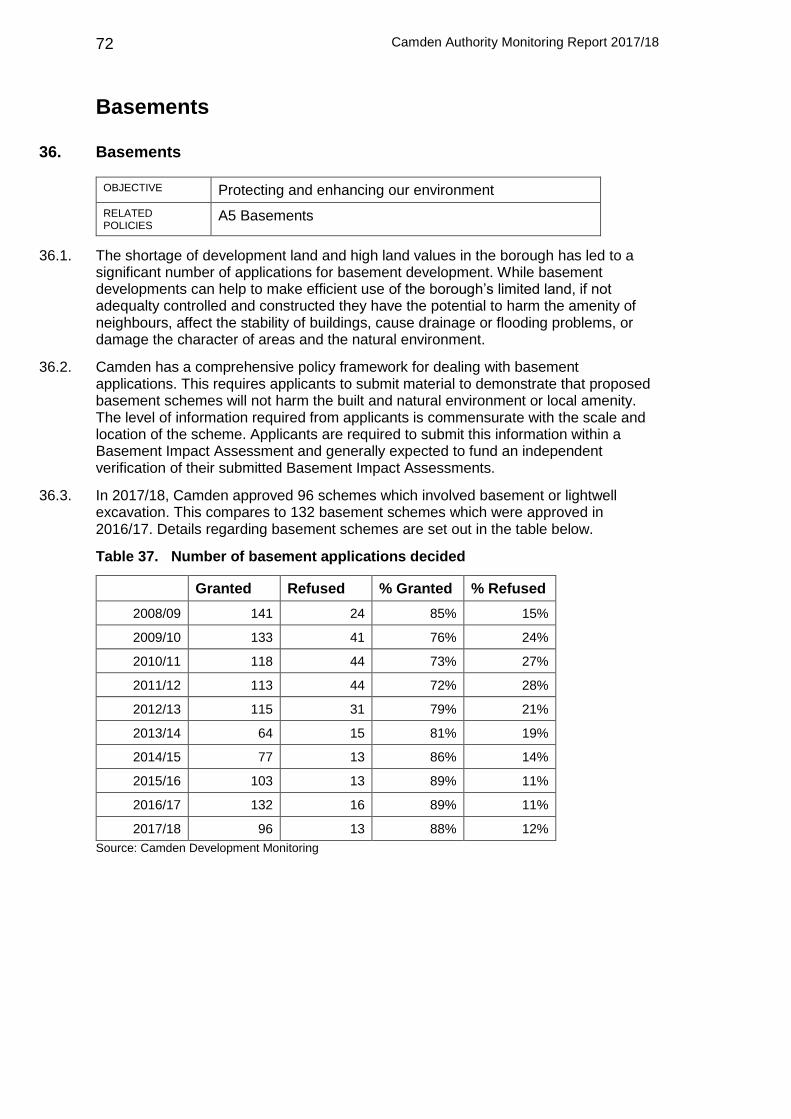
Camden Authority Monitoring Report 2017/18
72
Basements
36. Basements
OBJECTIVE Protecting and enhancing our environment
RELATED POLICIES
A5 Basements
36.1. The shortage of development land and high land values in the borough has led to a significant number of applications for basement development. While basement developments can help to make efficient use of the borough’s limited land, if not adequalty controlled and constructed they have the potential to harm the amenity of neighbours, affect the stability of buildings, cause drainage or flooding problems, or damage the character of areas and the natural environment.
36.2. Camden has a comprehensive policy framework for dealing with basement applications. This requires applicants to submit material to demonstrate that proposed basement schemes will not harm the built and natural environment or local amenity. The level of information required from applicants is commensurate with the scale and location of the scheme. Applicants are required to submit this information within a Basement Impact Assessment and generally expected to fund an independent verification of their submitted Basement Impact Assessments.
36.3. In 2017/18, Camden approved 96 schemes which involved basement or lightwell excavation. This compares to 132 basement schemes which were approved in 2016/17. Details regarding basement schemes are set out in the table below.
Table 37. Number of basement applications decided
Granted Refused % Granted % Refused
2008/09 141 24 85% 15%
2009/10 133 41 76% 24%
2010/11 118 44 73% 27%
2011/12 113 44 72% 28%
2012/13 115 31 79% 21%
2013/14 64 15 81% 19%
2014/15 77 13 86% 14%
2015/16 103 13 89% 11%
2016/17 132 16 89% 11%
2017/18 96 13 88% 12%
Source: Camden Development Monitoring
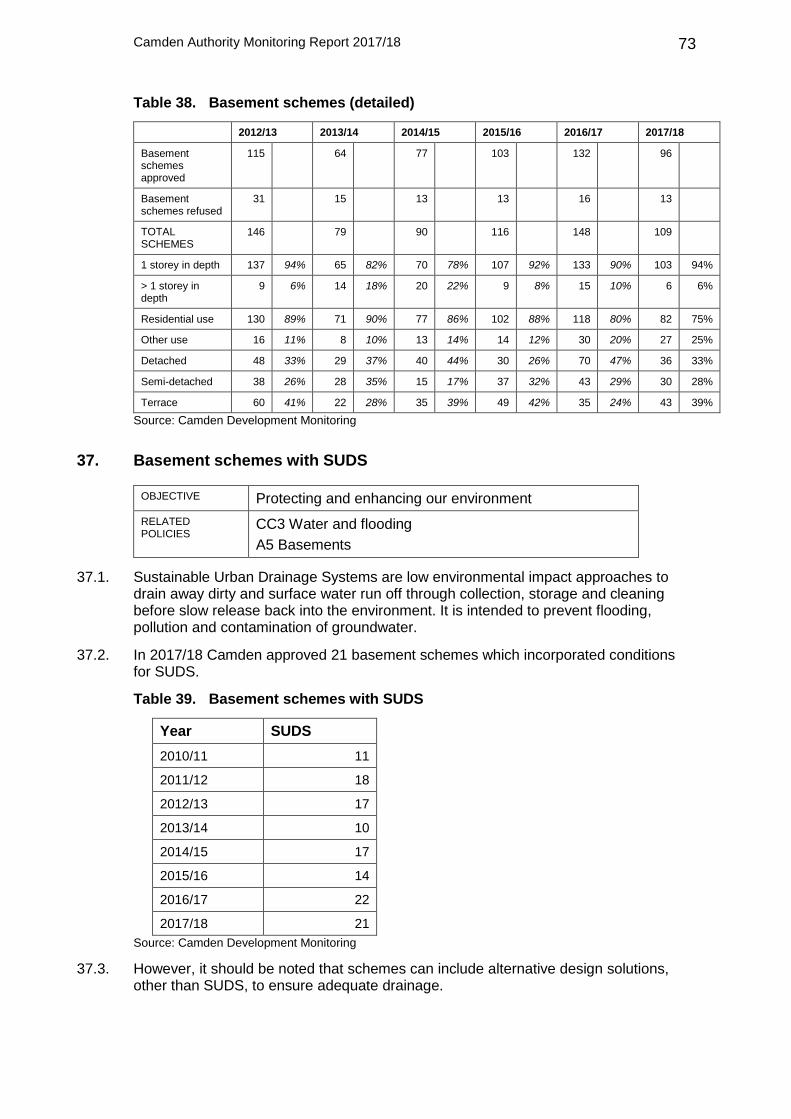
Camden Authority Monitoring Report 2017/18
73
Table 38. Basement schemes (detailed)
2012/13 2013/14 2014/15 2015/16 2016/17 2017/18
Basement schemes approved
115
64
77
103
132 96
Basement schemes refused
31
15
13
13
16 13
TOTAL SCHEMES
146
79
90
116
148 109
1 storey in depth 137 94% 65 82% 70 78% 107 92% 133 90% 103 94%
> 1 storey in depth
9 6% 14 18% 20 22% 9 8% 15 10% 6 6%
Residential use 130 89% 71 90% 77 86% 102 88% 118 80% 82 75%
Other use 16 11% 8 10% 13 14% 14 12% 30 20% 27 25%
Detached 48 33% 29 37% 40 44% 30 26% 70 47% 36 33%
Semi-detached 38 26% 28 35% 15 17% 37 32% 43 29% 30 28%
Terrace 60 41% 22 28% 35 39% 49 42% 35 24% 43 39%
Source: Camden Development Monitoring
37. Basement schemes with SUDS
OBJECTIVE Protecting and enhancing our environment
RELATED POLICIES
CC3 Water and flooding
A5 Basements
37.1. Sustainable Urban Drainage Systems are low environmental impact approaches to drain away dirty and surface water run off through collection, storage and cleaning before slow release back into the environment. It is intended to prevent flooding, pollution and contamination of groundwater.
37.2. In 2017/18 Camden approved 21 basement schemes which incorporated conditions for SUDS.
Table 39. Basement schemes with SUDS
Year SUDS
2010/11 11
2011/12 18
2012/13 17
2013/14 10
2014/15 17
2015/16 14
2016/17 22
2017/18 21
Source: Camden Development Monitoring
37.3. However, it should be noted that schemes can include alternative design solutions, other than SUDS, to ensure adequate drainage.
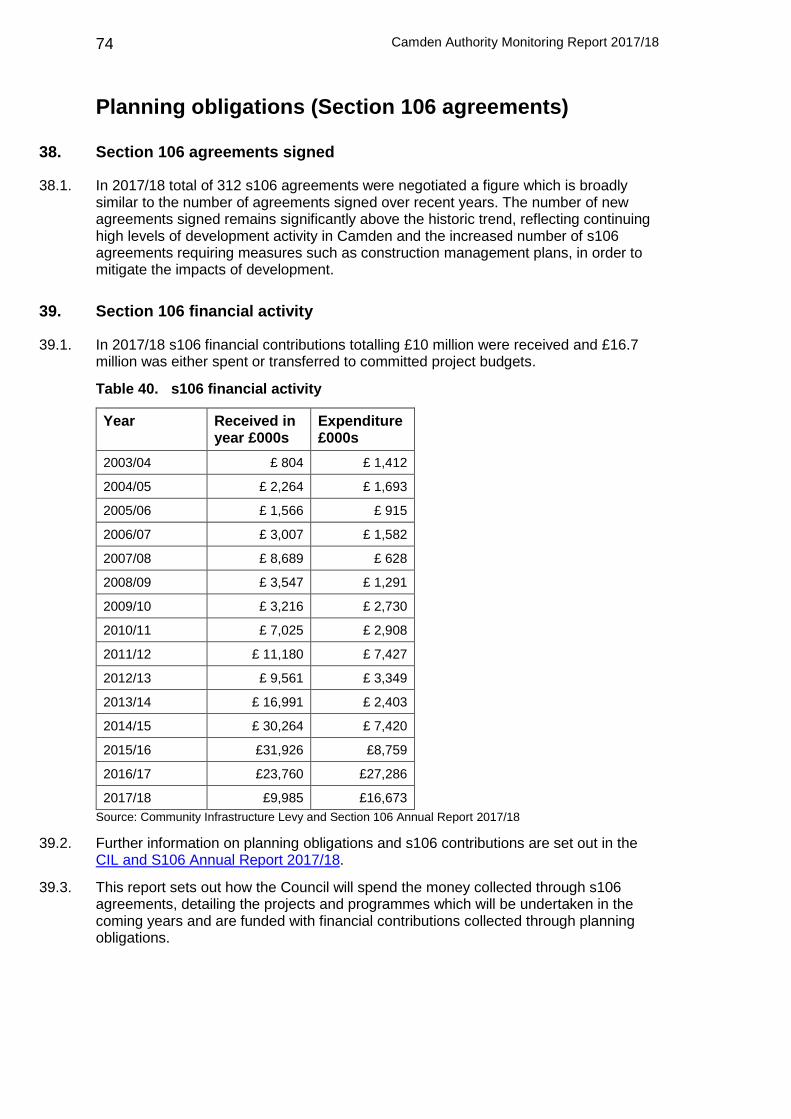
Camden Authority Monitoring Report 2017/18
74
Planning obligations (Section 106 agreements)
38. Section 106 agreements signed
38.1. In 2017/18 total of 312 s106 agreements were negotiated a figure which is broadly similar to the number of agreements signed over recent years. The number of new agreements signed remains significantly above the historic trend, reflecting continuing high levels of development activity in Camden and the increased number of s106 agreements requiring measures such as construction management plans, in order to mitigate the impacts of development.
39. Section 106 financial activity
39.1. In 2017/18 s106 financial contributions totalling £10 million were received and £16.7 million was either spent or transferred to committed project budgets.
Table 40. s106 financial activity
Year Received in year £000s
Expenditure £000s
2003/04 £ 804 £ 1,412
2004/05 £ 2,264 £ 1,693
2005/06 £ 1,566 £ 915
2006/07 £ 3,007 £ 1,582
2007/08 £ 8,689 £ 628
2008/09 £ 3,547 £ 1,291
2009/10 £ 3,216 £ 2,730
2010/11 £ 7,025 £ 2,908
2011/12 £ 11,180 £ 7,427
2012/13 £ 9,561 £ 3,349
2013/14 £ 16,991 £ 2,403
2014/15 £ 30,264 £ 7,420
2015/16 £31,926 £8,759
2016/17 £23,760 £27,286
2017/18 £9,985 £16,673
Source: Community Infrastructure Levy and Section 106 Annual Report 2017/18
39.2. Further information on planning obligations and s106 contributions are set out in the CIL and S106 Annual Report 2017/18.
39.3. This report sets out how the Council will spend the money collected through s106 agreements, detailing the projects and programmes which will be undertaken in the coming years and are funded with financial contributions collected through planning obligations.
Camden Authority Monitoring Report 2017/18
75
Infrastructure
40. Delivery of identified infrastructure projects (Appendix 1 of the Local Plan)
OBJECTIVE Support Camden’s growth and development
TARGET Various
TARGET MET Part met
RELATED POLICIES
Local Plan policy DM1 Delivery and monitoring
Table 21 below provides updates to the Council’s latest infrastructure table which was published as part of Local Plan evidence work and is included as an appendix in the adopted Local Plan. See table on following pages which repeats the Local Plan Infrastructure Table with an aditional comments column added:


Camden Authority Monitoring Report 2017/18
77
Table 41. Local Plan Infrastructure table update
40.1. Item No.
40.2. Infrastructure item / programme name
40.3. Project / programme description
40.4. Location 40.5. Delivery lead
40.6. Delivery period
40.7. Comments 40.8. Status
40.9. Children and Education Services 40.10.
40.11. 1 40.12. Early years 40.13. Provision of additional 545 full time equivalent early years places (for three and four year olds) to meet identified need. Extending the early years’ places to the most disadvantaged 2 year olds.
40.14. Borough wide 40.15. LB Camden – Children, Schools and Families Directorate
40.16. 2017-2031. 40.17. Funding partly through S106 where need arises. Potentially through CIL in the future. Places based on statutory requirement of 15 hours per week. From September 2014, the Government extended eligibility to the 40% of the most disadvantaged 2 year olds. It is expected over 900 children in Camden will be able to qualify
Ongoing project
40.18. 2 40.19. Primary Schools 40.20. Expansion of Kingsgate School, Liddell Road (2 Form entry).
40.21. West Hampstead (North West sub area)
40.22. LB Camden – Children, Schools and Families Directorate (School Place Planning)
40.23. 2016/17 40.24. Schools’ capacity is planned taking into account projected population growth and information on housing sites (e.g. Camden’s Site Allocations). Government funding is used for school place provision and some developer contributions (including provision in kind). Liddell Road is one of the Council’s Community Investment Programme schemes. Provision at King’s Cross
40.25. New school building to open at Kingsgate School in September 2017.

Camden Authority Monitoring Report 2017/18
78
Academy, Kingsgate School and Hawley is considered to provide sufficient primary school places until at least 2024. Additional capacity of 1FE could potentially be made available at Edith Neville school if required – see below.
40.26. 3 40.27. Primary Schools 40.28. New school (2 Form entry) – King’s Cross Academy.
40.29. King’s Cross (South of Euston Road sub area)
40.30. LB Camden – Children, Schools and Families Directorate (School Place Planning)
40.31. 2015 40.32. As above 40.33. Delivered – 2 Form Entry from 2015/16.
40.34. 4 40.35. Primary Schools 40.36. Hawley School – additional 123 places (as part of the Hawley Wharf development)
40.37. Camden Town with Primrose Hill (Central North sub area)
40.38. LB Camden – Children, Schools and Families Directorate (School Place Planning)
40.39. 2016/17 40.40. As above 40.41. In September 2016 Hawley Primary School expanded into new buildings in the Hawley Wharf development (1 Form Entry).
40.42. 5 40.43. Primary Schools 40.44. Abacus Belsize School – expansion of provision (1 Form entry) (unconfirmed).
40.45. Belsize (Central North sub area)
40.46. Free school / Department for Education
40.47. 2017 40.48. As above. 40.49. Abacus Belsize School (1 Form Entry) is temporarily located at Jubilee Waterside Centre, Camley Street. Camden’s Planning Committee rejected proposals for the conversion of Hampstead Police Station to provide a 2 Form Entry school in July 2016.
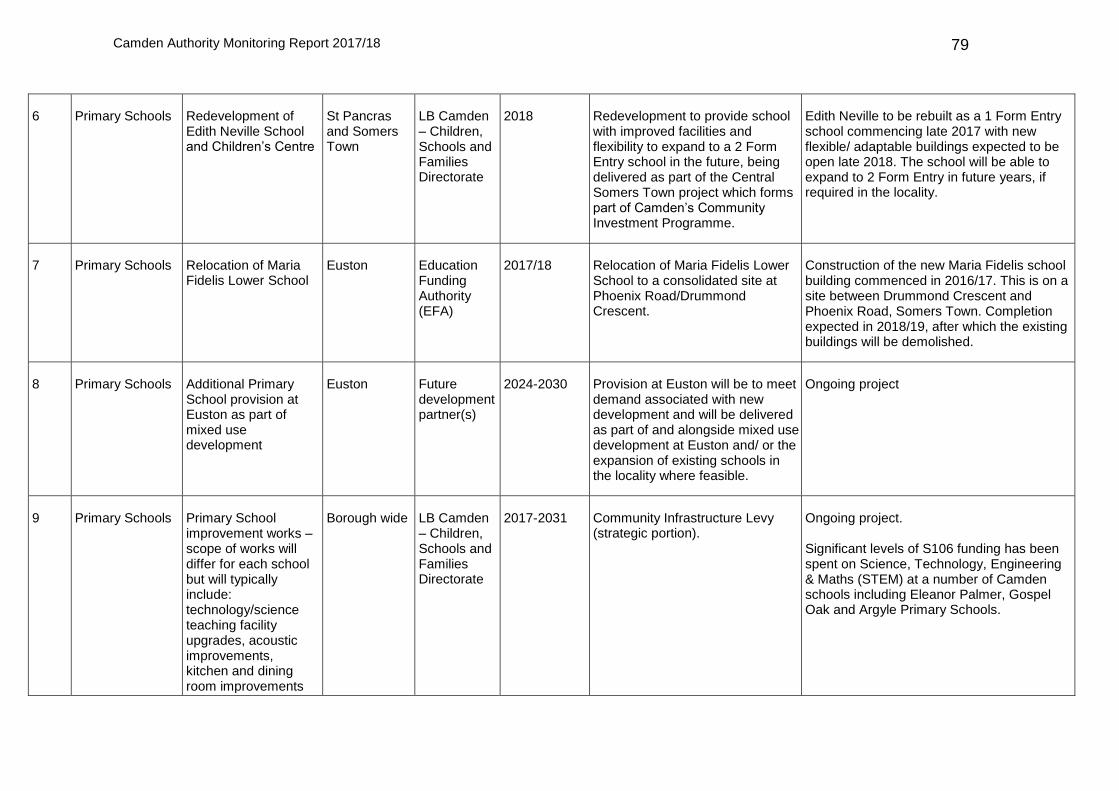
Camden Authority Monitoring Report 2017/18
79
40.50. 6 40.51. Primary Schools 40.52. Redevelopment of Edith Neville School and Children’s Centre
40.53. St Pancras and Somers Town
40.54. LB Camden – Children, Schools and Families Directorate
40.55. 2018 40.56. Redevelopment to provide school with improved facilities and flexibility to expand to a 2 Form Entry school in the future, being delivered as part of the Central Somers Town project which forms part of Camden’s Community Investment Programme.
40.57. Edith Neville to be rebuilt as a 1 Form Entry school commencing late 2017 with new flexible/ adaptable buildings expected to be open late 2018. The school will be able to expand to 2 Form Entry in future years, if required in the locality.
40.58. 7 40.59. Primary Schools 40.60. Relocation of Maria Fidelis Lower School
40.61. Euston 40.62. Education Funding Authority (EFA)
40.63. 2017/18 40.64. Relocation of Maria Fidelis Lower School to a consolidated site at Phoenix Road/Drummond Crescent.
40.65. Construction of the new Maria Fidelis school building commenced in 2016/17. This is on a site between Drummond Crescent and Phoenix Road, Somers Town. Completion expected in 2018/19, after which the existing buildings will be demolished.
40.66. 8 40.67. Primary Schools 40.68. Additional Primary School provision at Euston as part of mixed use development
40.69. Euston 40.70. Future development partner(s)
40.71. 2024-2030 40.72. Provision at Euston will be to meet demand associated with new development and will be delivered as part of and alongside mixed use development at Euston and/ or the expansion of existing schools in the locality where feasible.
40.73. Ongoing project
40.74. 9 40.75. Primary Schools 40.76. Primary School improvement works – scope of works will differ for each school but will typically include: technology/science teaching facility upgrades, acoustic improvements, kitchen and dining room improvements
40.77. Borough wide 40.78. LB Camden – Children, Schools and Families Directorate
40.79. 2017-2031 40.80. Community Infrastructure Levy (strategic portion).
40.81. Ongoing project. Significant levels of S106 funding has been spent on Science, Technology, Engineering & Maths (STEM) at a number of Camden schools including Eleanor Palmer, Gospel Oak and Argyle Primary Schools.

Camden Authority Monitoring Report 2017/18
80
and accessibility improvements.
40.82. 10 40.83. Secondary Schools
40.84. Maintaining secondary school provision to meet the demand for places.
40.85. Borough wide 40.86. LB Camden – Children, Schools and Families Directorate (School Place Planning)
40.87. 2017-2031 40.88. Schools’ capacity is planned taking into account projected population growth and information on housing sites (e.g. Camden’s Site Allocations). Government funding and some developer contributions (including provision in kind) are used for school place provision. There are expected to be sufficient school places until 2024/25, although ‘bulge classes’ / fixed term expansion may be required in 2022/23 and 2023/24. Regent High School can potentially provide 2 Form Entry at the point when needed. Additional capacity is likely to be needed to serve development in the Euston area.
40.89. Ongoing project. Regent High School has been remodelled and will be able to provide an additional 2 Form Entry when needed. This is expected to occur around 2019/20. During 2016/17, Camden School for Girls increased their admission number to 120.
40.90. 11 40.91. Secondary Schools
40.92. Site specific modernisation (including ICT improvements) and building works, including accessibility improvements
40.93. Borough wide 40.94. LB Camden – Children, Schools and Families Directorate (School Place Planning)
40.95. 2017-2031 40.96. Community Infrastructure Levy (strategic portion)
40.97. Ongoing. During 2016/17, the Council continued to invest Section 106 funds on school provision. Funds transferred to school budgets (approx. £3.5 million) will deliver improvements to the capacity of schools, in particular for STEM subjects (Science, Technology, Engineering and Maths) at 9 schools. Going forward, new developer funding for

Camden Authority Monitoring Report 2017/18
81
school works will be secured through the Community Infrastructure Levy rather than Section 106.
40.98. 12 40.99. Further Education
40.100. Gross demand of 1,030 places – 830 sixth form places and 195 Form Entry College and work based learning places
40.101. Borough wide or elsewhere in Greater London
40.102. Education Funding Agency and Skills Funding Agency
40.103. 2017-2031 40.104. The Further Education provider is Westminster Kingsway College (WKC). The gross demand data was estimated by AECOM as part of the Camden Infrastructure Study using standard benchmarks for Further Education. No data was available from WKC.
40.105. Planning permission was granted in 2015 for a scheme to repair, rebuild and remodel facilities at Parliament Hill and William Ellis schools. This included approx. 900sqm of floorspace for the use of LaSWAP Sixth Forum (Sixth Form Centre comprising four small but closely linked sixth forms). The project had not started by the end of 2016/2017. A revised planning application was being prepared.
40.106. 13 40.107. Adult Learning. 40.108. 281 additional adult learning places will be required to meet growth in population.
40.109. Borough wide (and within other London Boroughs)
40.110. Skills Funding Agency / various providers including WKC and City Lit.
40.111. 2017-2031 40.112. LB Camden provides a package of Adult Community Learning supported by the Community Learning and Adult Skills Budget.
40.113. Ongoing project.
40.114. Healthcare Services 40.115.
40.116. 14 40.117. Primary Healthcare – GPs.
40.118. Gross demand of 19 additional full time equivalent GPs.
40.119. Borough wide 40.120. NHS England and Camden Clinical Commissioning Group
40.121. 2017-2031 40.122. There are a number of models of delivery for meeting increased GP provision including the creation and expansion of facilities and co-location with other community services. Gross demand estimate: AECOM Infrastructure Study
40.123. The North Central London Sustainability and Transformation Plan (2017) identified issues arising from the ageing of the primary care workforce and recruitment of new staff. A significant number of practices in the area provide accommodation which is no longer fit for purpose. (More details at: www.candi.nhs.uk) The Brookfield Park Surgery moved to new
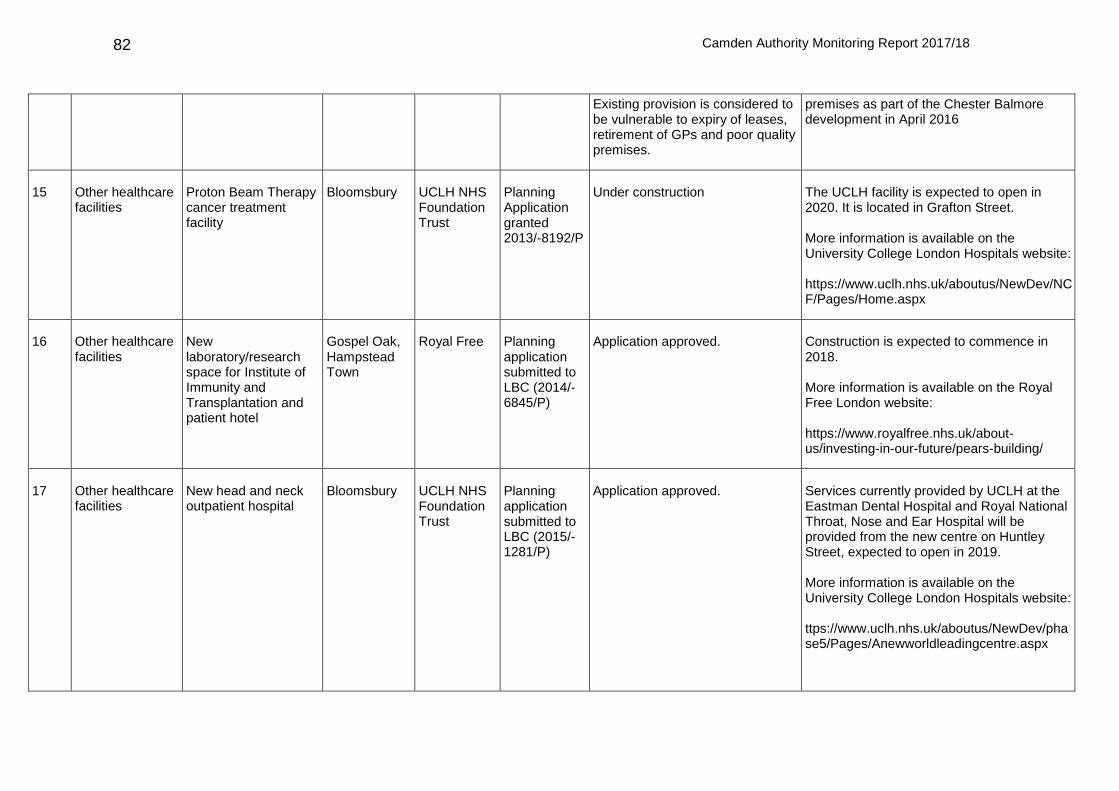
Camden Authority Monitoring Report 2017/18
82
Existing provision is considered to be vulnerable to expiry of leases, retirement of GPs and poor quality premises.
premises as part of the Chester Balmore development in April 2016
40.124. 15 40.125. Other healthcare facilities
40.126. Proton Beam Therapy cancer treatment facility
40.127. Bloomsbury 40.128. UCLH NHS Foundation Trust
40.129. Planning Application granted 2013/-8192/P
40.130. Under construction 40.131. The UCLH facility is expected to open in 2020. It is located in Grafton Street. More information is available on the University College London Hospitals website: https://www.uclh.nhs.uk/aboutus/NewDev/NCF/Pages/Home.aspx
40.132. 16 40.133. Other healthcare facilities
40.134. New laboratory/research space for Institute of Immunity and Transplantation and patient hotel
40.135. Gospel Oak, Hampstead Town
40.136. Royal Free 40.137. Planning application submitted to LBC (2014/-6845/P)
40.138. Application approved. 40.139. Construction is expected to commence in 2018. More information is available on the Royal Free London website: https://www.royalfree.nhs.uk/about-us/investing-in-our-future/pears-building/
40.140. 17 40.141. Other healthcare facilities
40.142. New head and neck outpatient hospital
40.143. Bloomsbury 40.144. UCLH NHS Foundation Trust
40.145. Planning application submitted to LBC (2015/-1281/P)
40.146. Application approved. 40.147. Services currently provided by UCLH at the Eastman Dental Hospital and Royal National Throat, Nose and Ear Hospital will be provided from the new centre on Huntley Street, expected to open in 2019. More information is available on the University College London Hospitals website: ttps://www.uclh.nhs.uk/aboutus/NewDev/phase5/Pages/Anewworldleadingcentre.aspx
40.148.

Camden Authority Monitoring Report 2017/18
83
40.149. Adult Social Care 40.150.
40.151. 18 40.152. Community Resource Centre at Greenwood Place.
40.153. A new day care facility providing services for people with dementia, mental health conditions and learning difficulties. It will also host the Centre for Independent Living giving advice and support for people with disabilities.
40.154. Kentish Town 40.155. LB Camden – Adult Social Care
40.156. 2018 40.157. A Community Investment Programme (CIP) project. The proposal provides accommodation for each client group as well as flexible, communal space. Funding from capital receipts, disposal of existing facilities and Section 106. Provides additional capacity for young people with profound and multiple learning difficulties who use services outside of Camden.
40.158. The Community Resource Centre is expected to open in 2018.
40.159. 19 40.160. New facility in Crogsland Road
40.161. Development of a new resource centre with provision of extra care flats for older people
40.162. Haverstock 40.163. LB Camden – Adult Social Care
40.164. 2017 40.165. Replacement of Charlie Ratchford Resource Centre in Belmont Street.
40.166. Planning permission was granted in 2016 for a new day centre and 38 extra-care residential flats (2015/0921/P).
40.167. 20 40.168. Holmes Road Hostel
40.169. Redevelopment of the hostel to create 59 studio units for single homeless people
40.170. Kentish Town 40.171. LB Camden – Housing and Adult Social Care
40.172. 2016 40.173. A Community Investment Programme (CIP) project. Disposal of one hostel contributing to the redevelopment of two sites (Mount Pleasant opened in 2014 providing 50 studio units).
40.174. The project involved converting part of a former workhouse into 59 units of ensuite studio accommodation with training rooms and was delivered in 2016.
40.175. Leisure and Community Facilities 40.176.
40.177. 21 40.178. Increasing capacity of sports halls
40.179. This is likely to be met through the provision of new sports halls, extending opening hours and optimising the use of existing
40.180. Borough wide taking account of existing provision
40.181. Private developer / Schools through dual-
40.182. Plan period. 40.183. The Open Space, Sport and Recreation Study 2014 identified the need for additional sports hall provision. At least a further 3 multi-purpose sports halls is estimated to be needed to meet demand.
40.184. No additional capacity was identified during 2016/17.
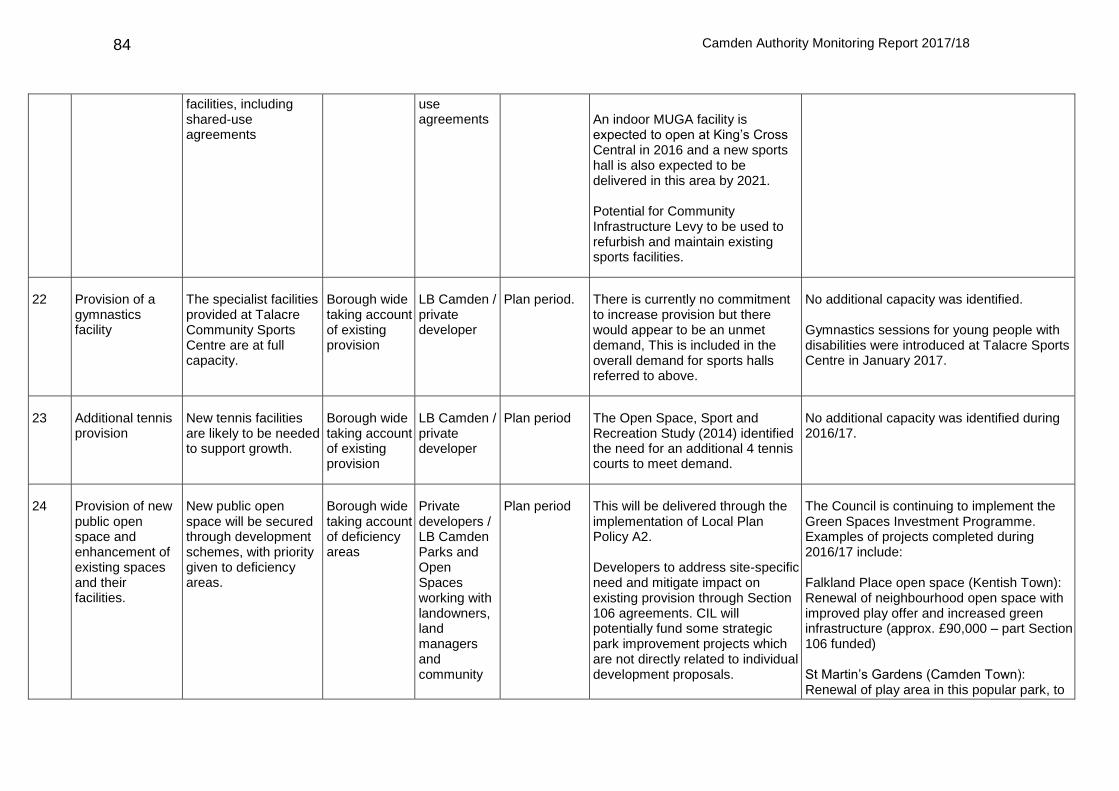
Camden Authority Monitoring Report 2017/18
84
facilities, including shared-use agreements
use agreements
An indoor MUGA facility is expected to open at King’s Cross Central in 2016 and a new sports hall is also expected to be delivered in this area by 2021. Potential for Community Infrastructure Levy to be used to refurbish and maintain existing sports facilities.
40.185. 22 40.186. Provision of a gymnastics facility
40.187. The specialist facilities provided at Talacre Community Sports Centre are at full capacity.
40.188. Borough wide taking account of existing provision
40.189. LB Camden / private developer
40.190. Plan period. 40.191. There is currently no commitment to increase provision but there would appear to be an unmet demand, This is included in the overall demand for sports halls referred to above.
40.192. No additional capacity was identified. Gymnastics sessions for young people with disabilities were introduced at Talacre Sports Centre in January 2017.
40.193. 23 40.194. Additional tennis provision
40.195. New tennis facilities are likely to be needed to support growth.
40.196. Borough wide taking account of existing provision
40.197. LB Camden / private developer
40.198. Plan period 40.199. The Open Space, Sport and Recreation Study (2014) identified the need for an additional 4 tennis courts to meet demand.
40.200. No additional capacity was identified during 2016/17.
40.201. 24 40.202. Provision of new public open space and enhancement of existing spaces and their facilities.
40.203. New public open space will be secured through development schemes, with priority given to deficiency areas.
40.204. Borough wide taking account of deficiency areas
40.205. Private developers / LB Camden Parks and Open Spaces working with landowners, land managers and community
40.206. Plan period 40.207. This will be delivered through the implementation of Local Plan Policy A2. Developers to address site-specific need and mitigate impact on existing provision through Section 106 agreements. CIL will potentially fund some strategic park improvement projects which are not directly related to individual development proposals.
40.208. The Council is continuing to implement the Green Spaces Investment Programme. Examples of projects completed during 2016/17 include: Falkland Place open space (Kentish Town): Renewal of neighbourhood open space with improved play offer and increased green infrastructure (approx. £90,000 – part Section 106 funded) St Martin’s Gardens (Camden Town): Renewal of play area in this popular park, to

Camden Authority Monitoring Report 2017/18
85
management.
The Council’s Green Spaces Investment Programme is a 5 year programme funded by a combination of developer contributions, capital funding and external grants. Some funding likely to be raised through ward proportion of CIL for community identified projects.
enhance the play offer and improve its appearance (approx. £70,000 – fully funded through Section 106) Quex Road open space (Kilburn): Renewal of local play area with new equipment and surfacing (approx. £82,000 – part Section 106 funded) Rochester Terrace Gardens (Kentish Town, Cantelowes ward): Enhancement work to neighbourhood green space, including sustainable planting and new play equipment (approx. £35,000 – fully funded through Section 106). At Lincoln’s Inn Fields a new perimeter hedge was planted to screen the road and provide biodiversity value.
40.209. Outdoor gyms were renewed during Summer 2016 at: Maygrove Peace Park (West Hampstead); Swiss Cottage Open Space; Cumberland Market (Regent’s Park Estate); Cantelowes Gardens (next to Camden Road); Gospel Oak and Kilburn Grange. From December 2016, public access was secured to Cartwright Gardens through a planning condition in December 2016. New public spaces have been fully opened at various locations within the King’s Cross Central development, including Gasholder Park - a sculpted canopy and circular lawn; Lewis Cubitt Square - a civic square with water features providing events space; Lewis
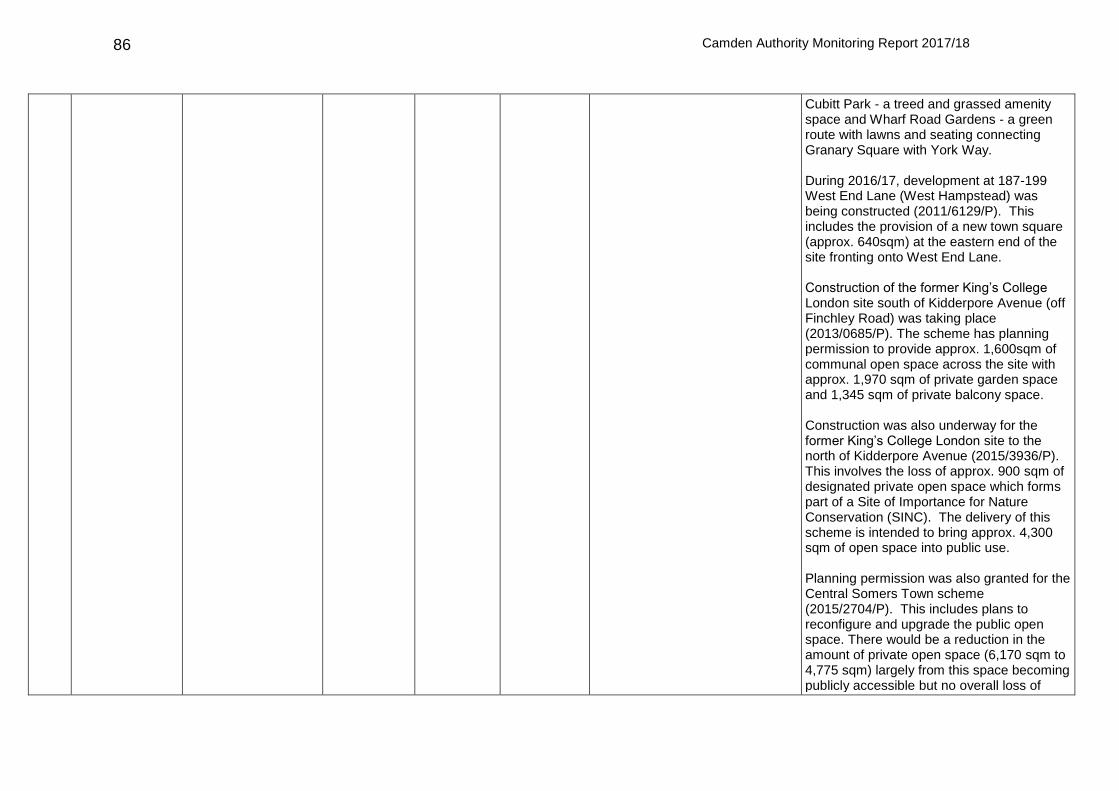
Camden Authority Monitoring Report 2017/18
86
Cubitt Park - a treed and grassed amenity space and Wharf Road Gardens - a green route with lawns and seating connecting Granary Square with York Way. During 2016/17, development at 187-199 West End Lane (West Hampstead) was being constructed (2011/6129/P). This includes the provision of a new town square (approx. 640sqm) at the eastern end of the site fronting onto West End Lane. Construction of the former King’s College London site south of Kidderpore Avenue (off Finchley Road) was taking place (2013/0685/P). The scheme has planning permission to provide approx. 1,600sqm of communal open space across the site with approx. 1,970 sqm of private garden space and 1,345 sqm of private balcony space. Construction was also underway for the former King’s College London site to the north of Kidderpore Avenue (2015/3936/P). This involves the loss of approx. 900 sqm of designated private open space which forms part of a Site of Importance for Nature Conservation (SINC). The delivery of this scheme is intended to bring approx. 4,300 sqm of open space into public use. Planning permission was also granted for the Central Somers Town scheme (2015/2704/P). This includes plans to reconfigure and upgrade the public open space. There would be a reduction in the amount of private open space (6,170 sqm to 4,775 sqm) largely from this space becoming publicly accessible but no overall loss of

Camden Authority Monitoring Report 2017/18
87
open space. The provision of replacement homes in connection with the development of High Speed 2 involves the development and reconfiguration of open space within Regent’s Park Estate (2015/3076/P). The implementation of this scheme will lead to an overall loss of open space of 47 sqm within the estate. To mitigate the loss of open space, service roads and car parks will be turned into new areas of open space.
40.210. As a result of the HS2 scheme a number of opens spaces in the area will be impacted, some permanently and some for the duration of construction. St James’s Gardens next to Euston station and Hampstead Road open space will be lost and Euston Square Gardens will be closed for the duration of construction. There are a range of mitigations proposed to attempt to offset this loss, including improvements to existing open spaces and longer term permanent replacement is considered through the HS2 Act and the longer term masterplanning for the area.
40.211. 25 40.212. Improving access to nature through biodiversity enhancing measures in new development.
40.213. Biodiversity gains are achieved through the provision of new natural greenspaces in major developments and enhancement measures delivered through other schemes e.g. green roofs, wildlife corridors, biodiversity enhancing
40.214. Borough wide taking account of deficiency areas
40.215. Private developers / LB Camden Parks and Open Spaces
40.216. Plan period 40.217. This will be delivered through the application of Local Plan Policy A3. Camden’s Biodiversity Action Plan (BAP) runs 2013-2018. There are three key areas of focus:- 1. Access to Nature 2. The Built Environment
40.218. During 2016/17, £39,000 of Section 106 funds helped the Camden Green Gym (www.tcv.org.uk/london/green-gym-london/camden-green-gym) deliver biodiversity enhancements throughout the Borough, including 5 new native hedgerows, a wildflower meadow, 3 ponds, 2 stag beetle loggeries, an orchard, 2 insect hotels and 8 new community gardens. A new community green gym was established in West Hampstead, through
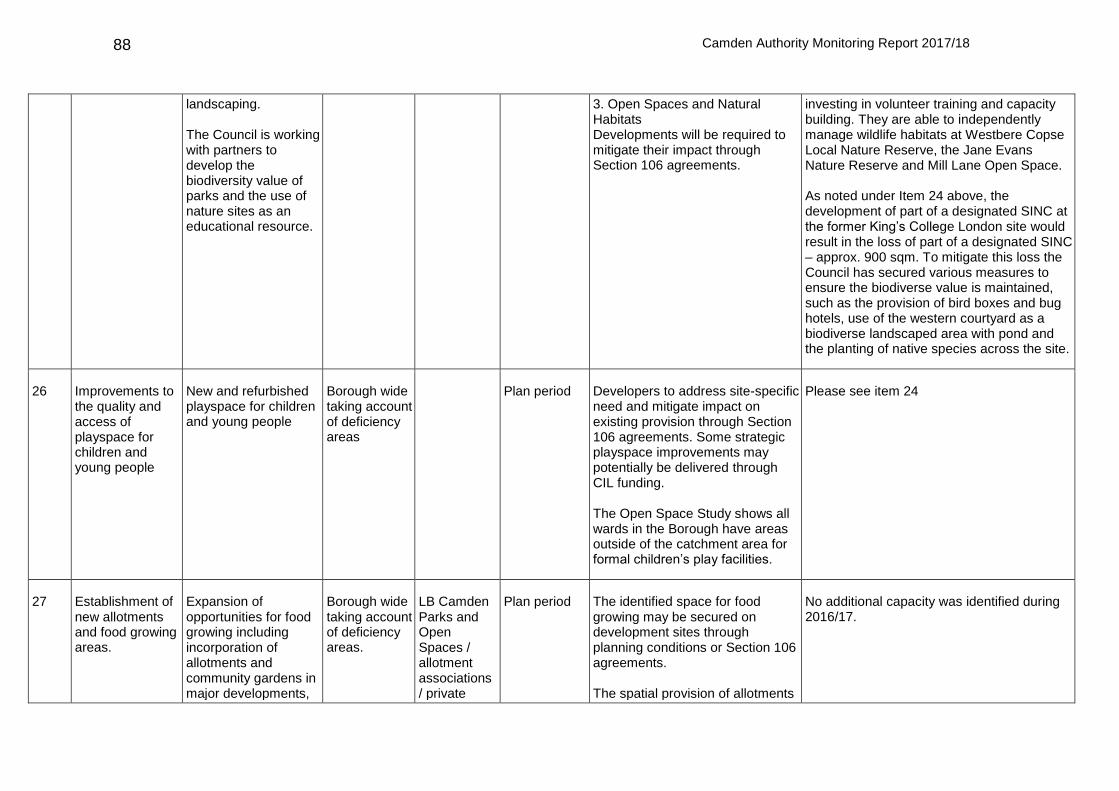
Camden Authority Monitoring Report 2017/18
88
landscaping. The Council is working with partners to develop the biodiversity value of parks and the use of nature sites as an educational resource.
3. Open Spaces and Natural Habitats Developments will be required to mitigate their impact through Section 106 agreements.
investing in volunteer training and capacity building. They are able to independently manage wildlife habitats at Westbere Copse Local Nature Reserve, the Jane Evans Nature Reserve and Mill Lane Open Space. As noted under Item 24 above, the development of part of a designated SINC at the former King’s College London site would result in the loss of part of a designated SINC – approx. 900 sqm. To mitigate this loss the Council has secured various measures to ensure the biodiverse value is maintained, such as the provision of bird boxes and bug hotels, use of the western courtyard as a biodiverse landscaped area with pond and the planting of native species across the site.
40.219. 26 40.220. Improvements to the quality and access of playspace for children and young people
40.221. New and refurbished playspace for children and young people
40.222. Borough wide taking account of deficiency areas
40.223. 40.224. Plan period 40.225. Developers to address site-specific need and mitigate impact on existing provision through Section 106 agreements. Some strategic playspace improvements may potentially be delivered through CIL funding. The Open Space Study shows all wards in the Borough have areas outside of the catchment area for formal children’s play facilities.
40.226. Please see item 24
40.227. 27 40.228. Establishment of new allotments and food growing areas.
40.229. Expansion of opportunities for food growing including incorporation of allotments and community gardens in major developments,
40.230. Borough wide taking account of deficiency areas.
40.231. LB Camden Parks and Open Spaces / allotment associations / private
40.232. Plan period 40.233. The identified space for food growing may be secured on development sites through planning conditions or Section 106 agreements. The spatial provision of allotments
40.234. No additional capacity was identified during 2016/17.
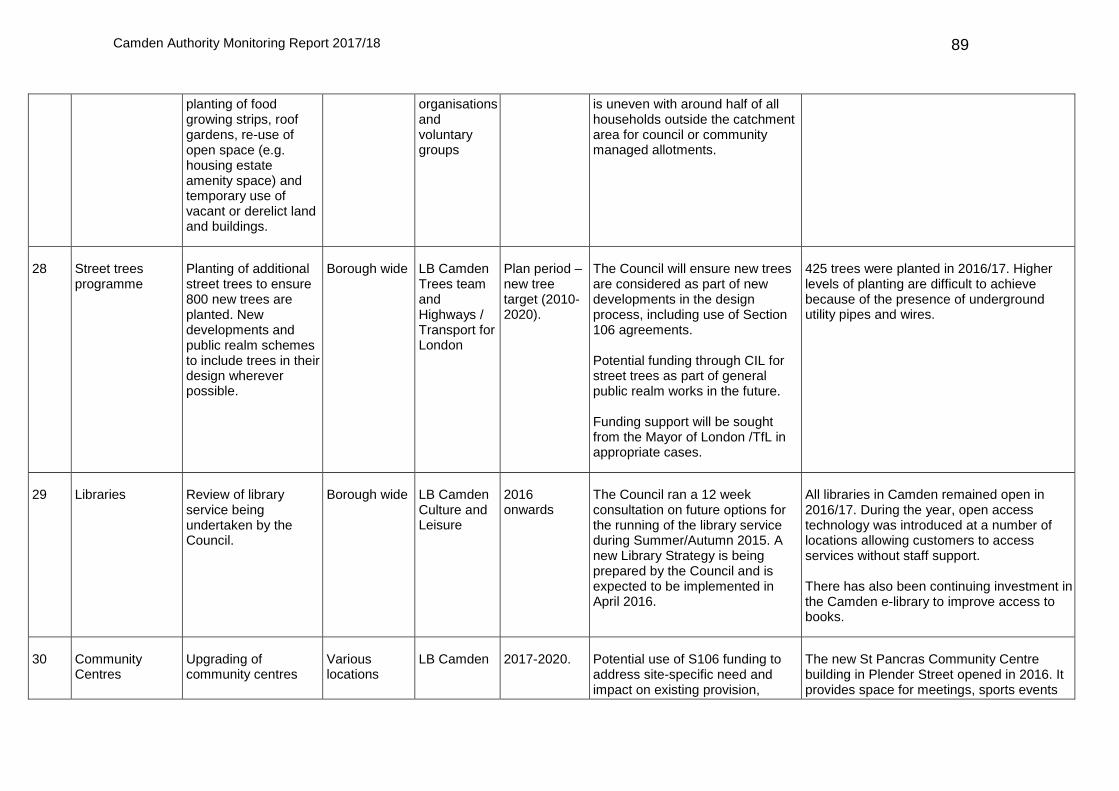
Camden Authority Monitoring Report 2017/18
89
planting of food growing strips, roof gardens, re-use of open space (e.g. housing estate amenity space) and temporary use of vacant or derelict land and buildings.
organisations and voluntary groups
is uneven with around half of all households outside the catchment area for council or community managed allotments.
40.235. 28 40.236. Street trees programme
40.237. Planting of additional street trees to ensure 800 new trees are planted. New developments and public realm schemes to include trees in their design wherever possible.
40.238. Borough wide 40.239. LB Camden Trees team and Highways / Transport for London
40.240. Plan period – new tree target (2010- 2020).
40.241. The Council will ensure new trees are considered as part of new developments in the design process, including use of Section 106 agreements. Potential funding through CIL for street trees as part of general public realm works in the future. Funding support will be sought from the Mayor of London /TfL in appropriate cases.
40.242. 425 trees were planted in 2016/17. Higher levels of planting are difficult to achieve because of the presence of underground utility pipes and wires.
40.243. 29 40.244. Libraries 40.245. Review of library service being undertaken by the Council.
40.246. Borough wide 40.247. LB Camden Culture and Leisure
40.248. 2016 onwards
40.249. The Council ran a 12 week consultation on future options for the running of the library service during Summer/Autumn 2015. A new Library Strategy is being prepared by the Council and is expected to be implemented in April 2016.
40.250. All libraries in Camden remained open in 2016/17. During the year, open access technology was introduced at a number of locations allowing customers to access services without staff support. There has also been continuing investment in the Camden e-library to improve access to books.
40.251. 30 40.252. Community Centres
40.253. Upgrading of community centres
40.254. Various locations
40.255. LB Camden 40.256. 2017-2020. 40.257. Potential use of S106 funding to address site-specific need and impact on existing provision,
40.258. The new St Pancras Community Centre building in Plender Street opened in 2016. It provides space for meetings, sports events

Camden Authority Monitoring Report 2017/18
90
particularly on large sites. Projects being implemented include: Reprovision of St Pancras Community Centre; Repair and improvements to Highgate New town Community Centre; Redevelopment of the Surma Centre; New Abbey Community Centre proposed as part of the Abbey area redevelopment project. Potential use of CIL for general upgrades of community facilities or new provision where the need for this is unrelated to a specific development.
(football and netball), catering and childcare. Planning permission was granted in 2017 for redevelopment of Highgate New Town Community Centre and Fresh Youth Academy to be reprovided in new buildings, alongside the provision of new flats (2016/6088/P). No planning applications to date for new community provision at the Surma Centre. A hybrid application for the phased development of the Abbey Co-op housing sites comprised a detailed application for Phase 1 and outline for Phases 2 & 3 (2013/4678/P). Reserved matters applications for Phases 2 and 3 of the Abbey area scheme had not been submitted by the end of 2016/17 (Phase 3 would provide for the re-provision of community floorspace).
40.259. Strategic Transport 40.260.
40.261. 31 40.262. London Overground capacity improvements on North London Line
40.263. 5 car trains being introduced to reduce crowding. This will potentially increase to 6 car operation, subject to
40.264. Highbury and Islington to West Croydon/Clapham Junction and Richmond/Clapham
40.265. Transport for London / Network Rail
40.266. 2015 2019-2024.
40.267. London Overground Capacity Improvement Project. The North London Line runs east to west through Camden; there are 6 stations on this line in the Borough
40.268. Five-car trains are now operating on most Overground lines.

Camden Authority Monitoring Report 2017/18
91
Old Oak Common being delivered.
Junction to Stratford
40.269. 32 40.270. London Overground Gospel Oak –Barking line
40.271. Electrification project to allow operation of longer, electric trains.
40.272. Gospel Oak to Barking line
40.273. Network Rail 40.274. By 2017 40.275. The Gospel Oak line has one station in Camden at Gospel Oak
40.276. The civil engineering works being undertaken by Network Rail have taken longer than anticipated. Completion now expected in 2018.
40.277. 33 40.278. Crossrail 1 40.279. Delivery of east-west new railway through London from Reading/ Heathrow to Abbey Wood and Shenfield
40.280. Central Activities Zone
40.281. Transport for London and Department for Transport
40.282. 2017-19 40.283. Linked to the realisation of regeneration and intensification opportunities within the Central Activities Zone. Crossrail stations at Tottenham Court Road and Farrington most likely to support Camden’s growth. Funding from public bodies, Mayoral CIL and Business Rate Supplement.
40.284. Running of trains through Central London stations including Tottenham Court Road and Farringdon expected to commence in December 2018.
40.285. 34 40.286. Crossrail 2 40.287. Planned to relieve mainline rail terminals and crowding on London Underground lines. It would link south west and north east London. Stations being proposed in the Borough are at Tottenham Court Road (to link with Crossrail 1) and off Euston Road.
40.288. Cross borough
40.289. Transport for London and Department for Transport.
40.290. By 2030 40.291. Updated ‘safeguarding directions’ for Crossrail 2 were issued by the Secretary of State for Transport in March 2015. The estimated cost is £12-20bn at 2012 prices.
40.292. Funding arrangements to be determined. Potential contribution from Mayoral CIL 2.
40.293. 35 40.294. High Speed Two (HS2)
40.295. New railway linking London Euston and Birmingham Curzon Street (Phase 1).
40.296. Cross borough
40.297. Department for Transport / HS2 Ltd
40.298. Phase 1 completion due 2026;
40.299. The Secretary of State for Transport has issued ‘safeguarding directions’ for the HS2 rail line.
40.300. Phase 1 of High Speed Two between London and Birmingham received Royal Assent on 23 February 2017.

Camden Authority Monitoring Report 2017/18
92
Further extension to cities north of Birmingham (Phase 2)
Phase 2 in 2033
Planned construction start date is 2017.
40.301. 36 40.302. Potential redevelopment of Euston Station
40.303. Comprehensive redevelopment of Euston railway station – potentially a component of High Speed 2.
40.304. Euston area 40.305. Network Rail / Transport for London / HS2
40.306. Late 2020s 40.307. The Euston Area Plan is intended to help shape change in the area around Euston Station up to 2031. It was prepared jointly by Camden Council, the Greater London Authority and Transport for London . Euston is identified as a Growth Area for significant development in this Plan regardless of whether HS2 goes ahead. Camden will also prepare a planning brief to guide the redevelopment above and around the station
40.308. Camden Council published principles for the Euston Area Planning Brief in 2017. The draft Planning Brief will be published for consultation in 2018.
40.309. 37 40.310. Thameslink Programme
40.311. To allow operation of up to 24 trains per hour during peak periods with longer 12 car trains, significantly enhancing capacity
40.312. Cross borough
40.313. Network Rail 40.314. By 2018 40.315. The Thameslink runs north-south from Bedford to Brighton with stations in Camden at West Hampstead, Kentish Town, St Pancras and Farringdon. The Thameslink Programme will provide new destinations including Peterborough and Cambridge.
40.316. Up to 24 trains per hour to be delivered during 2018. During 2016/17, new trains commenced running on the Thameslink network. During 2018 Thameslink is expected to commence running direct services to/from Peterborough and Cambridge.
40.317. 38 40.318. Northern Line Upgrade and Extension
40.319. Increasing service frequency and capacity to at least 30 trains an hour on main branches at peak periods.
40.320. Cross borough
40.321. Transport for London
40.322. 2020 40.323. Northern line runs from Edgware and High Barnet/Mill Hill East to Morden through the West End and the City. There are stations in Camden at King’s Cross, Euston, Warren Street, Goodge St., Tottenham Court. Road, Mornington Crescent, Camden
40.324. Main tunnelling on the extension to Battersea completed in 2017; new services expected to commence by 2020.
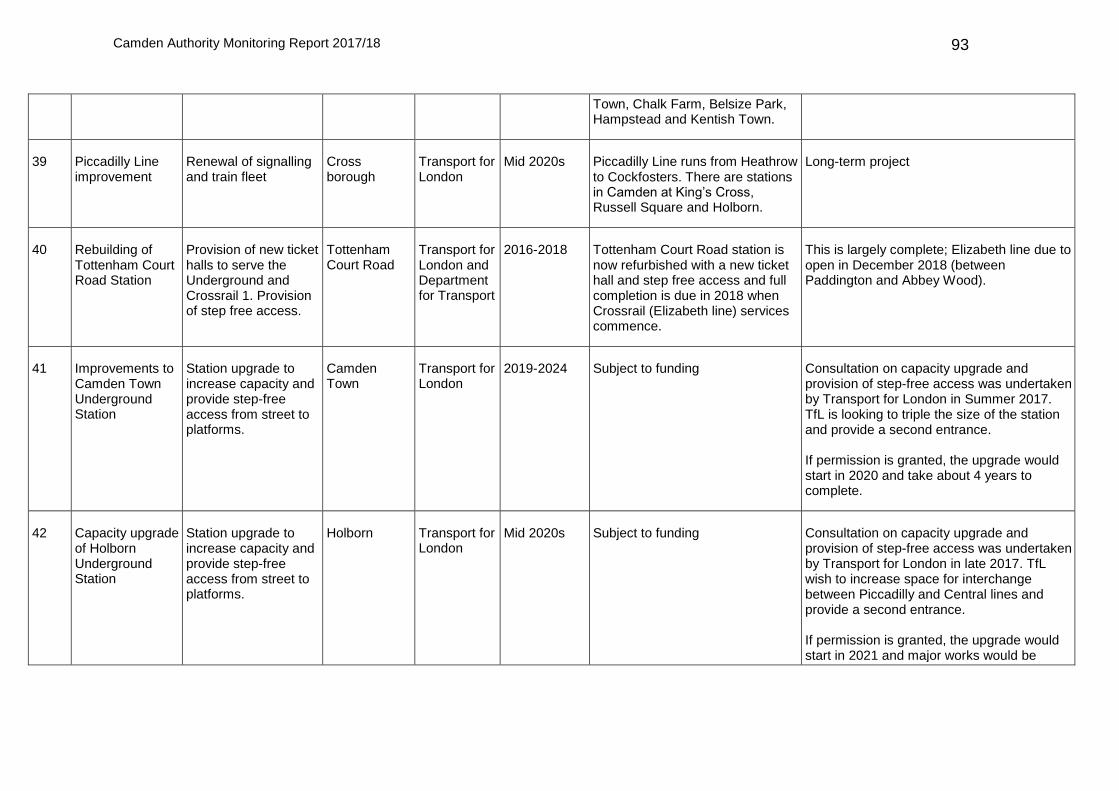
Camden Authority Monitoring Report 2017/18
93
Town, Chalk Farm, Belsize Park, Hampstead and Kentish Town.
40.325. 39 40.326. Piccadilly Line improvement
40.327. Renewal of signalling and train fleet
40.328. Cross borough
40.329. Transport for London
40.330. Mid 2020s 40.331. Piccadilly Line runs from Heathrow to Cockfosters. There are stations in Camden at King’s Cross, Russell Square and Holborn.
40.332. Long-term project
40.333. 40 40.334. Rebuilding of Tottenham Court Road Station
40.335. Provision of new ticket halls to serve the Underground and Crossrail 1. Provision of step free access.
40.336. Tottenham Court Road
40.337. Transport for London and Department for Transport
40.338. 2016-2018 40.339. Tottenham Court Road station is now refurbished with a new ticket hall and step free access and full completion is due in 2018 when Crossrail (Elizabeth line) services commence.
40.340. This is largely complete; Elizabeth line due to open in December 2018 (between Paddington and Abbey Wood).
40.341. 41 40.342. Improvements to Camden Town Underground Station
40.343. Station upgrade to increase capacity and provide step-free access from street to platforms.
40.344. Camden Town
40.345. Transport for London
40.346. 2019-2024 40.347. Subject to funding 40.348. Consultation on capacity upgrade and provision of step-free access was undertaken by Transport for London in Summer 2017. TfL is looking to triple the size of the station and provide a second entrance. If permission is granted, the upgrade would start in 2020 and take about 4 years to complete.
40.349. 42 40.350. Capacity upgrade of Holborn Underground Station
40.351. Station upgrade to increase capacity and provide step-free access from street to platforms.
40.352. Holborn 40.353. Transport for London
40.354. Mid 2020s 40.355. Subject to funding 40.356. Consultation on capacity upgrade and provision of step-free access was undertaken by Transport for London in late 2017. TfL wish to increase space for interchange between Piccadilly and Central lines and provide a second entrance. If permission is granted, the upgrade would start in 2021 and major works would be
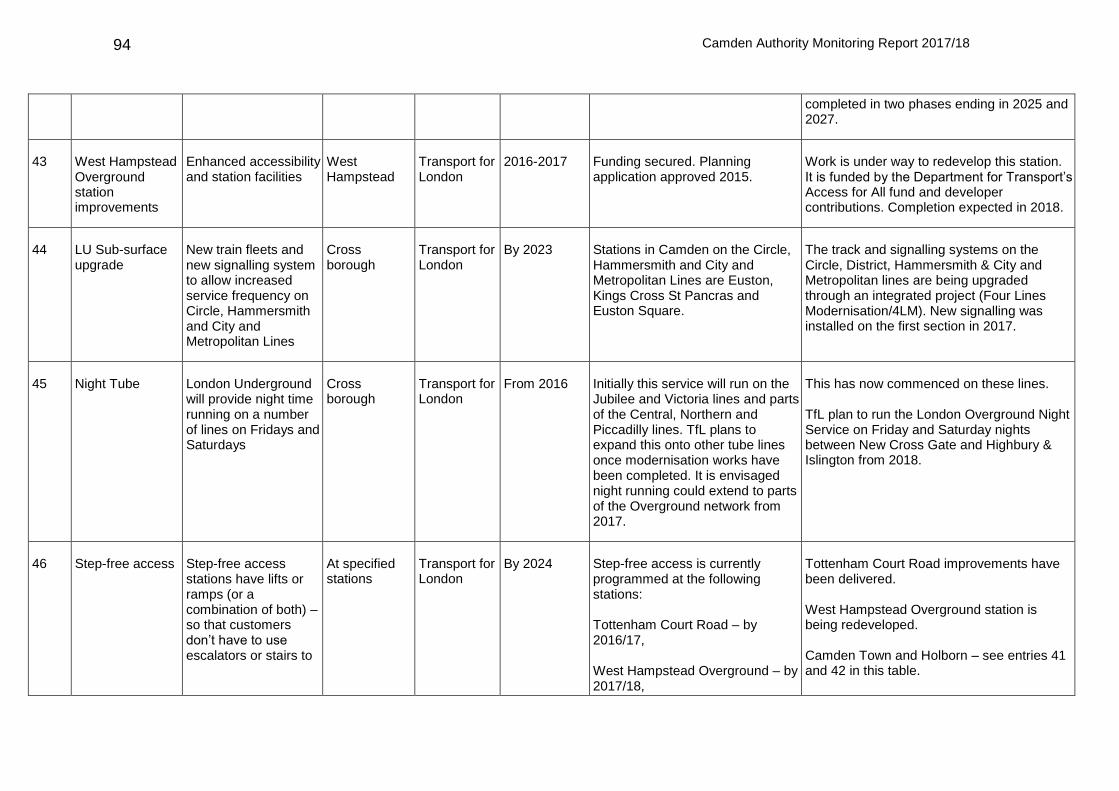
Camden Authority Monitoring Report 2017/18
94
completed in two phases ending in 2025 and 2027.
40.357. 43 40.358. West Hampstead Overground station improvements
40.359. Enhanced accessibility and station facilities
40.360. West Hampstead
40.361. Transport for London
40.362. 2016-2017 40.363. Funding secured. Planning application approved 2015.
40.364. Work is under way to redevelop this station. It is funded by the Department for Transport’s Access for All fund and developer contributions. Completion expected in 2018.
40.365. 44 40.366. LU Sub-surface upgrade
40.367. New train fleets and new signalling system to allow increased service frequency on Circle, Hammersmith and City and Metropolitan Lines
40.368. Cross borough
40.369. Transport for London
40.370. By 2023 40.371. Stations in Camden on the Circle, Hammersmith and City and Metropolitan Lines are Euston, Kings Cross St Pancras and Euston Square.
40.372. The track and signalling systems on the Circle, District, Hammersmith & City and Metropolitan lines are being upgraded through an integrated project (Four Lines Modernisation/4LM). New signalling was installed on the first section in 2017.
40.373. 45 40.374. Night Tube 40.375. London Underground will provide night time running on a number of lines on Fridays and Saturdays
40.376. Cross borough
40.377. Transport for London
40.378. From 2016 40.379. Initially this service will run on the Jubilee and Victoria lines and parts of the Central, Northern and Piccadilly lines. TfL plans to expand this onto other tube lines once modernisation works have been completed. It is envisaged night running could extend to parts of the Overground network from 2017.
40.380. This has now commenced on these lines. TfL plan to run the London Overground Night Service on Friday and Saturday nights between New Cross Gate and Highbury & Islington from 2018.
40.381. 46 40.382. Step-free access 40.383. Step-free access stations have lifts or ramps (or a combination of both) – so that customers don’t have to use escalators or stairs to
40.384. At specified stations
40.385. Transport for London
40.386. By 2024 40.387. Step-free access is currently programmed at the following stations: Tottenham Court Road – by 2016/17, West Hampstead Overground – by 2017/18,
40.388. Tottenham Court Road improvements have been delivered. West Hampstead Overground station is being redeveloped. Camden Town and Holborn – see entries 41 and 42 in this table.

Camden Authority Monitoring Report 2017/18
95
move between the street and platform.
Camden Town and Holborn – by 2023/24 (TfL website). There are a number of stations where step-free access is still not committed including West Hampstead Underground station, Kentish Town National Rail station, Kentish Town Underground station and Kentish Town West on the London Overground. The responsibility for making stations and platforms fully accessible lies with the railway industry (Network Rail, Train Operating Companies and/or TfL depending on the station).
40.389. 47 40.390. West End Project 40.391. Introduction of two-way traffic at Tottenham Court Road and Gower Street and public realm improvements at Euston Circus, St Giles Circus and Princes Circus.
40.392. Central Activities Zone
40.393. LB Camden with partners
40.394. 2015-2017 40.395. Transport for London funding and S106 contributions.
40.396. During 2016/17, money continued to be collected from planning contributions. which will be used to fund the project alongside Council resources, TfL grant and other third party contributions. In 2017, tendering was undertaken for the main contract works for the construction and implementation of this scheme and work will get underway in 2018.
40.397. 48 40.398. Holborn Improvement Project
40.399. A major scheme supporting improvements in the area being delivered through Crossrail, In Midtown Business Improvement District
40.400. Holborn 40.401. LB Camden with partners
40.402. 2016-2021 40.403. Potential Transport for London funding, subject to a successful bid. This is distinct from the capacity upgrade of Holborn Underground Station.
40.404. Elements of the scheme to be taken forward through Camden’s Local Implementation Plan. Consultation planned in 2018.

Camden Authority Monitoring Report 2017/18
96
and at Holborn Underground Station
40.405. 49 40.406. Holborn and Bloomsbury Area Scheme
40.407. Urban realm and road safety improvements, reducing traffic dominance.
40.408. Holborn 40.409. LB Camden with partners
40.410. By 2018 40.411. The Council maintains a rolling three year programme of investment with an annual financial allocation made by TfL to support delivery. Area based schemes are funded through a block grant from Transport for London (part of the Corridors, Neighbourhoods and Supporting Measures programme). Supplemented by funding from developer contributions and LB Camden funding. Works closely related to development on particular sites will be sought through s106 but other works will be funded through CIL.
40.412. See item 48.
40.413. 50 40.414. Kilburn Area Scheme
40.415. Urban realm and road safety improvements, regeneration of the High Street.
40.416. Kilburn 40.417. LB Camden with partners
40.418. By 2017 40.419. As above 40.420. Elements of the scheme to be taken forward through Camden’s Local Implementation Plan, particularly to address road safety as the High Road is a casualty ‘hotspot’ in the Borough. Consultation planned in 2018.
40.421. 51 40.422. King’s Cross Area Scheme
40.423. Walking, cycling and urban realm improvements. Addressing the gyratory and movements north-south across Euston Road. Also see
40.424. King’s Cross 40.425. LB Camden with partners
40.426. By 2016 40.427. As above 40.428. This has been delayed pending the outcome of a Public Inquiry for the Torrington Place to Tavistock Place Traffic Order (which involves making a trial of temporary traffic changes permanent).

Camden Authority Monitoring Report 2017/18
97
number 58 in this table.
40.429. 52 40.430. Farringdon Area Improvements
40.431. Urban realm and cycle permeability measures
40.432. Routes to Farringdon station
40.433. LB Camden with partners
40.434. By 2018 40.435. As above 40.436. Being delivered over three phases. Phase 1 (pedestrian crossing and bus reliability measures such as converting single yellow to double lines and restrictions on loading at any time on Gray’s Inn Road) completed in 2016/17. Phase 2 (further permeability, footway and public realm improvements) to be prepared for consultation and delivery in 2017/18. Phase 3 to follow (provision of cycle lanes and bus priority measures on Gray’s Inn Road).
40.437. 53 40.438. Camden and Kentish Town and Wider Area Scheme
40.439. Improving cycle permeability with a focus on east-west routes and extending the Royal College Street cycle route. Also see number 59 in this table.
40.440. Camden Town and Kentish Town
40.441. LB Camden with partners
40.442. By 2022 40.443. As above 40.444. The Royal College Street cycle route has been extended to Camden Town. The wider Area Based Scheme has not yet been implemented.
40.445. 54 40.446. Borough-wide schemes
40.447. Schemes include advanced stop lines for cyclists, a borough-wide 20mph limit, pedestrian signage and way-finding and cycle hire
40.448. 40.449. LB Camden 40.450. Rolling 3 year programme
40.451. The Council maintains a rolling three year programme of investment with an annual financial allocation made by TfL to support delivery. These borough wide schemes are also supported by the block grant from Transport for London (part of the Corridors, Neighbourhoods and Supporting Measures programme).
40.452. Ongoing projects. The 20mph speed limit is in place. In the Council’s Local Investment Programme (LIP2, 2014/15 to 2016/17) an allocation was set aside for each year to fund relatively small-scale cycle permeability measures, such as advanced stop lines outside of the main area-based programmes. Further allocations for cycle permeability measures are planned for 2018/19 and 2019/20.
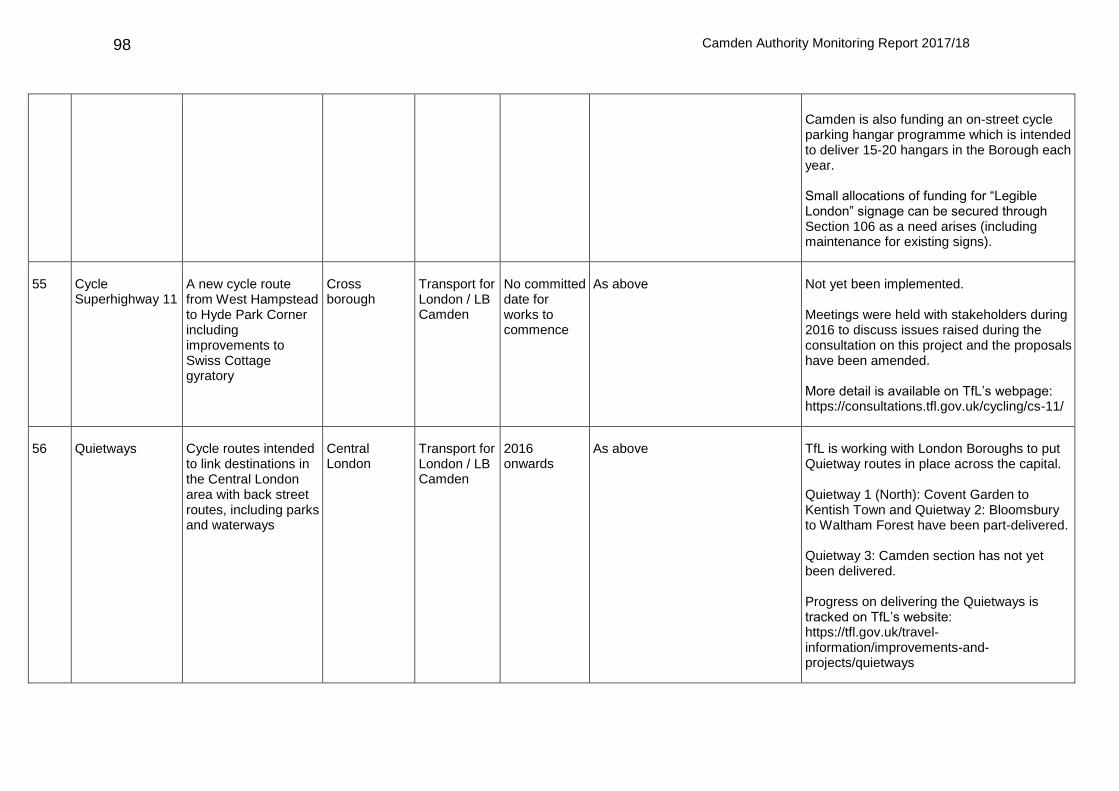
Camden Authority Monitoring Report 2017/18
98
Camden is also funding an on-street cycle parking hangar programme which is intended to deliver 15-20 hangars in the Borough each year. Small allocations of funding for “Legible London” signage can be secured through Section 106 as a need arises (including maintenance for existing signs).
40.453. 55 40.454. Cycle Superhighway 11
40.455. A new cycle route from West Hampstead to Hyde Park Corner including improvements to Swiss Cottage gyratory
40.456. Cross borough
40.457. Transport for London / LB Camden
40.458. No committed date for works to commence
40.459. As above 40.460. Not yet been implemented. Meetings were held with stakeholders during 2016 to discuss issues raised during the consultation on this project and the proposals have been amended. More detail is available on TfL’s webpage: https://consultations.tfl.gov.uk/cycling/cs-11/
40.461. 56 40.462. Quietways 40.463. Cycle routes intended to link destinations in the Central London area with back street routes, including parks and waterways
40.464. Central London
40.465. Transport for London / LB Camden
40.466. 2016 onwards
40.467. As above 40.468. TfL is working with London Boroughs to put Quietway routes in place across the capital. Quietway 1 (North): Covent Garden to Kentish Town and Quietway 2: Bloomsbury to Waltham Forest have been part-delivered. Quietway 3: Camden section has not yet been delivered. Progress on delivering the Quietways is tracked on TfL’s website: https://tfl.gov.uk/travel-information/improvements-and-projects/quietways

Camden Authority Monitoring Report 2017/18
99
40.469. 57 40.470. Central London Cycle Grid
40.471. A network of high quality and high volume cycle routes formed from cycle superhighways, quiet shared streets and local links
40.472. Central London
40.473. Transport for London / LB Camden and partners
40.474. By 2016 40.475. As above 40.476. Quietways and Cycle Superhighways in Zone 1 will make up the Central London Grid. Some elements of Quietways have been delivered – see entry 56. During 2016/17, Camden Council approved commencement of detailed design works for elements of the North-South Cycle Superhighway scheme between Stonecutter Street and King’s Cross within sections of the highway managed by LB Camden.
40.477. 58 40.478. King’s Cross gyratory project
40.479. Transport for London led project to improve safety for road users and reduce the impact of traffic. Part of area scheme above (number 51 in this table).
40.480. King’s Cross 40.481. Transport for London
40.482. By 2021 40.483. The King’s Cross project would focus on a number of ‘A’ roads in the King’s Cross area within LB Camden and Islington. A feasibility study is underway and TfL (with LB Camden and Islington) aim to hold a public consultation on proposals in mid 2017. Modifications to the gyratories would potentially allow two-way running of traffic.
40.484. See item 51.
40.485. 59 40.486. Camden Town gyratory project
40.487. Transport for London led project to improve safety for road users and reduce the impact of traffic. Part of area scheme above (number 53 in this table).
40.488. Camden Town
40.489. Transport for London
40.490. By 2022 40.491. As above 40.492. See item 53.

Camden Authority Monitoring Report 2017/18
100
40.493. 60 40.494. Bus service enhancement
40.495. Bus service enhancements where required to mitigate the impacts of growth
40.496. Borough wide 40.497. Transport for London
40.498. Plan period 40.499. Enhancements to the frequency, capacity and routing of bus services to mitigate the impacts of growth. Funded by developer contributions to support the impacts of larger developments.
40.500. Ongoing project Enhanced frequencies on the 390 bus service are planned from 2018.
40.501. 61 40.502. Highways maintenance and improvement
40.503. Provision, improvement, replacement, operation or maintenance of highway infrastructure (including carriageways, footways, drainage and street lighting)
40.504. Borough wide 40.505. LBC Highways
40.506. Plan period 40.507. Community Infrastructure Levy (strategic portion) Excludes site-specific accessibility improvements (highway and related works) and vehicular crossovers which will continue to be funded through developer agreements.
40.508. Ongoing project
40.509. Utilities and Physical Infrastructure 40.510.
40.511. 62 40.512. Water supply 40.513. Every five years water companies produce Water Resources Management Plans (WRMPs) which set out the current water supply-demand balance and use population projections to ensure that future population growth is planned for. A c.25MI
40.514. Barrow Hill and rest of Borough
40.515. Thames Water
40.516. 2015-2020 40.517. The WRMP contains specific resource development schemes and demand management actions. Thames Water’s WRMP 2015-2040 shows there is a forecast surplus of supply in Camden for 2026.
40.518. Thames Water has submitted their annual review of the current WRMP covering the period 2016 to 2017 to the Secretary of State. It can be viewed on the Thames Water website: ttps://corporate.thameswater.co.uk/about-us/our-strategies-and-plans/water-resources/our-current-plan-wrmp14 A broader company-wide annual review

Camden Authority Monitoring Report 2017/18
101
capacity reservoir has been commissioned at Barrow Hill to provide adequate storage capacity.
against a range of indicators is set out in “Here for you”: Annual performance report 2016/17 can be viewed here: https://www.thameswater.co.uk/-/media/Site-Content/Thames-Water/Corporate/AboutUs/our-business/our-performance/Annual-performance-report-2016-17-combined.pdf
40.519. 63 40.520. Wastewater 40.521. A London wide issue is the frequent discharge of storm sewage into the River Thames. The London Tideway Improvement Programme intends to address the issue through the upgrade and extension of Sewage Treatment Works, the construction of the Lee Tunnel and Thames Tideway Tunnel. The current programme of upgrades will accommodate London’s growth to 2021. The Thames Tunnel is expected to be complete by 2023.
40.522. Whole Borough
40.523. Thames Water
40.524. Plan period 40.525. Investment is financed through charges to water company customers. Thames Water seeks approval of strategic growth schemes from OFWAT through a 5 year periodic review (the next review is in 2019).
40.526. Link to Thames’ Annual performance report 2016/17 is above.
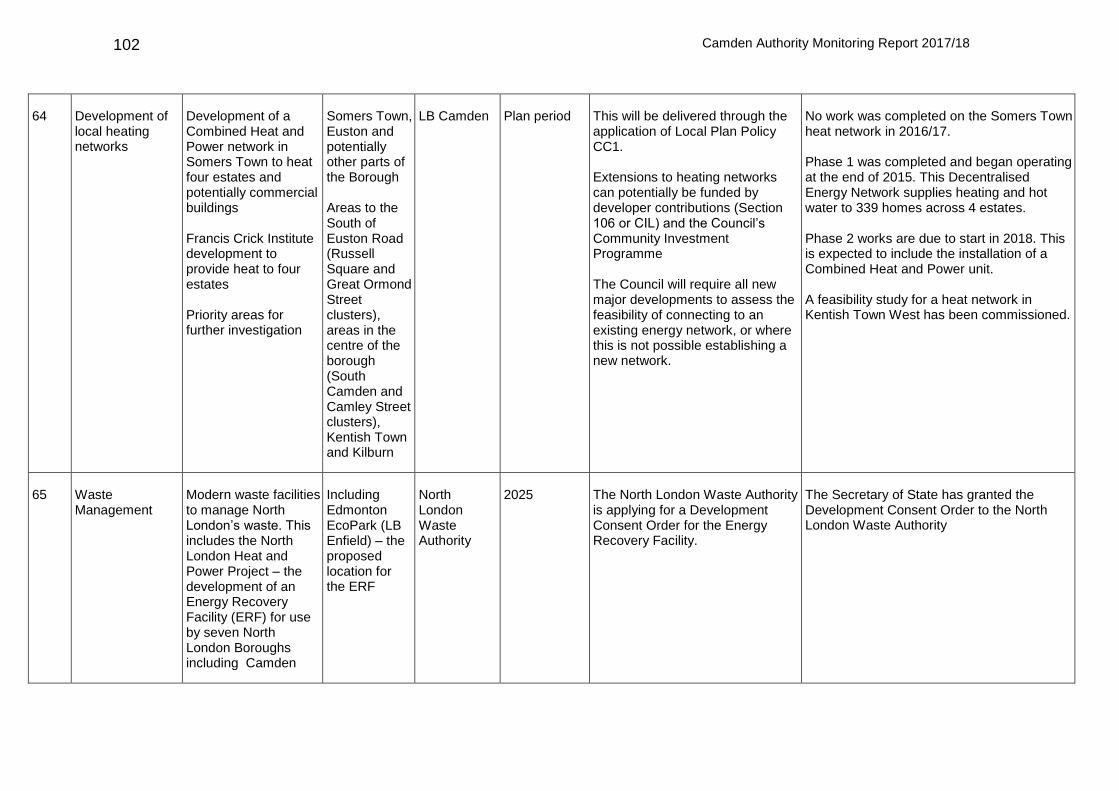
Camden Authority Monitoring Report 2017/18
102
40.527. 64 40.528. Development of local heating networks
40.529. Development of a Combined Heat and Power network in Somers Town to heat four estates and potentially commercial buildings Francis Crick Institute development to provide heat to four estates Priority areas for further investigation
40.530. Somers Town, Euston and potentially other parts of the Borough Areas to the South of Euston Road (Russell Square and Great Ormond Street clusters), areas in the centre of the borough (South Camden and Camley Street clusters), Kentish Town and Kilburn
40.531. LB Camden 40.532. Plan period 40.533. This will be delivered through the application of Local Plan Policy CC1. Extensions to heating networks can potentially be funded by developer contributions (Section 106 or CIL) and the Council’s Community Investment Programme The Council will require all new major developments to assess the feasibility of connecting to an existing energy network, or where this is not possible establishing a new network.
40.534. No work was completed on the Somers Town heat network in 2016/17. Phase 1 was completed and began operating at the end of 2015. This Decentralised Energy Network supplies heating and hot water to 339 homes across 4 estates. Phase 2 works are due to start in 2018. This is expected to include the installation of a Combined Heat and Power unit. A feasibility study for a heat network in Kentish Town West has been commissioned.
40.535. 65 40.536. Waste Management
40.537. Modern waste facilities to manage North London’s waste. This includes the North London Heat and Power Project – the development of an Energy Recovery Facility (ERF) for use by seven North London Boroughs including Camden
40.538. Including Edmonton EcoPark (LB Enfield) – the proposed location for the ERF
40.539. North London Waste Authority
40.540. 2025 40.541. The North London Waste Authority is applying for a Development Consent Order for the Energy Recovery Facility.
40.542. The Secretary of State has granted the Development Consent Order to the North London Waste Authority

Camden Authority Monitoring Report 2017/18
103
40.543. 66 40.544. Digital connectivity
40.545. Improved internet access through the acceleration of high speed connectivity, including public wireless systems.
40.546. Borough wide with a focus on where this maximises benefits for the community and business
40.547. LB Camden, GLA, BT Openreach and other industry partners
40.548. Plan period 40.549. Camden’s Digital Strategy sets out a series of actions to support the uptake of high quality, next generation connectivity. This includes better connections for businesses and residents already on-line, tackling the ‘digital divide’ where people lack the confidence to use IT and the greater use of digital technology in delivering services.
40.550. The Council has continued to engage with operators to improve digital connectivity. Examples of projects delivered: Leases concluded with mobile and alternative broadband operators to lease rooftop spaces on Council owned buildings; UK Broadband deployed the first stage of installations across ten sites, increasing wireless broadband coverage for small businesses; Optimity investigation of sites to provide business grade wireless broadband.
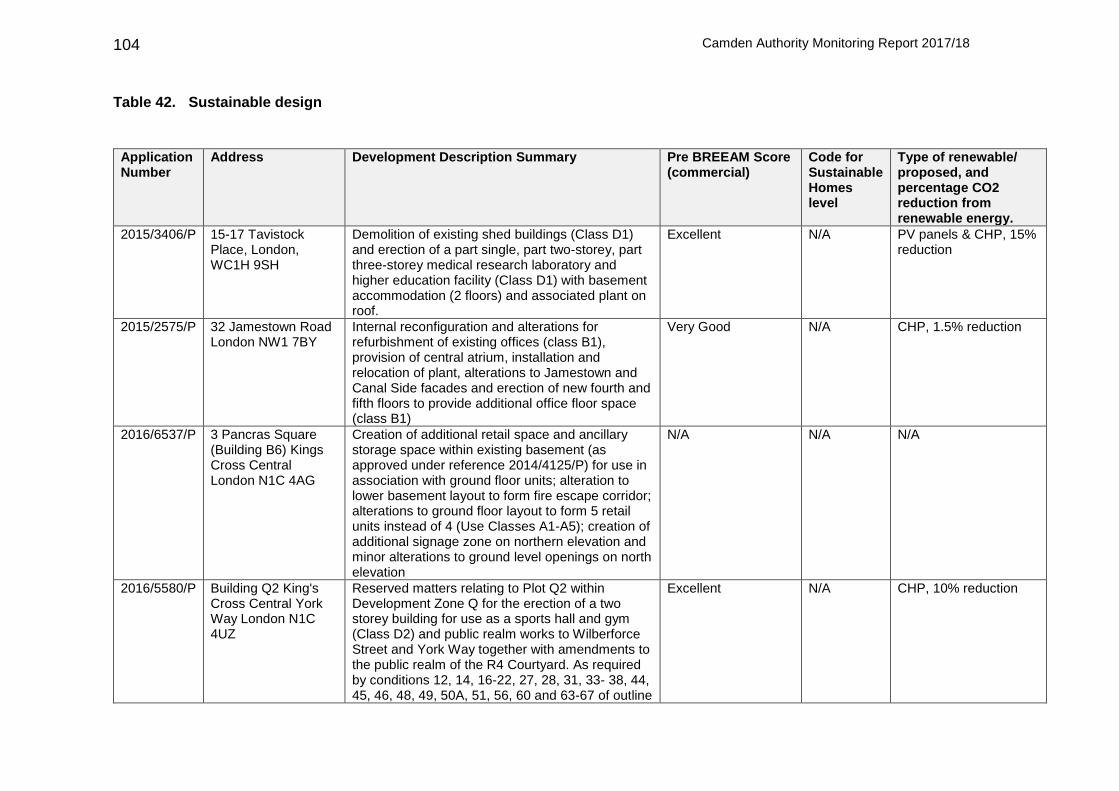
Camden Authority Monitoring Report 2017/18
104
Table 42. Sustainable design
Application Number
Address Development Description Summary Pre BREEAM Score (commercial)
Code for Sustainable Homes level
Type of renewable/ proposed, and percentage CO2 reduction from renewable energy.
2015/3406/P 15-17 Tavistock Place, London, WC1H 9SH
Demolition of existing shed buildings (Class D1) and erection of a part single, part two-storey, part three-storey medical research laboratory and higher education facility (Class D1) with basement accommodation (2 floors) and associated plant on roof.
Excellent N/A PV panels & CHP, 15% reduction
2015/2575/P 32 Jamestown Road London NW1 7BY
Internal reconfiguration and alterations for refurbishment of existing offices (class B1), provision of central atrium, installation and relocation of plant, alterations to Jamestown and Canal Side facades and erection of new fourth and fifth floors to provide additional office floor space (class B1)
Very Good N/A CHP, 1.5% reduction
2016/6537/P 3 Pancras Square (Building B6) Kings Cross Central London N1C 4AG
Creation of additional retail space and ancillary storage space within existing basement (as approved under reference 2014/4125/P) for use in association with ground floor units; alteration to lower basement layout to form fire escape corridor; alterations to ground floor layout to form 5 retail units instead of 4 (Use Classes A1-A5); creation of additional signage zone on northern elevation and minor alterations to ground level openings on north elevation
N/A N/A N/A
2016/5580/P Building Q2 King's Cross Central York Way London N1C 4UZ
Reserved matters relating to Plot Q2 within Development Zone Q for the erection of a two storey building for use as a sports hall and gym (Class D2) and public realm works to Wilberforce Street and York Way together with amendments to the public realm of the R4 Courtyard. As required by conditions 12, 14, 16-22, 27, 28, 31, 33- 38, 44, 45, 46, 48, 49, 50A, 51, 56, 60 and 63-67 of outline
Excellent N/A CHP, 10% reduction
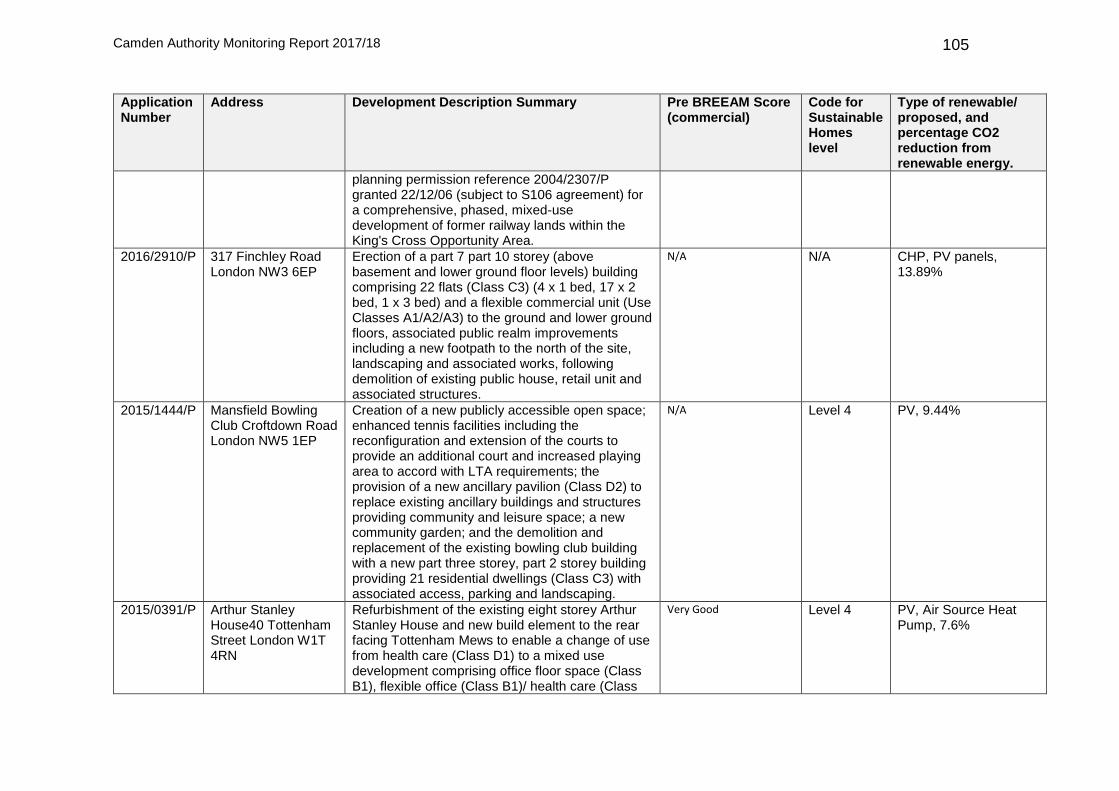
Camden Authority Monitoring Report 2017/18
105
Application Number
Address Development Description Summary Pre BREEAM Score (commercial)
Code for Sustainable Homes level
Type of renewable/ proposed, and percentage CO2 reduction from renewable energy.
planning permission reference 2004/2307/P granted 22/12/06 (subject to S106 agreement) for a comprehensive, phased, mixed-use development of former railway lands within the King's Cross Opportunity Area.
2016/2910/P 317 Finchley Road London NW3 6EP
Erection of a part 7 part 10 storey (above basement and lower ground floor levels) building comprising 22 flats (Class C3) (4 x 1 bed, 17 x 2 bed, 1 x 3 bed) and a flexible commercial unit (Use Classes A1/A2/A3) to the ground and lower ground floors, associated public realm improvements including a new footpath to the north of the site, landscaping and associated works, following demolition of existing public house, retail unit and associated structures.
N/A N/A CHP, PV panels, 13.89%
2015/1444/P Mansfield Bowling Club Croftdown Road London NW5 1EP
Creation of a new publicly accessible open space; enhanced tennis facilities including the reconfiguration and extension of the courts to provide an additional court and increased playing area to accord with LTA requirements; the provision of a new ancillary pavilion (Class D2) to replace existing ancillary buildings and structures providing community and leisure space; a new community garden; and the demolition and replacement of the existing bowling club building with a new part three storey, part 2 storey building providing 21 residential dwellings (Class C3) with associated access, parking and landscaping.
N/A Level 4 PV, 9.44%
2015/0391/P Arthur Stanley House40 Tottenham Street London W1T 4RN
Refurbishment of the existing eight storey Arthur Stanley House and new build element to the rear facing Tottenham Mews to enable a change of use from health care (Class D1) to a mixed use development comprising office floor space (Class B1), flexible office (Class B1)/ health care (Class
Very Good Level 4 PV, Air Source Heat Pump, 7.6%

Camden Authority Monitoring Report 2017/18
106
Application Number
Address Development Description Summary Pre BREEAM Score (commercial)
Code for Sustainable Homes level
Type of renewable/ proposed, and percentage CO2 reduction from renewable energy.
D1) floorspace at ground floor level and 12 residential units (Class C3) (market units: 1 x 1bed, 8 x 2bed, 1 x 3bed. affordable units: 2 x 3 beds) and associated landscaping fronting Tottenham Mews.
2014/6845/P Royal Free Hospital Pond Street London NW3 2QG
"Demolition of existing carpark and ancillary structures and erection of new 7 storey building, located on Heath Strange Garden site facing west to Hampstead Green footpath and Rosslyn Hill, containing laboratory/research space for Institute for Immunity and Transplantation, a patient hotel, Royal Free Charity offices plus a replacement carpark of 58 spaces, replacement memorial garden, plant and landscaping, all ancillary to Royal Free Hospital. "
Excellent N/A tbc
2014/7908/P 140-146 Camden Street London NW1 9PF
Demolition of existing buildings, excavation of extension to existing single storey basement and erection of 1 - 8 storey building comprising 2,026 sqm of commercial floorspace (flexible B1 use class) and 52 residential units (4 x studio, 19 x 1-bed, 18 x 2-bed and 11 x 3-bed C3 use class) with associated landscaping.
Excellent Level 4 tbc
2015/0921/P Vacant site adjacent to no 11 Crogsland Road London NW1 8HF
Redevelopment of vacant site by the erection of a 6 storey building comprising a day centre (Class D1) on the ground floor and 38 extra-care residential flats (Class C3) on the upper floors, plus roof terraces, communal gardens and minibus parking.
Excellent N/A tbc
2015/2366/P Clifford Pugh House, 5-7 Lancaster Grove, NW3 4HE
Erection of six storey building (including basement and accommodation in roof space) to provide 15 flats (Class C3) (7x 1-bed, 1x 2-bed, 4x 2-bed and 3x 3-bed) with erection of glazed veranda, 2 gazebos, and store to garden and front boundary wall, following demolition of existing student
N/A Level 4 tbc
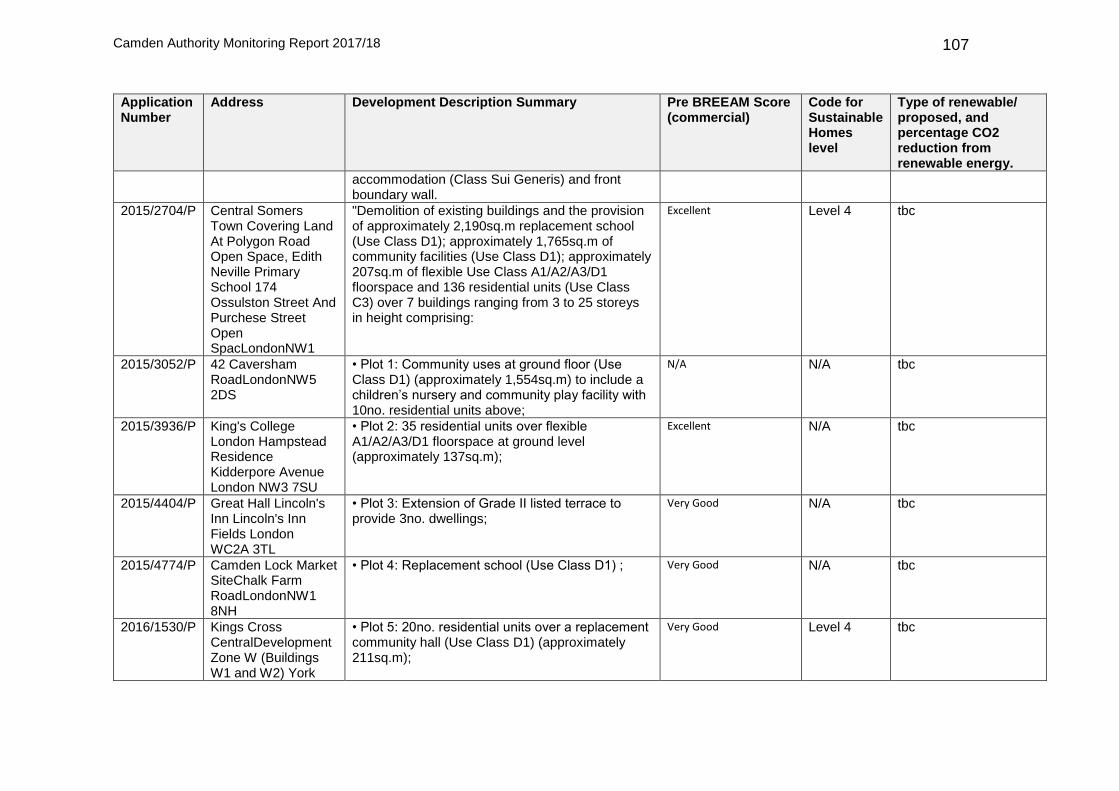
Camden Authority Monitoring Report 2017/18
107
Application Number
Address Development Description Summary Pre BREEAM Score (commercial)
Code for Sustainable Homes level
Type of renewable/ proposed, and percentage CO2 reduction from renewable energy.
accommodation (Class Sui Generis) and front boundary wall.
2015/2704/P Central Somers Town Covering Land At Polygon Road Open Space, Edith Neville Primary School 174 Ossulston Street And Purchese Street Open SpacLondonNW1
"Demolition of existing buildings and the provision of approximately 2,190sq.m replacement school (Use Class D1); approximately 1,765sq.m of community facilities (Use Class D1); approximately 207sq.m of flexible Use Class A1/A2/A3/D1 floorspace and 136 residential units (Use Class C3) over 7 buildings ranging from 3 to 25 storeys in height comprising:
Excellent Level 4 tbc
2015/3052/P 42 Caversham RoadLondonNW5 2DS
• Plot 1: Community uses at ground floor (Use Class D1) (approximately 1,554sq.m) to include a children’s nursery and community play facility with 10no. residential units above;
N/A N/A tbc
2015/3936/P King's College London Hampstead Residence Kidderpore Avenue London NW3 7SU
• Plot 2: 35 residential units over flexible A1/A2/A3/D1 floorspace at ground level (approximately 137sq.m);
Excellent N/A tbc
2015/4404/P Great Hall Lincoln's Inn Lincoln's Inn Fields London WC2A 3TL
• Plot 3: Extension of Grade II listed terrace to provide 3no. dwellings;
Very Good N/A tbc
2015/4774/P Camden Lock Market SiteChalk Farm RoadLondonNW1 8NH
• Plot 4: Replacement school (Use Class D1) ; Very Good N/A tbc
2016/1530/P Kings Cross CentralDevelopment Zone W (Buildings W1 and W2) York
• Plot 5: 20no. residential units over a replacement community hall (Use Class D1) (approximately 211sq.m);
Very Good Level 4 tbc
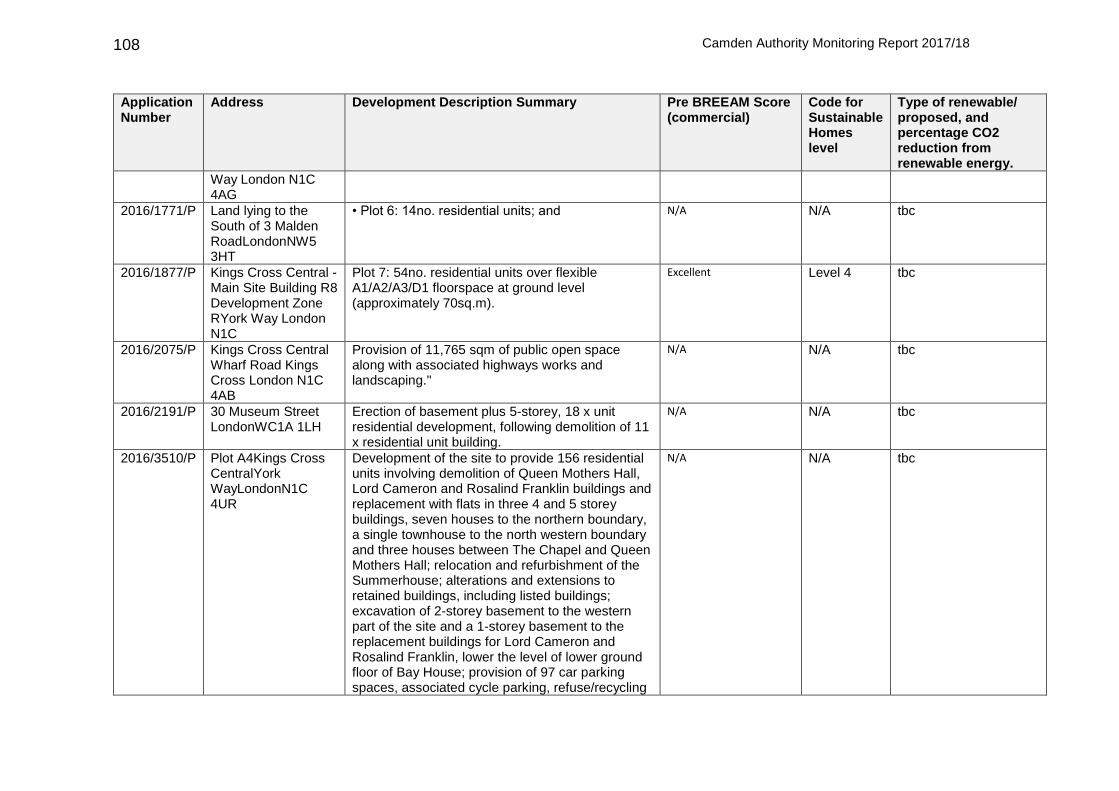
Camden Authority Monitoring Report 2017/18
108
Application Number
Address Development Description Summary Pre BREEAM Score (commercial)
Code for Sustainable Homes level
Type of renewable/ proposed, and percentage CO2 reduction from renewable energy.
Way London N1C 4AG
2016/1771/P Land lying to the South of 3 Malden RoadLondonNW5 3HT
• Plot 6: 14no. residential units; and N/A N/A tbc
2016/1877/P Kings Cross Central - Main Site Building R8 Development Zone RYork Way London N1C
Plot 7: 54no. residential units over flexible A1/A2/A3/D1 floorspace at ground level (approximately 70sq.m).
Excellent Level 4 tbc
2016/2075/P Kings Cross Central Wharf Road Kings Cross London N1C 4AB
Provision of 11,765 sqm of public open space along with associated highways works and landscaping."
N/A N/A tbc
2016/2191/P 30 Museum Street LondonWC1A 1LH
Erection of basement plus 5-storey, 18 x unit residential development, following demolition of 11 x residential unit building.
N/A N/A tbc
2016/3510/P Plot A4Kings Cross CentralYork WayLondonN1C 4UR
Development of the site to provide 156 residential units involving demolition of Queen Mothers Hall, Lord Cameron and Rosalind Franklin buildings and replacement with flats in three 4 and 5 storey buildings, seven houses to the northern boundary, a single townhouse to the north western boundary and three houses between The Chapel and Queen Mothers Hall; relocation and refurbishment of the Summerhouse; alterations and extensions to retained buildings, including listed buildings; excavation of 2-storey basement to the western part of the site and a 1-storey basement to the replacement buildings for Lord Cameron and Rosalind Franklin, lower the level of lower ground floor of Bay House; provision of 97 car parking spaces, associated cycle parking, refuse/recycling
N/A N/A tbc
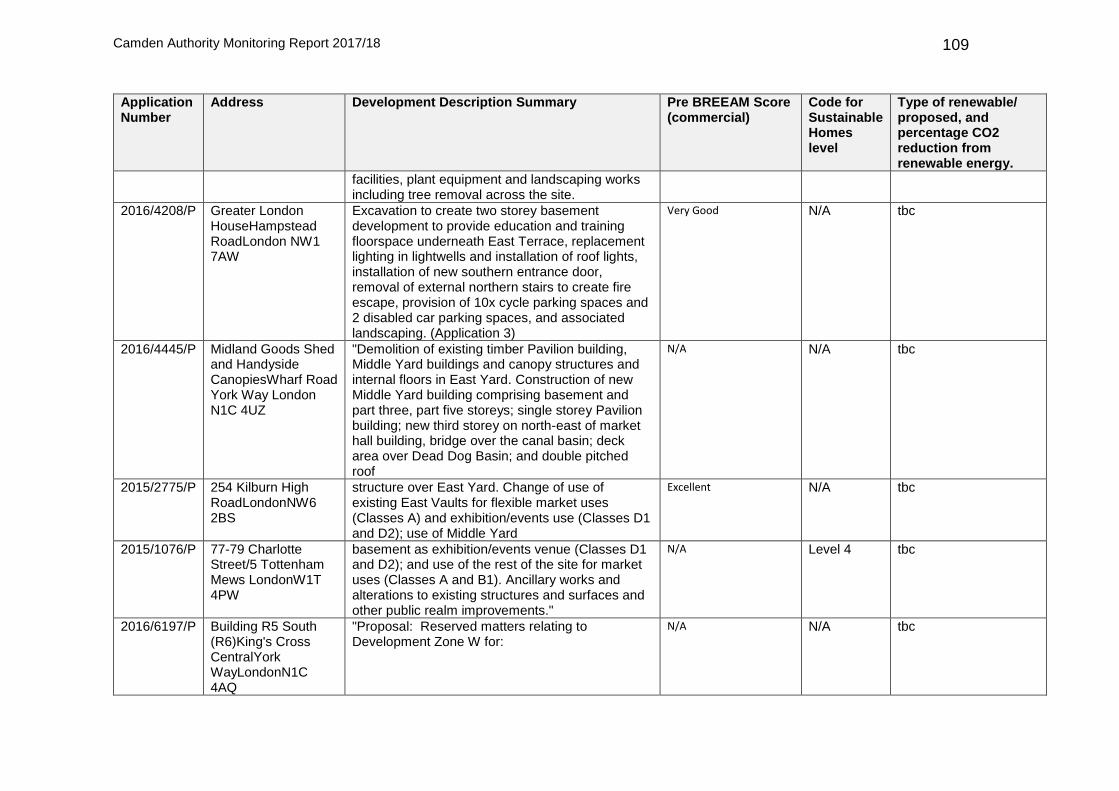
Camden Authority Monitoring Report 2017/18
109
Application Number
Address Development Description Summary Pre BREEAM Score (commercial)
Code for Sustainable Homes level
Type of renewable/ proposed, and percentage CO2 reduction from renewable energy.
facilities, plant equipment and landscaping works including tree removal across the site.
2016/4208/P Greater London HouseHampstead RoadLondon NW1 7AW
Excavation to create two storey basement development to provide education and training floorspace underneath East Terrace, replacement lighting in lightwells and installation of roof lights, installation of new southern entrance door, removal of external northern stairs to create fire escape, provision of 10x cycle parking spaces and 2 disabled car parking spaces, and associated landscaping. (Application 3)
Very Good N/A tbc
2016/4445/P Midland Goods Shed and Handyside CanopiesWharf Road York Way London N1C 4UZ
"Demolition of existing timber Pavilion building, Middle Yard buildings and canopy structures and internal floors in East Yard. Construction of new Middle Yard building comprising basement and part three, part five storeys; single storey Pavilion building; new third storey on north-east of market hall building, bridge over the canal basin; deck area over Dead Dog Basin; and double pitched roof
N/A N/A tbc
2015/2775/P 254 Kilburn High RoadLondonNW6 2BS
structure over East Yard. Change of use of existing East Vaults for flexible market uses (Classes A) and exhibition/events use (Classes D1 and D2); use of Middle Yard
Excellent N/A tbc
2015/1076/P 77-79 Charlotte Street/5 Tottenham Mews LondonW1T 4PW
basement as exhibition/events venue (Classes D1 and D2); and use of the rest of the site for market uses (Classes A and B1). Ancillary works and alterations to existing structures and surfaces and other public realm improvements."
N/A Level 4 tbc
2016/6197/P Building R5 South (R6)King's Cross CentralYork WayLondonN1C 4AQ
"Proposal: Reserved matters relating to Development Zone W for:
N/A N/A tbc
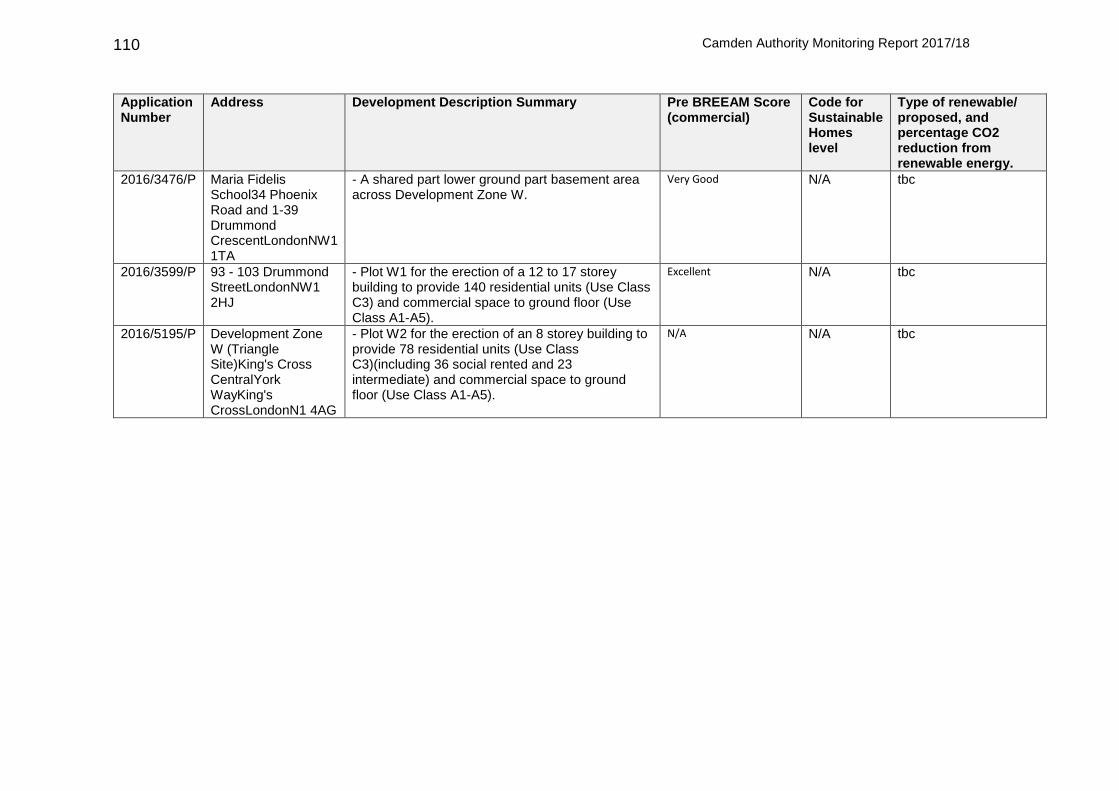
Camden Authority Monitoring Report 2017/18
110
Application Number
Address Development Description Summary Pre BREEAM Score (commercial)
Code for Sustainable Homes level
Type of renewable/ proposed, and percentage CO2 reduction from renewable energy.
2016/3476/P Maria Fidelis School34 Phoenix Road and 1-39 Drummond CrescentLondonNW1 1TA
- A shared part lower ground part basement area across Development Zone W.
Very Good N/A tbc
2016/3599/P 93 - 103 Drummond StreetLondonNW1 2HJ
- Plot W1 for the erection of a 12 to 17 storey building to provide 140 residential units (Use Class C3) and commercial space to ground floor (Use Class A1-A5).
Excellent N/A tbc
2016/5195/P Development Zone W (Triangle Site)King's Cross CentralYork WayKing's CrossLondonN1 4AG
- Plot W2 for the erection of an 8 storey building to provide 78 residential units (Use Class C3)(including 36 social rented and 23 intermediate) and commercial space to ground floor (Use Class A1-A5).
N/A N/A tbc

Camden Authority Monitoring Report 2017/18
111

Copyright London Borough of Camden 2019
Cem Erkmen Strategic Planning and Implementation Team London Borough of Camden 5 Pancras Square London N1C 4AG 020 7974 2518 [email protected] www.camden.gov.uk


![Camden journal (Camden, S.C.).(Camden, S.C.) 1852-06-01 [p ]](https://img.dokumen.tips/doc/110x75/619f257fbed7d658834197c1/camden-journal-camden-sccamden-sc-1852-06-01-p-.jpg)