Embed Size (px)
Citation preview

1
Authoritarianism & Social Identity Sorting: Exploring the Sources of American Mass Partisanship
Julie Wronski Postdoctoral Scientist
The George Washington University School of Media and Public Affairs
Prepared for the National Capital American Political Science Association Meeting Washington, DC January 5, 2015
ABSTRACT
Authoritarianism has shaped partisan polarization as White citizens, using elites’ ideological positions, formed party attachments along the authoritarian dimension. Yet, party elites also reflect demographic stereotypes as Democrats welcomed “diverse” social groups, while Republicans remained homogenous in its members. Thus, I propose that authoritarianism reflects an aversion to diversity that helps Whites make sense of their party identities by allowing them to form social identity matches with elites. Using hierarchal modeling, I empirically test which mechanism – party elites’ ideological positions or social identities – links Whites’ authoritarian dispositions to their party identifications over the past forty years, and demonstrate that social identity matches between citizen and party are a stronger predictor of partisanship than ideology, especially among White Protestants. All else equal, White authoritarians identify with the party that best represents their ethnic and religious groups, even if that means identifying with the party of the left.

2
America’s political landscape is currently wrought by partisan polarization. While such
conflict at the elite level stems from ideological polarization (Aldrich 2011, Poole & Rosenthal
1997, McCarty, Poole & Rosenthal 2006, Levendusky 2009) particularly pertaining to the issue
evolution of the social domain (Carmines & Stimson 1986, 1989) and the advent of salient
“culture war” issues (Fiorina, Abrams & Pope 2011, Fiorina & Levendusky 2006, Ellis &
Stimson 2012), one reason partisan conflict at the mass level embodies such intensity is due to
individual psychological differences in authoritarian dispositions (Hetherington & Weiler 2009,
Hetherington & Suhay 2011). Research has found that authoritarianism – conceptualized as
needs for order, certainty, security, and group conformity (Altemeyer 1988, Feldman 2003, Jost
et al 2003) – predicts many American political behaviors including citizens’ ideological
constraint (Barker & Tinnick 2006), core values (Federico, Fisher & Deason 2011), conservative
policy preferences (Johnston & Wronski 2013), and party affiliations (Hetherington & Weiler
2009, Federico & Tagar 2014). Accordingly, citizens sorted into the two parties along the
authoritarian dimension as elites’ ideological positions (particularly Republicans’ conservative,
moral traditionalism stances) provided links to their authoritarian dispositions (Hetherington &
Weiler 2009). Thus, the existing treatment of authoritarianism’s influence on party identification
focuses on the relationship between such dispositions and citizens’ ideological values.
While establishing the connection between authoritarianism and Republican Party identification
(Hetherington & Weiler 2009, Federico & Tagar 2014), this relationship is only statistically significant
since the 2000’s1. Further, the relationship between authoritarian dispositions and party identification
across the past forty years2 presents an interesting dynamic (see Figure 1). During the 1970’s and 1980’s
those highest in authoritarianism actually identified more towards the Democratic Party than those lowest
1 See Appendix for a visual representation of these trends. 2 The data in Figure 1 are derived from the GSS cumulative file, see the methods section for detailed operationalizations of authoritarianism and party identification.

3
in authoritarianism. It was not until the 1990’s when authoritarians, and predominantly White
authoritarians, flipped their partisan loyalties, looking like the Republicans depicted in the
current literature (e.g. Hetherington & Weiler 2009)3.
Figure 1. Mean Party ID Among High and Low Authoritarians (1973-2012)4
Thus, in a general sense, there is no natural relationship between authoritarianism and party identity –
authoritarians can identify as either Democrats or Republicans. In fact, White citizens exhibiting
authoritarian tendencies consistently leaned more Democrat throughout the Nixon and Reagan
administrations than their low authoritarian counterparts5. So, why does authoritarianism lead White
citizens to one type of party identity in the 1970’s and 80’s, and to the exact opposite party identity in the
1990’s and beyond? Which elements of the political landscape produced this dynamic relationship
between White citizens’ authoritarian dispositions and their party identities?
3 From an alternate perspective, White Strong Democrats in the 1970’s exhibited high levels of authoritarianism, which subsequently dropped in the 1990’s, while White Strong Republicans remained consistently authoritarian (see Appendix for a visual representation). Perhaps, then, the driving force of authoritarian “realignment” occurred among Democratic authoritarians who increasingly distanced themselves from their party. 4 High and Low Authoritarians are defined as at least 1 standard deviation above and below the mean of the standardized authoritarianism scale as described in the methods section, respectively. 5 This dynamic relationship between authoritarianism and party identification occurs nationally, and is not relegated to the regions directly impacted by Southern realignment (see Appendix Figure A3).
.35
.4.4
5.5
.55
Mea
n Pa
rty ID
(0=S
trong
Dem
, 1=
Ston
g R
ep)
1970 1980 1990 2000 2010year
High Authoritarian High Authoritarian (Whites)
Low Authoritarian Low Authoritarian (Whites)
1973-2012Mean Party ID Among High and Low Authoritarians

4
Hetherington & Weiler (2009) would argue that the ideological polarization of elites on salient social
issues, such as gay marriage, abortion, and civil rights legislation, triggered authoritarianism as a
significant predictor of mass party identification. Yet if these social issues, which have been fixtures of
political discourse since the 1960’s, are at the heart of the relationship between authoritarianism and
Republican Party identification, why does the flip shown in Figure 1 occur in the 1990’s and not earlier?
Further, their approach only acknowledges the ideological policy preferences of elites, while ignoring
other important distinctions between the two parties.
Notably, differences between the parties today are not ideological, or even values based. The social
identities each party represents are vastly different (Fiorina, Abrams & Pope 2011; Abramowitz 2010;
Mason 2013; 2014). On one hand, the Democratic Party represents diversity – their leaders are Whites,
Blacks, Latinos, men, and women, with the leadership touting this diversity. According to Representative
Nancy Pelosi, the 113th Congress’ Democratic committee members were diverse “geographically,
generationally, gender-wise, ethnically, in every way,” a group that embraces “a diversity of opinion.”6
She further described the “beautiful diversity” of her Democratic Party caucus: “[It] looks like America.
So do our ranking members. One of the messages it sends, if you’re a woman, if you’re gay or if you’re a
minority, you can have the comfort of saying: ‘Somebody like me has a seat at the table. Somebody who
understands my aspirations, my hopes and dreams.’”7 In contrast, the Republican Party has represented
White, male, Protestant Christians. As Senator Lindsey Graham opined on the Republican Party in the
2012 presidential election: “The demographics race we’re losing badly. We’re not generating enough
angry white guys to stay in business for the long term.”8
Could these dichotomous demographic identities have also activated the link between citizens’
authoritarian dispositions and their mass party identifications? A wealth of social psychology research,
spanning decades, would unequivocally answer yes. Since its inception (see Adorno et al. 1950), 6 http://www.washingtonpost.com/blogs/2chambers/wp/2012/12/05/house-democrats-tout-diversity-in-the-ranks/ 7 http://www.salon.com/2012/12/27/is_the_white_house_a_boys_club/ 8 http://www.washingtonpost.com/politics/as-republican-convention-emphasizes-diversity-racial-incidents-intrude/2012/08/29/b9023a52-f1ec-11e1-892d-bc92fee603a7_story.html

5
authoritarianism has been associated with group-based behaviors including attachments to social in-
groups (Duckitt 1989), and intolerance of deviant “outsiders” (Altemeyer 1988, Feldman 2003, Stenner
2005). Along these lines, authoritarianism embodies an innate desire for homogeneity and an aversion
towards diversity among one’s social groups that individuals utilize when making sense of their party
identities, an approach particularly salient among White citizens who perceive authority from a
perspective of relative social dominance (Perez & Hetherington 2014) and have witnessed the Democratic
Party morph demographically from “us” into “them.” Thus, this alternative approach posits that the match
between individuals’ authoritarian dispositions and their party identifications rest in their social identities.
Given these competing mechanisms by which authoritarianism structures American partisanship –
ideology versus social identity – I empirically test which best serves as the dynamic link between Whites
citizens’ authoritarian dispositions and their party identifications. Using hierarchal modeling techniques, I
examine how the ideological and demographic evolution of party elites over the past forty years
conditioned the relationship between individuals’ authoritarian dispositions and their party identifications,
revealing that, in the aggregate, demographic make-up of party elites’ played as large a role in sorting
citizens along the authoritarian dimension as their ideological positions (per Levendusky 2009; Fiornia &
Levendusky 2006; Hetherintong & Weiler 2009). However, when the parties’ demographic shifts did not
coincide with similar ideological positions, as discerned through a comparison of White Protestants’ and
non-Protestants’ party preferences, social identity matches between citizen and party were a stronger
predictor of party identity than ideological matches among high authoritarians. All else being equal,
White authoritarians identified with the political party that best represented their in-groups in a cohesive
way, even if that meant identifying with the party of the left.
Unlike the conventional approach which emphasizes Republican elites’ conservative social issue
positions (Hetherington and Weiler 2009, Federico & Tagar 2014), I find that the Democratic Party’s
diversification of elites led authoritarians to affiliate with the Republican Party. Thus, the partisan divide
in American politics reflects the process by which citizens’ authoritarian dispositions shaped their
intolerance of non-traditional and “outsider” social groups (e.g. women, African Americans,

6
homosexuals) as party authority figures. When regarding mass partisan polarization from this perspective,
high authoritarians are not necessarily conservatives. Instead they possess an affinity towards the
Republican Party that developed over a decades-long exodus from the Democratic Party on the basis of
intolerance towards social out-groups, which now allows them to exhibit conservatism through their
Republican identity (see Johnston & Wronski 2013, Johnston 2013).
Authoritarianism, Ideology, and Social Identities in American Politics
Authoritarianism, conceptualized as a continuum of predispositions for individual autonomy versus
group conformity and uniformity (Feldman 2003, Feldman & Stenner 1997, Stenner 2005), has proven a
potent predictor of mass political attitudes and behaviors (see Hetherington & Weiler 2009). Recent
literature details a “functional link” between authoritarian dispositions (i.e. motivational needs for order,
certainty, and security in response to social cohesion threats; see Jost et al. 2003, Feldman 2003) and
conservative political orientations (Jost et al. 2003, Jost, Federico & Napier 2009), as conservative
worldviews satisfy citizens’ chronic goals related to the conventionalism dimension of authoritarianism
(Altemeyer 1988), and reflect adherence to long-standing institutions of predictability in the social world
(Hetherington & Weiler 2009, Duckitt & Sibley 2009, Federico & Tagar 2014). Thus, authoritarianism
has been linked to disciplinarian parenting, anti-individualism and conservative ideology (Lakoff 1996,
Barker & Tinnick 2006), traditional moral values and opposition to egalitarianism (Federico, Fisher &
Deason 2011), and support for policy preferences in the social (Hetherington & Weiler 2009), economic
(Johnston 2013, Johnston & Wronski 2013) and foreign policy domains (Hetherington & Suhay 2011).
Further, with the emergence of ideological divides on issues relating to ethnic and gender differences,
civil liberties, moral traditionalism, and responses to terrorism, authoritarianism has molded partisan
sorting (see Levendusky 2009) and affective polarization in the American public (Hetherington & Weiler
2009). As Republicans regularly espoused conservative positions that tapped into authoritarians’ needs
for order, security, and social cohesion, citizens higher in authoritarianism, on average, identified more as
Republicans than as Democrats. Such authoritarianism-based sorting processes were amplified among
politically engaged citizens who could translate the symbolic imagery of Republicans’ conservative

7
policies into identification preferences (Federico & Tagar 2014), and among Whites, for whom authority
structures at home and in society resonated most strongly (Perez & Hetherington 2014). Thus,
authoritarianism’s influence on party identification embodies White citizens’ ideological values relating
to morality, traditionalism, and security (Barker & Tinnick 2006; Hetherington & Weiler 2009).
From its inception, however, authoritarianism has been linked to intergroup behaviors, such as
ethnocentrism (Adorno et al 1950) and out-group prejudice (Altemeyer 1988; Duckitt 2001; Stenner
2005). Using both political (Altemeyer 1988) and social (Feldman 2003, Feldman & Stenner 1997)
measures, authoritarian dispositions consistently predict intolerance towards “socially deviant” outsiders,
such as ethnic or religious minority groups (Stenner 2005). Additionally, authoritarian dispositions reflect
the intensity with which individuals emotionally identify with their social in-groups (Duckitt 1989),
allowing authoritarianism to epitomize an innate desire “to transfer sovereignty to, and commit self and
others to conformity with some collective order.” (Stenner 2005, pg. 141) Such a groups-based
perspective of authoritarianism, where such dispositions reflect an innate desire for homogeneity and
aversion towards diversity among one’s social groups, can inform the relationship between this trait and
mass party identification in U.S. politics. As authoritarians seek to minimize the diversity of people,
beliefs, and behaviors with which they are confronted (Stenner 2005), they should be drawn to the
political party that best cohesively and exclusively contains their in-group members. In this way,
authoritarianism guides the extent to which citizens’ view their own party in “us versus them” terms (see
Tajfel & Turner 1979; Iyengar, Sood & Lelkes 2012), thus integrating intolerance towards diverse, non-
traditional groups into the act of party affiliation.
Yet, authoritarian dispositions do not produce political outcomes, such as party identification, in
isolation. Rather, the emergence of authoritarianism is a dynamic process, triggered by systemic social
changes that undermine the common oneness and sameness that makes “us” an “us” (Feldman 2003;
Feldman & Stenner 1997; Stenner 2005; Duckitt & Fisher 2003). Applied to mass partisanship, such
threats can occur when an individual’s in-party represents diverse social groups and non-traditional
authority figures, allowing citizens to perceive that outside groups are infiltrating the system, turning “us”

8
into “them.” Put another way, if authoritarians treat their in-party as a “superordinate social group within
which social and political authority is vested,” (Duckitt 1989, pg. 80) then the presence of party elites
from diverse gender, ethnic, and religious backgrounds (e.g. women, African-Americans, Latinos, and
non-Protestants for White Protestants) should activate authoritarian intolerance, call into question the
legitimacy of that party’s authority, and lead to dissociation with that party in favor of affiliation with the
party that exclusively represents their social identities.
Ideologies and Social Identities among Party Elites
Resulting from Congressional leadership reform (Rohde 1991), increased party-line voting (Lebo,
McGlynn & Koger 2007), and the ideological repositioning of party elites relating to Southern
realignment (Sundquist 1983), political parties now reflect powerful organizations (Epstein 1986) that
solve collective action problems of political elites (Aldrich 2011), and provide psychological attachments
to the electorate (Campbell et al. 1960; Lewis-Beck, et al. 2008; Green, Palmquist & Shickler 2002).
Subsequently, clearer perceptions of the parties’ ideological and demographic stereotypes have emerged
in the electorate (Fiorina, Abrams & Pope 2011; Fiorina & Levedusky 2006; Levendusky 2009, 2010;
Aldrich 2011; Baumer & Gold 2007, 2010), providing two shifts among party elites – ideological
polarization (per Hetherington & Weiler 2009) and demographic diversification – which may have
triggered citizens’ authoritarian dispositions as a crucial ingredient of party affiliations.
In the case of the former, as party elites ideologically converged with their co-partisans in recent
decades, each party as a whole appeared more ideologically extreme and polarized from the other side
(see Poole & Rosenthal 1997; McCarty, Poole & Rosenthal 2005), with these shifts a consequence of the
“issue evolution” of the social domain (Carmines & Stimson 1986, 1989) where issues relating to the
“culture war” (e.g. gay marriage, abortion), civil rights (e.g. voting rights for African-Americans), and
civil liberties (e.g. government wire-tapping) became permanent fixtures of political discourse and policy-
making. As a result, the parties now offer clear heuristic cues to the public regarding the “Democrat” and
“Republican” labels (Fiornia, Abrams & Pope 2011; Zaller 1992; Lau & Redlawsk 2001; Rahn 1993),
sorting citizens into the party that best reflects their ideological beliefs (Levendusky 2009; 2010), policy

9
preferences (Abramowtiz & Saunders 1998, 2008; Abramowitz 2010), core values (Goren 2005), and
socially motivated needs, including authoritarianism (Jost et al. 2003; Hetherington & Weiler 2009).
But the Democratic and Republican party coalitions also morphed such that each party clearly
represents specific social groups within American society. To this point, a burgeoning line of research has
demonstrated that elite demographic changes impacted micro-level party identity processes, with citizens
increasingly thinking about their party identity as a social identity (Huddy, Mason & Aaroe 2015;
Iyengar, Sood & Lelkes 2012; Mason 2013) that encompasses their gender, ethnic, religious, and other
group affiliations (see Green, Palmquist & Schickler 2002). Thus, citizens today perceive more
commonalities between their party identity and their other salient social identities (Mason 2013),
particularly their racial (Tesler & Sears 2010) and religious identities9 (Abramowitz & Saunders 2008;
Abramowitz 2010; Ellis & Stimson 2012), which, in turn, augment within-party support and between-
party hatred, in line with social identity theory (see Tajfel& Turner 1979; Nicholson 2012; Iyengar, Sood
& Lelkes 2012; Mason 2014).
Underlying this phenomenon was an increase in elected officials from non-traditional backgrounds
(i.e. women, African Americans, Latinos, non-Protestant Christians) that occurred heterogeneously across
the parties (see Figure 2). On one hand, Republicans consistently reflected White, Male, Protestant
Christians, with 70% or more of their Senators holding this profile since the 1970’s. In contrast, the
percentage of Democratic White, Male, Protestant Christian Senators dropped precipitously in the 1990’s
and 2000’s, with the 1992 election serving as a critical year in this process (the lateral line in the graph,
referred to as “the year of the woman10” and the announcement of the “culture war” at the Republican
National Convention)11. These divergent demographic compositions, in turn, offered voters a clear
9 http://www.washingtonpost.com/blogs/monkey-cage/wp/2014/01/20/how-race-and-religion-have-polarized-american-voters/ 10 http://www.washingtonpost.com/blogs/monkey-cage/wp/2014/01/13/electing-more-women-to-congress-isnt-a-solution-for-polarization/ 11 Descriptive analyses by region reveal that this trend of Democratic diversification occurred nationally, and was not a phenomenon tied directly to Southern realignment (see Appendix for graph).

10
portrait of who their party represented, “us” or “them,” with such distinctions activating authoritarianism
in White Protestants’ party identifications (Feldman & Stenner 1997; Stenner 2005).
Figure 2. Party Elites’ Demographic Composition by Party and Year
Given this dichotomy in ideological and demographic party alignments, which contextual mechanism
best links individuals’ authoritarian dispositions to their party identities? While extant literature
(Hetherington & Weiler 2009) emphasizes the ideological polarization of elites on social “culture war”
issues, I contend that the party demographic coalitions serve as the key linkage between authoritarianism
and party identity, as such identity matches cut to the core of authoritarians’ intolerance and desire to
maintain group oneness and sameness. In empirically testing these competing pathways, I propose the
following hypotheses:
H1: White citizens will link their authoritarian dispositions to their party identities through demographic matches with party elites.
H2: The Democratic Party’s diversity will drive this process, rather than the Republican Party’s conservative ideological stances.
H3: When comparing White Protestants and White non-Protestants, authoritarianism will shape party identity based upon religious identity matches between citizen and elite.
.3.4
.5.6
.7.8
Perc
enta
ge W
hite
Mal
e Pr
otes
tant
Sen
ator
s
1970 1980 1990 2000 2010year
Democratic Party Republican Party
Democrat Senators v. Republican SenatorsDemographic Characteristics by Party (1973-2012)

11
Methods
The current hypotheses test the predictors of citizens’ party affiliations over the past four decades in a
way that examines individual-level authoritarian dispositions in the context of ideological and
demographic party stereotypes. As such, I utilize micro- and macro-level data with hierarchal statistical
estimation techniques (Gelman & Hill 2007, Steenbergen & Jones 2002) to estimate the temporal and
regional party-level effects on individuals’ survey responses. This approach allows me to control for the
random effects of an individual being surveyed in a given year or living in a particular region of the
country, while zoning in on exactly how party elites impacted individuals’ authoritarian-based responses
to party identity.
Data and Respondents. The data are derived from multiple existing sources, compiled specifically
for the present analyses. The micro-level data come from the General Social Survey (GSS) spanning from
1973 to 2012. This completely unbalanced, repeated cross sectional survey contains Americans’
demographic information, social values, and political opinions, including the key independent and
dependent variables, in yearly and bi-yearly waves (N = 32,509). Due to the GSS’s inconsistency in data
collection, some years are omitted, thus creating a “lumpy” time-series of 24 yearly data points12 where
individual responses are nested within one of nine U.S. census regions, and year of survey administration.
The majority of GSS respondents are White (82.15%), Female (56.2%), and Protestant Christian
(59.25%), though other religious affiliations including Catholic (25%), Secular (10.45%) and Jewish (2%)
are represented.
To complement the GSS data with party-level ideological and demographic characteristics, I employ
existing and self-complied datasets. DW Nominate Scores (Poole & Rosenthal 1997; McCarty, Poole &
Rosenthal 2005) measure each party’s ideological preferences as revealed through Congressional roll call
votes, while party-level gender, race, and religious compositions come from the National Journal’s
12 The years in the data set include: 1973, 1975, 1976, 1978, 1980, 1983, 1984, 1986, 1987, 1988, 1989, 1990, 1991, 1993, 1994, 1996, 1998, 2000, 2002, 2004, 2006, 2008, 2010, and 2012.

12
Almanac of American Politics13 and Congressional Quarterly’s Politics in America14. Both datasets
operationalize party elites as U.S. Senators in the 93rd to the 112th Congresses, and vary by U.S. census
region and year. These aggregate data were merged with the GSS data, such that each individual GSS
observation was linked with the associated party-level ideological and demographic information for its
given year and U.S. census region.
Authoritarianism. Consistent with prior research (Feldman 2003; Feldman & Stenner 1997;
Hetherington & Weiler 2009; Stenner 2005), the key independent variable, authoritarianism, was
measured with a battery of items that assessed how important each respondent believed certain traits were
for children to have. The GSS used two distinct scales to rate these child-rearing traits. The first,
implemented from 1973 to 1986 asked respondents to rank the desirability of 13 traits (gendered and
gender-neutral versions of these items were administered, and combined for the present analysis)15. Of
theoretical importance to tapping authoritarianism (see Feldman 2003) were the traits “obeys parents,”
and “has good sense and sound judgment” (Pearson’s r = 0.26)16. The latter measure, utilized from 1986
to 2012, asked respondents to rank only five traits on a scale of importance for a child to learn in order to
prepare for life, from the most to least important. In this version, authoritarianism was theoretically
exemplified by the traits “obeys parents,” and “thinks for himself” (Pearson’s r = 0.495). In each scale,
these items were scaled together and recoded 0-1, where 0=lowest and 1=highest authoritarianism.
Due to differences in the fundamental nature of the comparison tasks (the earlier version asking
respondents to compare more traits in larger groupings than the later version) and the inconsistency of the
assessed traits, these two scales have differing properties. In the earlier scale, respondents displayed
greater authoritarianism (mean = 0.493, sd = 0.173) than in the later scale (mean = 0.362, sd = 0.284),
creating a temporal break in authoritarian dispositions centered around 1986. In order to accurately track
13 http://www.nationaljournal.com/almanac 14 http://library.cqpress.com/pia/ 15 See Appendix for the exact wording of both child-rearing scales. 16 Principle component factor analyses were conducted for both versions of the authoritarianism scale. In both versions, the items loaded onto one factor (with loadings of -0.794 and 0.794 in the first version, and loadings of -0.865 and 0.865 in the second version) and the Kaiser-Meyer Olkin measure of sampling adequacy suggested that the sample was factorable (KMO = 0.5 in both versions).

13
respondents’ authoritarian dispositions across the full dataset, I create standardized measure of
authoritarianism (mean = 0, SD = 1), where each value represents a standard deviation from the mean
level of authoritarianism within a given year and measure17.
Party Identity. Respondents’ party affiliations in the GSS were captured using the standard item:
“Generally speaking, do you usually think of yourself as a Republican, Democrat, Independent, or what?”
Responses of “other party” and refusals were omitted, and all remaining responses scaled together to
create the dependent variable, Party ID (coded from 0-1 where 0=Strong Democrat, .5=Pure Independent,
and 1=Strong Republican).
Ideology and Individual Controls. In order to capture respondents’ ideology, the GSS utilized a single
7-point scale where respondent’s placed themselves from “extremely liberal” to “extremely
conservative.18” This item was then recoded 0-1, where 0=extremely liberal and 1=extremely
conservative. Other individual level controls include: race (coded 1=White, 0 otherwise), gender
(0=Female, 1=Male), education (ranging from 0=less than high school to 1=graduate degree), religion
(coded 1= Protestant Christian, 0=non-Protestant Christian or otherwise), age, and geographic location
size (ranging from 0=areas with less than 2,500 residents to 1=metropolitan city with over 250,000
residents)19. Individual-level variation in religious practices is measured with a dummy variable for
membership in a fundamentalist religious group (1=Fundamentalist, 0 otherwise), and a variable for
religious attendance, coded 0=never attend to 1=attend several times a week20.
Party-level Variables. To measure the contextual mechanisms of the political environment, I create a
series of variables that capture the temporal and regional variation in Senators’ ideological and
demographic compositions. While such party cues may influence individuals’ party affiliations nationally
if a party leader (e.g. Barack Obama) represents the ideology and demographics of the entire party, such
heuristics, I believe, should be most potent at the regional level where voters can relate to the cues of the 17 See Appendix for graphical representations of mean authoritarianism (standardized and unstandardized) by year and U.S. region. 18 This item was not administered in 1973. 19 Income is omitted since the full GSS data did not contain an inflation-adjusted income variable. 20 All non-dichotomous individual level variables are mean centered by year to strip them of their past history.

14
party elites directly representing them in Congress. Therefore, all party-level variables are operationalized
at the yearly and regional levels, capturing the balance between characteristics of local representatives
and national stereotypes.
Revealed ideological preferences are operationalized as the median DW Nominate score for a party’s
Senators in a year-by-region unit. These variables range from -0.118 to 0.654 (mean = 0.281, sd = 0.165)
and -0.479 to -0.034 (mean = -0.34, sd = 0.086), for Republicans and Democrats, respectively, with
negative values reflecting more liberal positions, positive values more conservative positions, and larger
absolute values greater ideological extremity from the moderate zero reference point. Next, the
demographic composition of elites is operationalized as the percentage of White, Male, Protestant
Senators in each party within a year-by-region unit. These variables range from 0 to1, where 1 represents
social homogeneity where 100% of Senators are White, Male, and Protestant, and values approaching 0
reflect social diversity where a party’s Senators contain more women, ethnic minorities, and non-
Protestants. While both parties’ Senators span the full range of this scale, Democrats, on average, tend to
be more diverse (mean = 0.527, sd = 0.294) than Republicans (mean = 0.69, sd = 0.29).
Aggregate level controls. Finally, to account for yearly and regional influences on mass partisanship,
including Southern realignment, I include control variables for presidential party (0 = Democratic, 1 =
Republican), yearly policy mood21 (which assesses public support for government programs on a liberal-
conservative spectrum, with mean = 56.92, sd = 2.89), and dummies for Southern and New England
regions.
Results
I hypothesize that White citizens’ authoritarian dispositions influence their party preferences through
social identity matches with party elites (H1), with the diversification of the Democratic Party activating
this relationship (H2), and impacting it independent of ideological considerations when examining
demographic matches among religious sub-groups (H3). Specifically, I anticipate a significant interactive
relationship between authoritarianism and the demographic composition of party elites, such that as 21 See http://www.unc.edu/~cogginse/Policy_Mood.html and Stimson (2004) for details.

15
individuals hold greater authoritarian dispositions they will dissociate from the party representing more
diverse social groups (i.e. as the Democratic Party becomes demographically diverse White authoritarians
should favor the socially homogeneous Republican Party). Further, this interactive pattern should hold
even when controlling for the moderating effects of authoritarianism and party elites’ ideological
orientations, and be accentuated among White Protestants, whose in-group identities are encompassed by
Republican leadership.
To test these relationships, I estimate hierarchal multi-level models that incorporate individual and
contextual factors, account for the longitudinal nature of the GSS, and provide fixed and random effects at
the yearly and regional levels (Steenbergen & Jones 2002, Gelman & Hill 2007). Though observations are
clustered within two different aggregate levels of analysis – year and U.S. census region – I operationally
cluster individual-level data into a single unit that represents a unique year and region (e.g., 1973 Mid-
Atlantic, 1996 Pacific, 2012 New England, etc.). Thus, my random effects are taken into account at each
year-by-region unit, rather than by year or region separately, creating 216 unique aggregate-level units.
These models estimate the effects of authoritarianism, party elites’ ideological orientations and
demographic compositions, the interaction between authoritarianism and these party-level factors, and all
controls described above22.
Mechanisms of Authoritarian Sorting
Table 1 shows that, on one hand, White citizens, regardless of their religious affiliations, are typically
more sensitive to elites’ ideological changes (see model 1), replicating the existing approach to
authoritarian sorting (Hetherington & Weiler 2009, Federico & Tagar 2014)23. As Democrat elites hold
more liberal positions,24 Whites at the mean level of authoritarianism, on average, affiliate more with the
Republican Party (β = 0.296, p<.01), with this liberalization also conditioning the effects of
authoritarianism on party identity, such that high authoritarians identify towards the Republican Party as
22 See Appendix for full multi-level model notation. 23 However, when examining the effects of party elites’ ideological and demographic changes in isolation, both mechanisms have significant conditional effects on the relationship between authoritarianism and Republican Party identity (see Appendix Table 1). 24 DW Nominate scores reversed coded in these models to maintain consistent directionality of effects.

16
both parties’ elites hold more ideologically extreme issue positions (β = 0.085 for Democrat elites, β =
0.032 for Republican elites, both p < .05). However, and in contrast to the conventional approach, the
increased liberalization of Democrats, rather than the increased conservatism of Republicans, produces
larger effect sizes on the relationship between authoritarianism and Republican identification.
Table1. The Effects of Authoritarianism on Party Identification, as Conditioned by Elites’ Demographic Compositions and Ideological Orientations (1973-2012)
(1) (2) Fixed Effects
Whites β (SE)
White Protestants β (SE)
Intercept -0.301 (0.068) -0.159 (0.081) Authoritarianism (standardized) -0.029* (0.016) -0.005 (0.021)
%Homogeneous Democrats 0.000 (0.013) -0.026 (0.016) %Homogeneous Republicans 0.012 (0.013) 0.049** (0.016)
Liberal Democrats 0.296*** (0.049) 0.324** (0.054) Conservative Republicans 0.035 (0.026) 0.096** (0.032)
Auth X %Homogeneous Democrats -0.008 (0.011) -0.031** (0.015) Auth X %Homogeneous Republicans -0.006 (0.010) 0.015 (0.014)
Auth X Liberal Democrats 0.085** (0.036) 0.045 (0.045) Auth X Conservative Republicans 0.032** (0.016) 0.017 (0.022)
Percentage Republican Senators 0.102 (0.018) 0.123 (0.021) Ideology 0.630 (0.011) 0.618 (0.015)
Age -0.001 (0.000) -0.001 (0.000) Gender 0.024 (0.004) 0.017 (0.006)
Education 0.087 (0.008) 0.106 (0.011) City Type -0.016 (0.007) 0.023 (0.009)
Fundamentalist Christian 0.014 (0.005) -0.031 (0.006) Church Attendance 0.033 (0.006) 0.062 (0.009)
South Region 0.017 (0.009) 0.006 (0.010) New England Region 0.011 (0.010) 0.080 (0.013)
Policy Mood 0.003 (0.001) 0.000 (0.001) Presidential Party -0.009 (0.007) 0.004 (0.009)
Random Effects Intercept 0.021 0.015
Authoritarianism 0.013 0.015 Residual 0.303 0.308
N (obs) 22046 12793 N (year by region cluster) 200 200 Deviance 9962.8 6230.9
** where p < .05, and * where p < 0.1 on a two-tailed test
Yet, the null conditional effects of party elites’ demographic profiles in model 1 may, in fact, reflect
heterogeneous identity matches across White citizens of differing religious backgrounds. Theoretically, as
linkages between individuals’ authoritarian dispositions and their party identities on the basis of
demographic coalitions are, by definition, group specific, a perception of cohesively shared identities

17
between citizen and elite only makes sense when both belong to the same groups. Therefore, as the
Democratic Party possesses more elites from diverse gender, ethnic, and religious backgrounds, while the
Republican Party remains mostly White, male and Protestant, Whites’ reactions to these demographic
shifts along the authoritarian dimension should be washed out when combining individuals from all
religious denominations. Further, responses to demographic matches between citizen and party should be
more powerful than reactions to elites’ ideological positions among White Protestants, who would view a
party composed primarily of White, Male Protestants as exclusively containing their social groups.
According to Table 1 model 2, and in support of hypotheses 2 and 3, this is exactly the pattern I find. As
Democrat elites comprise a greater percentage of White, Male Protestants (i.e. more cohesively reflecting
these citizens’ social groups), White Protestants holding greater authoritarian dispositions typically
identify more with the Democratic Party (β = -0.031, p< .05), with authoritarianism having no
conditioning effects on how party level ideological positions shape partisan identities.
Figure 3. Predicted Party ID Across Authoritarianism and Democratic Senators’ Demographics
From a graphical perspective of White Protestants’ predicted party identifications (Figure 3), when
Democratic Senators are demographically alike, moving from low (1st percentile) to high (99th percentile)
authoritarianism leads to a shift towards Democratic Party identification (moving from 0.466 to 0.44 on

18
the 0-1 scale25). But as Democratic elites reflect greater diversity in gender, ethnicity, and religion (i.e.
groups other than White, Male Protestants), low authoritarians tend to lean Democrat (at 0.43 on the 0-1
scale), while those holding increasingly authoritarian dispositions identify more Republican (0.575 on the
0-1 scale). Put another way, for White Protestant authoritarians, a shift in Democrats from containing no
White, Male Protestant Senators to exclusively comprising them leads to approximately 15% movement
along the party identification scale towards the Democratic Party26. In contrast, such demographic
changes within the Republican Party (when they do occur) have no significant effect on how White
Protestants translate their authoritarian dispositions into party affiliations (see Table 1).
Thus far, the social identity mechanism of authoritarian-based party sorting proves robust when
controlling for increases in ideological extremity among parties’ elites, and among White Protestants, for
whom elites’ changes in the percentage of White, Male Protestant Senators resonant deepest. From this
standpoint, the demographic groups represented by the parties – and how these groups exclusively reflect
“traditional” in-groups or inclusively exhibit “diverse” out-groups – serve as the link between White
Protestant citizens’ authoritarian dispositions and their party identifications.
Religious Identity as a Linkage Tool
However, to the extent that authoritarianism represents motivated social conservatism (per Jost et al
2003), White authoritarians may latch onto the party that represents White Male Protestants or
conservative issue positions for the same underlying motive – because that party should embody the
moral traditionalism values associated with authoritarian dispositions (Barker & Tinnick 2006; Federico
et al 2011). As such, authoritarians might identify with a demographically homogeneous party for
ideological reasons that have nothing to do with in-group attachment or out-group intolerance. Indeed, as
the Republican Party became characterized by its relationship with the Christian Right (Fiorina, Abrams
& Pope 2011; Abramowitz 2010) citizens conceptualized their ideological conservatism via their religious 25 Predicted values are generated from a separate multi-level model that utilizes the original coding of party identity, and examines the conditional effects of Democratic Senators’ demographic compositions in isolation for ease of interpretation. 26 A similar graphical representation emerges when examining the effects of Democratic Senators’ ideological orientations on party identity across levels of authoritarianism (see Appendix Figure A10).

19
conservatism (Ellis & Stimson 2012). This has resulted in a conflation between religious identities and
ideological orientations in contemporary politics. However, an examination of religious groups can
provide a critical test of the ideological and social identity mechanisms that link citizens’ authoritarian
dispositions to their party identities.
In the case of White Protestants, whose attractions to the Republican Party can be based on shared
ideological and religious affiliation grounds, authoritarian dispositions should lead to the same party
identity outcomes as elites’ demographic compositions shift over time, regardless of the linking
mechanism. However, for White non-Protestants, the linkage between their religious and party identities
may be cross-pressured. Over time, the Republican Party should attract these authoritarians due to its
conservative social issue positions, while the Democratic Party should appeal to them since its elites
better reflect their religious identities (i.e. Catholic, Jewish, and Secular). If authoritarianism leads to
party identifications through shared in-group identities, as hypothesized, then White non-Protestant
authoritarians should identify as Democrats when its elites reflect more non-Protestant religious
denominations by shying away from a Republican Party characterized by Evangelical Christians. In
contrast, if authoritarianism is linked to party identity primarily through shared ideologies, then White
non-Protestant authoritarians should identify more strongly with the Republican Party when it is
comprised by White Protestants who espouse traditional moral values.

20
Table 2. The Effects of Authoritarianism and Ideology on Party Identification, Comparing Religious Identities (1973-2012)
Fixed Effects
White Protestants White Non-Protestants
Intercept -0.092 (0.084) -0.237 (0.092) Authoritarianism (standardized) 0.008 (0.009) 0.004 (0.007)
Ideology 0.910** (0.058) 0.668** (0.048) %Homogeneous Democrats -0.036** (0.017) -0.020 (0.018)
%Homogeneous Republicans 0.065** (0.016) 0.002 (0.018) Auth X %Homogeneous Democrats -0.026** (0.012) 0.009 (0.013)
Auth X %Homogeneous Republicans 0.017 (0.013) -0.032** (0.012) Ideo X %Homogeneous Democrats -0.508** (0.082) -0.269** (0.078)
Ideo X %Homogeneous Republicans 0.007 (0.089) 0.091 (0.079) Percentage Republican Senators 0.093 (0.022) 0.021 (0.025)
Age -0.001 (0.000) -0.002 (0.000) Gender 0.016 (0.006) 0.040 (0.006)
Education 0.107 (0.011) 0.036 (0.010) City Type 0.022 (0.009) -0.038 (0.010)
Fundamentalist Christian -0.034 (0.006) Church Attendance 0.060 (0.009) -0.003 (0.009)
South Region -0.017 (0.009) 0.015 (0.010) New England Region 0.063 (0.011) 0.009 (0.010)
Policy Mood 0.002 (0.001) 0.004 (0.002) Presidential Party -0.007 (0.009) -0.015 (0.010)
Random Effects Intercept 0.023 0.035
Authoritarianism 0.012 0.007 Ideology 0.180 0.160 Residual 0.306 0.281
N (obs) 12793 9735 N (year by region cluster) 200 200 Deviance 6133.9 3084.5
** where p < .05 on a two-tailed test
I test these predictions through multi-level models that include GSS respondents’ authoritarianism,
ideology, the interactions between authoritarianism and each party’s demographic compositions, and the
interactions between ideology and each party’s demographic compositions27, and find consistent support
for the proposed effects of authoritarianism and ideology (see Table 2). For White Protestants both
authoritarianism and ideology lead to the same partisan outcomes as the Democratic Party contains fewer
White, Male Protestant elites. As such, greater authoritarianism (β = -0.026, p<.05) and conservatism (β =
-0.508, p<.05) typically relates to a dissociation from the Democratic Party as those elites reflect more
27 See Appendix for full multi-level model notation.

21
“diverse” groups28. Accounting for self-reported ideology, when White Male Protestants comprise 50
percent or less of Democrat Senators, the average marginal effect of authoritarianism among White
Protestants is significant in the direction of Republican identification (see Figure 4). Thus, among White
Protestants, social identity and ideological considerations lead to similar patterns of party identification.
Figure 4. Marginal Effects of Authoritarianism Across Varying Democratic Party Demographic Compositions (White Protestants Only)
Note: bars represent 95% confidence intervals
Figure 5. Marginal Effects of Authoritarianism Across Varying Republican Party Demographic
Compositions (White Non- Protestants Only)
Note: bars represent 95% confidence intervals
28 Since the range of authoritarianism values (a standardized z-score) is about six times larger than the range of ideology values (mean-centered 0-1), smaller effect sizes of authoritarianism reflect these scaling differences.

22
Contrastingly, the pattern of effects among White non-Protestants reveals that ideological orientations
and authoritarian dispositions lead to opposite party identification outcomes (Table 2, model 2). As White
non-Protestants (e.g. Catholics, Jewish, and Secular individuals) are increasingly conservative, they, on
average, identify more with the Democratic Party when its elites reflect a greater percentage of White
Male Protestants (β = -0.269, p<.05), similar to the pattern found among White Protestants. Authoritarian
dispositions among these individuals, however, lead to increased identification with the Democratic Party
as the Republican Party contains more White Male Protestant Senators (β = -0.032, p< .05). Displayed
graphically (Figure 5), when 50 percent or more of Republican Senators are White Male Protestants, the
average marginal effect of authoritarianism among White non-Protestants is significantly negative,
indicating that higher authoritarianism relates to Democratic Party identification.
Thus, even when controlling for individuals’ ideological self-placements, authoritarianism molds
party identities in the presence religious matches between citizens and elites, but in a way that reflects
dissociation from the party failing to exclusively represent those identities. Indeed, the marginal effects
(Figures 4 and 5) reveal something of a tipping point for intolerance, such that as a party’s elites include
more “out-group” than “in-group” religious denominations and ethnicities, those higher in
authoritarianism are no longer attracted to it. In contrast, conservative ideological positions ubiquitously
translate into support for the party that contains the greatest percentage of White, Male Protestants,
among White respondents. Put simply, when stripping away the ideological aspects of authoritarianism,
these dispositions shape mass party identification through the trait’s innate desire to affiliate with in-
groups and demonstrate intolerance towards out-groups, in clear support of all three hypotheses.
Discussion
Through an examination of GSS data embedded within party elites’ ideological and demographic
compositions, I found support for social identities as a contextual mechanism linking White citizens’
authoritarian dispositions to their party identities, and all of my hypotheses. Specifically, I showed that
the diversification of the Democratic Party, as they increasingly elected women, minorities, and non-
Protestants to the Senate, primarily drove this authoritarianism-based sorting process. While I do find

23
evidence of elites’ ideological polarization as a mechanism of authoritarian-based partisan sorting (see
Hetherington & Weiler 2009), when empirically pitted against the social identity mechanism, it fails to
significantly condition authoritarianism’s effect among White Protestants. Finally, by comparing the
ideological and authoritarian considerations of White Protestants and non-Protestants, I demonstrate that
citizens use party elites’ demographics to form the link between their authoritarian dispositions and party
affiliations. Taken together, these findings present a story of group-based authoritarianism wherein White
citizens’ authoritarian dispositions shape their party identifications via the trait’s innate desire to affiliate
with in-groups (Duckitt 1989) and demonstrate intolerance towards out-groups (Stenner 2005).
Alternate Explanations: Political Sophistication and Cohort Replacement
Yet, the dynamics of authoritarian-based partisan sorting rely upon an assumption that citizens are
politically aware and can interpret elite-level party shifts in ideological extremity and demographic
composition. However, most citizens are ignorant of such political nuances (Converse 1964, Zaller 1992,
Delli Carpini & Keeter 1996), implicating heterogeneous effects of authoritarianism on political outcomes
across levels of political sophistication, with only those most politically savvy able to directly connect
their dispositions with party preferences (see Johnston 2013, Johnston & Wronski 2013, Federico &
Tagar 2014). Indeed this asymmetry exists in the current data, when using recent presidential election
voting as a proxy for political sophistication, such that the effects of authoritarianism are accentuated
among White Protestant voters and non-significant among non-voters (see Appendix Table A1)29. This
heterogeneity highlights the robustness of the social identity mechanism of authoritarian party sorting, as
the effects persist when collapsing individuals across all levels of political engagement.
Further, citizens’ party identities are highly stable over time (Campbell et al 1960; Lewis-Beck et al
2008), updated only under unique circumstances (Carsey & Layman 2006). Thus, even if citizens are
29 For White Protestants most politically engaged, as they saw a Democratic Party becoming increasingly comprised of White, Male, Protestant Senators, those higher in authoritarianism, on average, identified more with the Democratic Party, and conversely, identified more, on average, as Republican when Democrat Senators reflected diverse groups. In contrast, among both non-voters and White non-voters, no significant main or interactive effects of authoritarianism, party elites’ ideological positions, or party elites’ social identities emerge. There were not enough observations of White, Protestant non-voters to estimate a properly identified model.

24
fully aware of the elite-level changes to party demographics and ideologies, they may not be able or
willing to modify their long-standing party identity. Instead, authoritarian-based partisan sorting
processes may occur primarily among young voters who are exposed to the parties for the first time.
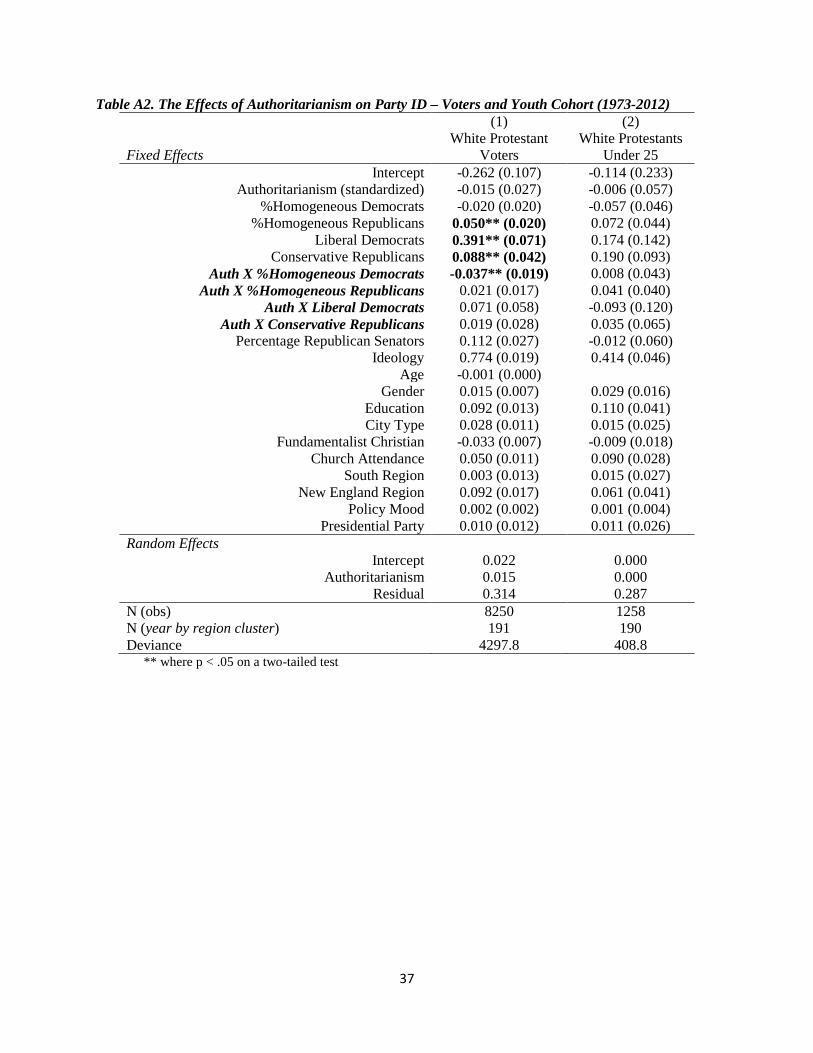
However, cohort replacement does not appear to occur in this instance, as no significant main or
interactive effects of authoritarianism, party elites’ ideological positions, or party elites’ social identities
emerge among GSS respondents 25 or younger30.
Limitations of Observational Data
Reliance upon observational data sources, while vital for exploring the longitudinal effects of
authoritarianism on mass party identifications, limit the nature of my analyses. In particular, the current
findings provide no definitive determination of the casual pathway from individuals’ authoritarian
dispositions to their party identities. Currently, I make a directional assumption based on observed
changes in elites’ ideological preferences and demographics, and how authoritarianism predicts party
identity in these contexts. Yet, given the endogeneity of the political processes that made the Democrats
liberal and diverse and the Republicans conservative and homogeneous (see Aldrich 2011), there is no
absolute way to know which contextual factor is the true causal mechanism. At best, I empirically pitted
the two mechanisms against one another and showed that social identities were a more powerful influence
on White Protestants’ party identities in the past 40 years (Table 1, models 3 and 4). Future experimental
work can test the moderating impacts of elite changes to ideological extremity and demographic
composition on the relationship between authoritarianism and party identity in isolation, and provide
some insights as to which shifts activated authoritarian-based party sorting. Such work can bolster these
observational findings, shed light onto the mechanisms of authoritarian threat in today’s political
environment, and determine the true causal pathway from authoritarian dispositions to party affiliations.
Broader Implications
Overall, the present study sheds light onto social identities as a mechanism linking authoritarianism to
party identities. As such, the authoritarian partisan divide present in American politics today reflects 30 Similar non-significant effects found when “young cohort” is defined as 30 or younger, see Appendix Table A2.

25
group-based interactions, creating a link between White citizens’ authoritarian dispositions and their
intolerance of non-traditional and “outsider” social groups (e.g. women, African Americans,
homosexuals) as party authority figures. This finding holds particular normative import for American
politics more generally, as the demographic composition of the electorate is changing, and the parties
need to respond in one way or another. As Republican leadership make forays into enticing minority
groups31, how will White Protestant Republicans (and particularly high authoritarians) react to such
change? The current research may shed some light onto citizens’ reactions to such party demographic
shifts along the authoritarian dimension, perhaps by harkening back to the era of the 1970’s and 1980’s
when the demographic compositions of the parties were relatively similar, and authoritarianism a minor
influence on citizens’ party identity considerations. Feasibly with both parties similarly reflecting the
social backdrop of the American public, authoritarianism will no long serve as such a prominent fixture of
mass political polarization.
Further, with the link between authoritarianism and party affiliation approached from a social identity
perspective, authoritarians are not necessarily conservatives, especially on economic issues. Instead they
possess an affinity towards the Republican Party that has developed over a decades-long dissociation with
the Democratic Party on the basis of intolerance towards diversity and an exclusion of outsiders. As a
result, shared social identities (such as gender, ethnic, and religious ties) may form the basis of the link
that now allows authoritarians to exhibit conservatism through their Republican identity across a variety
of “harder” issues (see Johnston & Wronski 2013, Johnston 2013). Thus, authoritarians may only be as
conservative as the party that best represents their group identities.
31 http://www.huffingtonpost.com/2014/03/04/susana-martinez-gop-diversity_n_4895607.html

26
References
Abramowitz, A. I. (2010). The Disappearing Center: Engaged Citizens, Polarization, and American
Democracy. Yale University Press.
Abramowitz, A. I., & Saunders, K. L. (1998). Ideological Realignment in the U.S. Electorate. The
Journal of Politics, 60(03), 634–652.
Abramowitz, A. I., & Saunders, K. L. (2008). Is Polarization a Myth? The Journal of Politics, 70(02),
542–555.
Adorno, T. W., Frenkel-Brunswik, E., & Levinson, D. J. (1950). The Authoritarian personality. W. W.
Norton.
Aldrich, J. H. (2011). Why Parties? A Second Look. University of Chicago Press. Retrieved from
http://www.press.uchicago.edu/ucp/books/book/chicago/W/bo11315021.html
Altemeyer, B. (1988). Enemies of freedom: understanding right-wing authoritarianism. Jossey-Bass
Publishers.
Barker, D. C., & Tinnick, J. D. (2006). Competing Visions of Parental Roles and Ideological Constraint.
The American Political Science Review, 100(2), 249–263.
Baumer, D. C., & Gold, H. J. (2007). Party images and partisan resurgence. The Social Science Journal,
44(3), 465–479.
Baumer, D. C., & Gold, H. J. (2010). Parties, polarization, and democracy in the United States. Paradigm
Publishers.
Campbell, A., Converse, P., Miller, W., & Stokes, D. (1960). The American voter. University of Chicago
Press.
Carmines, E. G., & Stimson, J. A. (1986). On the Structure and Sequence of Issue Evolution. The
American Political Science Review, 80(3), 901–920.
Carmines, E. G., & Stimson, J. A. (1989). Issue Evolution: Race and the Transformation of American
Politics. Princeton University Press.
Carsey, Thomas M, and Geoffrey C Layman. 2006. “Changing Sides or Changing Minds? Party

27
Identification and Policy Preferences in the American Electorate.” American Journal of Political
Science 50(2): 464–477.
Converse, Philip. 1964. “The Nature of Belief Systems in Mass Publics.” In Ideology and Discontent,,
New York: Free Press.
Delli Carpini, Michael X., and Scott Keeter. 1996. What Americans know about politics and why it
matters. Yale University Press.
Duckitt, J. (1989). Authoritarianism and Group Identification: A New View of an Old Construct. Political
Psychology, 10(1), 63–84.
Duckitt, J. (2001). A dual-process cognitive-motivational theory of ideology and prejudice. Advances in
Experimental Social Psychology, 33(4), 41–113.
Duckitt, J., & Fisher, K. (2003). The Impact of Social Threat on Worldview and Ideological Attitudes.
Political Psychology, 24(1), 199–222.
Duckitt, J., & Sibley, C. G. (2009). A Dual-Process Motivational Model of Ideology, Politics, and
Prejudice. Psychological Inquiry, 20(2-3), 98–109.
Ellis, C., & Stimson, J. A. (2012). Ideology in America. Cambridge University Press.
Epstein, L. D. (1986). Political Parties in the American Mold. Univ of Wisconsin Press.
Federico, C. M., Fisher, E. L., & Deason, G. (2011). Expertise and the Ideological Consequences of the
Authoritarian Predisposition. Public Opinion Quarterly, 75(4), 686–708.
Federico, C. M., & Tagar, M. R. (2014). Zeroing in on the Right: Education and the Partisan Expression
of Authoritarianism in the United States. Political Behavior 36(3), 581-603.
Feldman, S. (2003). Enforcing Social Conformity: A Theory of Authoritarianism. Political Psychology,
24(1), 41–74.
Feldman, S., & Stenner, K. (1997). Perceived Threat and Authoritarianism. Political Psychology, 18(4),
741–770.
Fiorina, M. P., Abrams, S. J., & Pope, J. (2011). Culture war?: the myth of a polarized America.
Longman.
28
Fiorina, M. P., & Levendusky, M. S. (2006). Disconnected: The political class versus the people. Red and
blue nation, 1, 49-71.
Gelman, A., & Hill, J. (2007). Data Analysis Using Regression and Multilevel. Hierarchical Models, 547.
Goren, P. (2005). Party identification and core political values. American Journal of Political
Science, 49(4), 881-896.
Green, D. P., Palmquist, B., & Schickler, E. (2002). Partisan Hearts and Minds: Political Parties and the
Social Identities of Voters. Yale University Press.
Hetherington, M., & Suhay, E. (2011). Authoritarianism, Threat, and Americans’ Support for the War on
Terror. American Journal of Political Science, 55(3), 546–560.
Hetherington, M., & Weiler, J. D. (2009). Authoritarianism & polarization in American politics.
Cambridge University Press.
Huddy, Leonie, Lilliana Mason, and Lene Aaroe. 2015. “Expressive Partisanship: Campaign
Involvement, Political Emotion, and Partisan Identity.” American Political Science
Review 109(1): forthcoming
Iyengar, S., Sood, G., & Lelkes, Y. (2012). Affect, Not Ideology A Social Identity Perspective on
Polarization. Public Opinion Quarterly, 76(3), 405–431.
Johnston, C. D. (2013). Dispositional Sources of Economic Protectionism. Public Opinion Quarterly,
77(2), 574–585.
Johnston, C. D., & Wronski, J. (2013). Personality Dispositions and Political Preferences across Hard and
Easy Issues. Political Psychology, n/a–n/a.
Jost, J. T., Federico, C. M., & Napier, J. L. (2009). Political Ideology: Its Structure, Functions, and
Elective Affinities. Annual Review of Psychology, 60(1), 307–337.
Jost, J. T., Glaser, J., Kruglanski, A. W., & Sulloway, F. J. (2003). Political conservatism as motivated
social cognition. Psychological Bulletin;Psychological Bulletin, 129(3), 339–375.
Lakoff, G. (1996). Moral politics: what conservatives know that liberals don’t. University of Chicago
Press.

29
Lau, R. R., & Redlawsk, D. P. (2001). Advantages and Disadvantages of Cognitive Heuristics in Political
Decision Making. American Journal of Political Science, 45(4), 951–971.
Lebo, M. J., McGlynn, A. J., & Koger, G. (2007). Strategic Party Government: Party Influence in
Congress, 1789–2000. American Journal of Political Science, 51(3), 464–481.
Levendusky, M. (2009). The partisan sort: how liberals became Democrats and conservatives became
Republicans. University of Chicago Press.
Levendusky, M. S. (2010). Clearer Cues, More Consistent Voters: A Benefit of Elite Polarization.
Political Behavior, 32(1), 111–131.
Lewis-Beck, Michael S., William Jacoby, Helmut Norpoth, and Herbert Weisberg. 2008. The American
voter revisited. University of Michigan Press.
Mason, L. (2013). The Rise of Uncivil Agreement Issue Versus Behavioral Polarization in the American
Electorate. American Behavioral Scientist, 57(1), 140–159.
Mason, L. (2014). “I Disrespectfully Agree”: The Differential Effects of Partisan Sorting on Social and
Issue Polarization. American Journal of Political Science, n/a–n/a.
McCarty, N., Poole, K. T., & Rosenthal, H. (2005). Polarized America: The Dance of Ideology and
Unequal Riches. Retrieved from http://escholarship.org/uc/item/1zz8f29d
Miller, K. P., Brewer, M. B., & Arbuckle, N. L. (2009). Social Identity Complexity: Its Correlates and
Antecedents. Group Processes & Intergroup Relations, 12(1), 79 –94.
Nicholson, S. P. (2012). Polarizing Cues. American Journal of Political Science, 56(1), 52–66.
Pérez, E. O., & Hetherington, M. J. (2014). Authoritarianism in Black and White: Testing the Cross-
Racial Validity of the Child Rearing Scale. Political Analysis, 22(3), 398-412.
Poole, K. T., & Rosenthal, H. (1997). Congress: A Political-Economic History of Roll Call Voting.
Oxford University Press.
Rahn, W. M. (1993). The role of partisan stereotypes in information processing about political
candidates. American Journal of Political Science, 37(2), 472-496.
Roccas, S., & Brewer, M. B. (2002). Social Identity Complexity. Personality and Social Psychology

30
Review, 6(2), 88 –106.
Rohde, D. W. (1991). Parties and Leaders in the Postreform House. University of Chicago Press.
Steenbergen, M. R., & Jones, B. S. (2002). Modeling Multilevel Data Structures. American Journal of
Political Science, 46(1), 218.
Stenner, K. (2005). The authoritarian dynamic. Cambridge University Press.
Stimson, J. A. (2004). Tides of Consent: How Public Opinion Shapes American Politics. Cambridge
University Press.
Tajfel, & Turner, J. C. (1979). An integrative theory of intergroup conflict (pp. 33–48).
Tesler, M., & Sears, D. O. (2010). Obama’s Race: The 2008 Election and the Dream of a Post-Racial
America. University of Chicago Press.
Zaller, J. (1992). The nature and origins of mass opinion. Cambridge University Press.

31
Appendix
Figure A1. Relationships between Authoritarianism and Party ID, from Hetherington & Weiler (2009)
Notes: Bars represent 95% confidence intervals.
Figure A2. Mean Authoritarianism in Strong Democrats and Strong Republicans (1973-2012)
-.4-.2
0.2
.4M
ean
Aut
horit
aria
nism
(sta
ndar
dize
d)
1970 1980 1990 2000 2010year
Strong Democrat Strong Democrat (Whites)
Strong Republican Strong Republican (Whites)
Mean Authoritarianism in Strong Partisans, 1973-2012

32
Figure A3. Mean Party ID Among High and Low Authoritarians By Region (1973-2012)
Figure A4. Party Elites’ Demographic Composition by Party, Year and Region
Figure A5. Child-rearing Items in the GSS
Version 1 (applicable 1973-1986): 1) Which three qualities listed on this card would you say are the most desirable for a child to have? 2) Which one of these three is the most desirable of all? 3) All of the qualities listed on this card may be desirable, but could you tell me which three you consider least important? 4) And which one of these three is least important of all? [There are 13 traits on this list]
0.5
10
.51
0.5
1
1970 1980 1990 2000 2010 1970 1980 1990 2000 2010 1970 1980 1990 2000 2010
New England Mid-Atlantic East North Central
West North Central South Atlantic East South Central
West South Central Mountain Pacific
High Authoritarian High Authoritarian (Whites)Low Authoritarian Low Authoritarian (Whites)
year
By Region, 1973-2012Mean Party ID Among High and Low Authoritarians
0.5
10
.51
0.5
1
1970 1980 1990 2000 2010 1970 1980 1990 2000 2010 1970 1980 1990 2000 2010
New England Mid-Atlantic East North Central
West North Central South Atlantic East South Central
West South Central Mountain Pacific
Democratic Party Republican Party
year
By Party & Region (1973-2012)Percentage of White Male Protestant Senators

33
Quality desirable for a child to have: THAT HE HAS GOOD SENSE AND SOUND JUDGMENT / THAT HE OBEYS HIS PARENTS WELL 1. Selected as the MOST desirable quality 2. Selected as one of the top 3 MOST desirable qualities 3. Not mentioned as either desirable or un-desirable 4. Selected as one of the top 3 LEAST desirable qualities 5. Selected as the LEAST desirable quality Version 2 (applicable 1986-2012): If you had to choose, which thing on this list would you pick as the most important for a child to learn to prepare him or her for life? [There are five traits on the list] TO OBEY / TO THINK FOR HIMSELF OR HERSELF 1. Most important trait 2. Second most important trait 3. Third most important trait 4. Fourth most important trait 5. Least important trait
Figure A6. Mean Authoritarianism by Region and Year (standardized scale)
-.50
.5-.5
0.5
-.50
.5
1970 1980 1990 2000 2010 1970 1980 1990 2000 2010 1970 1980 1990 2000 2010
New England Mid-Atlantic East North Central
West North Central South Atlantic East South Central
West South Central Mountain Pacific
Mean
Auth
oritar
ianism
by R
egion
/Yea
r
year
By Region, 1973-2012Deviations from the National Mean of Authoritarianism

34
Figure A7. Mean Authoritarianism by Region and Year (unstandardized scale)
Figure A8. Full Multi-level model notation for model that compares the conditioning mechanisms of ideology and identity:
Partisan Identityijt = β0jt[i] + β1jt[i]Authoritarianismi + β2Controlsijt + β3Southj + β4NorthEastj + β5%RepSenatorsjt + β6PolicyMoodt + β7PresidentPartyt + εi
Β0jt[i] = γ1 + γ2Ideology_Demjt + γ3Ideology_Repjt + γ4Identity_Demjt + γ5Identity_Repjt + ω0jt Β1jt[i] = γ6 + γ7Ideology_Demjt + γ8Ideology_Repjt + γ9Identity_Demjt + γ10Identity_Repjt + ω1jt
Figure A9. Full Multi-level model notation for model that compares the how party elites’ demographic compositions conditions the relationships between authoritarianism, ideology, and party identity:
Partisan Identityijt = β0jt[i] + β1jt[i]Authoritarianismi + β2jt[i]Ideologyi + β3Controlsijt + β4Southj + β9NorthEastj + β9%RepSenatorsjt + β10PolicyMoodt + β11PresidentPartyt + εi
Β0jt[i] = γ1 + γ2Identity_Demjt + γ3Identity_Repjt + ω0jt Β1jt[i] = γ4 + γ5Identity_Demjt + γ6Identity_Repjt + ω1jt
Β2jt[i] = γ7 + γ8Identity_Demjt + γ9Identity_Repjt + ω2jt
.2.3
.4.5
.6.2
.3.4
.5.6
.2.3
.4.5
.6
1970 1980 1990 2000 2010 1970 1980 1990 2000 2010 1970 1980 1990 2000 2010
New England Mid-Atlantic East North Central
West North Central South Atlantic East South Central
West South Central Mountain Pacific
Mea
n A
utho
ritar
iani
sm b
y R
egio
n/Y
ear
year
By Region, 1973-2012Mean of Authoritarianism (Unstandardized)

35
Figure A10. Predicted Party ID Across Authoritarianism and Democratic Senators’ Liberalism

36
Table A1. The Effects of Authoritarianism on Party Identification, as Conditioned by Elites’ Demographic Compositions and Ideological Orientations (1973-2012)
(1) (2) Fixed Effects
Whites Whites
Intercept -0.234 (0.07) -0.133 (0063) Authoritarianism (standardized) 0.009 (0.006) -0.042** (0.013)
%Homogeneous Democrats -0.025* (0.013) %Homogeneous Republicans 0.027** (0.013)
Liberal Democrats 0.233** (0.049) Conservative Republicans 0.062** (0.028)
Auth X %Homogeneous Democrats -0.020** (0.009) Auth X %Homogeneous Republicans 0.001 (0.01)
Auth X Liberal Democrats 0.107** (0.031) Auth X Conservative Republicans 0.028* (0.016)
Percentage Republican Senators 0.078 (0.018) Ideology 0.63 (0.011) 0.647 (0.011)
Age -0.001 (0.000) -0.001 (0.000) Gender 0.024 (0.004) 0.019 (0.004)
Education 0.086 (0.008) 0.087 (0.007) City Type -0.016 (0.007) -0.019 (0.007)
Fundamentalist Christian 0.013 (0.005) Church Attendance 0.034 (0.006)
South Region -0.009 (0.007) 0.004 (0.009) New England Region 0.009 (0.008) 0.007 (0.009)
Policy Mood 0.004 (0.001) 0.001 (0.001) Presidential Party -0.014 (0.007) 0.00 (0.007)
Random Effects Intercept 0.026 0.026
Authoritarianism 0.013 0.014 Residual 0.303 0.302
N (obs) 22046 22920 N (year by region cluster) 200 200 Deviance 10001.3 10304.2
** where p < .05, and * where p < 0.1 on a two-tailed test
37
Table A2. The Effects of Authoritarianism on Party ID – Voters and Youth Cohort (1973-2012) (1) (2) Fixed Effects
White Protestant Voters
White Protestants Under 25
Intercept -0.262 (0.107) -0.114 (0.233) Authoritarianism (standardized) -0.015 (0.027) -0.006 (0.057)
%Homogeneous Democrats -0.020 (0.020) -0.057 (0.046) %Homogeneous Republicans 0.050** (0.020) 0.072 (0.044)
Liberal Democrats 0.391** (0.071) 0.174 (0.142) Conservative Republicans 0.088** (0.042) 0.190 (0.093)
Auth X %Homogeneous Democrats -0.037** (0.019) 0.008 (0.043) Auth X %Homogeneous Republicans 0.021 (0.017) 0.041 (0.040)
Auth X Liberal Democrats 0.071 (0.058) -0.093 (0.120) Auth X Conservative Republicans 0.019 (0.028) 0.035 (0.065)
Percentage Republican Senators 0.112 (0.027) -0.012 (0.060) Ideology 0.774 (0.019) 0.414 (0.046)
Age -0.001 (0.000) Gender 0.015 (0.007) 0.029 (0.016)
Education 0.092 (0.013) 0.110 (0.041) City Type 0.028 (0.011) 0.015 (0.025)
Fundamentalist Christian -0.033 (0.007) -0.009 (0.018) Church Attendance 0.050 (0.011) 0.090 (0.028)
South Region 0.003 (0.013) 0.015 (0.027) New England Region 0.092 (0.017) 0.061 (0.041)
Policy Mood 0.002 (0.002) 0.001 (0.004) Presidential Party 0.010 (0.012) 0.011 (0.026)
Random Effects Intercept 0.022 0.000
Authoritarianism 0.015 0.000 Residual 0.314 0.287
N (obs) 8250 1258 N (year by region cluster) 191 190 Deviance 4297.8 408.8
** where p < .05 on a two-tailed test