Embed Size (px)
Citation preview

Author Page

Fundamentals of Oil and Gas Processing
Fundamentals Of Oil
And Gas Processing
Sizing and Operation of Crude Oil Treatment Facilities
Book Site
By
Yasser Kassem
Second eddition
Book Site
Fundamentals of Oil and Gas Processing
3 By: Yasser Kassem ([email protected])
Preface This book is written mainly for engineering staff working in oil and gas industry and are interested in both theoretical and technical aspects regarding oil and gas processing. The book was prepared by a summarized combination of the most proper books in oil and gas processing with excessive illustration and explanation. The basics of the book is GPSA Engineering Data Book, Surface Production Facilities, Surface Petroleum Operations book, John-Cample technical books, API reference standards, and others. All tables and graphs were collected from API, GPSA, Surface Production Facilities, and. The book was prepared using many other references. The book are focused on the practical aspects of oil and gas processing that is valuable for engineers and technical staff, omitting parts and details that will never be used. We gratefully acknowledge our indebtedness to many individuals and organizations for their help and support in providing data and information.
Yasser Kassem [email protected]
Second eddition
27th Jan.2019
Book Site
https://www.amazon.com/Yasser-
Kassem/e/B07KXLM5RZ?ref=dbs_p_pb
k_r00_abau_000000

Fundamentals of Oil and Gas Processing

Fundamentals of Oil and Gas Processing
5 By: Yasser Kassem ([email protected])
Contents Chapter 1 ...................................................................................................................... 12
Basics of Oil and Gas Treatment .................................................................................. 12
1.1 Introduction ....................................................................................................................................... 12
1.2 Hydrocarbon preparation .................................................................................................................. 12
1.3: Physical properties of Hydrocarbon Gases ...................................................................................... 13
1.3.1: Hydrocarbon gases ................................................................................................................... 13
1.3.2: Molecular weight and apparent molecular weight ..................................................................... 14
1.3.3: Apparent molecular weight of gas mixture ................................................................................ 15
1.3.4: Gas Specific Gravity and Density ............................................................................................. 15
1.3.6: Compressibility Factor (z) ......................................................................................................... 17
1.3.7: Gas density at any condition of Pressure and temperature ...................................................... 20
1.3.8: Gas volume at any condition of Pressure and temperature ...................................................... 21
1.3.9: Velocity of gas, (ft/s) .................................................................................................................. 23
1.3.10: Average pipeline pressure ...................................................................................................... 24
1.3.11: Viscosity of gases ................................................................................................................... 25
1.3.12: The heating value of gases ..................................................................................................... 25
1.4: properties of Hydrocarbon Liquids (Crude Oil) ................................................................................ 27
1.4.1: Introduction ............................................................................................................................... 27
1.4.2: Crude oil Density and gravity .................................................................................................... 27
1.4.3: Crude oil Viscosity. .................................................................................................................... 28
1.4.4: Oil-Water Mixture Viscosity ....................................................................................................... 29
1.5: Phase Behavior ................................................................................................................................ 30
1.5.1: Introduction ............................................................................................................................... 30
1.5.2 System Components .................................................................................................................. 30
1.5.3: Single-Component Systems ..................................................................................................... 31
1.5.4: Multicomponent Systems .......................................................................................................... 34
1.5.5: Prediction of phase envelope ........................................................................................................ 35
1.6: Types of Fluid Flow .......................................................................................................................... 45
1.6.1: Reynolds Number ..................................................................................................................... 45
Chapter 2 ...................................................................................................................... 46
Two-phase Oil and Gas Separation .............................................................................. 46
2.1 Introduction ....................................................................................................................................... 46
2.2 Phase Equilibrium ............................................................................................................................. 46
2.3: Separation process: ......................................................................................................................... 47

Fundamentals of Oil and Gas Processing
2.4: Principles of Physical Separation: .................................................................................................... 47
2.5: Gravity Separation: .......................................................................................................................... 47
2.6: Factors Affecting Separation .............................................................. Error! Bookmark not defined.
2.7: Separator categories and nomenclature: ........................................... Error! Bookmark not defined.
2.8: Functional Sections of a Gas-Liquid Separator ................................. Error! Bookmark not defined.
2.8.1: Inlet Diverter Section ................................................................... Error! Bookmark not defined.
2.8.2: Liquid Collection Section ............................................................. Error! Bookmark not defined.
2.8.3: Gravity Settling Section ............................................................... Error! Bookmark not defined.
2.8.4: Mist Extractor Section ................................................................. Error! Bookmark not defined.
2.9: Separator Configurations ................................................................... Error! Bookmark not defined.
2.10: Types of Separators ......................................................................... Error! Bookmark not defined.
2.10.1: Vertical Separators .................................................................... Error! Bookmark not defined.
2.10.2: Horizontal Separators ............................................................... Error! Bookmark not defined.
2.10.3: Double-Barrel Horizontal Separators ........................................ Error! Bookmark not defined.
2.10.4: Horizontal Separator with a “Boot” or “Water Pot” .................... Error! Bookmark not defined.
2.10.5: Filter Separators ........................................................................ Error! Bookmark not defined.
2.10.6: Scrubbers .................................................................................. Error! Bookmark not defined.
2.10.7: Slug Catchers ............................................................................ Error! Bookmark not defined.
2.11: Selection Considerations ................................................................. Error! Bookmark not defined.
2.12: Internal Vessel Components ............................................................ Error! Bookmark not defined.
2.12.1: Inlet Diverters ............................................................................ Error! Bookmark not defined.
2.12.2: Wave Breakers .......................................................................... Error! Bookmark not defined.
2.12.3: Defoaming Plates ...................................................................... Error! Bookmark not defined.
2.12.4: Vortex Breaker .......................................................................... Error! Bookmark not defined.
2.12.5: Stilling Well ................................................................................ Error! Bookmark not defined.
2.12.6: Sand Jets and Drains ................................................................ Error! Bookmark not defined.
2.12.7: Mist Extractors .......................................................................... Error! Bookmark not defined.
2.13: Control Components of Gas–Oil Separators ................................... Error! Bookmark not defined.
2.14.1: Foamy Crude ............................................................................ Error! Bookmark not defined.
2.14.2: Paraffin ...................................................................................... Error! Bookmark not defined.
2.14.3: Sand .......................................................................................... Error! Bookmark not defined.
2.14.4: Gas Blowby ............................................................................... Error! Bookmark not defined.
2.14.5: Liquid Carryover ........................................................................ Error! Bookmark not defined.
2.14.6: Liquid Slugs ............................................................................... Error! Bookmark not defined.
2.15: Stage Separation ............................................................................. Error! Bookmark not defined.
2.15.1: Initial Separation Pressure ........................................................ Error! Bookmark not defined.
2.15.2: Stage Separation ...................................................................... Error! Bookmark not defined.

Fundamentals of Oil and Gas Processing
7 By: Yasser Kassem ([email protected])
2.15.3: Selection of Stages ................................................................... Error! Bookmark not defined.
2.15.4: Fields with Different Flowing Tubing Pressures ........................ Error! Bookmark not defined.
2.15.5: Determining Separator Operating Pressures ............................ Error! Bookmark not defined.
2.15.6: Two-Phase vs. Three-Phase Separators .................................. Error! Bookmark not defined.
2.16: Separator calculation basics. ........................................................... Error! Bookmark not defined.
2.16.1: Liquid Handling and Liquid Retention Time .............................. Error! Bookmark not defined.
2.16.2: Gas retention time ..................................................................... Error! Bookmark not defined.
2.16.3: Gas velocity ............................................................................... Error! Bookmark not defined.
2.16.4: Liquid Re-entrainment ............................................................... Error! Bookmark not defined.
2.16.5: Droplet Size (Liquid in gas phase) ........................................... Error! Bookmark not defined.
2.17: Design Principles and sizing of Oil-gas Separator ........................... Error! Bookmark not defined.
2.17.1: First method Design Theory ...................................................... Error! Bookmark not defined.
2.17.1.12: Slenderness Ratio ................................................................ Error! Bookmark not defined.
2.17.2: Second method Design Theory ................................................ Error! Bookmark not defined.
Chapter 3 ........................................................................ Error! Bookmark not defined.
Three-phase Oil and Gas Separation .............................. Error! Bookmark not defined.
3.1: Introduction ........................................................................................ Error! Bookmark not defined.
3.2: three phase separation equipment’s .................................................. Error! Bookmark not defined.
3.2.1: Horizontal Separators ................................................................. Error! Bookmark not defined.
3.2.2: Free-Water Knockout .................................................................. Error! Bookmark not defined.
3.2.3: Horizontal Three-Phase Separator with a Liquid “Boot” ............. Error! Bookmark not defined.
3.2.4: Vertical Separators ...................................................................... Error! Bookmark not defined.
3.2.5: Selection Considerations ............................................................ Error! Bookmark not defined.
3.3: Internal Vessel components ............................................................... Error! Bookmark not defined.
3.3.1: Coalescing Plates ....................................................................... Error! Bookmark not defined.
3.4: Operating Problems ........................................................................... Error! Bookmark not defined.
3.4.1: Emulsions .................................................................................... Error! Bookmark not defined.
3.5: Three-Phase Separator Design Theory ............................................. Error! Bookmark not defined.
3.5.1: Gas Separation ........................................................................... Error! Bookmark not defined.
3.5.2: Oil–Water Settling ....................................................................... Error! Bookmark not defined.
3.5.3: Water Droplet Size in Oil ............................................................. Error! Bookmark not defined.
3.5.4: Oil Droplet Size in Water ............................................................. Error! Bookmark not defined.
3.5.5: Retention Time ............................................................................ Error! Bookmark not defined.
3.6: Separator Design (first method) ......................................................... Error! Bookmark not defined.
3.6.1: Horizontal Three-phase Separator Sizing—Half-Full .................. Error! Bookmark not defined.
3.6.1.2: Retention Time Constraint ....................................................... Error! Bookmark not defined.
3.6.1.3: Settling Water Droplets from Oil Phase ................................... Error! Bookmark not defined.
Fundamentals of Oil and Gas Processing
3.6.1.4: Separating Oil Droplets from Water Phase .............................. Error! Bookmark not defined.
3.6.2: Vertical Separators’ Sizing .......................................................... Error! Bookmark not defined.
3.6.2.1: Gas Capacity Constraint .......................................................... Error! Bookmark not defined.
3.6.2.3: Settling Oil from Water Phase Constraint ................................ Error! Bookmark not defined.
3.7: Separator Design (second method) ................................................... Error! Bookmark not defined.
Chapter 4 ........................................................................ Error! Bookmark not defined.
Crude oil dehydration ...................................................... Error! Bookmark not defined.
4.1: Introduction ........................................................................................ Error! Bookmark not defined.
4.2: Emulsion ............................................................................................ Error! Bookmark not defined.
4.2.1 Energy of Agitation ....................................................................... Error! Bookmark not defined.
4.2.2 Emulsifying Agents ....................................................................... Error! Bookmark not defined.
4.2.3: Stability of oil water emulsion ...................................................... Error! Bookmark not defined.
4.2.4: Emulsion Treating Theory ........................................................... Error! Bookmark not defined.
4.2.5: Demulsifiers ................................................................................ Error! Bookmark not defined.
4.3: Crude oil treating systems.................................................................. Error! Bookmark not defined.
4.3.1: Free-Water Knockouts ................................................................ Error! Bookmark not defined.
4.3.2: Gunbarrel tanks with internal and external gas boots ................. Error! Bookmark not defined.
4.3.3: Heaters ........................................................................................ Error! Bookmark not defined.
4.4: Emulsion Treating Methods ............................................................... Error! Bookmark not defined.
4.4.1: General Considerations .............................................................. Error! Bookmark not defined.
4.4.2: Chemical Addition ....................................................................... Error! Bookmark not defined.
4.5: Heat Required .................................................................................... Error! Bookmark not defined.
4.5.1: Heat duty ..................................................................................... Error! Bookmark not defined.
4.5.2: Heat Loss .................................................................................... Error! Bookmark not defined.
4.5.3: Fire Tube Heat Flux .................................................................... Error! Bookmark not defined.
4.5.4: Firetube Heat Density ................................................................. Error! Bookmark not defined.
4.6: Treater Equipment Sizing ................................................................... Error! Bookmark not defined.
4.6.2: Design Procedure ....................................................................... Error! Bookmark not defined.
4.7: Practical Considerations .................................................................... Error! Bookmark not defined.
4.7.1: Gunbarrels with Internal/External Gas Boot................................ Error! Bookmark not defined.
4.7.2: Heater-Treaters ........................................................................... Error! Bookmark not defined.
4.7.3: Electrostatic Heater-Treaters ...................................................... Error! Bookmark not defined.
Chapter 5 ........................................................................ Error! Bookmark not defined.
Crude Oil Desalting ......................................................... Error! Bookmark not defined.
5.1: Introduction ........................................................................................ Error! Bookmark not defined.
5.1.1: Salt Content ................................................................................ Error! Bookmark not defined.

Fundamentals of Oil and Gas Processing
9 By: Yasser Kassem ([email protected])
5.1.2: Desalting Process ....................................................................... Error! Bookmark not defined.
5.2: Equipment Description ....................................................................... Error! Bookmark not defined.
5.2.1: Desalters ..................................................................................... Error! Bookmark not defined.
5.2.2: Mixing Equipment ........................................................................ Error! Bookmark not defined.
5.3: Process Description ........................................................................... Error! Bookmark not defined.
5.3.1: Single-Stage Desalting ................................................................ Error! Bookmark not defined.
5.3.2: Two-Stage Desalting ................................................................... Error! Bookmark not defined.
5.4: Electrostatic Desalting Voltage .......................................................... Error! Bookmark not defined.
5.5: Dilution Water Requirement ............................................................... Error! Bookmark not defined.
5.6: Operating Parameters Effects ............................................................ Error! Bookmark not defined.
5.7: Design Consideration ......................................................................... Error! Bookmark not defined.
5.8: Troubleshooting ................................................................................. Error! Bookmark not defined.
Chapter 6 ........................................................................ Error! Bookmark not defined.
Crude Oil Stabilization and Sweetening .......................... Error! Bookmark not defined.
6.1: Introduction ........................................................................................ Error! Bookmark not defined.
6-1-1: Crude oil treatment steps............................................................ Error! Bookmark not defined.
6.2: Process Schemes .............................................................................. Error! Bookmark not defined.
6.2.1: Multi-Stage Separation ................................................................ Error! Bookmark not defined.
6.2.2: Oil Heater-Treaters ..................................................................... Error! Bookmark not defined.
6.2.3: Liquid Hydrocarbon Stabilizer ..................................................... Error! Bookmark not defined.
6.2.4: Cold-Feed Stabilizer .................................................................... Error! Bookmark not defined.
6.2.5: Stabilizer with Reflux ................................................................... Error! Bookmark not defined.
6.3: Stabilization Equipment ...................................................................... Error! Bookmark not defined.
6.3.1: Stabilizer Tower .......................................................................... Error! Bookmark not defined.
6.4: Stabilizer Design ................................................................................ Error! Bookmark not defined.
6.5: Crude Oil Sweetening ........................................................................ Error! Bookmark not defined.
6.6.1: Stage vaporization with stripping gas. ........................................ Error! Bookmark not defined.
6.6.2: Trayed stabilization with stripping gas. ....................................... Error! Bookmark not defined.
6.6.3: Reboiled trayed stabilization. ...................................................... Error! Bookmark not defined.
Chapter 7 ........................................................................ Error! Bookmark not defined.
Fluid Measurements ........................................................ Error! Bookmark not defined.
7.1: Gas Measurement .............................................................................. Error! Bookmark not defined.
7.1.1: Orifice-Meter Measurement ........................................................ Error! Bookmark not defined.
7.1.1.5: Meter Tubes ............................................................................. Error! Bookmark not defined.
7.1.2: Ultrasonic Measurement ............................................................. Error! Bookmark not defined.
7.2: Liquid Measurements ......................................................................... Error! Bookmark not defined.

Fundamentals of Oil and Gas Processing
7.2.1: Volumetric Measurement Meters (Orifice Meters) ...................... Error! Bookmark not defined.
7.2.2: Turbine Meters ............................................................................ Error! Bookmark not defined.
7.2.3: Positive Displacement Meters ..................................................... Error! Bookmark not defined.
7.2.4: Turbine and Positive Displacement Meter Selection .................. Error! Bookmark not defined.
7.2.5: Mass Measurement Meters ........................................................ Error! Bookmark not defined.
Chapter 8 ........................................................................ Error! Bookmark not defined.
Instrumentation and Control ............................................ Error! Bookmark not defined.
8.1: Introduction ........................................................................................ Error! Bookmark not defined.
8.2: Type Selection and Identification ....................................................... Error! Bookmark not defined.
8.2.1: Pneumatic Power Supplies ......................................................... Error! Bookmark not defined.
8.2.2: Electronic Power Supplies .......................................................... Error! Bookmark not defined.
8.3: Sensing Devices ................................................................................ Error! Bookmark not defined.
8.3.1: Pressure Sensors ........................................................................ Error! Bookmark not defined.
8.3.1.3: Bellows (Fig. 8-3) ..................................................................... Error! Bookmark not defined.
8.3.2: Level Sensors ............................................................................. Error! Bookmark not defined.
8.3.3: Temperature Sensors ................................................................. Error! Bookmark not defined.
8.3.4: Flow Sensors .............................................................................. Error! Bookmark not defined.
8.4: Signal Transmitters ............................................................................ Error! Bookmark not defined.
8.4.1: Pneumatic Transmitters .............................................................. Error! Bookmark not defined.
8.4.2: Electronic Transmitters ............................................................... Error! Bookmark not defined.
8.5: Signal Converters ............................................................................... Error! Bookmark not defined.
8.5.1: Pneumatic-to-electronic (P/I) ...................................................... Error! Bookmark not defined.
8.5.2: Electronic-to-pneumatic (I/P) ...................................................... Error! Bookmark not defined.
8.5.3: Isolators ....................................................................................... Error! Bookmark not defined.
8.5.4: Electric signal converters ............................................................ Error! Bookmark not defined.
8.5.5: Frequency converters ................................................................. Error! Bookmark not defined.
8.6: Recorders and Indicators ................................................................... Error! Bookmark not defined.
8.6.1: Recorders .................................................................................... Error! Bookmark not defined.
8.6.2: Indicators ..................................................................................... Error! Bookmark not defined.
8.7: Control Concepts ............................................................................... Error! Bookmark not defined.
8.7.1: Control Loops .............................................................................. Error! Bookmark not defined.
8.8: Control Modes and Controllers .......................................................... Error! Bookmark not defined.
8.8.1: Two-Position (on-off) Controllers ................................................ Error! Bookmark not defined.
8.8.2: Proportional Control Mode .......................................................... Error! Bookmark not defined.
8.9: Control Valves .................................................................................... Error! Bookmark not defined.
8.9.1: Control-Valve Bodies .................................................................. Error! Bookmark not defined.
8.9.2: Control-Valve Actuators .............................................................. Error! Bookmark not defined.
Fundamentals of Oil and Gas Processing
11 By: Yasser Kassem ([email protected])
8.9.3: Flow Characteristics and Valve Selection ................................... Error! Bookmark not defined.
8.9.4: Fundamentals of Control Valve Sizing ........................................ Error! Bookmark not defined.
Chapter 9 ........................................................................ Error! Bookmark not defined.
Process Relief Systems .................................................. Error! Bookmark not defined.
9.1: Introduction ........................................................................................ Error! Bookmark not defined.
9.2: Relief Device Design and Requirements: .......................................... Error! Bookmark not defined.
9.2.1: Blocked Discharge ...................................................................... Error! Bookmark not defined.
9.2.2: Fire Exposure .............................................................................. Error! Bookmark not defined.
9.2.3: Tube Rupture .............................................................................. Error! Bookmark not defined.
9.2.4: Control Valve Failure ................................................................... Error! Bookmark not defined.
9.2.5: Thermal Expansion ..................................................................... Error! Bookmark not defined.
9.2.6: Utility Failure ............................................................................... Error! Bookmark not defined.
9.3: General discussion ............................................................................. Error! Bookmark not defined.
9.4: Special Relief System Considerations ............................................... Error! Bookmark not defined.
9.4.1: Pumps and storage equipment ................................................... Error! Bookmark not defined.
9.4.2: Low Temperature Flaring ............................................................ Error! Bookmark not defined.
9.5: Relieving Devices ............................................................................... Error! Bookmark not defined.
9.5.1: Conventional Relief Valves ......................................................... Error! Bookmark not defined.
9.5.2: Balanced Relief Valves ............................................................... Error! Bookmark not defined.
9.5.3: Pilot Operated Relief Valves ....................................................... Error! Bookmark not defined.
9.5 .4: Resilient Seat Relief Valves ........................................................ Error! Bookmark not defined.
9.5.5: Rupture Disk ............................................................................... Error! Bookmark not defined.
References. ................................................................................................................... 50
Book Site

Fundamentals of Oil and Gas Processing
Chapter 1
Book Site
Basics of Oil and Gas Treatment
1.1 Introduction
Oil and gas wells produce a mixture of hydrocarbon gas, condensate or oil, salt water, other gases,
including nitrogen, carbon dioxide (CO2), and possibly hydrogen sulfide (H2S), and solids, including sand
from the reservoir, dirt, scale, and corrosion products from the tubing.
These mixtures are very difficult to handle, meter, or transport. In addition to the difficulty, it is also unsafe
and uneconomical to ship or to transport these mixtures to refineries and gas plants for processing.
Further, hydrocarbon shipping tankers, oil refineries, and gas plants require certain specifications for the
fluids that each receive. Also, environmental constraints exist for the safe and acceptable handling of
hydrocarbon fluids and disposal of produced salt water. It is therefore necessary to process the produced
fluids in the field to yield products that meet the specifications set by the customer and are safe to handle.
1.2 Hydrocarbon preparation
The goal is to produce oil that meets the purchaser’s specifications that define the maximum allowable
amounts of water, salt, and sulfur. In addition to the maximum allowable value of Reid vapor pressure and
maximum allowable pour point temperature.
Similarly, the gas must be processed to meet purchaser’s water vapor maximum allowable content (Water
dew point), hydrocarbon dew point specifications to limit condensation during transportation, in addition to
the maximum allowable content of CO2, H2S, O2, Total Sulfur, Mercaptan, Mercury, and maximum gross
heating value.
The produced water must meet the regulatory requirements for disposal in the ocean if the wells are
offshore, or to meet reservoir requirements for injection into an underground reservoir to avoid plugging
the reservoir.
The specifications for the above requirements may include maximum oil in water content, total suspended
solids to avoid formation plugging, bacteria counts, toxicity in case of offshore disposal, and oxygen
content. Before discussing the industry or the technology of oil and gas processing it is best to define the
characteristic, physical properties and main chemical composition of oil and gas produced.
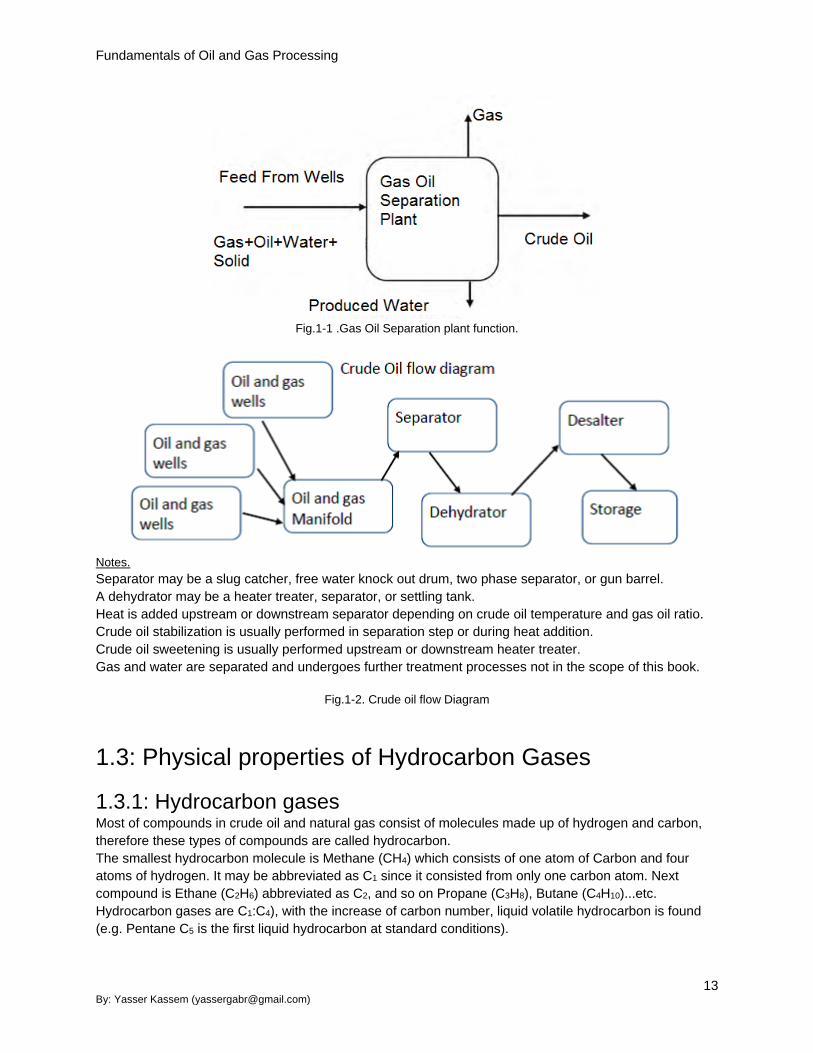
Figures 1-1 and 1-2, illustrates gas-oil separation plant, and oil flow diagram.
Fundamentals of Oil and Gas Processing
13 By: Yasser Kassem ([email protected])
Fig.1-1 .Gas Oil Separation plant function.
Notes.
Separator may be a slug catcher, free water knock out drum, two phase separator, or gun barrel.
A dehydrator may be a heater treater, separator, or settling tank.
Heat is added upstream or downstream separator depending on crude oil temperature and gas oil ratio.
Crude oil stabilization is usually performed in separation step or during heat addition.
Crude oil sweetening is usually performed upstream or downstream heater treater.
Gas and water are separated and undergoes further treatment processes not in the scope of this book.
Fig.1-2. Crude oil flow Diagram
1.3: Physical properties of Hydrocarbon Gases
1.3.1: Hydrocarbon gases Most of compounds in crude oil and natural gas consist of molecules made up of hydrogen and carbon,
therefore these types of compounds are called hydrocarbon.
The smallest hydrocarbon molecule is Methane (CH4) which consists of one atom of Carbon and four
atoms of hydrogen. It may be abbreviated as C1 since it consisted from only one carbon atom. Next
compound is Ethane (C2H6) abbreviated as C2, and so on Propane (C3H8), Butane (C4H10)...etc.
Hydrocarbon gases are C1:C4), with the increase of carbon number, liquid volatile hydrocarbon is found
(e.g. Pentane C5 is the first liquid hydrocarbon at standard conditions).

Fundamentals of Oil and Gas Processing
1.3.2: Molecular weight and apparent molecular weight The molecular weight of a compound is the sum of the atomic weight of the various atoms making up that
compound. The Mole is the unit of measurements for the amount of substance, the number of moles is
defined as follows:
Mole = Weight
Molecular weight (Eq. 1-1)
Expressed as n = m
M (Eq. 1-2)
or, in units as, lb-mole = lb
lb/lb−mole (Eq. 1-3)
Compound Formula Molecular
weight
Boiling Point 0F @ 14.7
psia
Relative
Density of gas
(air=1)
Gross
Calorific value
Btu/ft3 @ 60 0F
Critical
Temp. 0R
Critical
pressure.
Psia
Methane CH4 16.043 -259 0.5539 1016.0 343.0 666
Ethane C2 H6 30.070 -128 1.0382 1769.6 549.6 706.6
Propane C3 H8 44.097 -44 1.5225 2516.1 665.6 615.5
i-Butane C4 H10 58.124 10.8 2.0068 3251.9 734.5 527.9
n-Butane C4 H10 58.124 31.1 2.0068 3262.3 765.2 550.9
i-Pentane C5 H12 72.151 82.1 2.4911 4000.9 829.1 490.4
n-Pentane C5 H12 72.151 97 2.4911 4008.9 845.5 488.8
n-Hexane C6 H14 86.178 156 2.9755 4755.9 895.5 436.6
n-Heptane C7 H16 100.205 209 3.4598 5502.5 972.6 396.8
n-Octane C8 H18 114.232 258 3.9441 6248.9 1023.9 360.7
n-Nonane C9 H20 128.259 303 4.4284 6996.5 1070.5 330.7
Carbon
dioxide
CO2 44.01 -109.1 1.5197 0 547.4 1070.0
Hydrogen
sulfide
H2S 34.082 -67.5 1.1769 637.1 772.5 1306.5
Oxygen O2 32 -297 1.1050 0 278.2 731.4
Nitrogen N2 28.01 -320.4 0.9674 0 227.1 492.5
Hydrogen H2 2.0159 -423 0.0696 324.2 59.8 190.7
Air 28.96 -317.6 1.0000 0 238.7 551.9
Water H2O 18.015 211.95 0.6221 - 1164.8 3200.1
Table 1-1 Physical constants of light hydrocarbons and some inorganic gases. Adapted from GPSA, Engineering Hand Book.
Example 1.1: Methane molecule consists of one carbon atom with atomic weight =12 and 4 hydrogen
atoms with atomic weight = 1 each. Molecular weight for Methane (CH4) = (1 × 12) + (4 × 1) = 16 lb/lb-
mole. Similarly, Ethane (C2H6) molecular weight = (2 × 12) + (6 × 1) = 30 lb/lb-mole.
Hydrocarbon up to four carbon atoms are gases at room temperature and atmospheric pressure.
Reducing the gas temperature and/or increasing the pressure will condense the hydrocarbon gas to a
liquid phase. By the increase of carbon atoms in hydrocarbon molecules, consequently the increase in
molecular weight, the boiling point increases and a solid hydrocarbon is found at high molecular weight.
Physical constants of light hydrocarbon and some inorganic gases are listed in Table 1-1.
Fundamentals of Oil and Gas Processing
15 By: Yasser Kassem ([email protected])
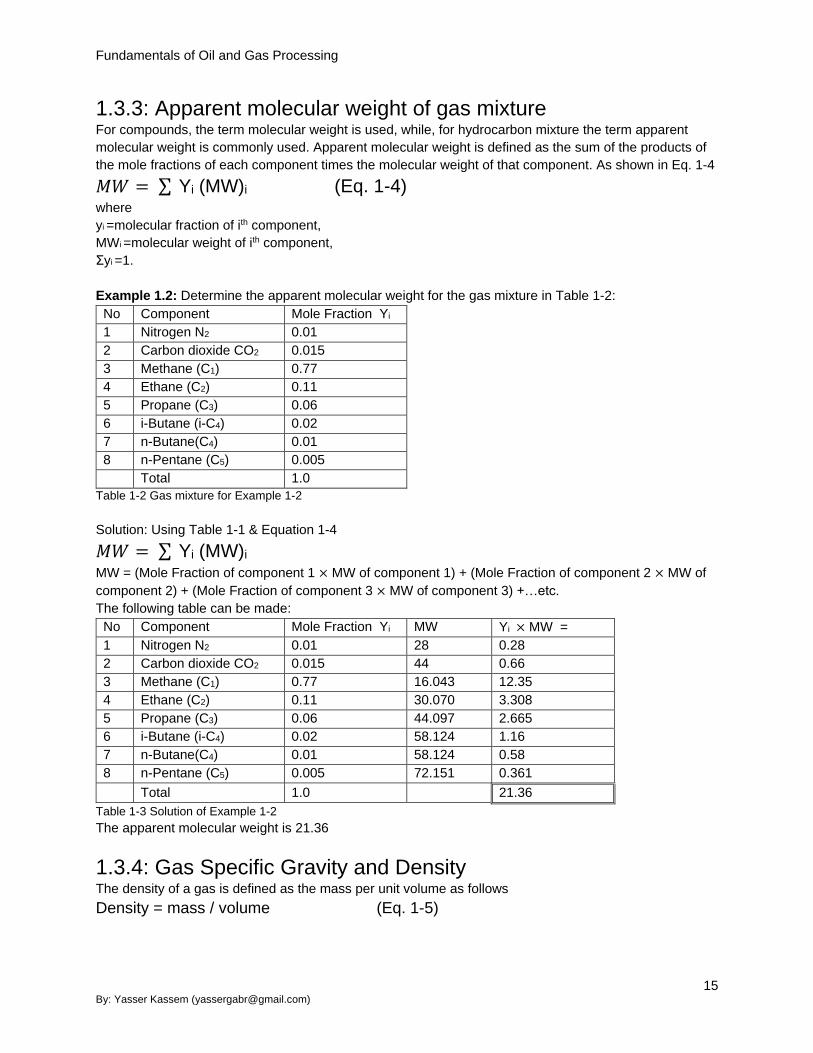
1.3.3: Apparent molecular weight of gas mixture For compounds, the term molecular weight is used, while, for hydrocarbon mixture the term apparent
molecular weight is commonly used. Apparent molecular weight is defined as the sum of the products of
the mole fractions of each component times the molecular weight of that component. As shown in Eq. 1-4
𝑀𝑊 = ∑ Yi (MW)i (Eq. 1-4) where
yi =molecular fraction of ith component,
MWi =molecular weight of ith component,
Ʃyi =1.
Example 1.2: Determine the apparent molecular weight for the gas mixture in Table 1-2:
No Component Mole Fraction Yi
1 Nitrogen N2 0.01
2 Carbon dioxide CO2 0.015
3 Methane (C1) 0.77
4 Ethane (C2) 0.11
5 Propane (C3) 0.06
6 i-Butane (i-C4) 0.02
7 n-Butane(C4) 0.01
8 n-Pentane (C5) 0.005
Total 1.0
Table 1-2 Gas mixture for Example 1-2
Solution: Using Table 1-1 & Equation 1-4
𝑀𝑊 = ∑ Yi (MW)i MW = (Mole Fraction of component 1 × MW of component 1) + (Mole Fraction of component 2 × MW of
component 2) + (Mole Fraction of component 3 × MW of component 3) +…etc.
The following table can be made:
No Component Mole Fraction Yi MW Yi × MW =
1 Nitrogen N2 0.01 28 0.28
2 Carbon dioxide CO2 0.015 44 0.66
3 Methane (C1) 0.77 16.043 12.35
4 Ethane (C2) 0.11 30.070 3.308
5 Propane (C3) 0.06 44.097 2.665
6 i-Butane (i-C4) 0.02 58.124 1.16
7 n-Butane(C4) 0.01 58.124 0.58
8 n-Pentane (C5) 0.005 72.151 0.361
Total 1.0 21.36
Table 1-3 Solution of Example 1-2
The apparent molecular weight is 21.36
1.3.4: Gas Specific Gravity and Density The density of a gas is defined as the mass per unit volume as follows
Density = mass / volume (Eq. 1-5)

Fundamentals of Oil and Gas Processing
The specific gravity of a gas is the ratio of the density of the gas to the density of air at standard
conditions of temperature and pressure.
S = ρ(gas)
ρ(air) (Eq. 1-6)
Where
ρ(gas) ρg = density of gas
ρ(air) ρair = density of air
Both densities must be computed at the same pressure and temperature, usually at standard conditions.
It may be related to the molecular weight by Equation 1-7
S = MW(gas)
MW(air) (Eq. 1-7)
Since molecular weight of air is 28.96 (table 1-1)
Specific gravity of gas S = MW(gas)
28.96 (Eq. 1-8)
Example 1-3: Determine the specific gravity of the gas mixture in example 1-2.
Solution:
Apparent molecular weight of gas mixture is 21.36
Gas specific gravity = 21.36/28.96 = 0.7376
Since the gas is a compressible fluid, its density varies with temperature and pressure, calculating the
gas density at a certain pressure and temperature will be explained after discussing the general gas law
and gas compressibility factor.
1.3.5: General Gas Law
The general (Ideal) Gas equation, or the Perfect Gas Equation, is stated as follows:
PV = nRT (Eq. 1-9)
Where
P = gas pressure, psia
V = gas volume, ft3
n = number of lb moles of gas (mass/molecular weight)
R = universal gas constant, psia ft3/lb mole OR
T = gas temperature, OR (OR = 460 + OF)
The universal gas constant R is equal to 10.73 psia ft3/lb mole OR in field units.
Equation (1-9) is valid up to pressures of about 60 psia. As pressure increases above this level, its
Fundamentals of Oil and Gas Processing
17 By: Yasser Kassem ([email protected])
accuracy becomes less and the system should be considered a non-ideal gas equation of state.
PV = znRT (Eq. 1-10)
Where
z = gas compressibility factor.
1.3.6: Compressibility Factor (z) The Compressibility factor, Z is a dimensionless parameter less than 1.00 that represents the deviation of
a real gas from an ideal gas. Hence it is also referred to as the gas deviation factor. At low pressures and
temperatures Z is nearly equal to 1.00 whereas at higher pressures and temperatures it may range
between 0.75 and 0.90. The actual value of Z at any temperature and pressure must be calculated taking
into account the composition of the gas and its critical temperature and pressure. Several graphical and
analytical methods are available to calculate Z. Among these, the Standing-Katz, and CNGA methods are
quite popular. The critical temperature and the critical pressure of a gas are important parameters that
affect the compressibility factor and are defined as follows.
The critical temperature of a pure gas is that temperature above which the gas cannot be compressed
into a liquid, however much the pressure. The critical pressure is the minimum pressure required at the
critical temperature of the gas to compress it into a liquid.
As an example, consider pure methane gas with a critical temperature of 343 0R and critical pressure of
666 psia (Table 1-1).
The reduced temperature of a gas is defined as the ratio of the gas temperature to its critical temperature,
both being expressed in absolute units (0R). It is therefore a dimensionless number.
Similarly, the reduced pressure is a dimensionless number defined as the ratio of the absolute pressure
of gas to its critical pressure.
Therefore we can state the following:
Tr = T/Tc (Eq. 1-11)
Pr = P/Pc (Eq. 1-12)
Where
P = pressure of gas, psia
T = temperature of gas, 0R
Tr = reduced temperature, dimensionless
Pr = reduced pressure, dimensionless
Tc = critical temperature, 0R
Pc = critical pressure, psia
Example1-4: Using the preceding equations, the reduced temperature and reduced pressure of a sample
of methane gas at 70 0F and 1200 psia pressure can be calculated as follows
Tr = (70 +460) / 343 =1.5
Pr = 1200/666 = 1.8
For natural gas mixtures, the terms pseudo-critical temperature and pseudo-critical pressure are used.
The calculation methodology will be explained shortly. Similarly we can calculate the pseudo-reduced
Fundamentals of Oil and Gas Processing
temperature and pseudo-reduced pressure of a natural gas mixture, knowing its pseudo-critical
temperature and pseudo-critical pressure.
The Standing-Katz chart, Fig. 1.3 can be used to determine the compressibility factor of a gas at any
temperature and pressure, once the reduced pressure and temperature are calculated knowing the
critical properties.
Pseudo-critical properties allow one to evaluate gas mixtures. Equations (1-13) and (1-14) can be used to
calculate the pseudo-critical properties for gas mixtures:
P’c = Ʃ yi Pci (Eq. 1-13)
T’c = Ʃ yi Tci (Eq. 1-14)
where
P’c =pseudo-critical pressure,
T’c =pseudo-critical temperature,
Pci =critical pressure at component i, psia
Tci =critical temperature at component i, 0R
Yi =mole fraction of each component in the mixture,
Ʃ yi =1.
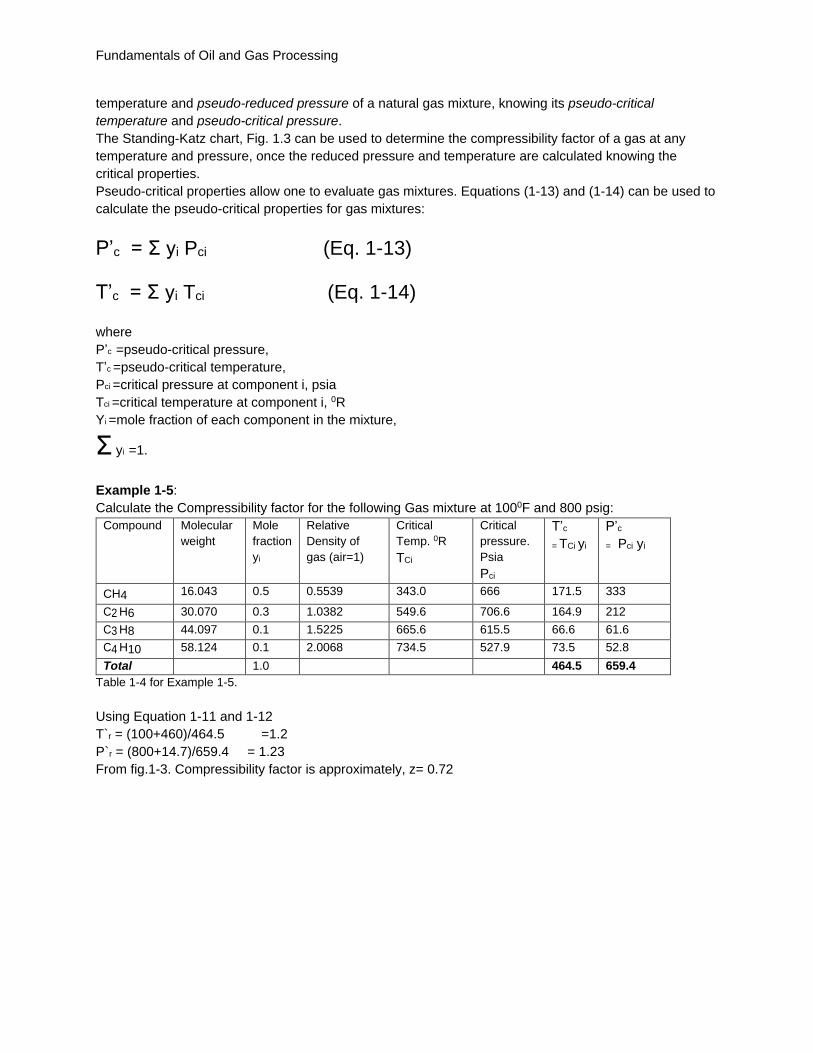
Example 1-5:
Calculate the Compressibility factor for the following Gas mixture at 1000F and 800 psig:
Compound Molecular
weight
Mole
fraction
yi
Relative
Density of
gas (air=1)
Critical
Temp. 0R
TCi
Critical
pressure.
Psia
Pci
T’c
= TCi yi
P’c
= Pci yi
CH4 16.043 0.5 0.5539 343.0 666 171.5 333
C2 H6 30.070 0.3 1.0382 549.6 706.6 164.9 212
C3 H8 44.097 0.1 1.5225 665.6 615.5 66.6 61.6
C4 H10 58.124 0.1 2.0068 734.5 527.9 73.5 52.8
Total 1.0 464.5 659.4
Table 1-4 for Example 1-5.
Using Equation 1-11 and 1-12
T`r = (100+460)/464.5 =1.2
P`r = (800+14.7)/659.4 = 1.23
From fig.1-3. Compressibility factor is approximately, z= 0.72

Fundamentals of Oil and Gas Processing
19 By: Yasser Kassem ([email protected])
Figure 1-3 Compressibility Factor For lean sweet natural gas (Surface Production Operations).
Calculating the compressibility factor for example 1-4, of the gas at 70 0F and 1200 psia, using Standing-
Katz chart, fig. 1-3. Z = 0.83 approximately. For ) Tr = 1.5 , Pr = 1.8).
Another analytical method of calculating the compressibility factor of a gas is using the CNGA equation as
follows:

Fundamentals of Oil and Gas Processing
(Eq. 1-15) Where
Pavg = Gas pressure, psig. [psig = (psia - 14.7)]
Tf = Gas temperature, 0R
G = Gas gravity (air = 1.00)
The CNGA equation for compressibility factor is valid when the average gas pressure Pavg is greater than
100 psig. For pressures less than 100 psig, compressibility factor is taken as 1.00. It must be noted that
the pressure used in the CNGA equation is the gauge pressure, not the absolute pressure.
Example 1-6: Calculate the compressibility factor of a sample of natural gas (gravity = 0.6) at 80 0F and
1000 psig using the CNGA equation.
Solution:
From the Eq. (1.15), the compressibility factor is
The CNGA method of calculating the compressibility, though approximate, is accurate enough for most
gas pipeline hydraulics work and process calculations.
1.3.7: Gas density at any condition of Pressure and temperature Once the molecular weight of the gas is known, the density of a gas at any condition of temperature and
pressure is given as:
𝜌g= (𝑀𝑊)𝑃
𝑅𝑇𝑍 lb/ft3
Since R=10.73, then
𝜌g= 0.093 (𝑀𝑊)𝑃
𝑇𝑍 lb/ft3 (Eq. 1-16)
where
ρg = density of gas, lb/ft3,
P =pressure, psia,
T =temperature, 0R,
Z =gas compressibility factor,
MW=gas molecular weight.

Fundamentals of Oil and Gas Processing
21 By: Yasser Kassem ([email protected])
Example 1-7: Calculate the pseudo-critical temperature and pressure for the natural gas stream
composition given in example 1-2, calculate the compressibility factor, and gas density at 600 psia and
1000F.
Solution:
No Component Mole
Fraction Yi
MW Yi ×
MW
Tic
0R
Yi ×
Tic 0R
Pic
psia
Yi ×
Pic
psia
1 N2 0.01 28 0.28 227.1 2.271 492.5 4.925
2 CO2 0.015 44 0.66 547.4 8.211 1070 16.05
3 Methane (C1) 0.77 16.043 12.35 343 264.11 666 512.82
4 Ethane (C2) 0.11 30.070 3.308 549.6 60.456 706.6 77.726
5 Propane (C3) 0.06 44.097 2.665 665.6 39.936 615.5 36.93
6 i-Butane (i-C4) 0.02 58.124 1.16 734.5 14.69 527.9 10.558
7 n-Butane(C4) 0.01 58.124 0.58 765.2 7.652 550.9 5.509
8 n-Pentane (C5) 0.005 72.151 0.361 845.5 4.2275 488.8 2.444
Total 1.0 21.36 451.5 667
Table 1-5 solution of Example 1-7.
From the table MW= 21.36
T`c = 451.5 0R
P`c = 667 psia
From Eq. (1-11) and Eq. (1-12)
Tr = T/T`c = (100+460)/451.5 = 1.24
Pr = P/P`c = 600/667 = 0.9
Compressibility factor z could be calculated from figure 1-3, or from Eq. (1-15)
Value from figure, z = 0.83
From Equation 1-15 z = 0.87
For our further calculation we will use the calculated z value [Eq. (1-15)]
Using eq. (1-16) density of gas
𝜌g = 0.093 (21.36)600
560 ×0.83 = 2.56 lb/ft3
Comparing 𝜌g at standard condition (z=1)
𝜌g at standard condition = 0.093 (21.36)14.7
520 ×1 = 0.056 lb/ft3
We can conclude that density increases with pressure while the volume decreases.
1.3.8: Gas volume at any condition of Pressure and temperature Volume of a gas is the space occupied by the gas. Gases fill the container that houses the gas. The
volume of a gas generally varies with temperature and pressure.
Volume of a gas is measured in cubic feet (ft3).
Gas volume are commonly referred to in "standard" or "normal" units.
Standard conditions commonly refers to gas volumes measured at: 60°F and 14.696 psia

Fundamentals of Oil and Gas Processing
The Gas Processors Association (GPA) SI standard molar volume conditions is 379.49 std ft3/lb mol at
60°F, 14.696 psia.
Therefore, each mole (n) contains about 379.5 cubic feet of gas (ft3)at standard conditions.
Therefore, by knowing the values of mass and density at certain pressure and temperature, the volume
occupied by gas can be calculated.
Example 1-8: Calculate the volume of a 10 lb mass of gas (Gravity = 0.6) at 500 psig and 80 0F,
assuming the compressibility factor as 0.895. The molecular weight of air may be taken as 29 and the
base pressure is 14.7 psia.
Solution:
The molecular weight of the gas (MW) = 0.6 x 29 = 17.4
Pressure =500+14.7 = 514.7 psia
Temperature = 80+460 = 540 0R
Compressibility factor z= 0.895
The number of lb moles n is calculated using Eq. (1-2). n=m/(MW)
n = 10/17.4
Therefore n= 0.5747 lb mole
Using the real gas Eq. (1-10), PV=nzRT
(514.7) V = 0.895 x 0.5747 x 10.73 x 540. Therefore, V = 5.79 ft3
Example 1-9: Calculate the volume of 1 lb mole of the natural gas stream given in the previous example
at 1200F and 1500 psia (compressibility factor Z = 0.811).
Solution:
Using Eq.(1-10), PV = nzRT
V= 0.811 x 1 x 10.73 x (120+460)/1500. V = 3.37 ft3
Example 1-01: One thousand cubic feet of methane is to be compressed from 60°F and atmospheric
pressure to 500 psig and a temperature of 50°F. What volume will it occupy at these conditions?
Solution:
Moles CH4 (n) = 1000 / 379.5 = 2.64
At final conditions, (Compressibility factor z must be calculated), from equations 1-11 and1-12
Tr = (460 + 50) / 344 = 1.88
Pr = (500 + 14.7) / 673 = 0.765
From Figure 1-3, Z = 0.94
From eqn. 1-10, PV = nzRT
V = 3.267.514
5107.1064.294.0
ft3
Example 1-11: One pound-mole of C3 H8 (44 lb) is held in a container having a capacity of 31.2 cu ft.
The temperature is 280°F. "What is the pressure?
Solution:
Volume = V = 31.2 ft3
A Trial-and-error solution is necessary because the compressibility factor Z is a function of the unknown
pressure. Assume Z = 0.9.
Using Eq. 1-10, PV = nzRT
P ×31.2 = 0.9 × 1.0 × 10.7 × (460 + 280)
P = 229 psia
From table 1-1, eqns. 1-11 and 1-12
Pr = 229 / 616 = 0.37,

Fundamentals of Oil and Gas Processing
23 By: Yasser Kassem ([email protected])
Tc = 665ºR
Tr = (460 + 280) / 665 = 1.113
According to Figure 1.3, the value of Z should be about 0.915 rather than 0.9. Thus, recalculate using eq.
1-10, the pressure is 232 rather than 229 psia.
Example 1-12: Calculate the volume of gas (MW=20) will occupy a vessel with diameter 24 in, and 6 ft.
length. At pressure 200 psia and temperature 100 0F. (Assume compressibility factor z=0.9), and what will
be the volume of gas at 14.7 psia and 60 0F.
Then calculate gas density and mass inside the container at pressure 200 psia and temperature 100 0F.
Volume of vessel = 𝜋 L r2
V = 3.14 × 6 × (24)2/ (2 × 12)2 ft3
V = 18.8 ft3.
(We divided by 2 to get r from the diameter, and divided by 12 to convert from in. to ft.)
T = 460 + 100 = 560 0R
Using Eq. 1-10, PV=nZRT
n = 18.8 × 200 / (0.9 × 10.73 × 560)
n = 0.7 lb. moles. (Remember gas volume ft3 = 379.5 x n)
Volume of gas at 200 psia and 100 0F= 0.7 * 379.5 = 266 ft3
n of Gas at 14.7 psia and 60 0F ( z=1) = 18.8 × 14.7 / (1 × 10.73 × 520)
n = 0.0495 lb. moles
Volume of gas at 14.7 psia and 60 0F = 0.0495 * 379.5 = 18.8 ft3
From the previous example 1-12, the gas volume will equal to the container volume at standard
conditions (14.7 psia and 60 0F).
Gas density is calculated using Eq. 1-16
𝜌g = 0.093 (𝑀𝑊)𝑃
𝑇𝑍 lb/ft3
Density of gas 𝜌g = 0.093 × 20 × 200 / (0.9 × 560) = 0.738 lb/ft3
Mass of gas inside the vessel = Volume × density = 0.738 × 265 = 196 lb mass
1.3.9: Velocity of gas, (ft/s) The velocity of gas equal the volume flow rate (ft3) per second divided by flow area (ft2).
Example 1-13: Calculate the gas velocity for gas flow rate 100 MMscfd through 24 in. internal diameter
gas pipe, the gas specific gravity is 0.7, pressure 500 psia, Temperature 100 0F, and assume
compressibility factor 0.85.
Solution: Using Eq. 1-10, PV=nzRT, and remember that n= V (ft3)/379.5).
n = 100 × 106/379.5
Gas volume at operating conditions V= 100 × 106 × 0.85 × 10.73 × 560 / (379.5 × 500)
= 2,695,000 ft3/day
Gas flow rate cubic foot per second = 2,695,000 / (24×60×60) = 31.2 ft3/sec
Area of flow = π r2 = 3.14 × 12 × 12 / (144) = 3.14 ft2
(144 to convert r2 from in. to ft2.)
Velocity of gas will be 31.2/3.14 = 9.9 ft/s
The gas velocity may be calculated directly from the following equation:
Velocity = 6 ZTQ/(100,000 ×Pd2) ft/s. Eq 1-17

Fundamentals of Oil and Gas Processing
Where Q = Flow rate scfd, d = diameter in inches.
The maximum recommended velocity of dry gas in pipes is 100 ft/s, (60 ft/s for wet gas), and to be less
than the erosional velocity which is defined as:
Erosional velocity: The erosional velocity represents the upper limit of gas velocity in a pipeline. As the
gas velocity increases, vibration and noise result. Higher velocities also cause erosion of the pipe wall
over a long time period. The erosional velocity Vmax may be calculated approximately as follows:
Vmax = 100 √𝑍𝑅𝑇/29𝐺𝑃2 Eq 1-18
Where G= gas sp. Gt (air=1), P = pressure psia
For Example 1-12, the erosional velocity Vmax is:
Vmax = 100 √0.85 × 10.73 × 560/(29 × 0.7 × 500)2 Vmax = 70.9 ft/s.
1.3.10: Average pipeline pressure The gas compressibility factor Z used in the General Flow equation is based upon the flowing
temperature and the average pipe pressure. The average pressure may be approximated as the
arithmetic average
Pavg = (P1+P2)/2 of the upstream and downstream pressures P1 and P2. However, a more
accurate average pipe pressure is usually calculated as follows
Pavg = 2
3 (P1+P2 -
P1× P2
P1+ P2) Eq 1-19
Where
P1, P2, Pavg = pressure, psia
Example 1-14: A natural gas pipeline with internal diameter 19 in. transports natural gas (Sp. Gr.= 0.65)
at a flow rate of 200 MMscfd. Calculate the gas velocity at inlet and outlet of the pipe, assuming
isothermal flow. The inlet temperature of 70 0F, inlet pressure is 1200 psig, and outlet pressure is 900
psig. Use compressibility factor of 0.95. Also, calculate the erosional velocity for this pipeline.
Solution:
Using Eq. 1-17, the gas velocity at inlet of the pipe:
Velocity = 6 × 0.95× 530×200,000,000/(100,000 ×1214.7×192) ft/s.
Velocity = 13.8 ft/s.
The gas velocity at outlet of the pipe:
Velocity = 6 × 0.95× 530×200,000,000/(100,000 ×914.7×192) ft/s.
Velocity = 18.3 ft/s.
Finally, the erosional velocity can be calculated using Eq. 1-18
Vmax = 100 √0.95 × 10.73 × 530/29 × 0.65 × 1214.72
Vmax = 48.6 ft/s.
The above example may be solved by calculating the gas density at inlet and outlet of the pipe, then
calculating the operational flow rate, divide it by pipe cross sectional area to get the velocity as follows:
Gas molecular weight = 0.65 × 28.96 = 18.8
Using Eq. 1-10, PV = nzRT

Fundamentals of Oil and Gas Processing
25 By: Yasser Kassem ([email protected])
Calculating n = 200,000,000 / 379.5
Flow rate under operating conditions =
Gas volume V (= flow rate Q) = 200,000,000 × 0.95 × 10.73 × 530 / (379.5 ×1214.7)
Q = 2,347,000 ft3 per day at operating conditions. Q = 27.16 ft3/s.
Pipe cross sectional area = π r2 = 3.14 × 19 × 19 /(4× 144) = 1.97 ft2
Velocity of gas at the inlet = 27.16/1.97 = 13.8 ft/s.
1.3.11: Viscosity of gases Viscosity of a fluid relates to the resistance to flow of the fluid. Higher the viscosity, more difficult it is to
flow. Viscosity is a number that represents the drag forces caused by the attractive forces in adjacent fluid
layers. It might be considered as the internal friction between molecules, separate from that between the
fluid and the pipe wall.
The viscosity of a gas is very small compared to that of a liquid. For example, a typical crude oil may have
a viscosity of 10 centipoise (cp), whereas a sample of natural gas has a viscosity of 0.0019 cp.
Viscosity may be referred to as absolute or dynamic viscosity measured in cp or kinematic viscosity
measured in centistokes (cSt). Other units of viscosity are lb/ft-sec for dynamic viscosity and ft2/s for
kinematic viscosity.
Fluid viscosity changes with temperature. Liquid viscosity decreases with increasing temperature,
whereas gas viscosity decreases initially with increasing temperature and then increases with further
increasing temperature.
Multiply By To obtain
ft2/sec 92903.04 Centistokes
lbf-sec/ft2 (lb/ft-sec) 47880.26 Centipoises
Centipoises 1/density (g/cm3) Centistokes
lbf-sec/ft2 (lb/ft-sec) 32.174/density (lb/ft3) ft2/sec
Centipoise 0.000672 lbm/ft-sec
Table 1- 6 Viscosity conversion factors
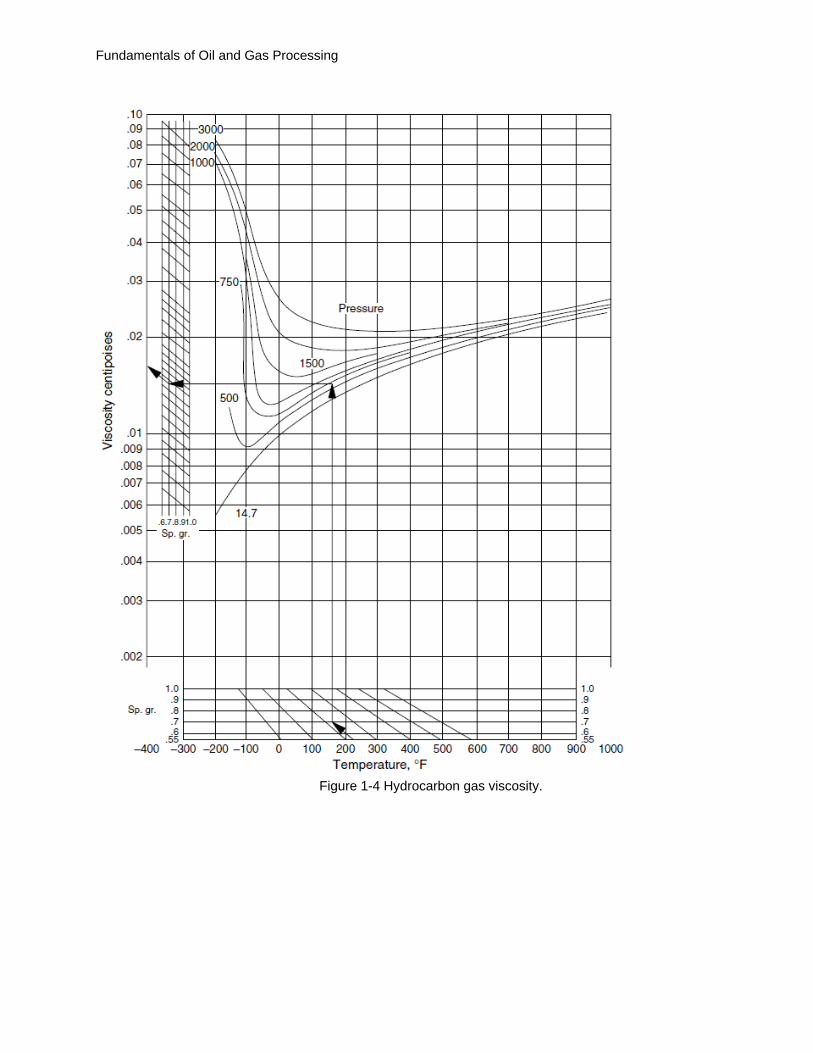
Figure 1-4 can be used to estimate the viscosity of a hydrocarbon gas at various conditions of
temperature and pressure if the specific gravity of the gas at standard conditions is known. It is useful
when the gas composition is not known. It does not make corrections for H2S, CO2, and N2. It is useful for
determining viscosities at high pressure.
1.3.12: The heating value of gases The heating value of a gas is expressed in Btu/ft3. It represents the quantity of heat in Btu (British Thermal
Unit) generated by the complete combustion of one cubic foot of the gas with air at constant pressure at a
fixed temperature of 60 0F.
Hydrogen in the fuel burns to water and when the flue gases are cooled to 60°F, the physical state —
either vapor or liquid — of this water must be assumed. So the latent heat of vaporization of the water
may or may not be considered to be part of the heating value. The result is two definitions for the heating
value. The higher or gross heating value, HHV, includes the heat of condensation and the lower or net
heating value, LHV, assumes the water remains in the vapor state.
For gas mixture the heating value is calculated as follows:
H = Ʃ xi Hi Eq. 1-20
Fundamentals of Oil and Gas Processing
Figure 1-4 Hydrocarbon gas viscosity.

Fundamentals of Oil and Gas Processing
27 By: Yasser Kassem ([email protected])
Example 1-15: Calculate the heating value of gas mixture of Example 1-2
No Component Mole
Fraction Yi
MW Yi ×
MW =
Gross Calorific
value Btu/ft3 @
60 0F (H)
H x Yi
1 Nitrogen N2 0.01 28 0.28 0 0
2 CO2 0.015 44 0.66 0 0
3 Methane (C1) 0.77 16.043 12.35 1016.0 782.32
4 Ethane (C2) 0.11 30.070 3.308 1769.6 194.66
5 Propane (C3) 0.06 44.097 2.665 2516.1 150.97
6 i-Butane (i-C4) 0.02 58.124 1.16 3251.9 65.04
7 n-Butane(C4) 0.01 58.124 0.58 3262.3 32.62
8 n-Pentane (C5) 0.005 72.151 0.361 4008.9 20.04
Total 1.0 21.36 1246
Table 1-7 Solution of Example 1-15
From table 1-7 the Gross calorific value HHV = 1246 Btu/ft3
The higher, ideal, dry heating value of sweet natural gas at 60°F and 760 mm Hg may be calculated with
the following equation:
HHV=1568.72 × SG – 2524.88 × XCO2 – 1658.37 × XN2 +141.05 Eq. 1- 21
Applying Eq 1-21 for Example 1-15
The apparent molecular weight= 21.36
Gas Specific gravity = 21.36/28.96 = 0.738
HHV = 1568.72 × 0.738 – 2524.88 × 0.015 – 1658.37 × 0.01 +141.05 = 1244 Btu/ft3
1.4: properties of Hydrocarbon Liquids (Crude Oil)
1.4.1: Introduction Crude oils are complex mixtures of a vast number of hydrocarbon compounds. Properties of crude
petroleum vary appreciably and depend mainly on the origin.
Liquid hydrocarbons are started from Pentane C5 (Natural gasoline) up to solid hydrocarbon (C20) which
has a melting point 100 0F.
Heavier hydrocarbons (Paraffin and Asphalteen have higher melting points and may be soluble or
dispersed in the liquid crude oil depending on solution temperature.)
Crude oil properties depends on its composition which is deferent and variable from crude to another.
1.4.2: Crude oil Density and gravity Density is defined as the mass of a unit volume of material at a specified temperature. It has the
dimensions of grams per cubic centimeter or lb/ft3.
Another general property, which is more widely, is the specific gravity. It is the ratio of the density of oil to
the density of water and is dependent on two temperatures, those at which the densities of the oil sample
and the water are measured. When the water temperature is 60 0F. The standard temperatures for
specific gravity in the petroleum industry is 15/15 0C and 60/60 0F.
Fundamentals of Oil and Gas Processing
Although density and specific gravity are used extensively in the oil industry, the API gravity is considered
the preferred property. It is expressed by the following relationship:
0API = 141.5
𝑆𝑝.𝐺𝑟 @ 60 𝐷𝑒𝑔 𝐹 - 131.5 Eq. 1-22
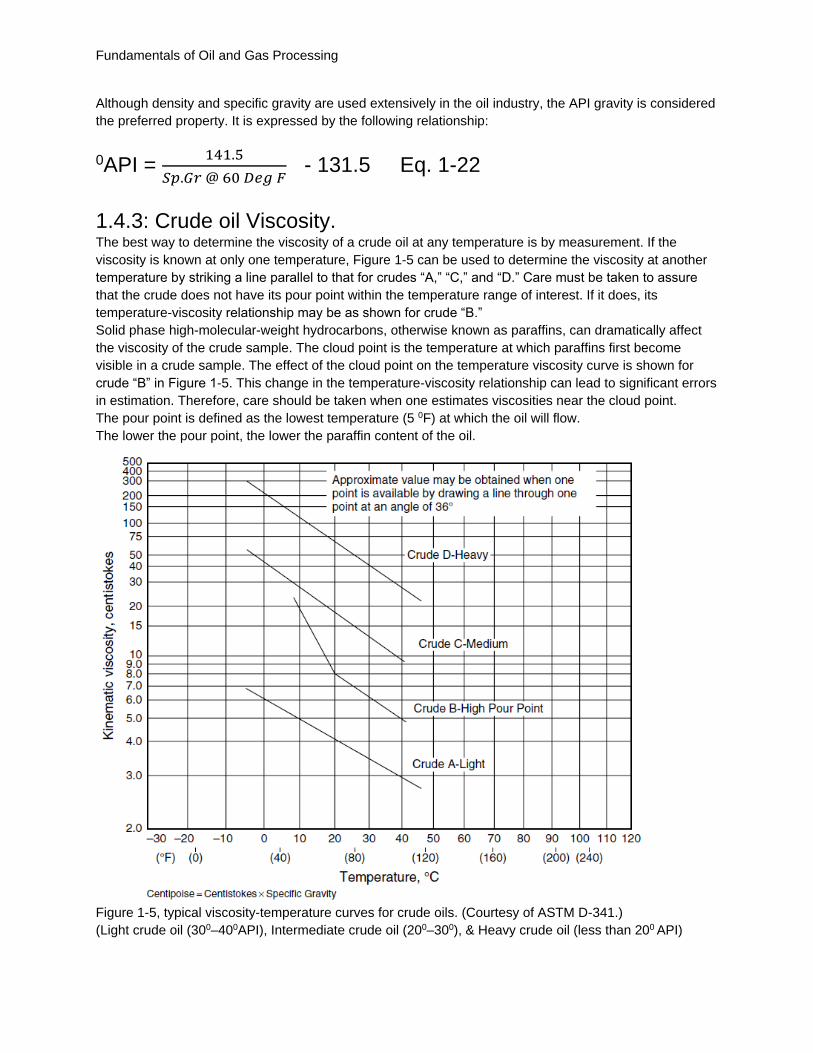
1.4.3: Crude oil Viscosity. The best way to determine the viscosity of a crude oil at any temperature is by measurement. If the
viscosity is known at only one temperature, Figure 1-5 can be used to determine the viscosity at another
temperature by striking a line parallel to that for crudes “A,” “C,” and “D.” Care must be taken to assure
that the crude does not have its pour point within the temperature range of interest. If it does, its
temperature-viscosity relationship may be as shown for crude “B.”
Solid phase high-molecular-weight hydrocarbons, otherwise known as paraffins, can dramatically affect
the viscosity of the crude sample. The cloud point is the temperature at which paraffins first become
visible in a crude sample. The effect of the cloud point on the temperature viscosity curve is shown for
crude “B” in Figure 1-5. This change in the temperature-viscosity relationship can lead to significant errors
in estimation. Therefore, care should be taken when one estimates viscosities near the cloud point.
The pour point is defined as the lowest temperature (5 0F) at which the oil will flow.
The lower the pour point, the lower the paraffin content of the oil.
Figure 1-5, typical viscosity-temperature curves for crude oils. (Courtesy of ASTM D-341.)
(Light crude oil (300–400API), Intermediate crude oil (200–300), & Heavy crude oil (less than 200 API)
Fundamentals of Oil and Gas Processing
29 By: Yasser Kassem ([email protected])
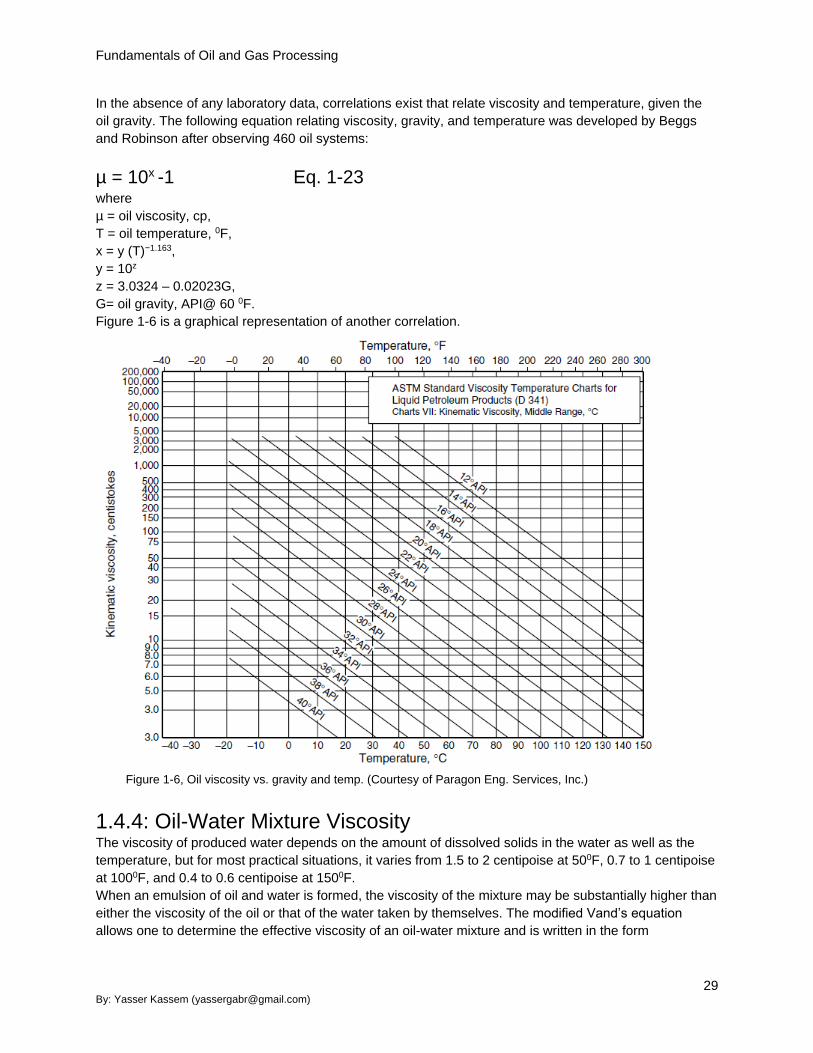
In the absence of any laboratory data, correlations exist that relate viscosity and temperature, given the
oil gravity. The following equation relating viscosity, gravity, and temperature was developed by Beggs
and Robinson after observing 460 oil systems:
µ = 10x -1 Eq. 1-23 where
µ = oil viscosity, cp,
T = oil temperature, 0F,
x = y (T)−1.163,
y = 10z
z = 3.0324 – 0.02023G,
G= oil gravity, API@ 60 0F.
Figure 1-6 is a graphical representation of another correlation.
Figure 1-6, Oil viscosity vs. gravity and temp. (Courtesy of Paragon Eng. Services, Inc.)
1.4.4: Oil-Water Mixture Viscosity
The viscosity of produced water depends on the amount of dissolved solids in the water as well as the
temperature, but for most practical situations, it varies from 1.5 to 2 centipoise at 500F, 0.7 to 1 centipoise
at 1000F, and 0.4 to 0.6 centipoise at 1500F.
When an emulsion of oil and water is formed, the viscosity of the mixture may be substantially higher than
either the viscosity of the oil or that of the water taken by themselves. The modified Vand’s equation
allows one to determine the effective viscosity of an oil-water mixture and is written in the form

Fundamentals of Oil and Gas Processing
µeff = (1+2.5 ϕ +10 ϕ2) µc Eq. 1- 24 where
µeff = effective viscosity, cp
µc = viscosity of the continuous phase (Oil), cp
Φ = volume fraction of the discontinuous phase (Water).
1.5: Phase Behavior
1.5.1: Introduction Before studying the separation of gases and liquids, we need to understand the relationship between the
phases. Phase defines any homogeneous and physically distinct part of a system that is separated from
other parts of the system by definite bounding surfaces:
The matter has three phases, the simplest example is water.
• Solid (ice),
• Liquid (liquid water),
• Vapor (water vapor).
Solids have a definite shape and are hard to the touch. They are composed of molecules with very low
energy that stay in one place even though they vibrate. Liquids have a definite volume but no definite
shape. Liquids assume the shape of the container but will not necessarily fill that container. Liquid
molecules possess more energy than a solid (allows movement from place to another). By virtue of the
energy, there is more space between molecules, and liquids are less dense than solids. Vapors do not
have a definite volume or shape and will fill a container in which they are placed. Vapor molecules
possess more energy than liquids (very active) and are less dense than liquids.
Our primary concern in this section is the difference in energy level between phases.
Energy is added to melt a solid to form a liquid. Additional energy will cause the liquid to vaporize. One
needs to know the phase or phases that exist at given conditions of pressure, volume, and temperature
so as to determine the corresponding energy level, to do this we need to study the phase diagram or
phase behavior, but first we have to separate components into three classifications:
• Pure substance (single-component systems),
• Two substances,
• Multicomponent.
Phase diagrams illustrate the phase that a particular substance will take under specified conditions of
pressure, temperature, and volume.
1.5.2 System Components Natural gas systems are composed primarily of the lighter alkane series of hydrocarbons, with methane
(CH4) and ethane (C2H6) comprising 80% to 90% of the volume of a typical mixture. Methane and ethane
exist as gases at atmospheric conditions.
Propane (C3H8), butane (n-C4H10 and i-C4H10), and heavier hydrocarbons may be extracted from the gas
system and liquefied for transportation and storage. These are the primary components of liquefied
petroleum gas, or LPG.
The intermediate-weight hydrocarbons (pentane through decane) exist as volatile liquids at atmospheric
conditions. These components are commonly referred to as pentanes-plus, condensate, natural gasoline,
and natural gas liquids (NGL).

Fundamentals of Oil and Gas Processing
31 By: Yasser Kassem ([email protected])
Natural gas systems can also contain non-hydrocarbon constituents, including hydrogen sulfide (H2S),
carbon dioxide (CO2), nitrogen (N2), and water vapor. These constituents may occur naturally in gas
reservoirs, or they may enter the system as contaminants during production, processing, and
transportation. In addition, operators may intentionally add odorants, tracers (such as helium), or other
components.
Dry, or lean, natural gas systems have high concentrations of the lighter hydrocarbons (methane and
ethane), while wet, or rich, gas systems have higher concentrations of the intermediate-weight
hydrocarbons. Lean gases burn with a low air-to-gas ratio and display a colorless to blue or yellow flame,
whereas rich gases require comparatively higher amounts of air for combustion and burn with an orange
flame. Intermediate-weight hydrocarbons may condense from rich gases upon cooling.
Table 1-8 shows typical compositions for a lean gas and a rich gas.
Component Lean Gas
Mole Percent
Rich Gas
Mole Percent
Methane 86.00 68.51
Ethane 5.81 9.05
Propane 3.58 5.34
Pentane and heavier 0.72 12.5
CO2 0.10 0.01
N2 2.00 0.11
H2S 0.07 0.00
Total 100 100
Table 1-8 typical composition of Lean and Rich gases.
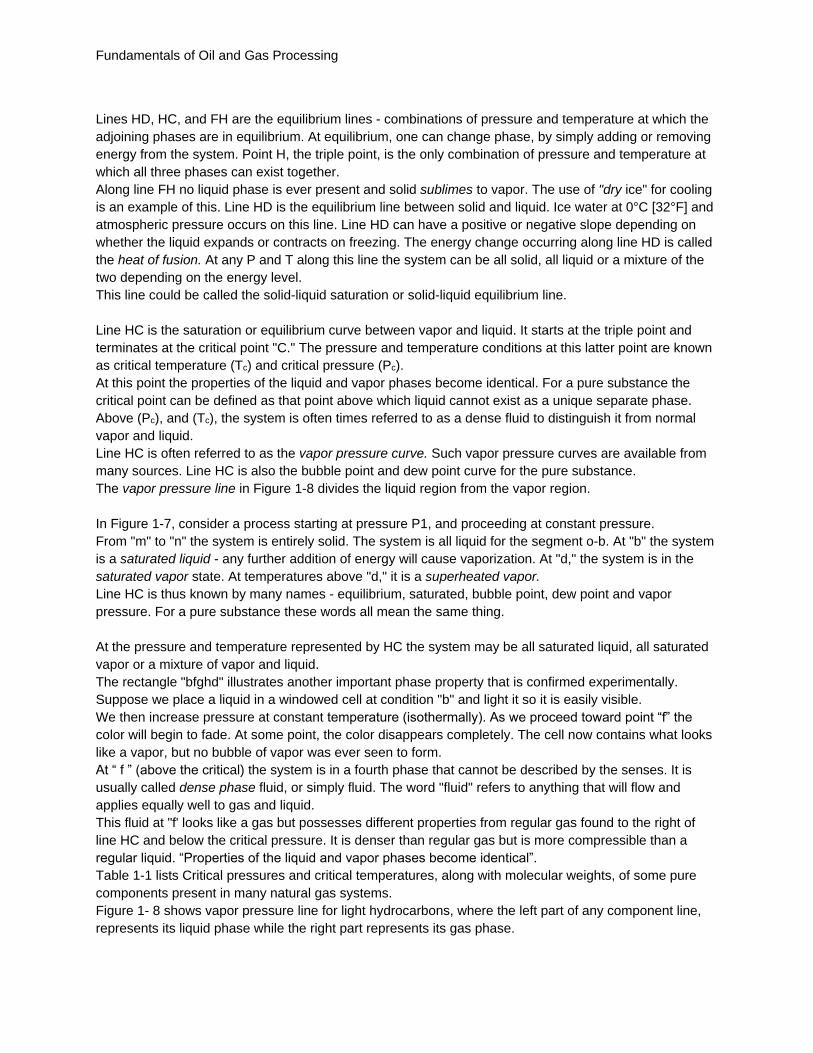
1.5.3: Single-Component Systems A pure component of a natural gas system exhibits a characteristic phase behavior, as shown in Fig. 1-7.
Depending on the component’s pressure and temperature, it may exist as a vapor, a liquid, or some
equilibrium combination of vapor and liquid
Figure 1-7 P-T Diagram for pure component.
Fundamentals of Oil and Gas Processing
Lines HD, HC, and FH are the equilibrium lines - combinations of pressure and temperature at which the
adjoining phases are in equilibrium. At equilibrium, one can change phase, by simply adding or removing
energy from the system. Point H, the triple point, is the only combination of pressure and temperature at
which all three phases can exist together.
Along line FH no liquid phase is ever present and solid sublimes to vapor. The use of "dry ice" for cooling
is an example of this. Line HD is the equilibrium line between solid and liquid. Ice water at 0°C [32°F] and
atmospheric pressure occurs on this line. Line HD can have a positive or negative slope depending on
whether the liquid expands or contracts on freezing. The energy change occurring along line HD is called
the heat of fusion. At any P and T along this line the system can be all solid, all liquid or a mixture of the
two depending on the energy level.
This line could be called the solid-liquid saturation or solid-liquid equilibrium line.
Line HC is the saturation or equilibrium curve between vapor and liquid. It starts at the triple point and
terminates at the critical point "C." The pressure and temperature conditions at this latter point are known
as critical temperature (Tc) and critical pressure (Pc).
At this point the properties of the liquid and vapor phases become identical. For a pure substance the
critical point can be defined as that point above which liquid cannot exist as a unique separate phase.
Above (Pc), and (Tc), the system is often times referred to as a dense fluid to distinguish it from normal
vapor and liquid.
Line HC is often referred to as the vapor pressure curve. Such vapor pressure curves are available from
many sources. Line HC is also the bubble point and dew point curve for the pure substance.
The vapor pressure line in Figure 1-8 divides the liquid region from the vapor region.
In Figure 1-7, consider a process starting at pressure P1, and proceeding at constant pressure.
From "m" to "n" the system is entirely solid. The system is all liquid for the segment o-b. At "b" the system
is a saturated liquid - any further addition of energy will cause vaporization. At "d," the system is in the
saturated vapor state. At temperatures above "d," it is a superheated vapor.
Line HC is thus known by many names - equilibrium, saturated, bubble point, dew point and vapor
pressure. For a pure substance these words all mean the same thing.
At the pressure and temperature represented by HC the system may be all saturated liquid, all saturated
vapor or a mixture of vapor and liquid.
The rectangle "bfghd" illustrates another important phase property that is confirmed experimentally.
Suppose we place a liquid in a windowed cell at condition "b" and light it so it is easily visible.
We then increase pressure at constant temperature (isothermally). As we proceed toward point “f” the
color will begin to fade. At some point, the color disappears completely. The cell now contains what looks
like a vapor, but no bubble of vapor was ever seen to form.
At “ f ” (above the critical) the system is in a fourth phase that cannot be described by the senses. It is
usually called dense phase fluid, or simply fluid. The word "fluid" refers to anything that will flow and
applies equally well to gas and liquid.
This fluid at "f' looks like a gas but possesses different properties from regular gas found to the right of
line HC and below the critical pressure. It is denser than regular gas but is more compressible than a
regular liquid. “Properties of the liquid and vapor phases become identical”.
Table 1-1 lists Critical pressures and critical temperatures, along with molecular weights, of some pure
components present in many natural gas systems.
Figure 1- 8 shows vapor pressure line for light hydrocarbons, where the left part of any component line,
represents its liquid phase while the right part represents its gas phase.

Fundamentals of Oil and Gas Processing
33 By: Yasser Kassem ([email protected])
Figure 1-8 Vapor pressure for light hydrocarbons.

Fundamentals of Oil and Gas Processing
1.5.4: Multicomponent Systems In reality, natural gas systems are not pure substances. Rather, they are mixtures of various components,
with phase behavior characteristics that differ from those of a single-component system. Instead of having
a vapor pressure curve, a mixture exhibits a phase envelope, as shown in Figure 1-9.
Figure 1-9 typical phase envelop of hydrocarbon mixture.
The phase envelope (curve BCD in Figure 1-9) separates the liquid and gas phases. The area within this
envelope is called the two-phase region and represents the pressure and temperature ranges at which
liquid and gas exist in equilibrium.
The upper line of the two-phase region (curve BC) is the bubble-point line. This line indicates where the
first bubble of vapor appears when the pressure of the liquid phase mixture is lowered at constant
temperature, or when the temperature increases at constant pressure.
The lower section of the phase envelope (curve CD) is the dewpoint line. When the pressure of a mixture
in the gaseous phase is decreased at constant temperature, or when the temperature is lowered at
constant pressure, the first drop of liquid forms on this line. The bubble-point line and the dewpoint line
meet at the critical point (C).
The highest pressure in the two-phase region is called the cricondenbar, while the highest temperature in
the two-phase region is called the cricondentherm.
Figure 1-10, is another example of phase envelope, where:
Cricondenbar - maximum pressure at which liquid and vapor may exist (Point N).
Cricondentherm - maximum temperature at which liquid and vapor may coexist in equilibrium (Point M).
Retrograde Region - that area inside phase envelope where condensation of liquid occurs by lowering
pressure or increasing temperature (opposite of normal behavior).
Quality Lines - those lines showing constant percentages which intersect at the critical point (C) and are
essentially parallel to the bubble point and dew point curves. The bubble point curve represents 0% vapor
and the dew point curve 100% vapor.
Line ABDE represents a typical isothermal retrograde condensation process occurring in a condensate
reservoir. Point A represents the single phase fluid outside the phase envelope. As pressure is lowered,
Point B is reached where condensation begins. As pressure is lowered further, more liquid forms because

Fundamentals of Oil and Gas Processing
35 By: Yasser Kassem ([email protected])
of the change in the slope of the quality lines. As the process continues outside the retrograde area, less
and less liquid forms until the dewpoint is reached (Point E). Below E no liquid forms.
Figure 1-10 shows another phase envelope for hydrocarbon mixture.
1.5.5: Prediction of phase envelope
The location of the bubblepoint and dewpoint lines may be calculated using vapor-liquid equilibrium (VLE)
methods. For most naturally occurring systems above about [2000 psia], the validity of the standard
calculation becomes questionable.
The application of K-values to calculate phase quantities and compositions proceeds as follows.
For any stream (F) with mole fractions of components (Z1+Z2+Z3,.., etc.) entering a vessel at certain
pressure and temperature, the stream will be divided into Vapor stream(V) with mole fractions of
components (Y1+Y2+Y3,.., etc.), and into a liquid phase (L) with mole fractions of components
(X1+X2+X3,.., etc.).
Component balance:
Fzi = Vyi + Lxi Eq. 1-25
Figure 1-11 flash separation for hydrocarbon mixture.

Fundamentals of Oil and Gas Processing
where
zi = mol fraction of any component in total feed stream to separation vessel
yi = mol fraction of any component in the vapor phase
xi = mol fraction of any component in the liquid phase
Ki = equilibrium vaporization ratio (equilibrium constant) = yi/xi
F = total mols of feed
V = total mols of vapor
L = total mols of liquid
If we set F = 1.0 so that L and V are now liquid and vapor-to-feed ratios
then zi = Vyi + Lxi
Since yi = Kixi
So, zi = V Ki xi + L xi
xi = zi / ( L + V Ki) Eq. 1-26 Since the summation of liquid fractions must equal one, we can write the following equation.
∑ xi = ∑ zi / ( L + V Ki) = 1 Eq. 1-27
The equation serves as the objective function in an interactive calculation to determine the quantity of L or
V. The calculation procedure is as follows:
1. Determine K values of each component at the temperature and pressure of the system.
2. Assume a value of L (remember, V = 1 - L)
3. Solve the equation Eq. 1-27. If ∑xi ≠ 1.0 assume a new value of L and repeat step 2.
4. When ∑ xi = 1.00, the phase quantities L and V are known as well as the liquid phase composition.
Vapor phase compositions may be calculated by remembering that yi = Kixi,
The foregoing calculations is known as a flash calculation and is used to predict the equilibrium quantities
and compositions of two phase systems.
Special cases of a flash calculation include bubble point (V = 0, L = 1) and dew point (V = 1, L = 0),
calculations. Equations for bubblepoint, and dewpoint are as follows:
Bubblepoint condition:
∑ Ki xi = 1.0 Eq. 1-28
Dewpoint condition:
∑ yi/Ki = 1.0 Eq. 1-29
Flash calculation are usually made by computer software, but knowing the basic of calculations is
important in understanding the gas-liquid separation process.
Example 1- 16: Calculate the bubblepoint and dewpoint temperature at 250 psia of the following
hydrocarbon mixture. Then calculate the amount of vapor and liquid and the composition of the two
phases if these feed entered a vessel @ 250 psia and 150 0F.

Fundamentals of Oil and Gas Processing
37 By: Yasser Kassem ([email protected])
Component Mole %
C2 10
C3 50
iC4 15
nC4 25
Total 100
Table 1-9 hydrocarbon component for example 1-16.
Solution:
Bubblepoint calculation : To calculate the bubblepoint temperature at certain pressure, (All the
components are in liquid phase xi = 1).
From eq. 1-28, the bubblepoint will be reached when ∑ Ki xi ≅ 1
Solution Steps:
1- Assume a temperature value (100 0F), for example.
2- From the K chart of each compound, find the K value at the system pressure and assumed
temperature.
3- Multiply mole fraction xi of each component by its equilibrium value taken from the table Ki.
4- Take the sum ∑ Ki xi , if it’s less than 1, choose higher temperature, (1500F for example), and
repeat as in the table.
5- If, ∑ Ki xi is higher than 1, choose a lower temperature.
6- Repeat till ∑ Ki xi ≅ 1.
Component xi Assume 100 0F Assume 150 0F Assume 132 0F
Ki = Ki xi = Ki = Ki xi = Ki = Ki xi =
C2 0.1 2.4 0.24 3.25 0.325 2.94 0.294
C3 0.5 0.8 0.4 1.2 0.6 1.07 0.533
iC4 0.15 0.36 0.054 0.61 0.0915 0.512 0.077
nC4 0.25 0.265 0.066 0.47 0.1175 0.387 0.097
Total 1.000 0.76 1.13 1.001
Table 1-10 bubblepoint calculation for example 1-16.
We assumed two values of temperature , we found the first value (100 0F) is lower than the
bubble point since ∑ Ki xi < 1.00 , and the second value (150 0F) is higher than the bubble point
since ∑ Ki xi > 1.00 , the bubble point will be between the two values where ∑ Ki xi ≅ 1.
The Ki values in previous table where collected from “ Design operation and maintenance of gas
plants - John Campbell Co.” , since it’s hard to obtain Ki numbers at temperature rather than the
pre-drawn temperature lines in K-Charts.
The Values of Ki can be extracted from individual component charts (figures 1-12 to 1-16)
(Methane K-chart, Ethane K-chart ….etc.), or can be extracted from “DePriester” chart, fig 1-17.
Dewpoint calculation: To calculate the dewpoint temperature at certain pressure, (All the components are
in gas phase yi = 1). From eq. 1-29, the dewpoint will be reached when ∑ yi /Ki ≅ 1
Solution Steps:
1- Assume a temperature value (150 0F), for example.
2- From the K chart of each compound, find the K value at the system pressure and assumed
temperature.
3- Divide mole fraction Yi of each component by its equilibrium value taken from the table Ki.
4- Take the sum ∑ Yi /Ki , if it’s higher than 1, choose higher temperature, (2000F for example), and
repeat as in the table.

Fundamentals of Oil and Gas Processing
5- If, ∑ Yi /Ki is less than 1, choose a lower temperature.
6- Repeat till ∑ Yi /Ki ≅ 1.
Component yi Assume 150 0F Assume 200 0F Assume 170 0F
Ki = yi /Ki = Ki = yi /Ki = Ki = yi /Ki =
C2 0.1 3.25 0.03 4.25 0.024 3.64 0.028
C3 0.5 1.2 0.42 1.80 0.28 1.46 0.343
iC4 0.15 0.61 0.25 1.00 0.15 0.75 0.200
nC4 0.25 0.47 0.53 0.58 0.43 0.583 0.429
Total 1.000 1.23 0.884 1.000
Table 1-11 dewpoint calculation for example 1-16.
We assumed two values of temperature , we found the first value (150 0F) is lower than the
dewpoint since ∑ yi /Ki > 1.00 , and the second value (200 0F) is higher than the bubble point
since ∑ yi /Ki value is < 1.00 , the dewpoint will be between the two values where ∑ yi /Ki ≅ 1 .
The Ki values in previous table where collected from “ Design operation and maintenance of gas
plants - John Campbell Co.” , since it’s hard to obtain Ki numbers at temperature rather than the
pre-drawn temperature lines in K-Charts.
The Values of Ki can be extracted from individual component charts (Methane K-chart, Ethane K-
chart ….etc.), or can be extracted from “DePriester” chart, fig 1-17.
Flash calculations:
Different values of “L” will be assumed (remember, V = 1 - L), and accordingly Xi will be calculated till we
obtain ∑ xi = 1.00.
Ki from chart at 250 psia and 150 0F
Using Eq. 1 -26 xi = zi / ( L + V Ki)
Component Zi Ki Assume
L=0.5
Xi =
Assume
L = 0.75
Xi =
Assume
L= 0.649
Xi =
Yi = Ki Xi
C2 0.10 3.24 0.047 0.064 0.0565 0.181
C3 0.50 1.23 0.448 0.473 0.463 0.569
iC4 0.15 0.61 0.186 0.166 0.174 0.106
nC4 0.25 0.467 0.341 0.288 0.308 0.144
Total 1.0000 1.022 0.991 1.000 1.000
Table 1-12 flash calculations for example 1-16.
The assumed value of L=0.5, found to be lower than the correct value, and the assumed value of L= 0.75
found to be higher than the correct value.
The correct value must be in between the two previous assumed values, and found to be 0.649.
Flash calculations usually performed by computer software, for manual calculations, some K value charts
are included in this chapter for the illustration of manual calculations for the previous example. (Figures 1-
12 to 1-16)
Other K-values are included in Chapter 25 “Equilibrium Ratio (K) Data” in the “GPSA Engineering Data
Book”, or Appendix 5A Volume 1 “Gas conditioning and Processing – The Basic Principles,” Campbell
Petroleum Series. In the other hand, the DePriester Chart Figure 1-17, may be used for all hydrocarbon
components.
K Value charts:

Fundamentals of Oil and Gas Processing
39 By: Yasser Kassem ([email protected])
Figure 1-12 Equilibrium ratio (K) for Methane.
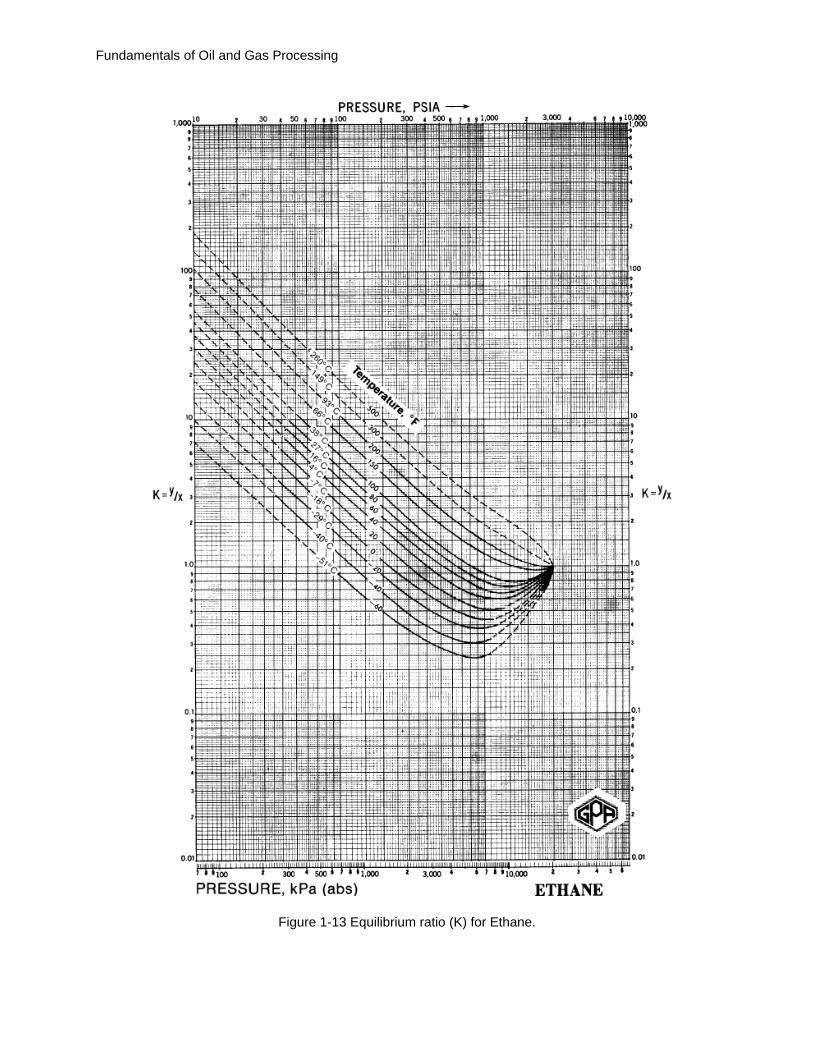
Fundamentals of Oil and Gas Processing
Figure 1-13 Equilibrium ratio (K) for Ethane.
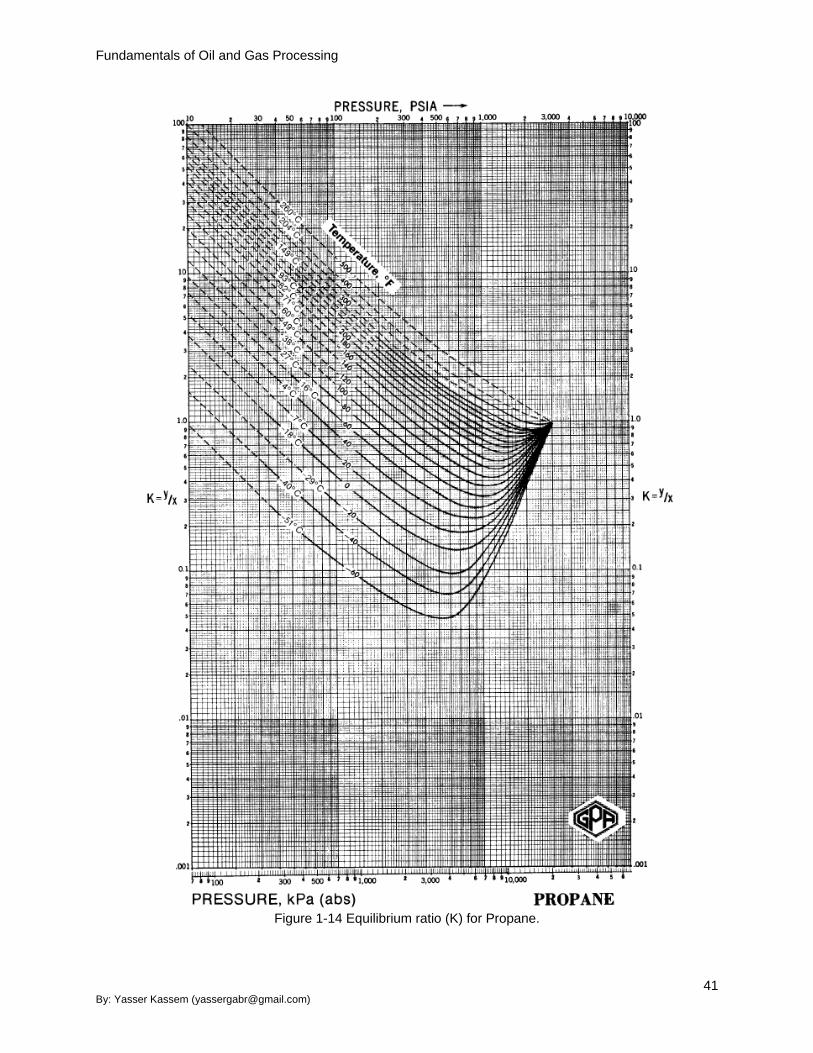
Fundamentals of Oil and Gas Processing
41 By: Yasser Kassem ([email protected])
Figure 1-14 Equilibrium ratio (K) for Propane.

Fundamentals of Oil and Gas Processing
Figure 1-15 Equilibrium ratio (K) for i-Butane.
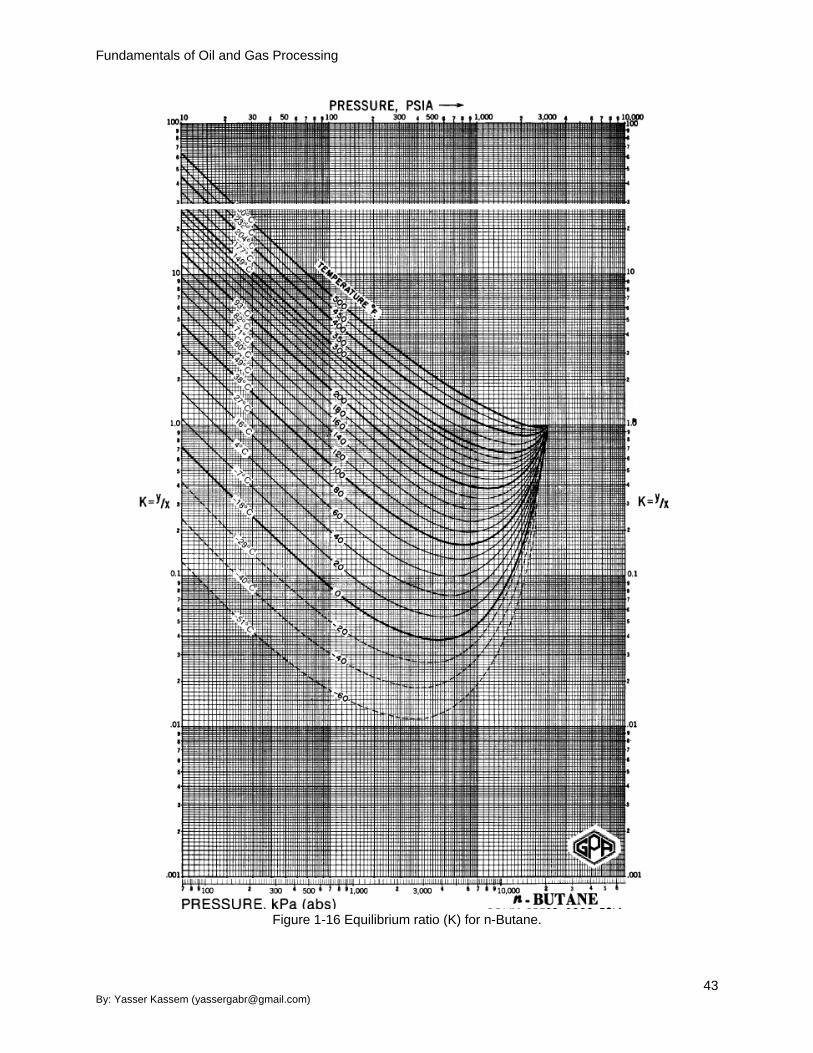
Fundamentals of Oil and Gas Processing
43 By: Yasser Kassem ([email protected])
Figure 1-16 Equilibrium ratio (K) for n-Butane.
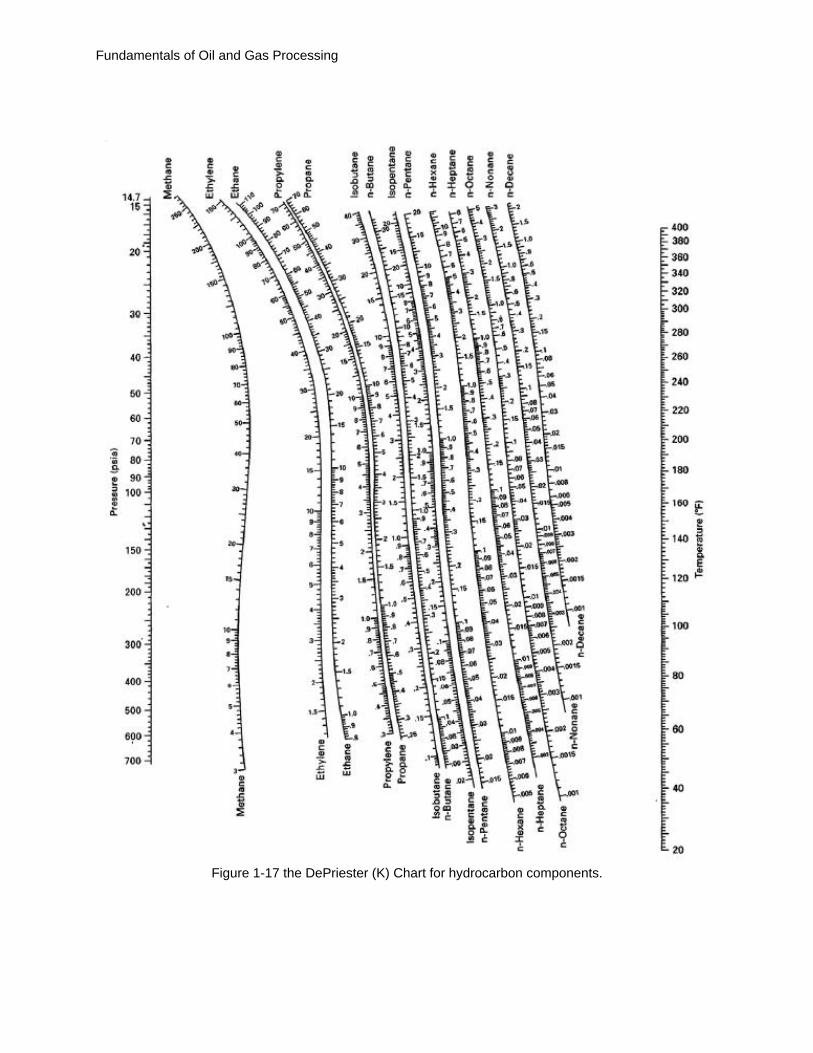
Fundamentals of Oil and Gas Processing
Figure 1-17 the DePriester (K) Chart for hydrocarbon components.

Fundamentals of Oil and Gas Processing
45 By: Yasser Kassem ([email protected])
1.6: Types of Fluid Flow
When a fluid moves through a pipe, two distinct types of flow are possible, laminar and turbulent. Laminar
flow occurs in fluids moving with small average velocities and turbulent flow becomes apparent as the
velocity is increased above a critical velocity. In laminar flow, the fluid particles move along the length of
the pipe in a very orderly fashion, with little or no sideways motion across the width of the pipe.
Turbulent flow is characterized by random, disorganized motion of the particles, from side to side across
the pipe as well as along its length. The two types of fluid flow are described by different sets of
equations. In general, for most practical situations, the flow will be turbulent.
Figure.1-18. Laminar and turbulent flow in pipes.
1.6.1: Reynolds Number A useful factor in determining which type of flow is involved is the Reynolds number. This is the ratio of
the dynamic forces of mass flow to the shear resistance due to fluid viscosity and is given by the following
formula.
Re = VDρ/ µ Eq. 1-30
where
Re = Reynolds number, dimensionless
V = average gas velocity, ft/s
D = pipe inside diameter, ft
ρ = gas density, lb/ft3
μ = gas viscosity, lb/ft-s (1 cp = 0.000672 lb/ft-s)
The flow is considered to be laminar flow when the Reynolds number is below 2000.
Turbulent flow is said to exist when the Reynolds number is greater than 4000. When the Reynolds
numbers is between 2000 and 4000, the flow is called critical flow, or undefined flow.
Therefore
Re <= 2000 Flow is laminar
Re > 4000 Flow is turbulent
2000 < Re <= 4000 Flow is critical flow
In terms of the more commonly used units in the gas pipeline industry, the following formula for Reynolds
number is more appropriate:
Re = 1.53 x 10⁻⁵ (GQ/µd) Eq. 1-31 where
G = gas specific gravity (air = 1)
Q = gas flow rate, standard ft3/day (scfd)
d = pipe inside diameter, in.
μ = gas viscosity, lb/ft-s (1 cp = 0.000672 lb/ft-s)

Fundamentals of Oil and Gas Processing
Chapter 2 Two-phase Oil and Gas Separation
2.1 Introduction
The production system begins at the wellhead. Fluids produced from oil and gas wells generally
constitute mixtures of crude oil, natural gas, and salt water. Crude oil–gas–water mixtures produced from
wells, are generally directed, through flow lines and manifold system, to a central processing and
treatment facility normally called the gas–oil separation plant (GOSP).
The goal is to attain in the downstream (output) of the “gas oil separation plant”, the following
components:
Oil free of water and meets other purchaser’s specifications.
Gas free of hydrocarbon liquid meets other purchaser’s specifications.
Water free of oil and meets environmental, and reservoir regulation for disposal or reinjection.
The first step in processing of the produced stream is the separation of the phases (oil, gas, and water)
into separate streams.
Oil may still contain between 10% and 15% water that exists mostly as emulsified water, once initial
separation is done, each stream undergoes the proper processing for further field treatment.
2.2 Phase Equilibrium
Equilibrium is a theoretical condition that describes an operating system that has reached a “steady-state”
condition whereby the vapor is condensing to a liquid at exactly the same rate at which liquid is boiling to
vapor. Simply stated, phase equilibrium is a condition where the liquids and vapors have reached certain
pressure and temperature conditions at which they can separate. In most production systems, true
equilibrium is never actually reached; however, vapors and liquids move through the system slow enough
that a “pseudo” or “quasi” equilibrium is assumed. This assumption simplifies process calculations.
Figure 2-1 illustrates several operating points on a generic phase equilibrium diagram. Point A represents
the operating pressure and temperature in the petroleum reservoir. Point B represents the flowing
conditions at the bottom of the production tubing of a well. Point C represents the flowing conditions at the
wellhead. Typically, these conditions are called flowing tubing pressure (FTP) and flowing tubing
temperature (FTT).
Point D represents the surface conditions at the inlet of the first separator.
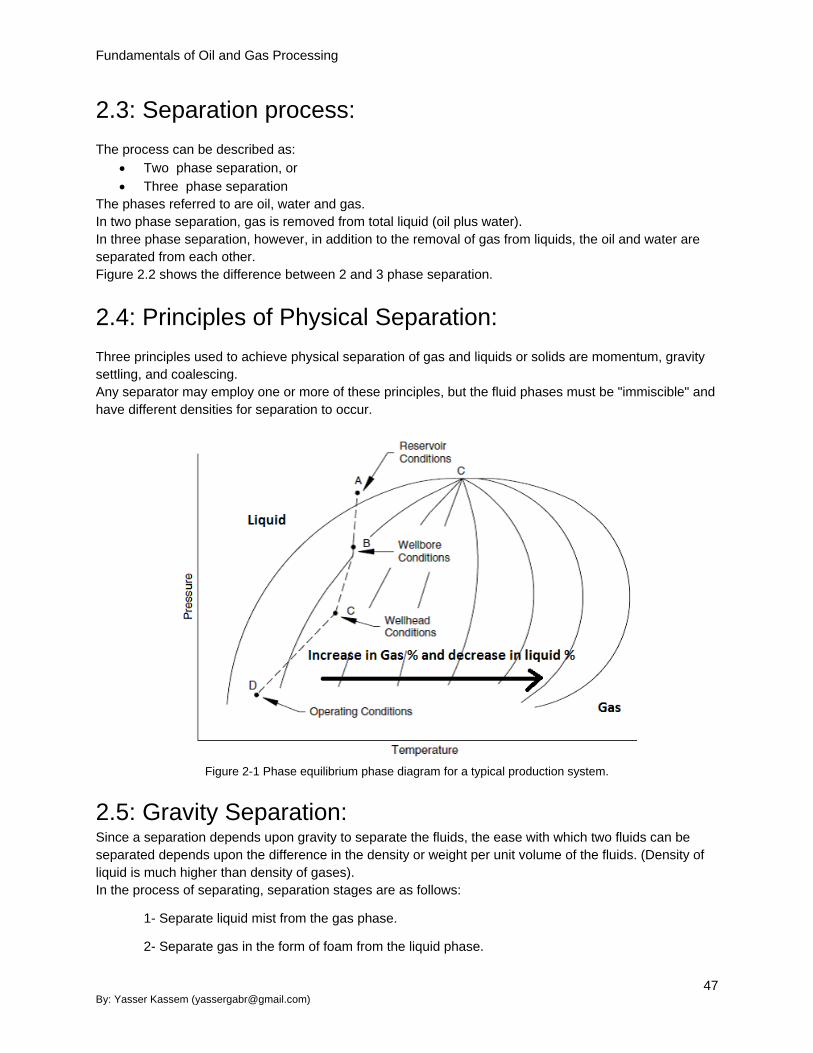
Fundamentals of Oil and Gas Processing
47 By: Yasser Kassem ([email protected])
2.3: Separation process:
The process can be described as:
Two phase separation, or
Three phase separation
The phases referred to are oil, water and gas.
In two phase separation, gas is removed from total liquid (oil plus water).
In three phase separation, however, in addition to the removal of gas from liquids, the oil and water are
separated from each other.
Figure 2.2 shows the difference between 2 and 3 phase separation.
2.4: Principles of Physical Separation:
Three principles used to achieve physical separation of gas and liquids or solids are momentum, gravity
settling, and coalescing.
Any separator may employ one or more of these principles, but the fluid phases must be "immiscible" and
have different densities for separation to occur.
Figure 2-1 Phase equilibrium phase diagram for a typical production system.
2.5: Gravity Separation: Since a separation depends upon gravity to separate the fluids, the ease with which two fluids can be
separated depends upon the difference in the density or weight per unit volume of the fluids. (Density of
liquid is much higher than density of gases).
In the process of separating, separation stages are as follows:
1- Separate liquid mist from the gas phase.
2- Separate gas in the form of foam from the liquid phase.

Fundamentals of Oil and Gas Processing
3- In case of 3 phase separation, in addition to the above two requirements, water droplets should
be separated from oil phase, and oil droplets should be separated from water phase.
Figure 2.2 The Difference between 2 & 3 Phase Separation.
Droplets of liquid mist will settle out from gas, provided:
The gas remains in the separator long enough for mist to drop out.
The flow of the gas through the separator is slow enough that no turbulence occurs, which will keep
the gas stream stirred up so that the liquid has no chance to drop out.
The objective of ideal two-phase separation, is to separate the hydrocarbon stream into liquid-free gas
and gas-free-liquid. Ideally, the gas and liquid reach a state of equilibrium at the existing conditions of
Pressure and Temperature within the vessel.
Liquid droplets will settle out of a gas phase due to the difference in densities if the gravitational force
acting on the droplet is greater than the drag force of the gas flowing around the droplet (see Fig. 2-3).
The drag force is the force resulted from the velocity of gas and affecting the entrained droplet of liquid,
forcing it to move in the gas flow direction.
Fig. 2-3 A schematic of a force balance on a droplet in a flowing gas stream.

Fundamentals of Oil and Gas Processing
49 By: Yasser Kassem ([email protected])
Figure.9-6. Rupture disk.
Figure. 9-7. Relief valve and safety relief valve
Fundamentals of Oil and Gas Processing
Fundamentals of Oil and Gas Processing
References. 1- Gas Processors Suppliers Association GPSA Engineering Data Book 11th, 12th, & 15th Editions.
Tusla, OK.
2- Arnold, K. and Stewart, M., Surface prod operations V1_ 2E, Surface prod operations V2_ 2E, &
Surface prod operations V1_ 3E, Gulf Publishing Co., Richardson, TX.
3- Abdel-Aal, H. K., Surface Petroleum Operations, Saudi Publishing & Distributing House, Jeddah,
1998.
4- H.K. Abdel-Aal and Mohamed Aggour, Petroleum and gas field processing, 2003 by Marcel
Dekker, Inc.
5- Crude-Oil-Treating-Systems-Design-Manual-Sivalls-Inc.
6- API Spec. 12J (Specification of Oil and Gas Separator) 7th.ed. Oct. 1998.
7- API Spec. 12K (Indrict Fired Heater) 7th.ed.Jun.1989.
8- API Spec. 12L (Vertical and Horizental Emulsion Treater) 4th ed. Nov. 1994.
9- API Std. 560 (Fired Heaters for General Refinery Service) 3rd. ed. May 2001
10- Standard Handbook of Petroleum and Natural Gas 2nd ed. William C. Lyons, Ph.D., P.E. Gary J.
Plisga, B.S. 2005, Elsevier Inc.
11- Gas Pipeline Hydraulics, E. Shashi Menon, P.E. PDH Engineering course material.
12- Chilingarian, G. V., Robertson, J. O., Jr., and Kumar, S., Surface Operations in Petroleum
Production, I, 1987, Elsevier Science, Amsterdam.
13- The Chemistry and Technology of Petroleum, James G. Speight
14- Flow Management for Engineers and Scientists, Nicholas P. Cheremisinoff and Paul N.
Cheremisinoff.
15- Al-Tahini, A., Crude oil Emulsions, Co-op Report, Department of Chemical Engineering, KFUPM,
Dhahran, Saudi Arabia, 1996.
16- Thro, M. E. and Arnold, K. E., Water droplet size determination for improved oil treater sizing,
SPE 69th Annual Technical Conference and Exhibition, 1994.
17- Basseler, O. U., De-emulsification of Enhanced Oil Recovery Produced Fluids, Tretolite Div.,
Petrolite Corp., St. Louis, MO, 1983.
18- Manning, F. S. and Thomson, R., Oil-Field Processing of Petroleum, Penn-well Publishing, Tulsa,
OK, 1991.
19- Campbell, John M., ‘‘Gas Conditioning and Processing,’’ Vol. 2, published by Campbell
Petroleum Series, Norman, Oklahoma, 1976.
Book Site

Fundamentals of Oil and Gas Processing
51 By: Yasser Kassem ([email protected])
https://www.amazon.com/Yasser-
Kassem/e/B07KXLM5RZ?ref=dbs_
p_pbk_r00_abau_000000


![Crude Assay Report · 15 Vacuum Gas Oil Cuts - Gas Oil [325-370°C] 15 16 Vacuum Gas Oil Cuts - Gas Oil 1[370 - 540°C] 16 17 Vacuum Gas Oil Cuts - Heavy Vacuum Gas Oil [370 - 548°C]](https://img.dokumen.tips/doc/110x75/5e68681c2598ff04995c67bc/crude-assay-report-15-vacuum-gas-oil-cuts-gas-oil-325-370c-15-16-vacuum-gas.jpg)