Embed Size (px)
Citation preview
Authentication Using Pulse-Response Biometrics
Kasper B. RasmussenUniversity of California, Irvine
Computer Science [email protected]
Marc RoeschlinUniversity of California, Irvine
Computer Science [email protected]
Ivan MartinovicUniversity of Oxford
Computer Science [email protected]
Gene TsudikUniversity of California, Irvine
Computer Science [email protected]
Abstract—We propose a new biometric based on the humanbody’s response to an electric square pulse signal, that we callpulse-response. We explore how this biometric can be used toenhance security in the context of two example applications: (1)as an additional authentication mechanism in PIN entry systems,and (2) as a continuous authentication mechanism on a secureterminal. The pulse-response biometric is effective because eachhuman body exhibits a unique response to a signal pulse appliedat the palm of one hand, and measured at the palm of the other.Using a prototype setup, we show that users can be correctlyidentified, with high probability, in a matter of seconds. Thisidentification mechanism integrates very well with other well-established methods and offers a reliable additional layer ofadditional security, either on a continuous basis or at login time.We build a proof-of-concept prototype and perform experimentsto validate the feasability of using pulse-response as a biometric.Our results are very encuraging: we achieve accuracies of 100%over a static data set and 88% over a data set with samples takenover several weeks.
I. INTRODUCTION
Many modern access control systems augment the traditionaltwo-factor authentication procedure (something you know andsomething you have) with a third factor: “something you are”,i.e., some form of biometric authentication. This additional layerof security comes in many flavors: from fingerprint readers onlaptops used to facilitate easy login with a single finger swipe,to iris scanners used as auxiliary authentication for accessingsecure facilities. In the latter case, the authorized user typicallypresents a smart card, then types in a PIN, and finally performsan iris (or fingerprint) scan.
In this paper, we propose a new biometric based on thehuman body’s response to a square pulse signal. We considertwo motivating sample scenarios:
The first is the traditional access control setting describedabove where the biometric is used as an additional layer ofsecurity when a user enters a PIN, e.g., into a bank ATM. Thepulse-response biometric facilitates unification of the steps ofPIN entry and biometric capture. We use PIN entry as a runningexample for this scenario throughout the paper. This is becausePIN pads are often made of metal, which makes capturing
pulse-response biometric straightforward: a user would placeone hand on a metal pad adjacent to the key-pad, while usingthe other hand to enter a PIN. The metal pad would transmit thepulse and a sensor in the PIN pad would capture the biometric.
The second scenario corresponds to continuous authenti-cation. One example is verifying that the user, who securelylogged in earlier, is still the same person currently present atthe keyboard. To address this problem, we need a mechanismthat continuously monitors the user’s biometrics. However, forobvious usability reasons, this must be done unobtrusively.The pulse-response biometric is particularly well-suited for thissetting. Assuming that it can be made from – or coated by –some conductive material, the keyboard would generate thepulse signal and measure response, while the user (remainingoblivious) is typing. The main idea is that the user’s pulse-response is captured at login time and identity of the personcurrently at the keyboard can be verified transparently, at desiredfrequency.
The continuous authentication problem is particularly dif-ficult to solve using traditional biometrics. For example, iffingerprints are used instead of pulse-response, the user wouldhave to interrupt work to periodically swipe a finger on ascanner, which would be very disruptive. There have beensome attempts to solve this problem using a webcam and facerecognition [12], [21], [23]. However, such systems can befooled by a photo of the legitimate user and they also requirethe user to keep the head in a more-or-less constant position,unless a more advanced head tracking system is used.
To assess efficacy and feasibility of the pulse-responsebiometric, we built a platform that enables us to gather pulse-response data. Its main purpose is to verify that we can identifyusers from a population of test subjects. We also used it totest the distinguishing ability and stability of this biometricover time. We also explored two systems that apply the pulse-response biometric to the two sample scenarios discussed above:one to unobtrusively capture the biometric as an additional layerof security when entering a PIN, and the other – to implementcontinuous authentication.
The rest of the paper is organised as follows: Section IIprovides some background on biometrics and presents ourdesign goals. Section III describes the pulse-response biometricin detail. Sections IV and V present the PIN entry andcontinuous authentication systems, respectively. Section VIdescribes the biometric data capture setup and Section VIIpresents experimental results. Related work is overviewed inSection VIII and the paper concludes with Section IX.
Permission to freely reproduce all or part of this paper for noncommercialpurposes is granted provided that copies bear this notice and the full citationon the first page. Reproduction for commercial purposes is strictly prohibitedwithout the prior written consent of the Internet Society, the first-named author(for reproduction of an entire paper only), and the author’s employer if thepaper was prepared within the scope of employment.NDSS ’14, 23-26 February 2014, San Diego, CA, USACopyright 2014 Internet Society, ISBN 1-891562-35-5http://dx.doi.org/doi-info-to-be-provided-later
II. BACKGROUND
This section provides some biometrics background andsummarizes the terminology used throughout the paper. Then,design goals are presented.
A. Biometrics
The meaning of the term biometric varies depending on con-text. The US National Science & Technology Council’s (NSTC)Subcommittee on Biometrics describes its two valid meanings:(1) a measurable biological (anatomical and physiological) andbehavioral characteristic that can be used for automated recog-nition of individuals, (2) an automated method of recognizingan individual based on measurable biological (anatomical andphysiological) and behavioral characteristics [6]. Throughoutthe rest of this paper we use biometric in the former sense, i.e.,as a characteristic of a particular individual.
The US National Institute of Standards and Technology(NIST) divides biometric measurements into two categories [25],physiological and behavioural. The former relies on the physiol-ogy of a person and includes: fingerprints, hand geometry, facialrecognition, speech analysis, and iris/retina scans. Behavioralbiometrics is based on user behaviour and includes: keystroketimings, speech pattern analysis, gait recognition, and analysisof stylus pressure, acceleration and shape in hand-writing.
Physiological biometrics can help identify an individualfrom a large pool of candidates. However, there are somecaveats. In general, physiological biometrics are consideredmoderately difficult to circumvent. For example, although handgeometry is very stable over the course of one’s adult life, itdoes not provide enough distinguishing power to be used as theonly means for identification [6]. Also, some facial recognitionsystems can be fooled by an appropriately-sized photo of alegitimate user. This is certainly a weakness if facial recognitionis used to unlock a smartphone. On the other hand, the failuremight not be due to the biometric itself but to inadequacy ofcurrent technology.
Behavioral biometrics measure user actions over time,meaning that, for each action, there must be a beginning, anend, and a duration. Consequently, behavioural biometrics in-directly measure characteristics of the human body. Behavioralbiometrics are learned and, therefore, can be also re-learned.However the consensus in the literature seems to be, thatafter reaching a certain age, changes in behaviour becomemore difficult to achieve, even with specific and sustainedeffort [31]. Behavioural biometrics can therefore be regardedas valid biometric identifiers, even though they are neither asunique, nor as permanent as physiological biometrics. In mostcases, behaviour biometrics are used to discern a user from asmall(er) pool of candidates. One advantage is that they areless invasive and therefore more user-friendly. For example, asystem that analyses keystroke timings or speech patterns canusually do so in the background. Whereas, an iris or fingerprintscan mandates specific user actions.
There is an ongoing debate about whether DNA constitutes avalid biometric. As a measurable part of the human physiology,it can very accurately identify an individual. In that sense, it iscertainly a physiological biometric. However according to mostdefinitions, e.g., [6], a biometric must be a characteristic that
can be used for automated recognition of individuals. Thus,DNA’s labeling as a biometric is questionable, at least forthe time being. Albeit, one could imagine a future technologywhereby DNA samples are continuously taken (and analyzed)from a user typing at a keyboard, e.g., by sampling body oilssecreted by fingertips.
B. Biometric Authentication vs. Identification
Authentication refers to identify confirmation or verification.When a user claims a certain identity (e.g., by inserting a cardinto an ATM or entering a userid into a terminal, and thentyping in a PIN or a password) authentication entails decidingwhether the claim is correct. The goal of the biometric classifieris to compare the current sample to the known template forthat user. The classifier returns the likelihood a match. We referto this kind of comparison as 1:1.
Authentication differs from identification, where the currentsample comes from an unknown user, and the job of thebiometric classifier is to match it to a known sample. We callthis a 1:n comparison. Identification is further divided into twotypes: open-set and closed-set.1 We say that an identificationis closed-set, if it is known a priori that the user is in theclassifier’s database, i.e., the classifier must choose the bestmatch from a pool of candidates. Otherwise, we refer to it asopen-set identification.
C. Design Goals
When designing a new biometric system it is important totake into account lessons learned from past and current systems.There are good discussions of design goals for biometricsystems in the literature, e.g., [14]. Ours are as follows:
Universal: The biometric must be universally applicable,to the extent required by the application. For example, if afingerprint reader is added as an additional level of accesscontrol, what to do about people that are missing all or somefingers? It is important for the biometric to apply to everyoneintended to use the system.
Unique: The biometric must be unique within the targetpopulation. Measuring someones height would not work asan identification mechanism on a large scale. At the sametime, (adult) height alone can usually identify individual familymembers.
Permanent: The biometric must be consistent over the timeperiod where it’s used. Very few biometrics will stay constantover a lifetime, e.g., face geometry, voice, gait and writing.However, as long as the biometric is consistent over the lifetimeof the system, these biometrics work well.
Unobtrusive: A good biometric should be maximallyunobtrusive. If the user can be identified passively, withoutinterference, the biometric is much more likely to be accepted.
Difficult to circumvent: This is essential for a biometric inany security context. Ideally, a user should be unable to changethe biometric at all. Moreover, it must certainly be the case thata user can not modify the biometric to match that of anotheruser.
1See, for example, http://www.biometrics.gov/documents/biointro.pdf
2
An additional common design goal that we achieve “forfree” is Collectability. It means that the biometric can bemeasured quantitatively. Since pulse-response biometric isbased on measuring an electronic signal, no extra featuresare needed to achieve this goal.
There are a few other goals commonly found in the literaturethat we do not emphasize here:
Acceptability: The biometric is one that users are likelyto feel comfortable with. It is hard to predict what users willor will not be comfortable with. Clearly, acceptability is asensible design goal but it is one that we are not able to makesignificant claims about, so we have chosen not to present itas a requirement.
Cost Effectiveness: The relationship between the distinguish-ing power of the biometric and its deployment and maintainancecosts. Since we focus on assessment of a new biometric andbuilding a prototype, it is premature to seek insights aboutcosts of a possible commercial system.
The same argument applies for Performance: the biometricshould require minimal resources.
III. PULSE-RESPONSE BIOMETRIC
The pulse-response biometric works by applying a lowvoltage pulse signal to the palm of one hand and measuringthe body’s response in the palm of the other hand. The signaltravels up through the user’s arm, across the torso, and downthe other arm. The biometric is captured by measuring theresponse in the user’s hand. This response is then transformedto the frequency domain via Fast Fourier Transform (FFT).This transformation yields the individual frequency components(bins) of the response signal, which form raw data that isthen fed to the classifier. Working in the frequency domaineliminates any need for aligning the pulses when they aremeasured. Details of our measurement setup and experimentscan be found in Section VII.
The main reason for this biometric’s ability to distinguishbetween users is due to subtle differences in body conductivity,at different frequencies, among different people. When a signalpulse is applied to one palm and measured in the other, thecurrent has to travel through the body tissue – blood vessels,muscle, fat tissue, cartilage and bones – to reach the otherhand. Differences in bone structure, muscle density, fat contentand layout of blood vessels, result in slight differences inthe attenuation of the signal at different frequencies. Thesedifferences show up as differences in the magnitude of thefrequency bins after the FFT. This is what allows us todistinguish between individuals.
Pulse-response is a physiological biometric since it measuresa person’s physiological characteristics, rather than how thatperson behaves. However, it has an attractive property normallyassociated with behavioral biometrics: it can be captured in acompletely passive way. Although some other biometrics alsohave this passive capture property, e.g., face recognition, pulse-response is not as easily circumventable. The combination ofunobtrusiveness and difficulty to circument makes it a veryattractive identification mechanism. Essentially it offers the bestproperties of both physiological and behavioral biometrics.
At the same time, pulse-response requires special-purposehardware. The same is true any other physiological biometric.For example, fingerprints need a fingerprint reader, facerecognition requires a precision camera and hand geometry– a scanner. Since pulse-response is captured using electricalsignals, there are few restrictions on the exact constructionof the biometrics capture hardware. We explore this issue inSections IV and V.
A. Liveness and Replay
A common problem with many biometric systems is livenessdetection, i.e., determining whether the biometric samplerepresents a “live” user or a replay. For example, a fingerprintreader would want to detect whether the purported user’sfingerprint was produced by a real finger attached to a human,as opposed to a fingerprint mold made of putty or even asevered finger. Similarly, a face recognition system would needto make sure that it is not being fooled by a user’s photo. Moredetails and concrete examples are given in Section VIII).
In traditional biometric systems, liveness is usually ad-dressed via some form of active authentication, e.g., a challenge-response mechanism. In a face recognition system a user mightbe asked to turn his head or look at a particular point duringthe authentication process. Although this reduces the chance ofa photo passing for the real person, the user is forced to takeactive part in the process, which can be disruptive and annoyingif authentication happens on a continuous basis. Also, a good3-D model of a human head can still fool such measures.
Fingerprint scanners often include some protection againstreplay. This might be accomplished by detecting other charac-teristics normally associated with a live finger, e.g., temperature,or presence of sweat or skin oils. Such counter-measures makeit more difficult to use skin-tight gloves or a “cold dead fingers”to fool the biometric system. Still, replay remains a majorchallenge, especially, for low-end fingerprint readers.
In the context of the pulse-response biometric, unlike finger-prints or face recognition, it is difficult (but not impossible) toseparate the biometric from the individual to whom it belongs.If the adversary manages to capture a user’s pulse-response onsome compromised hardware, replaying it successfully wouldrequire specialized hardware that mimics the exact conductivityof the original user. We believe that this is feasible: theadversary can devise a contraption that consists of flat adhesive-covered electrodes attached to each finger-tip (five for eachhand going into one terminal) with a single wire connectingthe two terminals. The pulse response of the electrode-wire-electrode has to exactly replicate that of the target user. Havingattached electrodes to each finger-tip, the adversary can type onthe keyboard and the system could thus be effectively fooled.However, the effort required is significantly harder than in casesof facial recognition (where a photo suffices) or fingerprints,which are routinely left (and can be lifted from) numerousinnocuous locations.
Furthermore, in contrast to face or fingerprint biometrics,pulse-response can be made to depend on the capture platform.Thus, even if the adversary captures this biometric on one pieceof hardware, it would not mach the user’s measurements on adifferent measurement (capturing) system. One way to achievethis is to add a specific (frequency-dependent) resistance to
3

the measurement platform, i.e., electrodes and/or wiring. If theadversary uses its own capture system to measure the user,there is an additional signature which is actually part of thepulse-response reader.
Finally, the real power of the pulse-response biometricis evident when used for continuous authentication (seeSection V). Here, the person physically uses a secure terminaland constantly touches the keyboard as part of routine work.Authentication happens on a continuous basis and it is notfeasible to use the terminal while at the same time providingfalse input signals to the authentication system. Of course, theadversary could use thick gloves, thereby escaping detection,but the authentication system will see input from the keyboardwithout the expected pulse-response measurement to accompanyit, and will lock the session.
B. Ethics and User Safety
As mentioned above, the pulse-response biometric iscaptured by applying low voltage to one hand of the userand measuring the resulting signal in the other. This involvescurrent flowing through significant portions of the human body.This process naturally raises questions about user safety andethics. We believe that these are important issues that need tobe addressed. The issue of safety might be compounded byusers having undocumented or undisclosed medical conditions,including implantable medical devices, e.g., pacemakers, orother devices that may be adversely affected by applying anexternal signal to the body.
Two primary causes for concern are voltage and currentlevels that are applied to a user. An average healthy humanbeing can easily withstand farily high voltage levels (≥ 500/ V )provided that the current level is low. Strength of currentsent through the body is of greater importance to humansafety. Studies have shown that currents as low 1 mA canbe perceived as slight tingling and currents as low as 5 mAare uncomfortable [28]. For this reason we chose to add a10 kΩ output resistor to our signal generator, to act as a currentlimiting device. The 10 kΩ resistor insures that – even if theoutput terminals of the signal generator are shorted out – themaximum current strength will not exceed 0.1 mA per voltof input signal. Our initial experiments were done using threedifferent voltage levels: 1V, 5V and 10V. The 5V and 10Vlevels where used on a small set of volunteers as a parametersearch, in order to identify the minimal voltage level for thebiometric to work. It quickly became apparent that very goodresults could be obtained using only a 1V signal.
The amount of current that a particular voltage induces inthe human body varies from person to person and dependson external conditions. For example, if a subject’s hands arewet, conductivity is significantly higher (i.e., resistance issignificantly lower) than with dry hands. The same is trueif the subject’s hands have cuts or broken skin close to wherethe signal is applied. If resistance is lowered, current strengthincreases according to Ohm’s law. Normal resistance of thehuman body is between 1, 000 and 5, 000 Ω. However, even inextreme conditions, resistance does not drop bellow 500 Ω. Withour current limiting resistor on the signal generator, the worstcase current (with 10V test signal) is 10V/10.5kΩ = 0.95 mA,which is bellow the sensitivity limit. The vast majority of
subjects were only exposed to a 1V signal, which translatesinto the worst case current strength of 0.095 mA.
All subjects were given detailed information about the natureof the experiment beforehand and all were given the opportunityto opt out. None expressed any discomfort or, in fact, anyperception of the current during the experiments.
We note that many commercial systems and products involveapplying a similar (or higher) voltage to humans. For example,so-called “touch lamps” (popular since 1970-s) turn on and offwhenever the user touches the metal frame. The lamp’s touchdetection mechanism works by having the user close an electriccircuit between the lamp and the ground, i.e., the current takesa path similar to that in our pulse-response capture system.The magnitude of the signal (1-6V) used in touch lamps issimilar to our case. Such lamps are commercially availableand are known to be safe for people, even those who have aheart condition or implanted medical devices. Another relatedhousehold product example is a wall-mounted touch-based lightswitch (although some of those are capacitive touch sensors).
Another point of comparison is a regular 9V battery. Theinternal resistance of a 9V battery varies depending on thetype (e.g., zinc carbon, lithium, alkaline) between 1 Ω and20 Ω. Consequently, the safest of these (with the highestinternal resistance) can deliver 9V/20Ω = 450mA currentif the terminals are shorted out. This is a much stronger currentthan in our setup, even in the worst case. Meanwhile, theterminals of a typical 9V battery are not protected. The reasonis that such voltage and current levels are considered to becompletely safe for humans.
IV. COMBINING PIN ENTRY WITH BIOMETRIC CAPTURE
This section describes how to use pulse-response to enhancesecurity of PIN entry systems without inconveniencing the user.
A. System and Adversary Models of PIN Entry Scheme
We use a running example of a metal PIN key-pad with anadjacent metal pad for the user’s other hand. The PIN key-padhas the usual digit (0-9) buttons as well as an “enter” button.It also has an embedded sensor that captures the pulse-signaltransmitted by the adjacent metal pad. We can envisage thissetup in the setting of a bank ATM allowing authorized usersto withdraw cash.
The goal of the adversary is to impersonate an authorizeduser and withdraw cash. We assume that the adversary can notfool the pulse-response classifier with probability higher thanthat found in our experiments described in Section VII.
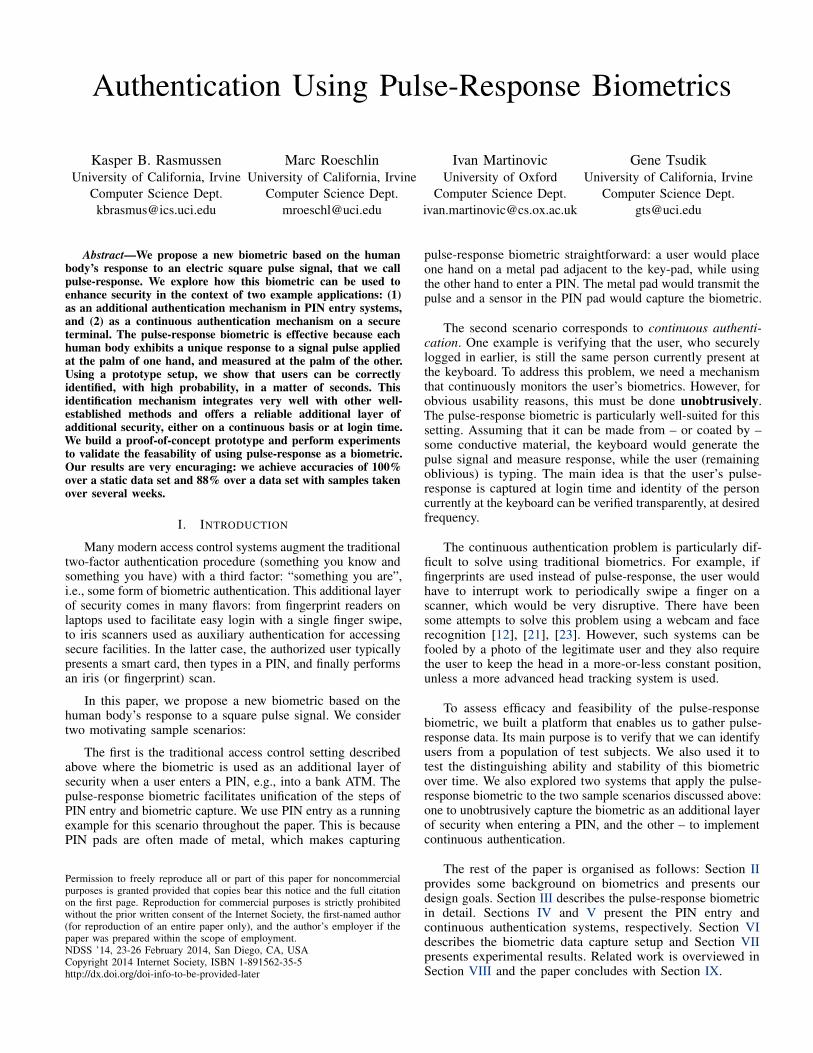
We assume that the ATM is equipped with a modified au-thentication module which, besides verifying the PIN, capturesthe pulse-response biometric and determines the likelihood ofthe measured response corresponding to the user identified bythe previously inserted ATM card and the entered PIN. Thismodule works as depicted in Figure 1. We assume that theATM has access to a database of valid users, either locally orover a network. Alternatively, the user’s ATM card can containdata needed to perform pulse-response verification. If stored onthe card, this data must be encrypted and authenticated usinga key known to the ATM; otherwise, the adversary (who canbe assumed to be in possession of the card) could replace itwith data matching its own pulse-response.
4
End
Start Is PINCorrect?
Accept! Reject!Does
pulse-responsematch?
No
No
Yes
Yes
Fig. 1. ATM decision flowchart.
B. PIN Entry Scheme
The ATM has to determine whether data sampled from theuser while entering the PIN, is consistent with that stored inthe database. This requires the use of a classifier that yields thelikelihood of a sample coming from a known distribution. Thelikelyhood is used to determine whether the newly measuredsamples are close enough to the samples in the database toproduce a match. Using our prototype, we can make suchdecisions with high confidence. (See Section VII-D.)
Before we look at the security of the pulse-response PINentry system, we need to make sure that it meets our designgoals.
Universal. A person using the present PIN entry systemmust use both hands, one placed on the metal pad and oneto enter the pin. This requires the user two actually have twohands. Whereas, a normal PIN entry system can be operatedwith one hand; thus, universality of our system is somewhatlower. This is a limitation of the biometric, although a remedycould be to store a flag on the user’s ATM card indicating thata disability, thus exempting this person from the pulse-responsecheck. This would allows our approach to gracefully degradeto a generic PIN entry system.
Unique and Permanent. In Section VII-D we show thatour prototype can determine, with high probability, whether asubject matches a specific pulse-response. Thus, it is extremelyunlikely for two people to exhibit exactly the same pulse-response. We also show that an individual’s pulse-responseremains fairly consistent over time.
Unobtrusive. The proposed scheme is very unobtrusive.From the user’s perspective, the only thing that changes fromcurrent operation is the added requirement to place the free(not used for PIN entry) hand on a metal pad. There can evenbe two such pads accommodating both left- and right-handedpeople. Also, the ATM screen could display system usageinstructions, even pictorially to accommodate people who cannot read. Similarly, audio instructions could be given for thesake of those who are vision-impaired.
Difficult to circumvent. Given that pulse-response is unique,the only other way to circumvent it is to provide the sensor(built into the PIN pad) with a signal that would correspond tothe legitimate user. Although this is very hard to test precisely,assuming that the adversary is unaware of the target user’s
pulse-response measurements, the task seems very difficult, ifnot impossible.
C. Security Analysis of PIN Entry Scheme
The additional layer of security provided by the pulse-response biometric is completely independent from securityof the PIN entry system alone. For this reason, we model theprobability Pbreak that the proposed PIN entry system can besubverted, as follows:
Pbreak = Pguess · Pforge
where Pguess is the probability of the adversary correctlyguessing the PIN and Pforge is the average probability thatthe adversary can fool the classifier. We model this as thefalse positive rate divided by the number of users. If a PINconsists of n decimal digits and the adversary has t guessesthen Pguess = t
10n . The false positive rate is the complementof specificity [30] In Section VII-D, we determine specificityto be 88%. Thus Pforge = (1 − 0.88)/5, which yields thecombined probability:
Pbreak =(1− 0.88)t
5 · 10n
For example, if the adversary is allowed 3 guesses with a 4-digitpin, Pbreak = 7.2·10−6, whereas a 4-digit plain-PIN system hasa subversion probability of 3 · 10−4. Though this improvementmight not look very impressive on its own, it is well knownthat most PIN attacks are performed by “shoulder surfing” anddo not involve the adversary guessing the PIN. If we assumethat the adversary already knows the PIN, Pbreak = 2.4% withour system, as opposed to 100% without it.
V. CONTINUOUS AUTHENTICATION
We now present a continuous authentication scheme. Itsgoal is to verify that the same user who initially (and securely)logged into a secure terminal, continues to be physically presentat the keyboard. Here, the pulse response biometric is no longerused as an additional layer of security at login time. Rather,the user’s pulse-response biometric is captured at login timeand subsequent measurements are used to authenticate the userusing the initial reference.
A. System and Adversary Models for Continuous Authentication
We continue using the example for continuous authenti-cation introduced in Section I. This example entails a secureterminal where authorized users can login and access sensitivedata. We use this example throughout this section to makeit easier to present the details of our system. However,applicability of continuous authentication via pulse response isnot limited to this specific scenario.
The system consists of a terminal with a special keyboardthat can send out pulse signals and capture the pulse-responsebiometric. This requires that the keyboard must be either madefrom, or coated by, a conductive material. Alternatively, thepulse signal transmitter could be located in a mouse that the useroperates with one hand and the keyboard could then containthe mechanism that captures the pulse-response. Without lossof generality, we will assume that the keyboard contains boththe pulse transmitter and the receiver. Otherwise, the keyboard
5
Reacquirepulse-response
Doespulse-response
match?Wait
Takeaction.
End
Policydatabase
Start
Wait for login.Get pulse-response
reference.
No
Yes
Pulse-responsedatabase
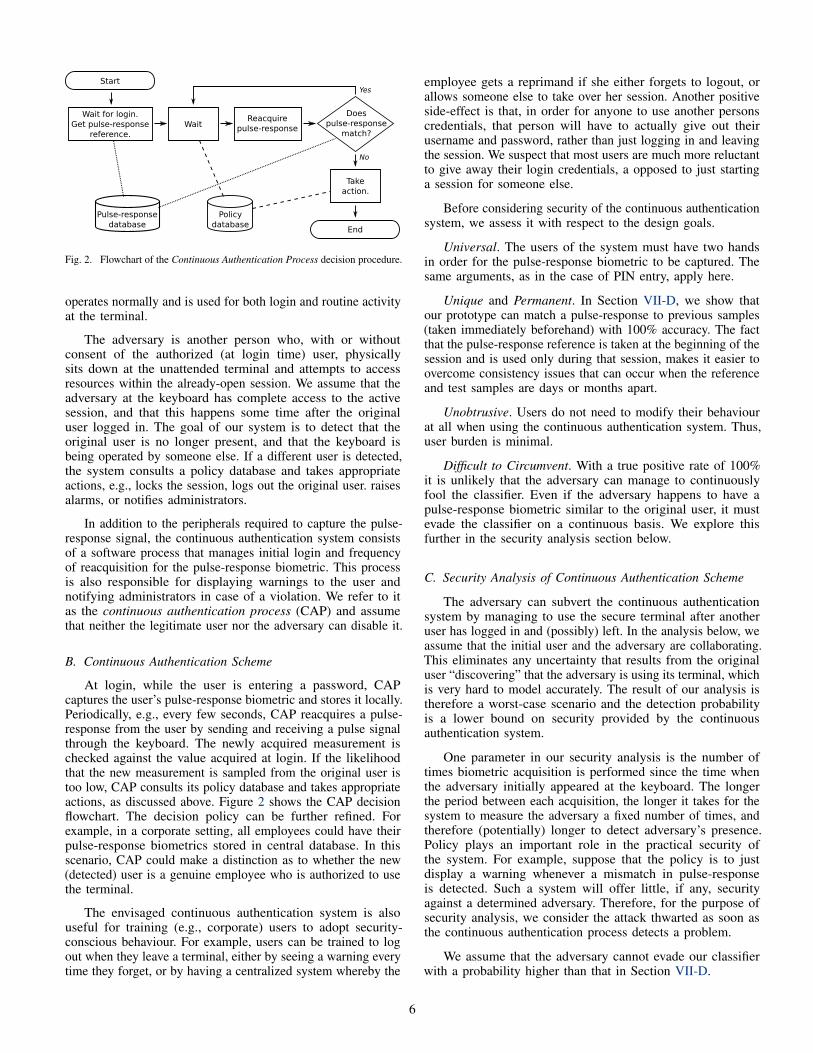
Fig. 2. Flowchart of the Continuous Authentication Process decision procedure.
operates normally and is used for both login and routine activityat the terminal.
The adversary is another person who, with or withoutconsent of the authorized (at login time) user, physicallysits down at the unattended terminal and attempts to accessresources within the already-open session. We assume that theadversary at the keyboard has complete access to the activesession, and that this happens some time after the originaluser logged in. The goal of our system is to detect that theoriginal user is no longer present, and that the keyboard isbeing operated by someone else. If a different user is detected,the system consults a policy database and takes appropriateactions, e.g., locks the session, logs out the original user. raisesalarms, or notifies administrators.
In addition to the peripherals required to capture the pulse-response signal, the continuous authentication system consistsof a software process that manages initial login and frequencyof reacquisition for the pulse-response biometric. This processis also responsible for displaying warnings to the user andnotifying administrators in case of a violation. We refer to itas the continuous authentication process (CAP) and assumethat neither the legitimate user nor the adversary can disable it.
B. Continuous Authentication Scheme
At login, while the user is entering a password, CAPcaptures the user’s pulse-response biometric and stores it locally.Periodically, e.g., every few seconds, CAP reacquires a pulse-response from the user by sending and receiving a pulse signalthrough the keyboard. The newly acquired measurement ischecked against the value acquired at login. If the likelihoodthat the new measurement is sampled from the original user istoo low, CAP consults its policy database and takes appropriateactions, as discussed above. Figure 2 shows the CAP decisionflowchart. The decision policy can be further refined. Forexample, in a corporate setting, all employees could have theirpulse-response biometrics stored in central database. In thisscenario, CAP could make a distinction as to whether the new(detected) user is a genuine employee who is authorized to usethe terminal.
The envisaged continuous authentication system is alsouseful for training (e.g., corporate) users to adopt security-conscious behaviour. For example, users can be trained to logout when they leave a terminal, either by seeing a warning everytime they forget, or by having a centralized system whereby the
employee gets a reprimand if she either forgets to logout, orallows someone else to take over her session. Another positiveside-effect is that, in order for anyone to use another personscredentials, that person will have to actually give out theirusername and password, rather than just logging in and leavingthe session. We suspect that most users are much more reluctantto give away their login credentials, a opposed to just startinga session for someone else.
Before considering security of the continuous authenticationsystem, we assess it with respect to the design goals.
Universal. The users of the system must have two handsin order for the pulse-response biometric to be captured. Thesame arguments, as in the case of PIN entry, apply here.
Unique and Permanent. In Section VII-D, we show thatour prototype can match a pulse-response to previous samples(taken immediately beforehand) with 100% accuracy. The factthat the pulse-response reference is taken at the beginning of thesession and is used only during that session, makes it easier toovercome consistency issues that can occur when the referenceand test samples are days or months apart.
Unobtrusive. Users do not need to modify their behaviourat all when using the continuous authentication system. Thus,user burden is minimal.
Difficult to Circumvent. With a true positive rate of 100%it is unlikely that the adversary can manage to continuouslyfool the classifier. Even if the adversary happens to have apulse-response biometric similar to the original user, it mustevade the classifier on a continuous basis. We explore thisfurther in the security analysis section below.
C. Security Analysis of Continuous Authentication Scheme
The adversary can subvert the continuous authenticationsystem by managing to use the secure terminal after anotheruser has logged in and (possibly) left. In the analysis below, weassume that the initial user and the adversary are collaborating.This eliminates any uncertainty that results from the originaluser “discovering” that the adversary is using its terminal, whichis very hard to model accurately. The result of our analysis istherefore a worst-case scenario and the detection probabilityis a lower bound on security provided by the continuousauthentication system.
One parameter in our security analysis is the number oftimes biometric acquisition is performed since the time whenthe adversary initially appeared at the keyboard. The longerthe period between each acquisition, the longer it takes for thesystem to measure the adversary a fixed number of times, andtherefore (potentially) longer to detect adversary’s presence.Policy plays an important role in the practical security ofthe system. For example, suppose that the policy is to justdisplay a warning whenever a mismatch in pulse-responseis detected. Such a system will offer little, if any, securityagainst a determined adversary. Therefore, for the purpose ofsecurity analysis, we consider the attack thwarted as soon asthe continuous authentication process detects a problem.
We assume that the adversary cannot evade our classifierwith a probability higher than that in Section VII-D.
6
Detected
Passedbiometric
test
"Start"Adv sitsdown
1 2
3
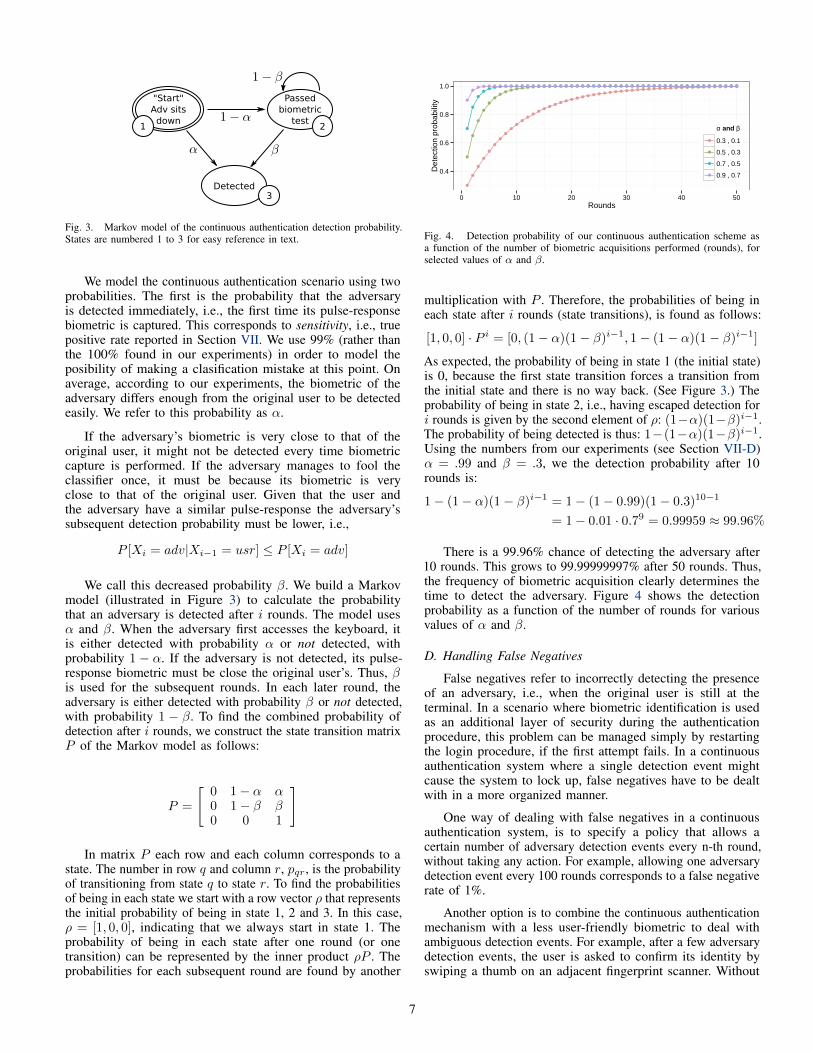
Fig. 3. Markov model of the continuous authentication detection probability.States are numbered 1 to 3 for easy reference in text.
We model the continuous authentication scenario using twoprobabilities. The first is the probability that the adversaryis detected immediately, i.e., the first time its pulse-responsebiometric is captured. This corresponds to sensitivity, i.e., truepositive rate reported in Section VII. We use 99% (rather thanthe 100% found in our experiments) in order to model theposibility of making a clasification mistake at this point. Onaverage, according to our experiments, the biometric of theadversary differs enough from the original user to be detectedeasily. We refer to this probability as α.
If the adversary’s biometric is very close to that of theoriginal user, it might not be detected every time biometriccapture is performed. If the adversary manages to fool theclassifier once, it must be because its biometric is veryclose to that of the original user. Given that the user andthe adversary have a similar pulse-response the adversary’ssubsequent detection probability must be lower, i.e.,
P [Xi = adv|Xi−1 = usr] ≤ P [Xi = adv]
We call this decreased probability β. We build a Markovmodel (illustrated in Figure 3) to calculate the probabilitythat an adversary is detected after i rounds. The model usesα and β. When the adversary first accesses the keyboard, itis either detected with probability α or not detected, withprobability 1 − α. If the adversary is not detected, its pulse-response biometric must be close the original user’s. Thus, βis used for the subsequent rounds. In each later round, theadversary is either detected with probability β or not detected,with probability 1 − β. To find the combined probability ofdetection after i rounds, we construct the state transition matrixP of the Markov model as follows:
P =
[0 1− α α0 1− β β0 0 1
]
In matrix P each row and each column corresponds to astate. The number in row q and column r, pqr, is the probabilityof transitioning from state q to state r. To find the probabilitiesof being in each state we start with a row vector ρ that representsthe initial probability of being in state 1, 2 and 3. In this case,ρ = [1, 0, 0], indicating that we always start in state 1. Theprobability of being in each state after one round (or onetransition) can be represented by the inner product ρP . Theprobabilities for each subsequent round are found by another
0.4
0.6
0.8
1.0
0 10 20 30 40 50Rounds
Det
ectio
n pr
obab
ility
α and β
0.3 , 0.1
0.5 , 0.3
0.7 , 0.5
0.9 , 0.7
Fig. 4. Detection probability of our continuous authentication scheme asa function of the number of biometric acquisitions performed (rounds), forselected values of α and β.
multiplication with P . Therefore, the probabilities of being ineach state after i rounds (state transitions), is found as follows:
[1, 0, 0] · P i = [0, (1− α)(1− β)i−1, 1− (1− α)(1− β)i−1]
As expected, the probability of being in state 1 (the initial state)is 0, because the first state transition forces a transition fromthe initial state and there is no way back. (See Figure 3.) Theprobability of being in state 2, i.e., having escaped detection fori rounds is given by the second element of ρ: (1−α)(1−β)i−1.The probability of being detected is thus: 1−(1−α)(1−β)i−1.Using the numbers from our experiments (see Section VII-D)α = .99 and β = .3, we the detection probability after 10rounds is:
1− (1− α)(1− β)i−1 = 1− (1− 0.99)(1− 0.3)10−1
= 1− 0.01 · 0.79 = 0.99959 ≈ 99.96%
There is a 99.96% chance of detecting the adversary after10 rounds. This grows to 99.99999997% after 50 rounds. Thus,the frequency of biometric acquisition clearly determines thetime to detect the adversary. Figure 4 shows the detectionprobability as a function of the number of rounds for variousvalues of α and β.
D. Handling False Negatives
False negatives refer to incorrectly detecting the presenceof an adversary, i.e., when the original user is still at theterminal. In a scenario where biometric identification is usedas an additional layer of security during the authenticationprocedure, this problem can be managed simply by restartingthe login procedure, if the first attempt fails. In a continuousauthentication system where a single detection event mightcause the system to lock up, false negatives have to be dealtwith in a more organized manner.
One way of dealing with false negatives in a continuousauthentication system, is to specify a policy that allows acertain number of adversary detection events every n-th round,without taking any action. For example, allowing one adversarydetection event every 100 rounds corresponds to a false negativerate of 1%.
Another option is to combine the continuous authenticationmechanism with a less user-friendly biometric to deal withambiguous detection events. For example, after a few adversarydetection events, the user is asked to confirm its identity byswiping a thumb on an adjacent fingerprint scanner. Without
7
pulse-response, the user would have to do that every ten secondsor so, which would render the system quite unusable. However,combined with our continuous authentication system, suchconfirmation might need to ocur much less frequently.
Finally it is possible to gradually ramp up the severity ofactions taken by the continuous authentication process, everytime an adversary detection event occurs. For the first time,displaying a warning might be the most appropriate action. Ifdetection re-occurs, more and more severe actions can be taken.It is very unlikely, with a reasonably low false negative rate,to have multiple consecutive adversary detection events if theoriginal user is still at the terminal. Although the false positiverates we achieve are quite low, they cold certainly be improvedwith a more advanced biometrics capture system. In conjunctionwith a sensible policy, our continuous authentication systemmight be appropriate for any organization with high securityrequirements.
VI. BIOMETRIC ACQUISITION SYSTEM DESIGN
In this section, we describe decisions and parameters thatwent into the design of our final classifier. We conducted severalexperiments during to test different signal types, voltage levels,and frequencies. To support choices made in Section VII, wepresent some of those results below.
A. Signal Type
We start out with the hypothesis that the biometric signaturewill vary, depending on the frequency of the signal transmittedthrough the body. If this is in fact true it makes sense to testthe performance of various frequency sweeps. Our initial testsignals are three different linear 0.6-second sine-wave sweepsfrom 1 Hz to 250, 500 and 980 Hz. We also test the performanceof square-wave sweeps from 1 Hz to 250, 500 and 980 Hz,respectively. For a few specific values of voltage and frequencywe get decent results using Linear Discriminant Analysis (LDA),but at this point our results are not very robust. We continueto experiment with different signal types and it turns out that,contrary to our initial assumption, single pulse signals havesignificantly higher distinguishing power. We experiment withdifferent pulse widths between 100 ns and 1 ms, and voltagelevels of 1, 5 and 10 volts.
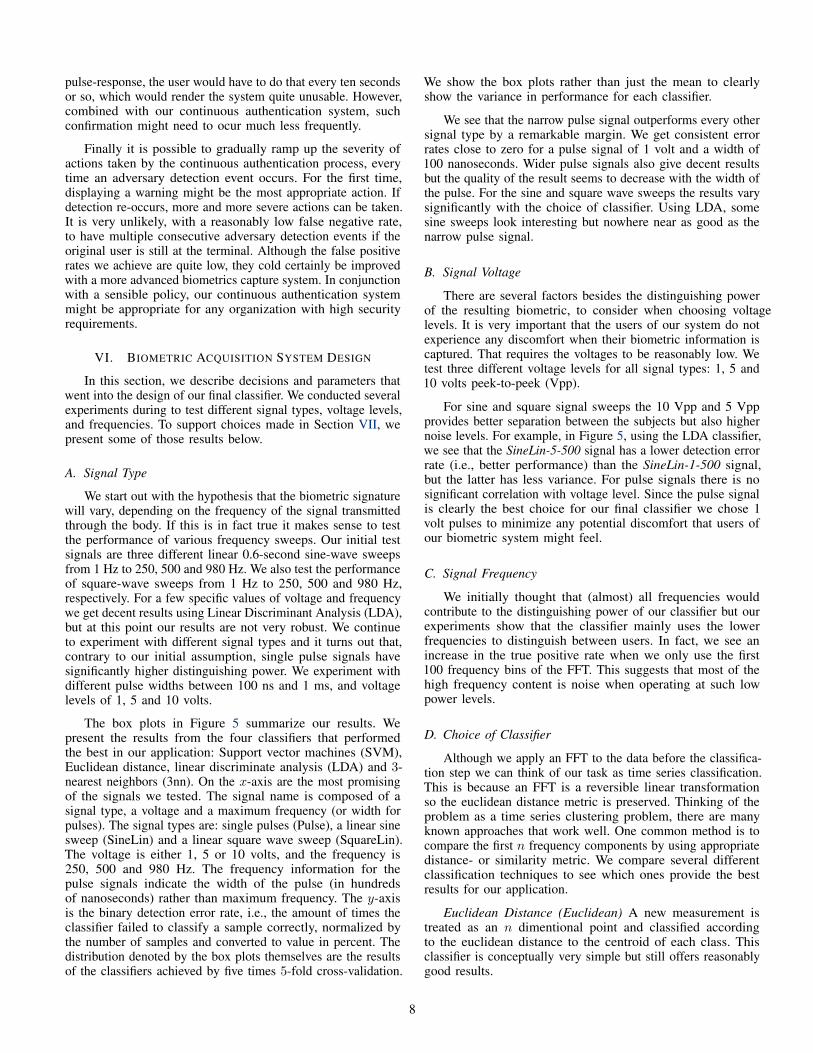
The box plots in Figure 5 summarize our results. Wepresent the results from the four classifiers that performedthe best in our application: Support vector machines (SVM),Euclidean distance, linear discriminate analysis (LDA) and 3-nearest neighbors (3nn). On the x-axis are the most promisingof the signals we tested. The signal name is composed of asignal type, a voltage and a maximum frequency (or width forpulses). The signal types are: single pulses (Pulse), a linear sinesweep (SineLin) and a linear square wave sweep (SquareLin).The voltage is either 1, 5 or 10 volts, and the frequency is250, 500 and 980 Hz. The frequency information for thepulse signals indicate the width of the pulse (in hundredsof nanoseconds) rather than maximum frequency. The y-axisis the binary detection error rate, i.e., the amount of times theclassifier failed to classify a sample correctly, normalized bythe number of samples and converted to value in percent. Thedistribution denoted by the box plots themselves are the resultsof the classifiers achieved by five times 5-fold cross-validation.
We show the box plots rather than just the mean to clearlyshow the variance in performance for each classifier.
We see that the narrow pulse signal outperforms every othersignal type by a remarkable margin. We get consistent errorrates close to zero for a pulse signal of 1 volt and a width of100 nanoseconds. Wider pulse signals also give decent resultsbut the quality of the result seems to decrease with the width ofthe pulse. For the sine and square wave sweeps the results varysignificantly with the choice of classifier. Using LDA, somesine sweeps look interesting but nowhere near as good as thenarrow pulse signal.
B. Signal Voltage
There are several factors besides the distinguishing powerof the resulting biometric, to consider when choosing voltagelevels. It is very important that the users of our system do notexperience any discomfort when their biometric information iscaptured. That requires the voltages to be reasonably low. Wetest three different voltage levels for all signal types: 1, 5 and10 volts peek-to-peek (Vpp).
For sine and square signal sweeps the 10 Vpp and 5 Vppprovides better separation between the subjects but also highernoise levels. For example, in Figure 5, using the LDA classifier,we see that the SineLin-5-500 signal has a lower detection errorrate (i.e., better performance) than the SineLin-1-500 signal,but the latter has less variance. For pulse signals there is nosignificant correlation with voltage level. Since the pulse signalis clearly the best choice for our final classifier we chose 1volt pulses to minimize any potential discomfort that users ofour biometric system might feel.
C. Signal Frequency
We initially thought that (almost) all frequencies wouldcontribute to the distinguishing power of our classifier but ourexperiments show that the classifier mainly uses the lowerfrequencies to distinguish between users. In fact, we see anincrease in the true positive rate when we only use the first100 frequency bins of the FFT. This suggests that most of thehigh frequency content is noise when operating at such lowpower levels.
D. Choice of Classifier
Although we apply an FFT to the data before the classifica-tion step we can think of our task as time series classification.This is because an FFT is a reversible linear transformationso the euclidean distance metric is preserved. Thinking of theproblem as a time series clustering problem, there are manyknown approaches that work well. One common method is tocompare the first n frequency components by using appropriatedistance- or similarity metric. We compare several differentclassification techniques to see which ones provide the bestresults for our application.
Euclidean Distance (Euclidean) A new measurement istreated as an n dimentional point and classified accordingto the euclidean distance to the centroid of each class. Thisclassifier is conceptually very simple but still offers reasonablygood results.
8
SVM Euclidean LDA Knn
0%
25%
50%
75%
100%Pu
lse−
1−1
Puls
e−1−
100
Puls
e−1−
1000
0
Sine
Lin−
10−2
50
Sine
Lin−
10−5
00
Sine
Lin−
10−9
80
Sine
Lin−
1−25
0
Sine
Lin−
1−50
0
Sine
Lin−
1−98
0
Sine
Lin−
5−25
0
Sine
Lin−
5−50
0
Sine
Lin−
5−98
0
Squa
reLi
n−10
−250
Squa
reLi
n−1−
250
Puls
e−1−
1
Puls
e−1−
100
Puls
e−1−
1000
0
Sine
Lin−
10−2
50
Sine
Lin−
10−5
00
Sine
Lin−
10−9
80
Sine
Lin−
1−25
0
Sine
Lin−
1−50
0
Sine
Lin−
1−98
0
Sine
Lin−
5−25
0
Sine
Lin−
5−50
0
Sine
Lin−
5−98
0
Squa
reLi
n−10
−250
Squa
reLi
n−1−
250
Puls
e−1−
1
Puls
e−1−
100
Puls
e−1−
1000
0
Sine
Lin−
10−2
50
Sine
Lin−
10−5
00
Sine
Lin−
10−9
80
Sine
Lin−
1−25
0
Sine
Lin−
1−50
0
Sine
Lin−
1−98
0
Sine
Lin−
5−25
0
Sine
Lin−
5−50
0
Sine
Lin−
5−98
0
Squa
reLi
n−10
−250
Squa
reLi
n−1−
250
Puls
e−1−
1
Puls
e−1−
100
Puls
e−1−
1000
0
Sine
Lin−
10−2
50
Sine
Lin−
10−5
00
Sine
Lin−
10−9
80
Sine
Lin−
1−25
0
Sine
Lin−
1−50
0
Sine
Lin−
1−98
0
Sine
Lin−
5−25
0
Sine
Lin−
5−50
0
Sine
Lin−
5−98
0
Squa
reLi
n−10
−250
Squa
reLi
n−1−
250
Bin
ary
dete
ctio
n er
ror
rate
Fig. 5. Box plots of the binary detection error rate for four different classifiers. The distribution shown by each box plot is the result of applying stratified5-fold cross-validation to the data set five times in a row. We test several different signal types, voltage levels and frequencies for each classifier. We see thatnarrow pulse signals are consistently performing well.
Mahalanobis Distance (MH) Rather than assuming uniformand orthogonal dispersion among the frequency components(as in the Euclidean classifier) the covariance matrix for eachclass is taken into account in the distance calculation. Thisallows for a distance metric that is proportional to the shapeof the class (in n dimensional feature space). The performanceof this classifier did not differ significantly from the Euclidean,suggesting that the shape of each class is not significantlyskewed.
Support Vector Machine (SVM) For each pair of groups wetrain one binary classifier (one-against-one). The final predictionis found by voting. The inverse kernel width for the Radial Basiskernel is determined by the 0.1 and 0.9 quantile of the pairwiseEuclidean distance between the samples. This classifier givesconsistently good results and is our final choice of classifier.
Linear Discriminant Analysis (LDA) LDA seeks to reducethe dimensionality of the input data while preserving as much ofthe class distinguishing power as possible. Our LDA classifierperforms the linear analysis on all the classes in our database,then compares the position of new samples in the resultinglower dimension feature space. The overall performance ofthis classifier degrades more gracefully than many of the othermethods but ultimately it did not prove as powerful as theSVM method.
K Nearest Neighbor (Knn) We tested the k nearest neigh-bors classifier for k = 1 and k = 3, using euclidean distance.It is a simple classifier that often works very well in practice.In our case though the performance of Knn was still not asgood as SVMs.
VII. EXPERIMENTS
In this section we will describe our experimental setup andpresent the results of our experiments with our final classifier.The design decisions and motivations behind our final classifierare described in detail in Section VI.
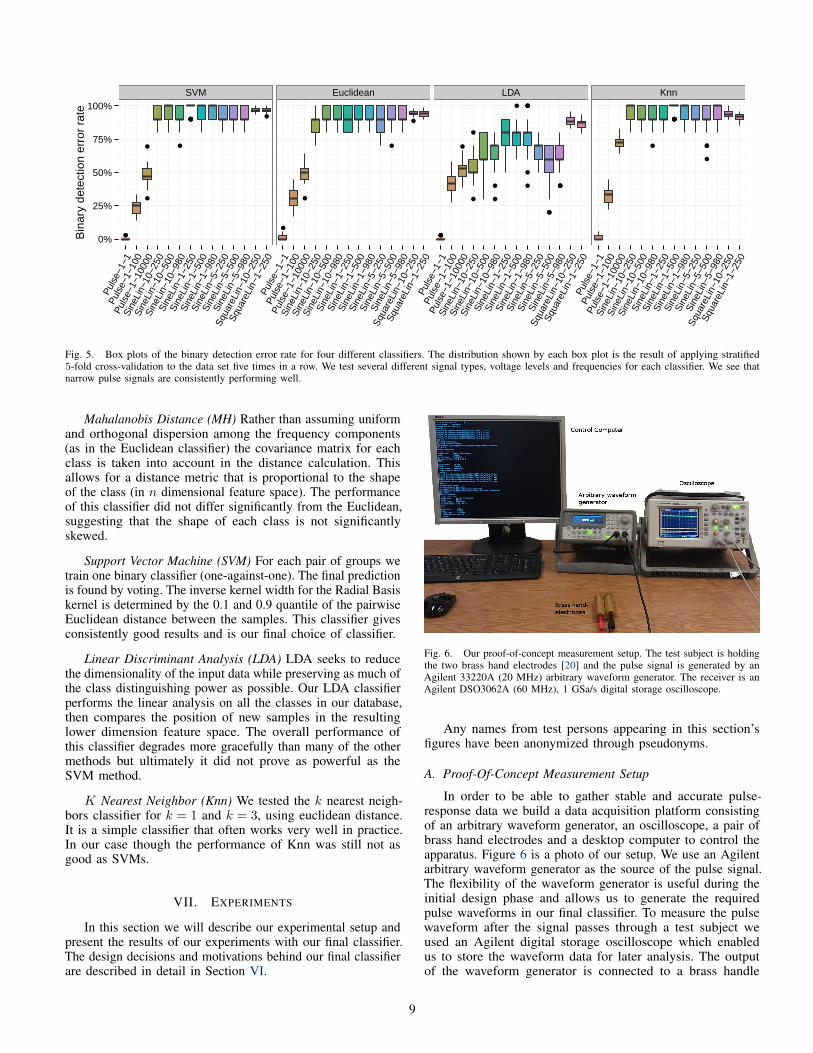
Fig. 6. Our proof-of-concept measurement setup. The test subject is holdingthe two brass hand electrodes [20] and the pulse signal is generated by anAgilent 33220A (20 MHz) arbitrary waveform generator. The receiver is anAgilent DSO3062A (60 MHz), 1 GSa/s digital storage oscilloscope.
Any names from test persons appearing in this section’sfigures have been anonymized through pseudonyms.
A. Proof-Of-Concept Measurement Setup
In order to be able to gather stable and accurate pulse-response data we build a data acquisition platform consistingof an arbitrary waveform generator, an oscilloscope, a pair ofbrass hand electrodes and a desktop computer to control theapparatus. Figure 6 is a photo of our setup. We use an Agilentarbitrary waveform generator as the source of the pulse signal.The flexibility of the waveform generator is useful during theinitial design phase and allows us to generate the requiredpulse waveforms in our final classifier. To measure the pulsewaveform after the signal passes through a test subject weused an Agilent digital storage oscilloscope which enabledus to store the waveform data for later analysis. The outputof the waveform generator is connected to a brass handle
9
that the user holds in the left hand. The other brass handleis connected to the oscilloscope’s signal input. When a testsubject holds one electrode in each hand the signal travels fromthe generator through the test subject and into the oscilloscope.To ensure exact triggering, the oscilloscope is connected to thesynchronization output of the waveform generator.
We use polished brass hand electrodes to ensure optimalelectrical contact between the measurement setup and the user.This reduces contact resistance and increases the stability ofthe measurements.
The function generator and oscilloscope are controlled bya desktop computer that is connected via USB. We wrote acustom software library to set measurement parameters andretrieve the desired waveform data. This software is availableupon request.
B. Biometric Capture Procedure
We had each subject follow a specific procedure during thebiometric capturing process. This ensures that only minimalnoise is introduced by the process itself. The test subjectsare given a brief explanation of the setup and purpose of theexperiment and then told to grab a hold of the brass handelectrodes. The red lead in the left hand and the black in theright hand.
The test subjects could choose to either stand or sit in achair during the experiment as long as they did not touch thesides of their body with their elbows or upper arms. We did thisto ensure that the current of the pulse signal had to go throughmore or less the same path, for all samples and all users. Beforeeach new test subject was measured, the brass handles wherewiped down with a disinfectant, both for hygienic reasons andto ensure good electrical contact between the electrode and theuser’s palms.
The capture process itself lasts about eleven minutes andeach subject was given the opportunity to take a break threetimes during that period. In the initial design phase each testsubject was sampled ten times for each of the three signaltypes, for each voltage level and for various frequencies. Oncea decision had been made that the pulse signal gave us thebest results, we acquired samples for two different data sets.The first one consists of 22 samples from each test person,taken in one measuring session, i.e. at one point in time. Thesecond one encompasses a total of 25 samples per test person,obtained in five different sessions over time.
Our subject population consists of both men and womanbetween the ages of 24 and 38. We sampled all our test subjectsat different times during the day, over the course of severalweeks. We tried to sample subjects in such a way that wewould end up with sampling conditions as diverse as possible,for each user. The interval between measurements sessionswith the same user varied between a few hours up to severalweeks. This was done in order to try to eliminate any effect thatsampling at a specific time of day might have on our results,i.e., that our biometric would remain more or less permanentover time, and across different periods of the day.
C. Feature Extraction
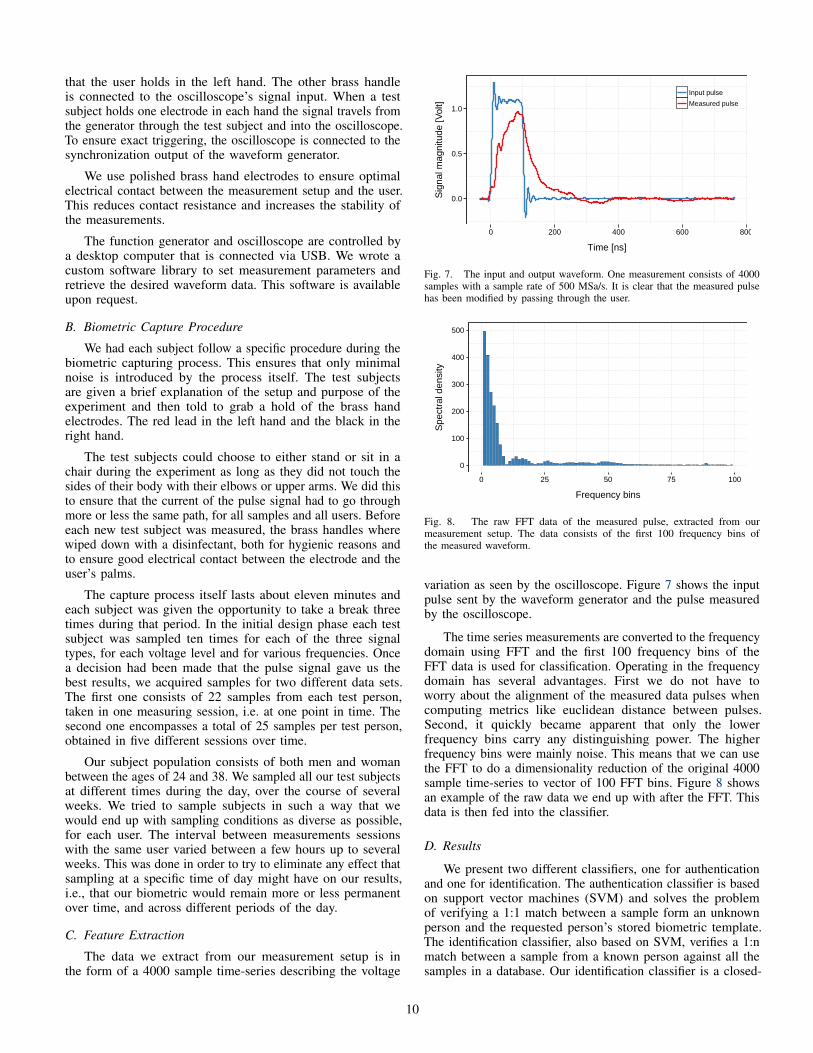
The data we extract from our measurement setup is inthe form of a 4000 sample time-series describing the voltage
0.0
0.5
1.0
0 200 400 600 800
Time [ns]
Sig
nal m
agni
tude
[Vol
t]
Input pulse
Measured pulse
Fig. 7. The input and output waveform. One measurement consists of 4000samples with a sample rate of 500 MSa/s. It is clear that the measured pulsehas been modified by passing through the user.
0
100
200
300
400
500
0 25 50 75 100
Frequency bins
Spe
ctra
l den
sity
Fig. 8. The raw FFT data of the measured pulse, extracted from ourmeasurement setup. The data consists of the first 100 frequency bins ofthe measured waveform.
variation as seen by the oscilloscope. Figure 7 shows the inputpulse sent by the waveform generator and the pulse measuredby the oscilloscope.
The time series measurements are converted to the frequencydomain using FFT and the first 100 frequency bins of theFFT data is used for classification. Operating in the frequencydomain has several advantages. First we do not have toworry about the alignment of the measured data pulses whencomputing metrics like euclidean distance between pulses.Second, it quickly became apparent that only the lowerfrequency bins carry any distinguishing power. The higherfrequency bins were mainly noise. This means that we can usethe FFT to do a dimensionality reduction of the original 4000sample time-series to vector of 100 FFT bins. Figure 8 showsan example of the raw data we end up with after the FFT. Thisdata is then fed into the classifier.
D. Results
We present two different classifiers, one for authenticationand one for identification. The authentication classifier is basedon support vector machines (SVM) and solves the problemof verifying a 1:1 match between a sample form an unknownperson and the requested person’s stored biometric template.The identification classifier, also based on SVM, verifies a 1:nmatch between a sample from a known person against all thesamples in a database. Our identification classifier is a closed-
10
Charles David
Ethan Jackson
Liam Lucas
Mason Noah
Richard Sophia
0%
25%
50%
75%
100%
0%
25%
50%
75%
100%
0%
25%
50%
75%
100%
0%
25%
50%
75%
100%
0%
25%
50%
75%
100%
90 92 94 96 98 100 90 92 94 96 98 100Threshold [%]
Sen
sitiv
ity (
TP
R)
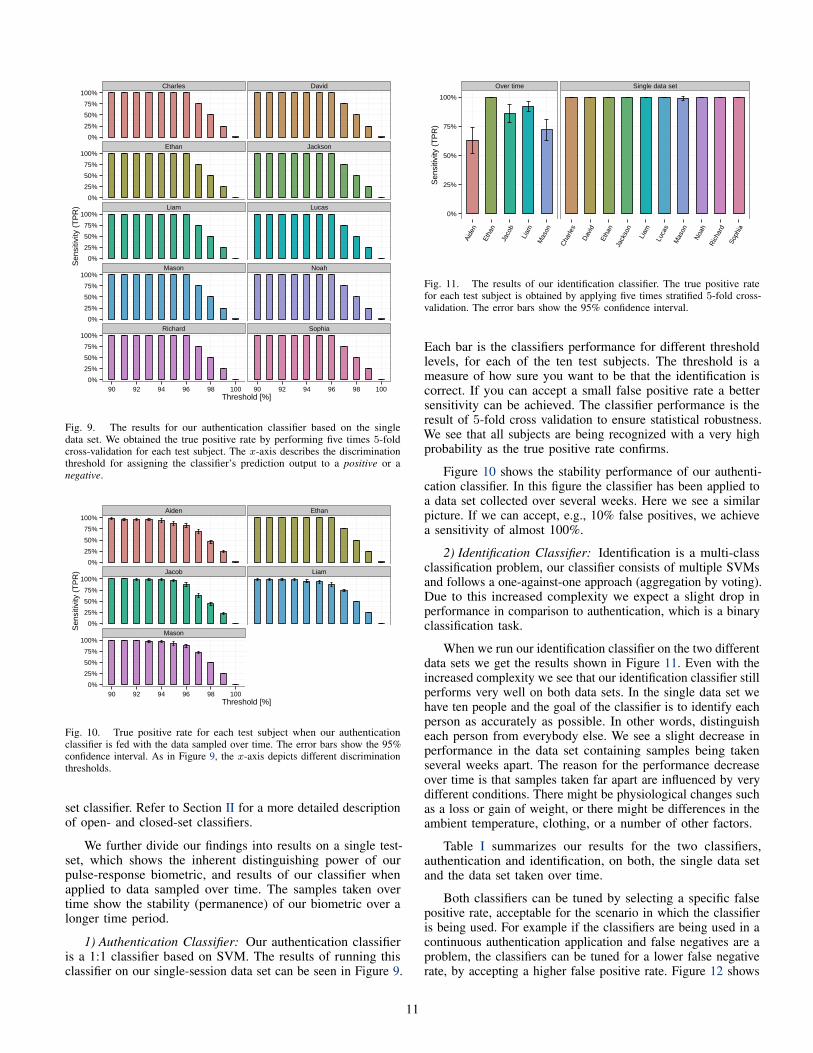
Fig. 9. The results for our authentication classifier based on the singledata set. We obtained the true positive rate by performing five times 5-foldcross-validation for each test subject. The x-axis describes the discriminationthreshold for assigning the classifier’s prediction output to a positive or anegative.
Aiden Ethan
Jacob Liam
Mason
0%
25%
50%
75%
100%
0%
25%
50%
75%
100%
0%
25%
50%
75%
100%
90 92 94 96 98 100Threshold [%]
Sen
sitiv
ity (
TP
R)
Fig. 10. True positive rate for each test subject when our authenticationclassifier is fed with the data sampled over time. The error bars show the 95%confidence interval. As in Figure 9, the x-axis depicts different discriminationthresholds.
set classifier. Refer to Section II for a more detailed descriptionof open- and closed-set classifiers.
We further divide our findings into results on a single test-set, which shows the inherent distinguishing power of ourpulse-response biometric, and results of our classifier whenapplied to data sampled over time. The samples taken overtime show the stability (permanence) of our biometric over alonger time period.
1) Authentication Classifier: Our authentication classifieris a 1:1 classifier based on SVM. The results of running thisclassifier on our single-session data set can be seen in Figure 9.
Over time Single data set
0%
25%
50%
75%
100%
Aide
n
Etha
n
Jaco
b
Liam
Mas
on
Cha
rles
Dav
id
Etha
nJa
ckso
n
Liam
Luca
s
Mas
on
Noa
hR
icha
rd
Soph
ia
Sen
sitiv
ity (
TP
R)
Fig. 11. The results of our identification classifier. The true positive ratefor each test subject is obtained by applying five times stratified 5-fold cross-validation. The error bars show the 95% confidence interval.
Each bar is the classifiers performance for different thresholdlevels, for each of the ten test subjects. The threshold is ameasure of how sure you want to be that the identification iscorrect. If you can accept a small false positive rate a bettersensitivity can be achieved. The classifier performance is theresult of 5-fold cross validation to ensure statistical robustness.We see that all subjects are being recognized with a very highprobability as the true positive rate confirms.
Figure 10 shows the stability performance of our authenti-cation classifier. In this figure the classifier has been applied toa data set collected over several weeks. Here we see a similarpicture. If we can accept, e.g., 10% false positives, we achievea sensitivity of almost 100%.
2) Identification Classifier: Identification is a multi-classclassification problem, our classifier consists of multiple SVMsand follows a one-against-one approach (aggregation by voting).Due to this increased complexity we expect a slight drop inperformance in comparison to authentication, which is a binaryclassification task.
When we run our identification classifier on the two differentdata sets we get the results shown in Figure 11. Even with theincreased complexity we see that our identification classifier stillperforms very well on both data sets. In the single data set wehave ten people and the goal of the classifier is to identify eachperson as accurately as possible. In other words, distinguisheach person from everybody else. We see a slight decrease inperformance in the data set containing samples being takenseveral weeks apart. The reason for the performance decreaseover time is that samples taken far apart are influenced by verydifferent conditions. There might be physiological changes suchas a loss or gain of weight, or there might be differences in theambient temperature, clothing, or a number of other factors.
Table I summarizes our results for the two classifiers,authentication and identification, on both, the single data setand the data set taken over time.
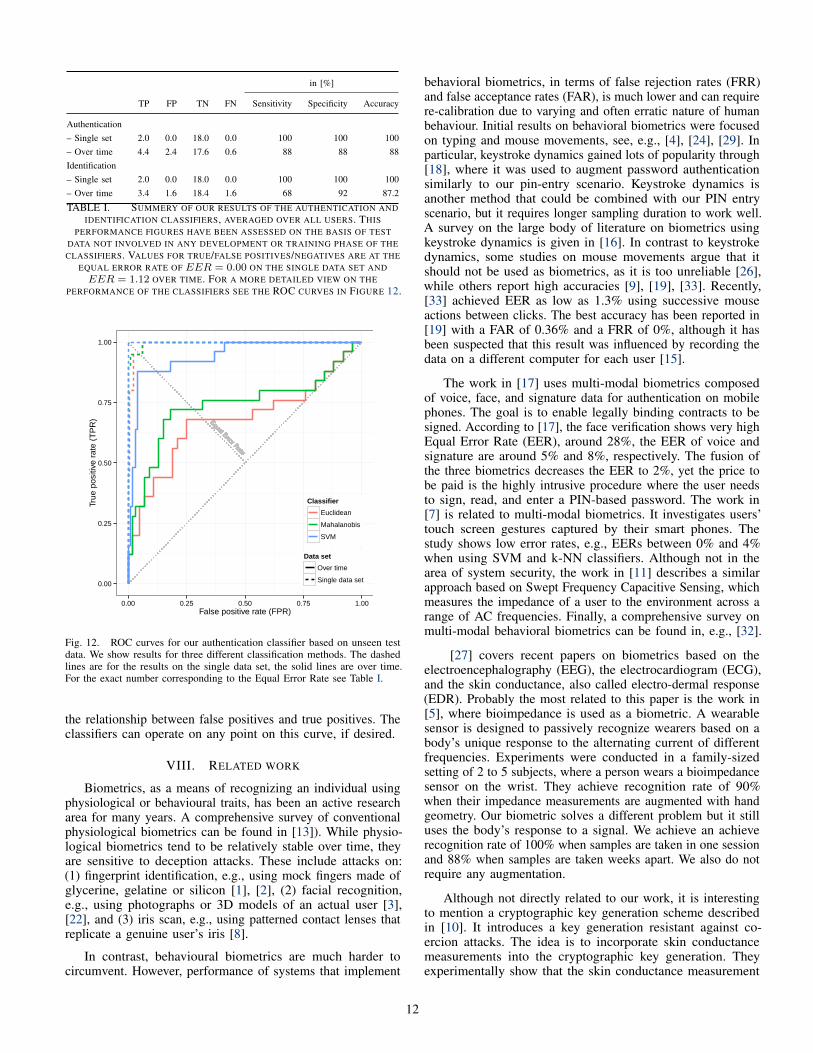
Both classifiers can be tuned by selecting a specific falsepositive rate, acceptable for the scenario in which the classifieris being used. For example if the classifiers are being used in acontinuous authentication application and false negatives are aproblem, the classifiers can be tuned for a lower false negativerate, by accepting a higher false positive rate. Figure 12 shows
11
in [%]
TP FP TN FN Sensitivity Specificity Accuracy
Authentication– Single set 2.0 0.0 18.0 0.0 100 100 100– Over time 4.4 2.4 17.6 0.6 88 88 88Identification– Single set 2.0 0.0 18.0 0.0 100 100 100– Over time 3.4 1.6 18.4 1.6 68 92 87.2
TABLE I. SUMMERY OF OUR RESULTS OF THE AUTHENTICATION ANDIDENTIFICATION CLASSIFIERS, AVERAGED OVER ALL USERS. THIS
PERFORMANCE FIGURES HAVE BEEN ASSESSED ON THE BASIS OF TESTDATA NOT INVOLVED IN ANY DEVELOPMENT OR TRAINING PHASE OF THECLASSIFIERS. VALUES FOR TRUE/FALSE POSITIVES/NEGATIVES ARE AT THE
EQUAL ERROR RATE OF EER = 0.00 ON THE SINGLE DATA SET ANDEER = 1.12 OVER TIME. FOR A MORE DETAILED VIEW ON THE
PERFORMANCE OF THE CLASSIFIERS SEE THE ROC CURVES IN FIGURE 12.
Equal Error Rate
Equal Error Rate
Equal Error Rate
Equal Error Rate
Equal Error Rate
Equal Error Rate
Equal Error Rate
Equal Error Rate
Equal Error Rate
Equal Error Rate
Equal Error Rate
Equal Error Rate
Equal Error Rate
Equal Error Rate
Equal Error Rate
Equal Error Rate
Equal Error Rate
Equal Error Rate
Equal Error Rate
Equal Error Rate
Equal Error Rate
Equal Error Rate
Equal Error Rate
Equal Error Rate
Equal Error Rate
Equal Error Rate
Equal Error Rate
Equal Error Rate
Equal Error Rate
Equal Error Rate
Equal Error Rate
Equal Error Rate
Equal Error Rate
Equal Error Rate
Equal Error Rate
Equal Error Rate
Equal Error Rate
Equal Error Rate
Equal Error Rate
Equal Error Rate
Equal Error Rate
Equal Error Rate
Equal Error Rate
Equal Error Rate
Equal Error Rate
Equal Error Rate
Equal Error Rate
Equal Error Rate
Equal Error Rate
Equal Error Rate
Equal Error Rate
Equal Error Rate
Equal Error Rate
Equal Error Rate
Equal Error Rate
Equal Error Rate
Equal Error Rate
Equal Error Rate
Equal Error Rate
Equal Error Rate
Equal Error Rate
Equal Error Rate
Equal Error Rate
Equal Error Rate
Equal Error Rate
Equal Error Rate
Equal Error Rate
Equal Error Rate
Equal Error Rate
Equal Error Rate
Equal Error Rate
Equal Error Rate
Equal Error Rate
Equal Error Rate
Equal Error Rate
Equal Error Rate
Equal Error Rate
Equal Error Rate
Equal Error Rate
Equal Error Rate
Equal Error Rate
Equal Error Rate
Equal Error Rate
Equal Error Rate
Equal Error Rate
Equal Error Rate
Equal Error Rate
Equal Error Rate
Equal Error Rate
Equal Error Rate
Equal Error Rate
Equal Error Rate
Equal Error Rate
Equal Error Rate
Equal Error Rate
Equal Error Rate
Equal Error Rate
Equal Error Rate
Equal Error Rate
Equal Error Rate
Equal Error Rate
Equal Error Rate
Equal Error Rate
Equal Error Rate
Equal Error Rate
Equal Error Rate
Equal Error Rate
Equal Error Rate
Equal Error Rate
Equal Error Rate
Equal Error Rate
Equal Error Rate
Equal Error Rate
Equal Error Rate
Equal Error Rate
Equal Error Rate
Equal Error Rate
Equal Error Rate
Equal Error Rate
Equal Error Rate
Equal Error Rate
Equal Error Rate
Equal Error Rate
Equal Error Rate
Equal Error Rate
Equal Error Rate
Equal Error Rate
Equal Error Rate
Equal Error Rate
Equal Error Rate
Equal Error Rate
Equal Error Rate
Equal Error Rate
Equal Error Rate
Equal Error Rate
Equal Error Rate
Equal Error Rate
Equal Error Rate
Equal Error Rate
Equal Error Rate
Equal Error Rate
0.00
0.25
0.50
0.75
1.00
0.00 0.25 0.50 0.75 1.00False positive rate (FPR)
True
pos
itive
rat
e (T
PR
)
Classifier
Euclidean
Mahalanobis
SVM
Data set
Over time
Single data set
Fig. 12. ROC curves for our authentication classifier based on unseen testdata. We show results for three different classification methods. The dashedlines are for the results on the single data set, the solid lines are over time.For the exact number corresponding to the Equal Error Rate see Table I.
the relationship between false positives and true positives. Theclassifiers can operate on any point on this curve, if desired.
VIII. RELATED WORK
Biometrics, as a means of recognizing an individual usingphysiological or behavioural traits, has been an active researcharea for many years. A comprehensive survey of conventionalphysiological biometrics can be found in [13]). While physio-logical biometrics tend to be relatively stable over time, theyare sensitive to deception attacks. These include attacks on:(1) fingerprint identification, e.g., using mock fingers made ofglycerine, gelatine or silicon [1], [2], (2) facial recognition,e.g., using photographs or 3D models of an actual user [3],[22], and (3) iris scan, e.g., using patterned contact lenses thatreplicate a genuine user’s iris [8].
In contrast, behavioural biometrics are much harder tocircumvent. However, performance of systems that implement
behavioral biometrics, in terms of false rejection rates (FRR)and false acceptance rates (FAR), is much lower and can requirere-calibration due to varying and often erratic nature of humanbehaviour. Initial results on behavioral biometrics were focusedon typing and mouse movements, see, e.g., [4], [24], [29]. Inparticular, keystroke dynamics gained lots of popularity through[18], where it was used to augment password authenticationsimilarly to our pin-entry scenario. Keystroke dynamics isanother method that could be combined with our PIN entryscenario, but it requires longer sampling duration to work well.A survey on the large body of literature on biometrics usingkeystroke dynamics is given in [16]. In contrast to keystrokedynamics, some studies on mouse movements argue that itshould not be used as biometrics, as it is too unreliable [26],while others report high accuracies [9], [19], [33]. Recently,[33] achieved EER as low as 1.3% using successive mouseactions between clicks. The best accuracy has been reported in[19] with a FAR of 0.36% and a FRR of 0%, although it hasbeen suspected that this result was influenced by recording thedata on a different computer for each user [15].
The work in [17] uses multi-modal biometrics composedof voice, face, and signature data for authentication on mobilephones. The goal is to enable legally binding contracts to besigned. According to [17], the face verification shows very highEqual Error Rate (EER), around 28%, the EER of voice andsignature are around 5% and 8%, respectively. The fusion ofthe three biometrics decreases the EER to 2%, yet the price tobe paid is the highly intrusive procedure where the user needsto sign, read, and enter a PIN-based password. The work in[7] is related to multi-modal biometrics. It investigates users’touch screen gestures captured by their smart phones. Thestudy shows low error rates, e.g., EERs between 0% and 4%when using SVM and k-NN classifiers. Although not in thearea of system security, the work in [11] describes a similarapproach based on Swept Frequency Capacitive Sensing, whichmeasures the impedance of a user to the environment across arange of AC frequencies. Finally, a comprehensive survey onmulti-modal behavioral biometrics can be found in, e.g., [32].
[27] covers recent papers on biometrics based on theelectroencephalography (EEG), the electrocardiogram (ECG),and the skin conductance, also called electro-dermal response(EDR). Probably the most related to this paper is the work in[5], where bioimpedance is used as a biometric. A wearablesensor is designed to passively recognize wearers based on abody’s unique response to the alternating current of differentfrequencies. Experiments were conducted in a family-sizedsetting of 2 to 5 subjects, where a person wears a bioimpedancesensor on the wrist. They achieve recognition rate of 90%when their impedance measurements are augmented with handgeometry. Our biometric solves a different problem but it stilluses the body’s response to a signal. We achieve an achieverecognition rate of 100% when samples are taken in one sessionand 88% when samples are taken weeks apart. We also do notrequire any augmentation.
Although not directly related to our work, it is interestingto mention a cryptographic key generation scheme describedin [10]. It introduces a key generation resistant against co-ercion attacks. The idea is to incorporate skin conductancemeasurements into the cryptographic key generation. Theyexperimentally show that the skin conductance measurement
12
will help to reveal user’s emotional states and recognize theattack as a stressful event (significantly different from the statewhen the keys were generated). This way, the generated keysinclude a dynamic component that can detect whether a useris forced to grant an access to the system.
IX. CONCLUSION
We have proposed a new biometric based on the humanbody’s response to an electric square pulse signal. We used ournew pulse-response biometric as an additional authenticationmechanism in a PIN entry system, enhancing the security of thePIN entry mechanism without adding additional inconveniencefor the user.
We also applied our new pulse-response biometric to theproblem of continuous authentication. We designed a continuousauthentication mechanism on a secure terminal, ensuring thatthe user that started the session continued to be the personphysically at the keyboard.
We showed through experiments on our proof-of-conceptprototype system, that each human body exhibits a uniqueresponse to a signal pulse applied at the palm of one hand,and measured at the palm of the other. Using our prototypesetup we where able to identify users with high probability ina matter of seconds. This identification mechanism integratesvery well with other well established methods, e.g., PIN entry,to produce a highly reliable additional layer of security, eitheron a continuous basis or at login time.
ACKNOWLEDGEMENTS
We thank the anonymous reviewers and the assigned“shepherd” for their comments and all the help in improvingthis paper. We also thank Srdjan Capkun for his help duringthe early phases of this work.
REFERENCES
[1] C. Barral and A. Tria, “Fake fingers in fingerprint recognition: Glycerinsupersedes gelatin,” in Formal to Practical Security, ser. Lecture Notes inComputer Science, V. Cortier, C. Kirchner, M. Okada, and H. Sakurada,Eds. Springer Berlin Heidelberg, 2009, vol. 5458, pp. 57–69. [Online].Available: http://dx.doi.org/10.1007/978-3-642-02002-5 4
[2] V. Biometric. (2009, Feb.) How to make the fake fingerprints(by VIRDI). Last accessed 03.08.2013. [Online]. Available: http://www.youtube.com/watch?v=-H71tyMupqk
[3] A. Boehm, D. Chen, M. Frank, D. Huang, C. Kuo, T. Lolic, I. Martinovic,and D. Song, “Safe: Secure authentication with face and eyes,” in InProceedings of International Conference on Security and Privacy inMobile Information and Communication Systems, Jun. 2013.
[4] N. Clarke and S. Furnell, “Advanced user authentication for mobiledevices,” Computers & Security, vol. 26, no. 2, pp. 109 – 119, 2007.
[5] C. Cornelius, J. Sorber, R. Peterson, J. Skinner, R. Halter, and D. Kotz,“Who wears me? bioimpedance as a passive biometric,” in Proceedingsof the USENIX Workshop on Health Security and Privacy, August 2012.
[6] N. S. . T. Council, “Biometrics frequently asked questions,” 2006.[Online]. Available: http://biometrics.gov/Documents/FAQ.pdf
[7] M. Frank, R. Biedert, E. Ma, I. Martinovic, and D. Song, “Touchalytics:On the applicability of touchscreen input as a behavioral biometric forcontinuous authentication,” Information Forensics and Security, IEEETransactions on, vol. 8, no. 1, pp. 136 –148, 1 2013.
[8] J. Galbally, A. Ross, M. Gomez-Barrero, J. Fierrez, and J. Ortega-Garcia, “From the iriscode to the iris: A new vulnerabilityof iris recognition systems,” in White paper for Black HatUSA 2012, Feb. 2012, last accessed 03.08.2013. [Online].Available: https://media.blackhat.com/bh-us-12/Briefings/Galbally/BHUS 12 Galbally Iris Reconstruction WP.pdf
[9] H. Gamboa and A. Fred, “A behavioral biometric system based onhuman-computer interaction,” in Proc. SPIE 5404, 2004, p. 381.
[10] P. Gupta and D. Gao, “Fighting coercion attacks in key generation usingskin conductance,” in Proceedings of the 19th USENIX Conferenceon Security, ser. USENIX Security’10, 2010, pp. 30–30. [Online].Available: http://dl.acm.org/citation.cfm?id=1929820.1929860
[11] C. Harrison, M. Sato, and I. Poupyrev, “Capacitive fingerprinting:exploring user differentiation by sensing electrical properties of thehuman body,” in Proceedings of the 25th Annual ACM Symposium onUser Interface Software and Technology (UIST’12), 2012, pp. 537–544.
[12] S. V. Inc., “Facial recognition provides continuous systemsecurity,” 2013. [Online]. Available: http://www.sensiblevision.com/en-us/fastaccessanywhere/overview.aspx
[13] A. Jain, A. Ross, and S. Pankanti, “Biometrics: a tool for informationsecurity,” Information Forensics and Security, IEEE Transactions on,vol. 1, no. 2, pp. 125 – 143, June 2006.
[14] A. Jain, A. Ross, and K. Nandakumar, Introduction to Biometrics,ser. SpringerLink : Bucher. Springer, 2011. [Online]. Available:http://books.google.com/books?id=ZPt2xrZFtzkC
[15] Z. Jorgensen and T. Yu, “On mouse dynamics as a behavioral biometricfor authentication,” in Proceedings of the 6th ACM Symposium onInformation, Computer and Communications Security, ser. ASIACCS’11. New York, NY, USA: ACM, 2011, pp. 476–482. [Online].Available: http://doi.acm.org/10.1145/1966913.1966983
[16] R. Joyce and G. Gupta, “Identity authentication based on keystrokelatencies,” Commun. ACM, vol. 33, no. 2, pp. 168–176, Feb. 1990.[Online]. Available: http://doi.acm.org/10.1145/75577.75582
[17] J. Koreman, A. C. Morris, D. Wu, S. Jassim, H. Sellahewa, J. Ehlers,G. Chollet, G. Aversano, H. Bredin, S. Garcia-salicetti, L. Allano, B. L.Van, and B. Dorizzi, “Multi-modal biometric authentication on theSecurePhone PDA,” 2006.
[18] F. Monrose, M. K. Reiter, and S. Wetzel, “Password hardeningbased on keystroke dynamics,” in Proceedings of the 6th ACMconference on Computer and communications security, ser. CCS ’99.New York, NY, USA: ACM, 1999, pp. 73–82. [Online]. Available:http://doi.acm.org/10.1145/319709.319720
[19] Y. Nakkabi, I. Traore, and A. A. E. Ahmed, “Improving mousedynamics biometric performance using variance reduction viaextractors with separate features,” Trans. Sys. Man Cyber. Part A,vol. 40, no. 6, pp. 1345–1353, Nov. 2010. [Online]. Available:http://dx.doi.org/10.1109/TSMCA.2010.2052602
[20] L. Nara, “Hand electrodes brass (1 pair),” 2013. [Online]. Available:http://www.lyranara.com/hand-electrodes-brass-1-pair/
[21] J. F. Nevenka Dimitrova, “Continuous face recognition with onlinelearning,” US Patent US 20 090 196 464 A1, 08 6, 2009. [Online].Available: http://www.google.com/patents/US20090196464
[22] M. D. Nguyen and Q. M. Bui, “Your face is not your password: Faceauthentication bypassing - lenovo - asus - toshiba,” in In briefingsof 2009 Black Hat Conference, Feb. 2009, last accessed 03.08.2013.[Online]. Available: http://www.blackhat.com/presentations/bh-dc-09/Nguyen/BlackHat-DC-09-Nguyen-Face-not-your-password-slides.pdf
[23] K. Niinuma and A. K. Jain, “Continuous user authentication usingtemporal information,” in Biometric Technology for Human IdentificationVII, B. V. K. V. Kumar, S. Prabhakar, and A. A. Ross, Eds., vol. 7667,no. 1. SPIE, 2010.
[24] M. S. Obaidat and B. Sadoun, “Keystroke dynamics based authentication,”in Biometrics, A. K. Jain, R. Bolle, and S. Pankanti, Eds. SpringerUS, 2002, pp. 213–229.
[25] I. T. L. N. I. of Standards and Technology, “The biometrics resourcecenter,” 2013. [Online]. Available: http://www.nist.gov/itl/csd/biometrics/index.cfm
[26] M. Pusara and C. E. Brodley, “User re-authentication via mousemovements,” in Proceedings of the 2004 ACM workshop on Visualizationand data mining for computer security, ser. VizSEC/DMSEC ’04.New York, NY, USA: ACM, 2004, pp. 1–8. [Online]. Available:http://doi.acm.org/10.1145/1029208.1029210
[27] K. Revett and S. T. Magalhes, “Cognitive biometrics: Challenges forthe future,” in Global Security, Safety, and Sustainability, 2010, vol. 92,pp. 79–86.
13

[28] P. H. Service, “Worker deaths by electrocution a summary of NIOSHsurveillance and investigative findings,” National Institute for Occupa-tional Safety and Health, Tech. Rep., May 1998.
[29] R. Spillane, “Keyboard apparatus for personal identification,” IBMTechnical Disclosure Bulletin, vol. 17, no. 3346, 1975.
[30] Wikipedia, “Sensitivity and specificity,” 2013. [Online]. Available:http://en.wikipedia.org/wiki/Sensitivity and specificity
[31] J. Woodward, N. Orlans, and P. Higgins, Biometrics, ser. RSAPress Series. McGraw-Hill/Osborne, 2003. [Online]. Available:
http://books.google.com/books?id=j-o btaFK6wC[32] R. V. Yampolskiy and V. Govindaraju, “Behavioural biometrics; a survey
and classification,” Int. J. Biometrics, vol. 1, no. 1, pp. 81–113, Jun.2008. [Online]. Available: http://dx.doi.org/10.1504/IJBM.2008.018665
[33] N. Zheng, A. Paloski, and H. Wang, “An efficient user verificationsystem via mouse movements,” in Proceedings of the 18th ACMconference on Computer and communications security, ser. CCS ’11.New York, NY, USA: ACM, 2011, pp. 139–150. [Online]. Available:http://doi.acm.org/10.1145/2046707.2046725
14