Embed Size (px)
Citation preview

Austria’s National Air Emission Projections
for 2010Submission under Directive 2001/81/EC (NEC Directive)


AUSTRIA’S NATIONAL AIR EMISSION PROJECTIONS FOR 2010
Submission under Directive 2001/81/EC (NEC Directive)
Final Report
REPORTREP-0057
Vienna, 2006

Project Manager Alexander Storch
Authors Michael Anderl Siegmund Böhmer Günther Lichtblau Traute Köther Thomas Krutzler Agnes Kurzweil Franz Meister Barbara Muik Christian Neubauer Werner Pölz Stefan Poupa Elisabeth Schachermayer Elisabeth Schwaiger Alexander Storch Herbert Wiesenberger Gerhard Zethner
Approved by Manfred Ritter
Acknowledgements The authors of this report want to express their thanks to all experts involved in the preparation of this report. All work for the preparation for this report has been carried out within the project EMIPRO at Umweltbundesamt.
For further information about publications of Umweltbundesamtes please go to: http://www.umweltbundesamt.at/
Imprint Owner and Editor: Umweltbundesamt GmbH
Spittelauer Lände 5, 1090 Vienna/Austria
Printed by: Umweltbundesamt GmbH
Printed on recycling paper
© Umweltbundesamt GmbH, Vienna, 2006 All rights reserved ISBN 3-85457-855-5

Austria’s National Air Emission Projections 2010 – TABLE OF CONTENTS
3
TABLE OF CONTENTS
1 REPORTING OBLIGATIONS .................................................................5 Legal background.........................................................................................5
2 EMISSIONS ...............................................................................................6
2.1 Nitrogen Oxides NOx ..................................................................................7 2.2 Sulphur Dioxide SO2 ................................................................................13 2.3 Non-Methane Volatile Organic Compounds (NMVOCs) .......................18 2.4 Ammonia (NH3) .........................................................................................23
3 METHODOLOGY ....................................................................................29
3.1 General Approach ....................................................................................29 3.2 Projections of key input parameters for emissions calculation .........29 3.2.1 Energy Projections .....................................................................................31 3.2.2 Industrial Processes ...................................................................................31 3.2.3 Transport Projections .................................................................................31 3.2.4 Agriculture Projections................................................................................32 3.3 Emission Calculation ...............................................................................34 3.3.1 General Approach ......................................................................................34 3.3.2 Combustion in Energy and Transformation Industries SNAP 01 ..............35 3.3.3 Non-Industrial Combustion Plants SNAP 02 ..............................................35 3.3.4 Combustion in Manufacturing Industry SNAP 03 .......................................36 3.3.5 Production Processes SNAP 04.................................................................36 3.3.6 Fuels and Geothermal Energy SNAP 05....................................................37 3.3.7 Solvent and Other Product Use SNAP 06..................................................37 3.3.8 Road Transport and Other Mobile Sources and
Machinery SNAP 07 and SNAP 08.............................................................38 3.3.9 Waste Treatment and Disposal SNAP 09 ..................................................38 3.3.10 Agriculture SNAP 10...................................................................................39
ANNEX......................................................................................................41
REFERENCES ........................................................................................42


Austria’s National Air Emission Projections 2010 – Reporting Obligations
5
1 REPORTING OBLIGATIONS
This report presents emission projections for 2010, as required by Article 8 of the NEC Directive to be reported to the European Commission and the European En-vironment Agency. It includes background information to enable a quantitiative un-derstanding of the key socioeconomic assumptions used in the preparation of the projections.
For comparison, this report also includes emission data from the 2004 national air emission inventory on which the projections were based. For latest inventory data, please see the 2005 emission inventory at:
http://www.umweltbundesamt.at/umweltschutz/luft/emiberichte/ .
Contact name and address for this submission is given below:
Title of Inventory Austria’s National Projections 2010 on acidifying and eutrophying emissions and ozone precursors
Contact Name Manfred Ritter
Organisation Umweltbundesamt
Address Spittelauer Lände 5 A-1090 Vienna AUSTRIA
Fax + 43-(0)1-31304–5400
Phone + 43-(0)1-31304–5951
E-mail [email protected]
Legal background
After the UN/ECE Gothenburg Protocol to the Convention on Long-Range Trans-boundary Air Pollution had been signed on 1 December 1999, the EU agreed on national emission ceilings for sulphur dioxide (SO2), nitrogen oxides (NOx), ammonia (NH3) and non-methane volatile organic compounds (NMVOC) for the year 2010.
The Directive 2001/81/EC of the European Parliament and of the Council of 23 Oc-tober 2001 on national emission ceilings for certain atmospheric pollutants (“NEC Directive”) implements national emission ceilings for these air pollutants1. Pursuant to Article 7 Member States are obliged to prepare and annually update national emis-sion inventories and emission projections for 2010. Pursuant to Art. 8 (1) Member States have to report their emission inventories and projections to the Commission. The obligations have been transposed into national law by the Emissionshöchst-mengengesetz-Luft2.
1 Directive 2001/81/EC of the European Parliament and the Council of 23 October 2001 concerning na-
tional emission ceilings for certain pollutants, OJ L309/22, 27 November 2001. 2 Bundesgesetz über nationale Emissionshöchstmengen für bestimmte Luftschadstoffe (Emissionshöchst-
mengengesetz-Luft, EG-L), BGBl. Nr. 34/2003.

Austria’s National Air Emission Projections 2010 – Emissions
6
2 EMISSIONS
In the Emission Reporting Guidelines 2002, Parties are given the choice of whether to report emissions on the basis of fuel used or fuel sold to the final consumer. It is recommended that they state clearly in their submissions the basis of their calcula-tions. Table 1 shows national total emissions as reported to the UNECE Convention on Long-range Transboundary Air Pollution, based on fuel sold.
Emission data on which projections 2010 were based (*) Projection
Pollutants 1990 1995 2000 2003 2010
NOx 210,99 192,13 204,43 229,03 172,94
SO2 76,18 48,21 33,06 34,14 25,62
NMVOC 286,02 221,31 181,01 182,30 152,18
NH3 57,15 59,42 54,93 54,49 52,89
(*) Projections were based on emission data from the 2004 emission inventory. For latest inventory data, please see the 2005 emission inventory at: http://www.umweltbundesamt.at/umweltschutz/ luft/emiberichte/
Chapters 2.1 up to 2.4 of this report present projection tables for SOx, NOx, NH3 and NMVOCs for the main NFR sectors as reported to the UNECE Convention on Long-range Transboundary Air Pollution, calculating transport emissions from sold fuel.
According to Article 2 of Directive 2001/81/EC the Directive covers “emissions in the territory of the Member States”. If fuel prices are considerably different in neighbour-ing countries, fuel sold within the territory of a Member State is used outside its ter-ritory (the so-called “tank tourism”). Austria has experienced a considerable amount of “tank tourism” in the last few years; this needs to be taken into account for re-porting emissions on the Austrian territory. Most of these fuels are currently used in heavy duty vehicles for long-distance traffic (inside and outside the EU). Austria re-ports emissions without “tank tourism” according to Table 2 as Austria’s official pro-jection under Article 8 (1) of the NEC-Directive.
Emissions 2010 without “tank tourism” [kt/a]
Ceilings 2010 [kt/a]
NOX 137,32 103
SO2 25,58 39
NMVOC 149,57 159
NH3 52,79 66
The comparison with Table 1 shows that “tank tourism” is of significant relevance for NOX emissions only.
Table 1: Austrian national total
emissions for 1990, 1995, 2000, 2003 and
projected emissions for 2010 after implementation
of agreed policy for Austria [in 1000 tons
per year, i.e. kt/a]
Table 2: Austria's emission
projection according to Directive 2001/81/EC and ceilings for 2010

Austria’s National Air Emission Projections 2010 – Emissions
7
2.1 Nitrogen Oxides NOx
The main source for NOx emissions in Austria with a share of more than 95% is fuel combustion actitivities. Within this source road transport is the major contributor to total NOx emissions; over the years about 50% of national total emissions have arisen from this source.
NEC Emission Projection Austria "With Measures"Total NOX by all Source Groups
0
50
100
150
200
250
1990 1995 2000 2005 2010
Year
kt N
OX
/ Yea
r
With "Tank Tourism"
Without "Tank Tourism"
NEC-Target
Projection
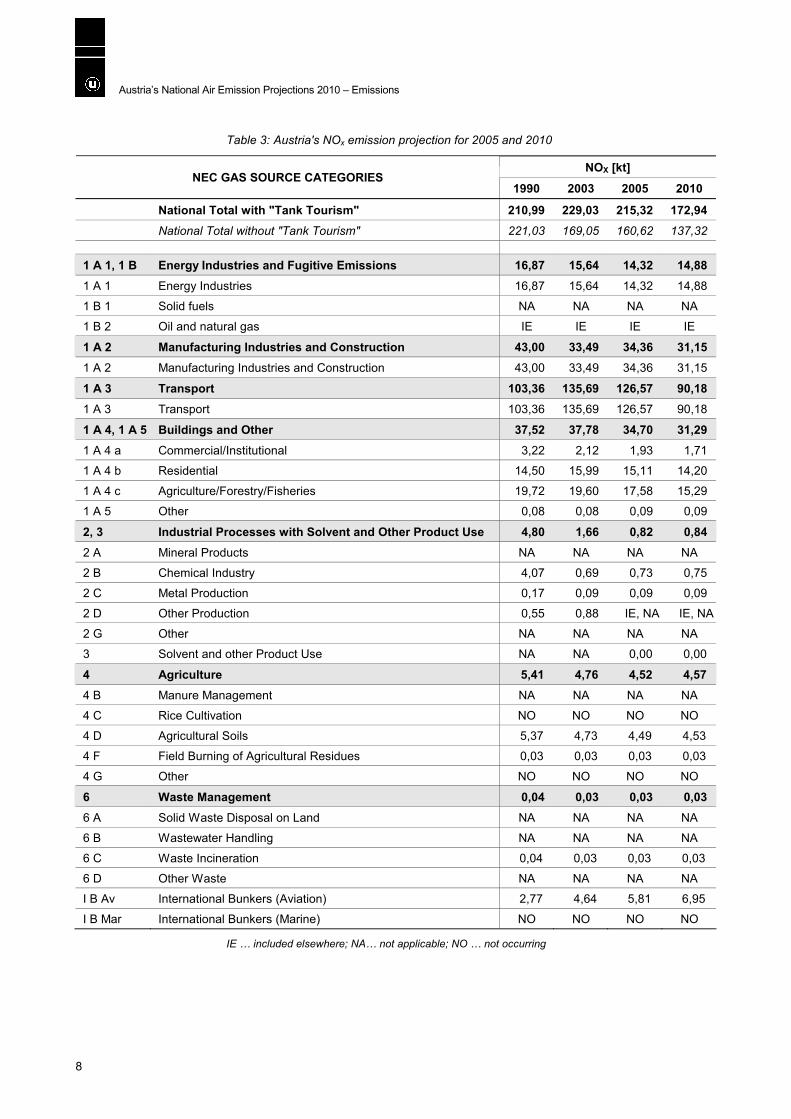
The projections for 2010 based on current legislation show a remarkable reduction of NOx emissions, mainly due to a decrease of transport emissions. National total emissions are expected to decrease to 173 kt (kilo tons, i.e. 1000 tons), emissions without “tank tourism” to 137 kt. However the emissions without “tank tourism” are still projected to significantly exceed the emission ceiling of 103 kt by more than 30 kt.
Figure 1: Historical and projected emissions of NOx in comparison to the national emissions ceiling.
Austria’s National Air Emission Projections 2010 – Emissions
8
Table 3: Austria's NOx emission projection for 2005 and 2010
NOX [kt] NEC GAS SOURCE CATEGORIES
1990 2003 2005 2010
National Total with "Tank Tourism" 210,99 229,03 215,32 172,94 National Total without "Tank Tourism" 221,03 169,05 160,62 137,32 1 A 1, 1 B Energy Industries and Fugitive Emissions 16,87 15,64 14,32 14,88 1 A 1 Energy Industries 16,87 15,64 14,32 14,88
1 B 1 Solid fuels NA NA NA NA
1 B 2 Oil and natural gas IE IE IE IE
1 A 2 Manufacturing Industries and Construction 43,00 33,49 34,36 31,15 1 A 2 Manufacturing Industries and Construction 43,00 33,49 34,36 31,15
1 A 3 Transport 103,36 135,69 126,57 90,18 1 A 3 Transport 103,36 135,69 126,57 90,18
1 A 4, 1 A 5 Buildings and Other 37,52 37,78 34,70 31,29 1 A 4 a Commercial/Institutional 3,22 2,12 1,93 1,71
1 A 4 b Residential 14,50 15,99 15,11 14,20
1 A 4 c Agriculture/Forestry/Fisheries 19,72 19,60 17,58 15,29
1 A 5 Other 0,08 0,08 0,09 0,09
2, 3 Industrial Processes with Solvent and Other Product Use 4,80 1,66 0,82 0,84 2 A Mineral Products NA NA NA NA
2 B Chemical Industry 4,07 0,69 0,73 0,75
2 C Metal Production 0,17 0,09 0,09 0,09
2 D Other Production 0,55 0,88 IE, NA IE, NA
2 G Other NA NA NA NA
3 Solvent and other Product Use NA NA 0,00 0,00
4 Agriculture 5,41 4,76 4,52 4,57 4 B Manure Management NA NA NA NA
4 C Rice Cultivation NO NO NO NO
4 D Agricultural Soils 5,37 4,73 4,49 4,53
4 F Field Burning of Agricultural Residues 0,03 0,03 0,03 0,03
4 G Other NO NO NO NO
6 Waste Management 0,04 0,03 0,03 0,03 6 A Solid Waste Disposal on Land NA NA NA NA
6 B Wastewater Handling NA NA NA NA
6 C Waste Incineration 0,04 0,03 0,03 0,03
6 D Other Waste NA NA NA NA
I B Av International Bunkers (Aviation) 2,77 4,64 5,81 6,95
I B Mar International Bunkers (Marine) NO NO NO NO
IE … included elsewhere; NA… not applicable; NO … not occurring

Austria’s National Air Emission Projections 2010 – Emissions
9
Sectoral emission projection of nitrogen oxides
NEC Emission Projection Austria "With Measures"NOX by Energy Industries + Fugitive Emissions
0
2
4
6
8
10
12
14
16
18
1990 1995 2000 2005 2010
Year
kt N
OX
/ Yea
r
NEC Emission Projection Austria "With Measures"NOX by Manufacturing Industries and Construction
0
5
10
15
20
25
30
35
40
45
50
1990 1995 2000 2005 2010
Year
kt N
OX
/ Yea
r
Figure 2: NOx from energy industries and fugitive emissions, 1990-2010
Figure 3: NOx from manufacturing industries and construction, 1990-2010

Austria’s National Air Emission Projections 2010 – Emissions
10
NEC Emission Projection Austria "With Measures"NOX by Transport
0
20
40
60
80
100
120
140
160
1990 1995 2000 2005 2010
Year
kt N
OX
/ Yea
r
With "Tank Tourism"
Without "Tank Tourism"
NEC Emission Projection Austria "With Measures"NOX by Buildings and Other
0
5
10
15
20
25
30
35
40
1990 1995 2000 2005 2010
Year
kt N
OX
/ Yea
r
Figure 4: NOx from transport,
1990-2010
Figure 5: NOx from buildings and
other, 1990-2010

Austria’s National Air Emission Projections 2010 – Emissions
11
NEC Emission Projection Austria "With Measures"NOX by Industrial Processes & Solvent and Other Product Use
0
1
2
3
4
5
6
1990 1995 2000 2005 2010
Year
kt N
OX
/ Yea
r
NEC Emission Projection Austria "With Measures"NOX by Agriculture
4,0
4,2
4,4
4,6
4,8
5,0
5,2
5,4
5,6
1990 1995 2000 2005 2010
Year
kt N
OX
/ Yea
r
Figure 6: NOx from industrial processes and solvent and other product use, 1990-2010
Figure 7: NOx from agriculture, 1990-2010

Austria’s National Air Emission Projections 2010 – Emissions
12
NEC Emission Projection Austria "With Measures"NOX by Waste Management
0,000
0,005
0,010
0,015
0,020
0,025
0,030
0,035
0,040
0,045
1990 1995 2000 2005 2010
Year
kt N
OX
/ Yea
r
Figure 8: NOx from waste
management, 1990-2010

Austria’s National Air Emission Projections 2010 – Emissions
13
2.2 Sulphur Dioxide SO2
SO2 Emissions show a significant reduction from 1990 to 2000 mainly because of the implementation of emission limits in the power generation sector and the reduc-tion of the sulphur content in mineral oil products. The projections for 2010 based on current legislation (with measures) show a reduction of 13 kt below the emission ceiling of 39 kt.
NEC Emission Projection Austria "With Measures"Total SO2 by all Source Groups
0
10
20
30
40
50
60
70
80
90
1990 1995 2000 2005 2010
Year
kt S
0 2 /
Year
With "Tank Tourism"
Without "Tank Tourism"
NEC-Target
Projection
One of the main reasons for projected further reductions of SO2 emissions until 2010 is changes in the share of different fuel types. A significant decline in the use of coal is expected in the power plants and household sectors, respectively. This will also be acompanied by a decline of fossil liquid fuel use. In the traffic sector, the main driver for the downward trend is the reduction of the sulphur content in diesel prod-ucts.
Figure 9: Historical and projected emissions of SO2 in comparison to the national emissions ceiling.

Austria’s National Air Emission Projections 2010 – Emissions
14
Table 4: Austria's SO2 emission projection for 2005 and 2010
SO2 [kt] NEC GAS SOURCE CATEGORIES
1990 2003 2005 2010
National Total with "Tank Tourism" 76,18 34,14 29,84 25,62 National Total without "Tank Tourism" 76,77 33,38 29,35 25,58 1 A 1, 1 B Energy Industries and Fugitive Emissions 16,00 8,58 8,00 6,85 1 A 1 Energy Industries 14,00 8,43 7,87 6,70
1 B 1 Solid fuels NA NA NA NA
1 B 2 Oil and natural gas 2,00 0,15 0,13 0,14
1 A 2 Manufacturing Industries and Construction 18,23 11,90 10,21 9,70 1 A 2 Manufacturing Industries and Construction 18,23 11,90 10,21 9,70
1 A 3 Transport 4,07 2,24 1,57 0,28 1 A 3 Transport 4,07 2,24 1,57 0,28
1 A 4, 1 A 5 Buildings and Other 35,59 10,15 8,91 7,44 1 A 4 a Commercial/Institutional 5,00 1,05 0,86 0,63
1 A 4 b Residential 27,89 8,32 7,50 6,32
1 A 4 c Agriculture/Forestry/Fisheries 2,69 0,77 0,50 0,47
1 A 5 Other 0,01 0,01 0,04 0,02
2, 3 Industrial Processes with Solvent and Other Product Use 2,22 1,21 1,09 1,30 2 A Mineral Products NA NA NA NA
2 B Chemical Industry 1,56 0,77 0,59 0,78
2 C Metal Production 0,66 0,45 0,50 0,51
2 D Other Production NA NA NA NA
2 G Other NA NA NA NA
3 Solvent and other Product Use NA NA 0,00 0,00
4 Agriculture 0,00 0,00 0,00 0,00 4 B Manure Management NA NA NA NA
4 C Rice Cultivation NO NO NO NO
4 D Agricultural Soils NA NA NA NA
4 F Field Burning of Agricultural Residues 0,00 0,00 0,00 0,00
4 G Other NO NO 0,00 0,00
6 Waste Management 0,06 0,05 0,05 0,05 6 A Solid Waste Disposal on Land NA NA NA NA
6 B Wastewater Handling NA NA NA NA
6 C Waste Incineration 0,06 0,05 0,05 0,05
6 D Other Waste NA NA NA NA
I B Av International Bunkers (Aviation) 0,28 0,46 0,58 0,69
I B Mar International Bunkers (Marine) NO NO NO NO
IE … included elsewhere; NA… not applicable; NO … not occurring

Austria’s National Air Emission Projections 2010 – Emissions
15
Sectoral emission projection of sulphor dioxide
NEC Emission Projection Austria "With Measures"SO2 by Energy Industries + Fugitive Emissions
0
2
4
6
8
10
12
14
16
18
1990 1995 2000 2005 2010
Year
kt S
O2 /
Yea
r
NEC Emission Projection Austria "With Measures"SO2 by Manufacturing Industries and Construction
0
2
4
6
8
10
12
14
16
18
20
1990 1995 2000 2005 2010
Year
kt S
O2 /
Yea
r
Figure 10: SO2 from energy industries and fugitive emissions, 1990-2010
Figure 11: SO2 from manufacturing industries and construction, 1990-2010

Austria’s National Air Emission Projections 2010 – Emissions
16
NEC Emission Projection Austria "With Measures"SO2 by Transport
0,0
0,5
1,0
1,5
2,0
2,5
3,0
3,5
4,0
4,5
5,0
1990 1995 2000 2005 2010
Year
kt S
O2 /
Yea
r
With "Tank Tourism"
Without "Tank Tourism"
NEC Emission Projection Austria "With Measures"SO2 by Buildings and Other
0
5
10
15
20
25
30
35
40
1990 1995 2000 2005 2010
Year
kt S
O2 /
Year
Figure 12: SO2 from transport,
1990-2010
Figure 13: SO2 from buildings and
other, 1990-2010

Austria’s National Air Emission Projections 2010 – Emissions
17
NEC Emission Projection Austria "With Measures"SO2 by Industrial Processes & Solvent and Other Product Use
0,00
0,50
1,00
1,50
2,00
2,50
1990 1995 2000 2005 2010
Year
kt S
O2 /
Yea
r
NEC Emission Projection Austria "With Measures"SO2 by Agriculture
0,00138
0,00140
0,00142
0,00144
0,00146
0,00148
0,00150
0,00152
0,00154
0,00156
0,00158
1990 1995 2000 2005 2010
Year
kt S
O2 /
Yea
r
Figure 14: SO2 from industrial processes and solvent and other product use, 1990-2010
Figure 15: SO2 from agriculture, 1990-2010

Austria’s National Air Emission Projections 2010 – Emissions
18
NEC Emission Projection Austria "With Measures"SO2 by Waste Management
0,048
0,050
0,052
0,054
0,056
0,058
0,060
0,062
0,064
0,066
1990 1995 2000 2005 2010
Year
kt S
O2 /
Yea
r
2.3 Non-Methane Volatile Organic Compounds (NMVOCs)
The emissions of non-methane volatile compounds show a considerable reduction from 1990 to 2000. The main sources of NMVOC emissions in Austria are fuel com-bustion activities and solvent and other product use.
NEC Emission Projection Austria "With Measures"Total NMVOC by all Source Groups
0
50
100
150
200
250
300
350
1990 1995 2000 2005 2010
Year
kt N
MVO
C /
Year
With "Tank Tourism"
Without "Tank Tourism"
NEC-Target
Projection
A significant part of the reduction is due to regulations for mobile sources and for solvent use. The projections for 2010 show a reduction of 9 kt below the emission ceiling of 159 kt.
Figure 16: SO2 from waste
management, 1990-2010
Figure 17: Historical and projected
emissions of NMVOC in comparison to the
national emission ceiling.

Austria’s National Air Emission Projections 2010 – Emissions
19
Table 5: Austria's NMVOC emission projection for 2005 and 2010
NMVOC [kt] NEC GAS SOURCE CATEGORIES
1990 2003 2005 2010
National Total with "Tank Tourism" 286,02 182,30 170,02 152,18 National Total without "Tank Tourism" 286,11 178,28 166,75 149,57
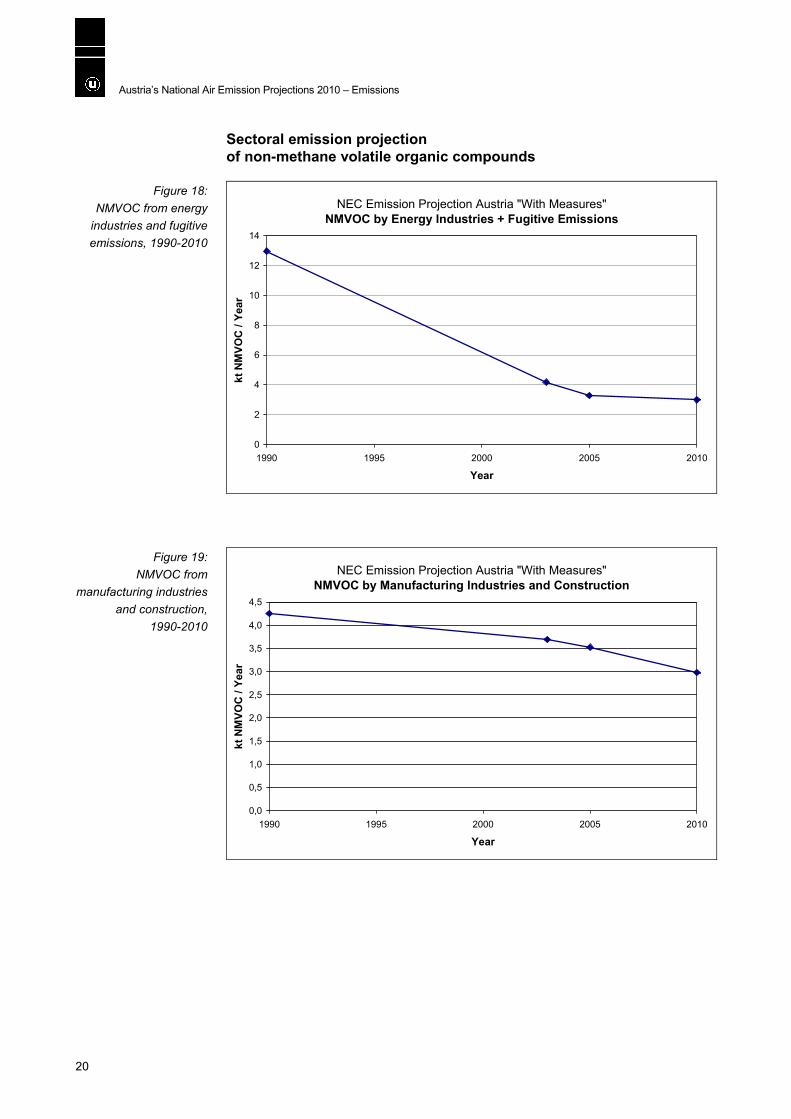
1 A 1, 1 B Energy Industries and Fugitive Emissions 12,97 4,19 3,28 3,00 1 A 1 Energy Industries 0,75 0,74 0,74 0,74
1 B 1 Solid fuels NA NA NA NA
1 B 2 Oil and natural gas 12,22 3,45 2,55 2,27
1 A 2 Manufacturing Industries and Construction 4,25 3,69 3,53 2,98 1 A 2 Manufacturing Industries and Construction 4,25 3,69 3,53 2,98
1 A 3 Transport 70,14 23,64 20,14 14,32 1 A 3 Transport 70,14 23,64 20,14 14,32
1 A 4, 1 A 5 Buildings and Other 68,56 50,56 44,60 37,45 1 A 4 a Commercial/Institutional 0,72 1,41 1,25 1,13
1 A 4 b Residential 58,67 39,72 35,43 30,15
1 A 4 c Agriculture/Forestry/Fisheries 9,15 9,42 7,91 6,14
1 A 5 Other 0,02 0,01 0,02 0,02
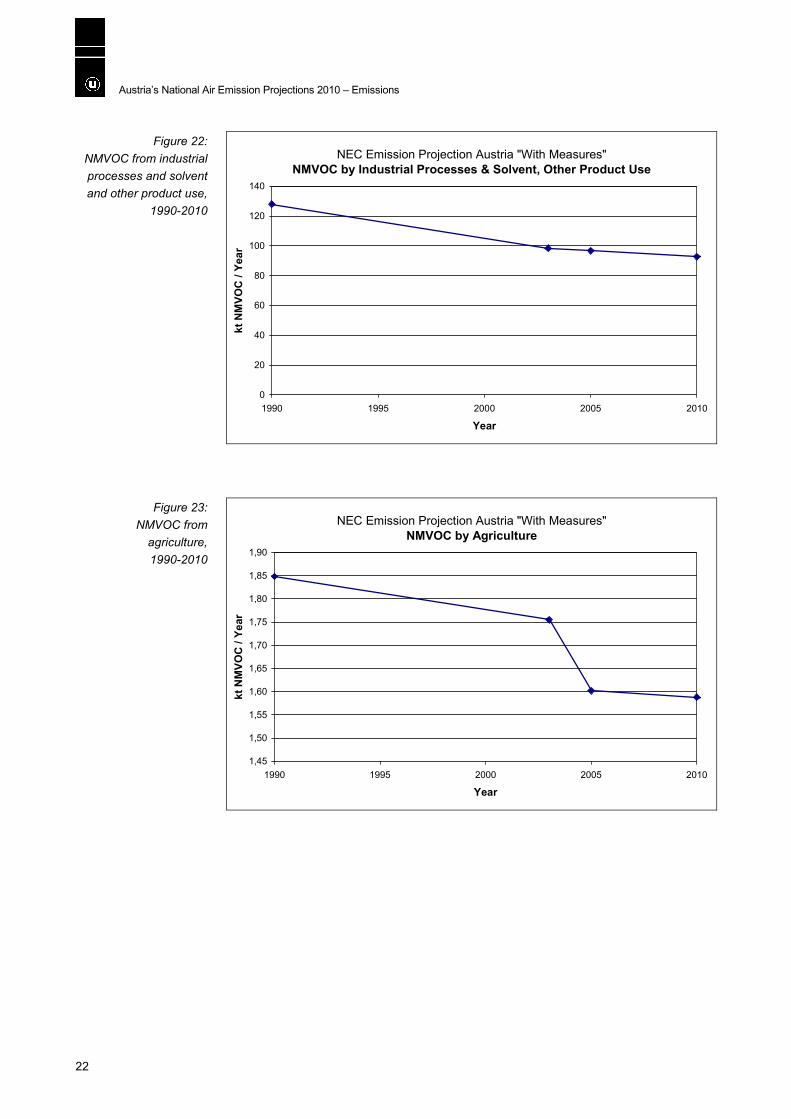
2, 3 Industrial Processes with Solvent and Other Product Use 128,05 98,34 96,74 92,74 2 A Mineral Products IE IE IE IE
2 B Chemical Industry 8,29 12,34 12,34 12,34
2 C Metal Production 0,52 0,41 0,41 0,41
2 D Other Production 2,29 2,96 2,96 2,96
2 G Other NA NA NA NA
3 Solvent and other Product Use 116,95 82,63 81,03 77,03
4 Agriculture 1,85 1,76 1,60 1,59 4 B Manure Management NA NA NA NA
4 C Rice Cultivation NO NO NO NO
4 D Agricultural Soils 1,72 1,63 1,48 1,46
4 F Field Burning of Agricultural Residues 0,13 0,13 0,13 0,13
4 G Other NO NO NO NO
6 Waste Management 0,19 0,13 0,12 0,10 6 A Solid Waste Disposal on Land 0,18 0,13 0,12 0,10
6 B Wastewater Handling NA NA NA NA
6 C Waste Incineration 0,01 0,00 0,00 0,00
6 D Other Waste NA NA NA NA
I B Av International Bunkers (Aviation) 0,31 0,61 0,76 0,91
I B Mar International Bunkers (Marine) NO NO 0,00 0,00
IE … included elsewhere; NA… not applicable; NO … not occurring
Austria’s National Air Emission Projections 2010 – Emissions
20
Sectoral emission projection of non-methane volatile organic compounds
NEC Emission Projection Austria "With Measures"NMVOC by Energy Industries + Fugitive Emissions
0
2
4
6
8
10
12
14
1990 1995 2000 2005 2010
Year
kt N
MVO
C /
Year
NEC Emission Projection Austria "With Measures"NMVOC by Manufacturing Industries and Construction
0,0
0,5
1,0
1,5
2,0
2,5
3,0
3,5
4,0
4,5
1990 1995 2000 2005 2010
Year
kt N
MVO
C /
Year
Figure 18: NMVOC from energy
industries and fugitive emissions, 1990-2010
Figure 19: NMVOC from
manufacturing industries and construction,
1990-2010

Austria’s National Air Emission Projections 2010 – Emissions
21
NEC Emission Projection Austria "With Measures"NMVOC by Transport
0
10
20
30
40
50
60
70
80
1990 1995 2000 2005 2010
Year
kt N
MVO
C /
Year
With "Tank Tourism"
Without "Tank Tourism"
NEC Emission Projection Austria "With Measures"NMVOC by Buildings and Other
0
10
20
30
40
50
60
70
80
1990 1995 2000 2005 2010
Year
kt N
MVO
C /
Year
Figure 20: NMVOC from transport, 1990-2010
Figure 21: NMVOC from buildings and other, 1990-2010
Austria’s National Air Emission Projections 2010 – Emissions
22
NEC Emission Projection Austria "With Measures"NMVOC by Industrial Processes & Solvent, Other Product Use
0
20
40
60
80
100
120
140
1990 1995 2000 2005 2010
Year
kt N
MVO
C /
Year
NEC Emission Projection Austria "With Measures"NMVOC by Agriculture
1,45
1,50
1,55
1,60
1,65
1,70
1,75
1,80
1,85
1,90
1990 1995 2000 2005 2010
Year
kt N
MVO
C /
Year
Figure 22: NMVOC from industrial processes and solvent and other product use,
1990-2010
Figure 23: NMVOC from
agriculture, 1990-2010

Austria’s National Air Emission Projections 2010 – Emissions
23
NEC Emission Projection Austria "With Measures"NMVOC by Waste Management
0,00
0,05
0,10
0,15
0,20
0,25
1990 1995 2000 2005 2010
Year
kt N
MVO
C /
Year
2.4 Ammonia (NH3)
The emissions of NH3 have slightly decreased since 1990. The main source for am-monia is the agricultural sector contributing more than 95 % of total NH3 emissions. The projections for 2010 show a further decrease of emissions and a reduction of 13 kt below the national emission ceiling.
NEC Emission Projection Austria "With Measures"Total NH3 by all Groups
0
10
20
30
40
50
60
70
1990 1995 2000 2005 2010
Year
kt N
H3 /
Yea
r
With "Tank Tourism"
Without "Tank Tourism"
NEC-Target
Projection
The trend follows Austrian livestock numbers and the reduction in housing systems of diary cattle.
Figure 24: NMVOC from waste management, 1990-2010
Figure 25: Historical and projected emissions of NH3 in comparison to the national emissions ceiling.

Austria’s National Air Emission Projections 2010 – Emissions
24
Table 6: Austria's NH3 emission projection for 2005 and 2010
NH3 [kt] NEC GAS SOURCE CATEGORIES
1990 2003 2005 2010
National Total with "Tank Tourism" 57,15 54,49 52,78 52,89
National Total without "Tank Tourism" 57,15 54,18 52,58 52,79
1 A 1, 1 B Energy Industries and Fugitive Emissions 0,20 0,30 0,31 0,32
1 A 1 Energy Industries 0,20 0,30 0,31 0,32
1 B 1 Solid fuels NA NA NA NA
1 B 2 Oil and natural gas IE IE IE IE
1 A 2 Manufacturing Industries and Construction 0,22 0,28 0,29 0,31
1 A 2 Manufacturing Industries and Construction 0,22 0,28 0,29 0,31
1 A 3 Transport 0,98 1,41 1,07 0,52
1 A 3 Transport 0,98 1,41 1,07 0,52
1 A 4, 1 A 5 Buildings and Other 0,63 0,75 0,75 0,74
1 A 4 a Commercial/Institutional 0,07 0,06 0,07 0,06
1 A 4 b Residential 0,51 0,65 0,64 0,63
1 A 4 c Agriculture/Forestry/Fisheries 0,05 0,05 0,04 0,04
1 A 5 Other 0,00 0,00 0,00 0,00
2, 3 Industrial Processes with Solvent and Other Product Use 0,27 0,08 0,07 0,07
2 A Mineral Products NA NA 0,00 0,00
2 B Chemical Industry 0,27 0,07 0,07 0,07
2 C Metal Production IE IE 0,00 0,00
2 D Other Production NA NA 0,00 0,00
2 G Other 0,00 0,00 0,00 0,00
3 Solvent and other Product Use NA NA 0,00 0,00
4 Agriculture 54,47 50,95 49,42 50,04
4 B Manure Management 46,34 43,09 41,14 41,58
4 C Rice Cultivation NO NO NO NO
4 D Agricultural Soils 8,08 7,82 8,24 8,42
4 F Field Burning of Agricultural Residues 0,05 0,04 0,04 0,04
4 G Other NO NO NO NO
6 Waste Management 0,38 0,72 0,87 0,89
6 A Solid Waste Disposal on Land 0,01 0,00 0,00 0,00
6 B Wastewater Handling NA NA NA NA
6 C Waste Incineration 0,00 0,00 0,00 0,00
6 D Other Waste 0,37 0,72 0,87 0,89
I B Av International Bunkers (Aviation) 0,00 0,00 0,00 0,00
I B Mar International Bunkers (Marine) NO NO 0,00 0,00
IE … included elsewhere; NA… not applicable; NO … not occurring

Austria’s National Air Emission Projections 2010 – Emissions
25
Sectoral emission projection of ammonia
NEC Emission Projection Austria "With Measures"NH3 by Energy Industries + Fugitive Emissions
0,00
0,05
0,10
0,15
0,20
0,25
0,30
0,35
1990 1995 2000 2005 2010
Year
kt N
H3 /
Yea
r
NEC Emission Projection Austria "With Measures"NH3 by Manufacturing Industries and Construction
0,00
0,05
0,10
0,15
0,20
0,25
0,30
0,35
1990 1995 2000 2005 2010
Year
kt N
H3 /
Yea
r
Figure 26: NMVOC from energy industries and fugitive emissions, 1990-2010
Figure 27: NH3 from manufacturing industries and construction, 1990-2010

Austria’s National Air Emission Projections 2010 – Emissions
26
NEC Emission Projection Austria "With Measures"NH3 by Transport
0,0
0,2
0,4
0,6
0,8
1,0
1,2
1,4
1,6
1990 1995 2000 2005 2010
Year
kt N
H3 /
Yea
r
With "Tank Tourism"
Without "Tank Tourism"
NEC Emission Projection Austria "With Measures"NH3 by Buildings and Other
0,56
0,58
0,60
0,62
0,64
0,66
0,68
0,70
0,72
0,74
0,76
0,78
1990 1995 2000 2005 2010
Year
kt N
H3 /
Yea
r
Figure 28: NH3 from transport,
1990-2010
Figure 29: NH3 from buildings and
other, 1990-2010

Austria’s National Air Emission Projections 2010 – Emissions
27
NEC Emission Projection Austria "With Measures"NH3 by Industrial Processes & Solvent and Other Product Use
0,00
0,05
0,10
0,15
0,20
0,25
0,30
1990 1995 2000 2005 2010
Year
kt N
H3 /
Yea
r
NEC Emission Projection Austria "With Measures"NH3 by Agriculture
46
47
48
49
50
51
52
53
54
55
1990 1995 2000 2005 2010
Year
kt N
H3 /
Yea
r
Figure 30: NH3 from industrial processes and solvent and other product use, 1990-2010
Figure 31: NH3 from agriculture, 1990-2010

Austria’s National Air Emission Projections 2010 – Emissions
28
NEC Emission Projection Austria "With Measures"NH3 by Waste Management
0,0
0,1
0,2
0,3
0,4
0,5
0,6
0,7
0,8
0,9
1,0
1990 1995 2000 2005 2010
Year
kt N
H3 /
Yea
r
Figure 32: NH3 from waste
management, 1990-2010

Austria’s National Air Emission Projections 2010 – Methodology
29
3 METHODOLOGY
3.1 General Approach
Generally, the projections were designed to be consistent with the Austrian Inven-tory in the projection base year 2003. Where reasonable and applicable, the emis-sions were calculated and projected on the basis of the methodology of the Aus-trian Inventory. The results for each gas are listed in the NFR (Nomenclature For Reporting) code. Seven aggregated projection source groups were defined as listed below.
Projection Source Group NFR
I Energy Industries + Fugitive Emissions 1.A.1 und 1.B
II Manufacturing Industries and Construction 1.A.2
III Transport 1.A.3
IV Buildings and Other 1.A.4 und 1.A.5
V Industrial Processes with Solvent and Other Product Use 2 und 3
VI Agriculture 4
VII Waste Management 6
For all sectors reduction measures were identified and emissions were projected by specifically designed models. The methodology used for the projections of the key driving forces and emissions calculation is described in detail in the respective chap-ters. Consistency between sector models was ensured by regular expert meetings which addressed overlaps and possible gaps.
In this report all implemented measures between 1.1.1995 and 25.1.2005 are con-sidered for the “with measures” scenario. Emissions from energy related sectors (NFR 1.A) are calculated on the basis of an energy projection established in Sep-tember 2005 [1].
3.2 Projections of key input parameters for emissions calculation
The general socio-economic assumptions data which form the basis of the Austrian emission projection can be found in table 7. An additional annual 3.2 % growth of the production of real assets (base year 2000) is assumed from 2004 to 2010. Fur-ther assumptions of key input parameters can be found in Tables 20 and 21.

Austria’s National Air Emission Projections 2010 – Methodology
30
Economic Growth (GDP, base year 2000) Population
Stock of Flats
Oil price, “Brent”, base year 2000
Exchange rate Year
[%, real] [mio] [mio] [US$ per bbl, real] [US$ per €]
2004 1,9 8,105 3,727 1,24
2005 2,2 8,131 3,740 35,0 1,34
2006 2,3 8,158 3,751 32,5 1,28
2007 2,2 8,184 3,762 30,0 1,22
2008 2,2 8,209 3,775 32,5 1,18
2009 2,2 8,233 3,789 34,0 1,15
2010 2,2 8,255 3,807 35,5 1,15
Model calculations are based on custom-made methodologies for the individual sec-tors. Emissions from the energy related sectors SNAP3 01-03 and industrial proces-ses SNAP 04 are based on a macro-economic model and on an energy model of the Austrian Institute for Economic Research [1]. Projections for solvent use (SNAP 06) have been modelled on the basis of recent studies carried out by the Institut für In-dustrielle Ökologie und Forschungsinstitut für Energie- und Umweltplanung Wirt-schafts- und Marktanalysen Ges.m.b.H. [2, 3].
Projections for Transport (SNAP 07 and 08) have been modelled by the Technical University of Graz [4]. Projections for the sector agriculture (SNAP 10) have been calculated by BAL Gumpenstein [5, 6] and the Austrian Institute for Economic Re-search (WIFO) [1] in cooperation with Umweltbundesamt.
The following table presents the main data sources used for activity data as well as information on who contributed to the calculations:
Sector Data Sources for Activity Data Emission Calculation
Energy Austrian Institute for Economic Research(macroeconomic model MULTIMAC, energy model DAEDALUS) Graz University of Technology (transport model GLOBEMI)
UMWELTBUNDESAMT (energy pro-viders and manufacturing industries) Austrian Energy Agency – EVA (residential and commercial sector) Graz University of Technology (transport sector)
Industry Austrian Institute for Economic Research(macroeconomic model MULTIMAC)
UMWELTBUNDESAMT
Waste Landfill database and projection on solid waste to landfill
UMWELTBUNDESAMT
Solvent Forschungsinstitut für Energie und Umweltplanung, Wirtschaft und Markt-analysen GmbH and Institut für indus-trielle Ökologie (bottom-up model)
Forschungsinstitut für Energie und Umweltplanung, Wirtschaft und Marktanalysen GmbH and Institut für industrielle Ökologie
Agriculture Animal number, fertilizer use, crop- and grassland: Austrian Institute for EconomicResearch (agriculture model PASMA) Animal waste management system dis-tribution 2005-2020: Federal Research Institute for Agriculture in Alpine Re-gions [6] (spreadsheet model)
UMWELTBUNDESAMT
3 SNAP: Selected Nomenclature for sources of Air Pollution
Table 7: Key input parameter of
emission projections
Table 8: Main data sources for
activity data and emission values

Austria’s National Air Emission Projections 2010 – Methodology
31
3.2.1 Energy Projections
The energy model has been developed by the Austrian Institute of Economic Re-search (“Wirtschaftsforschungsinstitut”, WIFO). It is an extension of the model sys-tem that was used for previous energy projections, for example those com-mis-sioned in 2001 by the Federal Ministry of Economics and Labour and the Fed-eral Ministry of Agriculture, Forestry, Environment and Water Management (WIFO 2001), see [7], and for Austria’s Third National Communication to the UNFCCC. The model is a macroeconomic energy and environment model; the energy system and the economy are integrated into one disaggregated model. Almost all parameters are based on econometric estimates with time series for Austria. It uses the format of the energy balances of the International Energy Agency, i. e. about 40 energy sources and about 70 categories of energy demand and supply. The economy is disaggre-gated into 31 sectors, taking into account the NACE sector definitions.
The energy scenarios have been calculated by the Institute of Economic Research as part of a contract with the Federal Ministry of Agriculture, Forestry, Environment and Water Management. These calculations are based on a WIFO report about energy scenarios for Austria up to 2020 [8] that was commissioned by the Federal Ministry of Economics and Labour in 2005. The “With Measures” energy scenario used for the emission projection is closely related to the “Baseline” scenario of this report.
3.2.2 Industrial Processes
The development of industrial production was forecast by applying macro-economic data for the sub-sectors [1], taking into account known predictions about expan-sions (iron and steel production [9]), the opening of new installations (sulphuric acid production [10, 11]) and the decommissioning of old facilities [12, 16].
3.2.3 Transport Projections
The forecast contains two different models:
Road and off-road except aviation: These sectors have been calculated by the Technical University of Graz using a macroeconomic model, the GLOBEMI model. The same model is also used for the yearly emission inventory. A comprehensive description of the methodology can be found in the Austrian Informative Inventory report [17].
The model considers different input parameters like GDP, mineral oil price and the development of infrastructure.
Aviation: The projection is an extrapolation of the trend of the latest years. The annual growth rate (of energy) is assumed to be 3.6 % until 2010, from 2010–2020 the assumed rate is approximately 3.4 %.

Austria’s National Air Emission Projections 2010 – Methodology
32
3.2.4 Agriculture Projections
Emissions are calculated on the basis of the methodology used for the Austrian in-ventory [17].
The required input parameters were estimated by means of a spreadsheet model (animal waste management system distribution data [6]) and the agricultural sector model PASMA. PASMA (developed by WIFO) was employed to estimate livestock population, the use of mineral fertilizers and the development of cropland and grass-land. The model is based on the method of positive mathematical programming (PMP). This approach is a mathematical non-linear projection model which allows flexible adaptations to new conditions.
Scenario assumptions, animal waste management system distribution and the re-sults of the PASMA model were supported by the following agricultural experts:
Policy measures: DI Elmar Ritzinger, BM für Land- und Forstwirtschaft, Umwelt und Wasserwirtschaft, Abteilung II/9: Investitionen und Marktstruktur
DI Sonja Schantl, BM für Land- und Forstwirtschaft, Umwelt und Wasserwirtschaft, Referat III/9b
DI Rupert Lindner, Landwirtschaftskammer Österreich, Referat III/1, Pflanzliche Erzeugnisse
Livestock projections, milk yield and animal waste management systems: DI Alfred Pöllinger et al., Federal Research Institute for Agriculture in Alpine Regions, A-8952 Irdning [5, 6].
The following policy measures are considered for implementation (“with measures” scenario):
implementation of the CAP 2003 reform; special attention is given to the Austrian variant of implementation (keeping the premiums for suckler cows – including heif-ers – and part of the slaughter premiums; allocation of premium rights to farmers);
due to uncertainties concerning the flow of funds from "modulation", we assumed that the amount that Austrian farmers who might be beneficiaries receive is the same as the one that other farms lose through this measure;
land is maintained in good agricultural and ecological condition ("cross compliance";
the programme for rural development is retained unchanged.
Overview of the PASMA scenario results "with measures"
Livestock
the number of livestock – in particular cattle – will get smaller because of reduced production incentives (premiums per head will be decoupled for bulls);
the number of suckler cows will be less affected because premiums per head will be coupled to production even after the reform in Austria; a given share of heifers qualifies for such premiums as well, therefore the number of suckler cows and heifers will be relatively constant;

Austria’s National Air Emission Projections 2010 – Methodology
33
since farmers will get coupled premiums either for suckler cows or heifers but other premiums for cattle will be abandoned, the population of suckler cows will not necessarily increase – the reason being that the model takes account of the profitability of the whole cattle production simultaneously – and an implication here is that the value of calves will drop;
our results suggest that the additional premiums for Austria will amount to a wind-fall for farmers producing heifers already (assuming that the market for suckler cow premium entitlements is working efficiently)
the consequence of lower prices for pork and poultry and lower feeding cost is that the output of none of these products will be expanded – this being a conse-quence of the modelling approach taken in this analysis;
therefore, less or no supply substitution of beef by other meat is expected; due to the model type used for this analysis, the change of pork and poultry pro-duction will be "0" under such circumstances.
Milk Yield
The volume of milk production is determined by the national quota which will be ex-panded in two steps and which will be fixed from 2008 onwards; since some share of milk is used as animal feed, production also depends on its nutritional value rela-tive to the production cost of increasingly productive milk cows; the decline of milk production from 2003 to 2005 was due to the assumption that lower milk prices would induce more farmers to refrain from an "oversupply" of milk above the quota (which effectively means that the super-levy will have economic consequences);
Organic Farming
Organic farming will become more attractive for farmers, mainly because of the as-sumption that premiums of the agri-environmental programme will stay in place and prices of organic products will be higher while opportunity costs will be lower after the implementation of the reform;
Animal Waste Management Systems (AWMS)
Austrian national statistics on AWMS are not available, and therefore the distribution used was estimated and forcast by national experts (Pöllinger and Ofner from BAL Gumpenstein [6]).
Synthetic Fertilizer Use
An agricultural sector model (PASMA, developed by WIFO) was employed to esti-mate the use of mineral fertilizers. The model (based on the method of positive mathematical programming) was used to evaluate the reform of the Common Agri-cultural policy and its development and, for trend scenarios with the implementation of Water Framework Directive [18] in other studies.
In the model, input requirements (and thus fertilizer demands) are evaluated at the nutritional level. The calculations mimic farmer behaviour, which allows for substitu-tion of nutrients purchased on the market (commercial fertilizer) with nutrients accu-mulated by crops (legumes) and animal waste containing nutrients (manure).

Austria’s National Air Emission Projections 2010 – Methodology
34
Agricultural Cropland
PASMA is a model which is calibrated using observed conditions during a base pe-riod. Therefore the model results are fully consistent with observations from official statistics. In the model, the economic accounts of agriculture [19] are used as a benchmark. Therefore crop allocations in the model are identical with those of offi-cial statistics during the base period.
In the forecast period, the model assumes that farmers choose to farm land accord-ing to the microeconomics of individual behaviour based on profit maximisation. In the model, all relevant farm policies are accounted for in a very detailed manner. Therefore the model is capable of considering support schemes for organic farming as well. This type of farming uses legumes to accumulate nutrients and the model considers this by incorporating nutrient balances.
Grassland
Grassland and arable land are treated similarly in the model: all relevant activities and policies affecting decisions on land allocation are accounted for. Given the re-cent reform of the Common Agricultural Policy, one important consequence is that the share of land used for agricultural purposes will be more or less frozen in the decade to come. In the past it was observed that a considerable part of land was afforested. According to the model results this trend will decline because "cross compliance" requirements will force farmers to maintain farm-land in good agricul-tural condition. A considerable part of the land previously used for arable crops will be converted into grassland, which will expand as a consequence.
3.3 Emission Calculation
3.3.1 General Approach
SNAP 01 – 04
The figures for energy demand in the Austrian economy [1] are split up according to the sub-sectors of the Austrian air emission inventory [17]. As the economic sectors of the energy model do not correspond to the SNAP sectoral structure, fuel con-sumption had to be assigned to the SNAP sub-sectors. Additionally, data from re-cent developments e.g. traffic projection and waste projection and deviations from the energy projections have been incorporated.
SNAP 05 - 10
Emissions for the other sectors are calculated on the basis of the methodology of the Austrian inventory. A comprehensive description of the methodologies used for calculating the Austrian Air Emissions Inventory can be found in the Austrian Infor-mative Inventory Report 2004 [17].

Austria’s National Air Emission Projections 2010 – Methodology
35
3.3.2 Combustion in Energy and Transformation Industries SNAP 01
3.3.2.1 Methodology
SO2 and NOX
Emissions for the year 2010 were calculated by multiplying projected energy data [1] by the respective emission factors. The latter were determined for power plants and waste incineration facilities on a plant specific basis for each fuel type taking into account expansions, the commissioning of new plants and the closing down of ex-isting facilities.
A detailed description of the methodologies used can be found in the cited literature [20, 25, 26].
NMVOC and NH3
NMVOC emissions were considered to remain constant at the level of 2003 [17] be-cause their share in total emissions is <1%.
NH3 emissions were considered to be proportional to the energy consumption of the related sectors. NH3 emissions from this sector contribute less than 1% of the total emissions.
3.3.3 Non-Industrial Combustion Plants SNAP 02
3.3.3.1 Methodology
SO2, NOX [27] and NMVOC [28]
Commissioned by the Austrian Ministry for Agriculture, Forestry, Environment and Water Management, the Austrian Energy Agency (EVA) conducted a study on pro-jections of NMVOC emissions until 2010 from the household and service sector [28]. An appropriate emission projection model based on spreadsheets was devel-oped which included the following key input parameters:
Final energy demand data of the energy projections [1] were used as activity data for the model.
The emission factors were calculated on the basis of:
• types of heating systems in use: single stoves, self-contained one storey heating systems and central heating
• age of heating systems in use: the systems in use where divided into three groups (boilers older than 20 years, boiler between 20 and 10 years, boilers younger than 10 years)
NH3
NH3 emissions were considered to remain constant at the 2002 level [17] because their share in total emissions is 1%.

Austria’s National Air Emission Projections 2010 – Methodology
36
3.3.4 Combustion in Manufacturing Industry SNAP 03
3.3.4.1 Methodology
SO2 and NOX
For the estimation of SO2 and NOx SNAP 03 and SNAP 04 were assessed together [21, 24]. The following industrial sectors were identified as major sources:
production from cement, glass and other mineral industry iron and steel production pulp and paper production process emissions of the chemical industry wood processing industry food industry production of non-ferrous metals other sectors of the production industries.
Emission data for the year 2003 was either calculated via reported emissions (cement, iron and steel, pulp and paper) [9, 12, 14] or via energy use (all others). In the first case energy data was used for plausibility checks. In the latter case, energy use was multiplied by sectoral emission factors to calculate emissions. These sectoral emis-sion factors were determined for each sector separately using data from plant spe-cific inquiries. For the pulp and paper industry, specific emission factors were calcu-lated for the different boiler types using the same methodology [15, 16].
Emissions for the year 2010 were calculated by applying the trend of the energy con-sumption [1] and incorporating recent data from environmental impact statements such as facilty expansions and the opening and closing down of facilities.
NMVOC and NH3
NMVOC emissions were considered to remain constant at the level of 2003 [17] be-cause their share in the total emissions is <1%.
NH3 emissions were considered to be proportional to the energy consumption of the related sectors. NH3 emissions from this sector contribute less than 1% of the total emissions.
3.3.5 Production Processes SNAP 04
3.3.5.1 Methodology
SO2 and NOX
The methodology of calculating SO2 und NOx is described in Chapter 3.3.4.1.
NMVOC
Because of the implementation of the IPCC Directive (existing installations have to apply BAT by October 2007) a reduction of 3 kt compared to 2002 is expected to be achieved in 2010 [29]. This potential is based on expert judgement.

Austria’s National Air Emission Projections 2010 – Methodology
37
NH3
NH3 emissions were considered to be proportional to the energy consumption of the related sectors. NH3 emissions from this sector contribute less than 1 % of the total emissions..
3.3.6 Fuels and Geothermal Energy SNAP 05
3.3.6.1 Methodology
SO2 and NMVOC
SO2 and NMVOC emission projections from SNAP 05 are based on 2003 emis-sion/activity data ratios and projected activity data such as natural gas and crude oil exploration and natural gas consumption according to [16]. Emission reduction meas-ures such as the introduction of vapour recovery units at depots and service stations were implemented in 2003 already and no further reductions are expected.
A detailed description of the methodology of emission estimation can be found in the Austrian Informative Inventory Report 2004 [17].
NOx and NH3
Emissions are not estimated in the Austrian inventory and have therefore not been incorporated in the projections.
3.3.7 Solvent and Other Product Use SNAP 06
3.3.7.1 Methodology
NMVOC
NMVOC emissions of this sector were estimated by means of an in-depth survey on the use and application of solvents and the emission situation in Austria [2]. The investigation was based on an extensive bottom-up survey, performed in selected, most relevant commercial sectors and involving 1300 Austrian companies. With a detailed questionnaire, the specific situation of solvent application in the company and an estimation of future developments (economic development of the company and use of abatement technologies) were obtained, besides some general informa-tion. From the responses received, it was possible to derive actual and accurate emission factors at sector level. The estimation of the future developments in the companies allowed the calculation of scenarios on application level for the future in which the expected economic and technical developments played a crucial role. As a second step, a survey in 1800 households was made [3] for estimating domestic solvent use. The use of solvents in the context of undeclared work and do-it-your-self activities was also calculated.
To verify the results from the bottom-up surveys for the base year 2000 the bottom-up approach was combined with top-down data. The top-down approach provided total quantities of solvents used in Austria. The share of the solvents used for the different applications and the solvent emission factors were calculated on the basis of the bottom-up approach. By linking the results of bottom-up and top-down ap-proaches, the quantities of solvents used annually and the solvent emissions for the different applications were obtained.

Austria’s National Air Emission Projections 2010 – Methodology
38
For the year 2010 the verified data was then projected according to the technical and economic developments which resulted from the questionnaire [2] on SNAP Level 3. The inventory has been updated with data from [3] since the study [2] was published. The proportional ratios of 2010 projections according to [1] to 2000 emis-sions according to [3] were used to calculate the projections 2010 for each of the 28 subcategories. NMVOC emissions for 2020 were set constant to 2010 emissions because no additional directive or any relevant change in technology is known for the period after 2010.
A comprehensive summary of the methodology for the base year 2000 can also be found in the Austrian Informative Inventory Report [17].
NOx, SO2 and NH3
According to the Austrian inventory there is no occurrence of NOx, SO2 and NH3 emissions from solvent use.
3.3.8 Road Transport and Other Mobile Sources and Machinery SNAP 07 and SNAP 08
3.3.8.1 Methodology
NOx, SO2, NMVOC and NH3
For the estimation of road and off-road emissions (without air-traffic) the GLOBEMI-Model is used for the transport and emissions projections [4]. Emissions are there-fore calculated on the basis of the methodology used for the Austrian inventory. A comprehensive description of the methodology can be found in the Austrian Infor-mative Inventory report [17].
The calculation of air-traffic emissions is also based on the calculation for the Aus-trian Inventory (Austrian best practice). These values are extrapolated with implied emission factors [30] obtained from the Austrian Inventory. According to the current study of the Öko-Institut 2004 [31] further improvements of NOx emission factors are not expected until 2010.
3.3.9 Waste Treatment and Disposal SNAP 09
3.3.9.1 Methodology
NOx, SO2, NMVOC and NH3
Waste Disposal: NMVOC and NH3 emissions are calculated by keeping the same ratio to CH4 emissions as for 2003. Projections of CH4 emissions are calculated by means of projected waste generation rates, an assumed share and degradable car-bon content of disposed waste and a share of recovered waste gas.
Waste Incineration: Because of the low contribution to the total emissions (below 1 % for all gases), emission levels from the year 2003 [17] were applied to 2010.
A detailed description of the methodology used for the emission estimation can be found in the Austrian Informative Inventory Report 2004 [17].
Austria’s National Air Emission Projections 2010 – Methodology
39
3.3.10 Agriculture SNAP 10
3.3.10.1 Methodology
Emissions are calculated on the basis of the methodology used for the Austrian in-ventory. A comprehensive description can be found in the Austrian Informative In-ventory report [17].
Input Parameters for the model have been estimated by BAL Gumpenstein and the Austrian Institute of Economic Research and are listed in Chapter 3.3.10.2. The meth-odology used for the estimation of input parameters is described in Chapter 3.2.4.
3.3.10.2 Key input parameters
Table 9: livestock population 2000 and projection for 2010
Population size [heads] * Livestock Category
Year Dairy Non DairyMother Cows
(suckling cows >2yr) Young
Cattle <1yrYoung
Cattle 1-2yr Cattle >2yr Sheep Goats
2000 621 002 1 534 445 252 792 655 368 466 484 159 801 339 238 56 105
2010 516 057 1 440 076 238 365 611 107 412 769 162 354 334 586 50 104
Table 10: Domestic livestock population 2000 and projection for 2010
Population size [heads] * Livestock Category
Year Horses Swine Fattening Pig >50kg
Swine for breeding >50kg
Young Swine <50kg Poultry Chicken
Other Poultry
2000 81 566 3 347 931 1 211 988 334 278 1 801 665 11 786 670 11 077 343 709 327
2010 87 072 3 216 235 1 227 143 333 812 1 655 280 13 006 682 12 354 358 652 324
year Milk yield kg/year
N excretion kg per animal per year
2000 5 210 64,50
2010 6 196 73,00
Animal Waste Management System (AWMS) distribution
Distribution year 2000: Comprehensive survey [32]
Distribution year 2010: Expert judgement Pöllinger et al. 2004 [6]
Table 11: Milk yield and corresponding N excretion rates per cow

Austria’s National Air Emission Projections 2010 – Methodology
40
Year Solid Storage [%] Liquid/Slurry [%] Pasture/Range/Paddock [%]
2000 70,4 19,0 10,6
2010 50 42,5 7,5
Year Solid Storage [%] Liquid/Slurry [%] Pasture/Range/Paddock [%]
2000 70,4 19,0 10,6
2010 50 0 50
Year Solid Storage [%] Liquid/Slurry [%] Pasture/Range/Paddock [%]
2000 61,8 12,0 26,2
2010 37,5 37,5 25
Year Solid Storage [%] Liquid/Slurry [%]
2000 71,3 28,7
2010 70 30
Year Solid Storage [%] Liquid/Slurry [%]
2000 51,4 48,6
2010 50 50
Year Solid Storage [%] Liquid/Slurry [%]
2000 30 70
2010 30 70
Year Solid Storage [%] Liquid/Slurry [%]
2000 28,1 71,9
2010 20 80
Year Mg N/year
2000 116 975*
2010 95 719
* Arithmetic mean of 1999 and 2000 sales data
Table 12: dairy cows – over year
(summer/winter)
Table 13: mother cows (suckling
cows) - over year (summer/winter)
Table 14: cattle 1-2 year – over year (summer/winter)
Table 15: cattle < 1 year
Table 16: cattle > 2 years
Table 17: breeding sows
Table 18: Fattening pigs
Table 19: Synthetic fertilizer Use

Austria’s National Air Emission Projections 2010 – Annex
41
ANNEX
Parameter 2000 2005 2010
Electricity import/exp. Ratio 0,91 1,19 1,13
Private cars [million] 3,8 4,2 4,4
Vehicle km on road [million km] 63 494 83 263 87 418
Steel production from Basic Oxygen steelmaking [in mio t] 4,08 6,51 6,75
Cattle [1 000 head] 2 155 1 989 1 941
Parameter Average for 2005 to 2010
Energy prices – Industry [% Growth per year] Coal + 2,1 %
Fuel oil +1,5 %
Natural gas + 0,9 %
Electricity + 0,8 %
Energy prices – Households [% Growth per year] Coal + 2,0 %
Fuel oil + 0,5 %
Natural gas + 0,4 %
Electricity + 0,7 %
Table 20: Underlying key variables for projections "with measures"
Table 21: Underlying energy price development for projections "with measures"

Austria’s National Air Emission Projections 2010 – References
42
REFERENCES [1] WIFO 2005; „With Measures“ Baseline for the Greenhouse Gas Emission Projection;
Calculations within the project „Volkswirtschaftliche Auswirkungen unterschiedlicher Maß-nahmen zur Erreichung des Kyoto-Ziels“; Österrei-chisches Institut für Wirtschaftsfor-schung; Kratena, September 8th 2005.
[2] IIÖ (Windsperger, Steinlechner, Schmidt-Stejskal) & FIEU (Draxler, Fister, Schönstein, Schörner): „Verbesserung von Emissionsdaten (Inventur und Projektion bis 2010 für den Bereich Lösungsmittel in Österreich“, Institut für Industrielle Ökologie (IIÖ) und For-schungsinstitut für Energie und Umweltplanung, Wirtschaft- und Marktanalysen GmbH (FIEU), St. Pölten Dezember 2002.
[3] IIÖ (Windsperger, Steinlechner, Schmidt-Stejskal) & FIEU (Draxler, Fister, Schönstein, Schörner): „Studie zur Anpassung der Zeitreihe der Lösungsmittelemissionen der öste-rreichischen Luftschadstoffinventur (OLI) 1980–2002“, Institut für Industrielle Ökologie (IIÖ) und Forschungsinstitut für Energie und Umweltplanung, Wirtschaft- und Markt-analysen GmbH (FIEU), St. Pölten, February 2004.
[4] TU Graz: Hausberger: „Entwicklung von Luftschadstoffemissionen aus dem Verkehr bis 2010 und Abschätzung von Maßnahmenwirkungen“; Erstellt im Auftrag von Umwelt-bundesamt, Bundesministerium für Land- und Forstwirtschaft, Umwelt und Wasserwirt-schaft sowie dem Bundesministerium für Verkehr, Innovation und Technologie, Graz 2003.
[5] FEDERAL RESEARCH INSTITUTE FOR ALPINE REGIONS, Pöllinger: „Prognose der Rinderbe-standsentwicklung und der Wirtschaftsdüngersysteme“ im Rahmen des Workshops „Wirtschaftsprognose bis 2020 für den Landwirtschaftssektor und für den Tierhaltungs-sektor“, Presentation at the UBA-Workshop, Vienna, 24th February 2005.
[6] FEDERAL RESEARCH INSTITUTE FOR ALPINE REGIONS, Pöllinger, Ofner: Expert judgement of animal waste management system distribution 2005 – 2020., Gumpenstein, Austria, 2004.
[7] WIFO 2001, Kratena, Schleicher: „Energieszenarien bis 2020”, Vienna, 2001
[8] WIFO 2005; Kratena, Würger: „Energieszenarien für Österreich bis 2020”, Vienna, June 2005
[9] VOESTALPINE STAHL LINZ: „Environmental Impact Assessment 2010“, Linz 2003.
[10] UMWELTBUNDESAMT M 105, Wiesenberger,: „State-of-the-Art for the Production of Fer-tilisers with Regard to the IPPC-Directive „, Vienna 2002.
[11] BUNDESMINISTERIUM FÜR LAND- UND FORSTWIRTSCHAFT, UMWELT UND WASSERWIRTSCHAFT: „Nationaler Zuteilungsplan für Österreich gemäß § 11 EZG“, Vienna 2004.
[12] Mauschitz: „Emissionen aus Anlagen der österreichischen Zementindustrie V“, Ze-ment + Beton Handels- und Werbeges.m.b.H., Vienna 2005.
[13] UMWELTBUNDESAMT M-150, Wiesenberger: „State-of-the-art for the production of nitric acid with regard to the IPPC Directive”, Vienna 2001.
[14] UMWELTBUNDESAMT BE 261, Szednyj, Schindler: „Minderungspotentiale der NEC-Gase und Staub bis 2010 der Österreichischen Zementindustrie“, , Vienna 2005.
[15] AUSTROPAPIER: „Papier aus Österreich“, Sonderheft 2005, Vienna 2005.
[16] Personal communication (confidential information).

Austria’s National Air Emission Projections 2010 – References
43
[17] UMWELTBUNDESAMT 2004, Anderl, Halper, Kurzweil, Poupa, Wappel, Weiss, Wieser: ”Austria’s Informative Inventory Report 2004“, Vienna 2004.
[18] WIFO, Sinabell, Schmid: „5. Instrumente und Maßnahmen zur Senkung der Belastung von Gewässern“ in: Kletzan, Sinabell und Schmid, Landwirtschaft und Wasser – Nut-zung, Kostendeckung und Entwicklung der Belastung. Studie des Österreichischen Ins-tituts für Wirtschaftsforschung im Auftrag des Bundesministeriums für Land- und Forst-wirtschaft, Umwelt und Wasserwirtschaft, Abteilung I/4 Wasserlegistik und -ökonomie, Vienna, Oktober 2004, 47-58.
[19] EUROSTAT: „Manual on the economic accounts for Agriculture and Forestry EAA/EAF 97 (Rev.1.1)”, Theme 5 Agriculture and Fisheries, Luxembourg 2000.
[20] STATISTIK AUSTRIA: „Energiestatistik 1993-1999“, Vienna 2000.
[21] UMWELTBUNDESAMT BE 233: „NOx-Emissionen: Minderungspotenziale in ausgewählten Sektoren und Szenarien 2010“, Vienna 2003.
[22] BUNDESMINISTERIUM FÜR LAND- UND FORSTWIRTSCHAFT, UMWELT UND WASSERWIRTSCHAFT: „Nationaler Zuteilungsplan für Österreich gemäß § 11 EZG“, Vienna 2004.
[23] UMWELTBUNDESAMT M 162: „Stand der Technik bei kalorischen Kraftwerken und Refe-renzanlagen in Österreich“, Wien 2003.
[24] UMWELTBUNDESAMT BE 232: „Abschätzung der SOx-Emissionen im Jahr 2010 für Energie (SNAP 01) und Industrie (SNAP 03, 04)“, Wien 2003.
[25] UMWELTBUNDESAMT / BMLFUW: „State of the Art for Waste Incineration Plants“ Band 24/2002, Vienna 2002.
[26] OMV: Dokumentations CD „Das Herz der OMV“, Schwechat 2000.
[27] AUSTRIAN ENERGY AGENCY (EVA), Energieverwertungsagentur: „Abschätzung der Ent-wicklung der SO2 und NOx-Emissionen im Bereich Kleinverbraucher“; Erstellt im Auf-trag von Umweltbundesamt, Bundesministerium für Land- und Forstwirtschaft, Umwelt und Wasserwirtschaft, Vienna 2003 (www.eva.ac.at).
[28] AUSTRIAN ENERGY AGENCY (EVA), Energieverwertungsagentur: „Abschätzung der Ent-wicklung der NMVOC-Emissionen im Bereich Kleinverbraucher“;Erstellt im Auftrag von Umweltbundesamt, Bundesministerium für Land- und Forstwirtschaft, Umwelt und Was-serwirtschaft, Vienna 2003 (www.eva.ac.at).
[29] TÜV BAYERN, LANDESGESELLSCHAFT ÖSTERREICH: „Vorschlag für einen Maßnahmenplan zur Reduktion der Ozon-Vorläufersubstanzen NOx und VOC in Österreich bis 2010“; Erstellt im Auftrag von Umweltbundesamt, Bundesministerium für Land- und Forstwirt-schaft, Umwelt und Wasserwirtschaft, Vienna 2002 (not published).
[30] Kalivoda, Kudrna: „Report on Air Traffic Emission Calculation in Austria 1990–2000“. Study report on contract to the environmental agency of Vienna 2002 (not published).
[31] ÖKO-INSTITUT: „Emissionshandel im internationalen zivilen Luftverkehr“, Berlin 2004.
[32] Konrad: „Die Rinder-, Schweine- und Legehennenhaltung in Österreich aus etholo-gischer Sicht“, WUV Universitätsverlag, Vienna 1995.


This report presents Austria’s emission projections for 2010 for sulphur dioxide (SO2), nitrogen oxides (NOx), ammonia (NH3) andnon-methane volatile organic compounds (NMVOC). It includes background information to enable a quantitiative understanding ofthe key socioeconomic assumptions used in the preparation of theprojections. For comparison, this report also includes emission datafrom the 2004 national air emission inventory on which the projections were based. This report is in accordance with UNECE/CLRTAP and EU NEC Directive2001/81/EC. These obligations have been transposed into nationallaw by the Emissionshöchstmengengesetz-Luft.
ISBN 3-85457-855-5
Umweltbundesamt GmbHSpittelauer Lände 51090 Wien/Österreich
Tel.: +43-(0)1-313 04Fax: +43-(0)1-313 04/5400