Embed Size (px)
Citation preview

Australian National University
Faculty of Economics and Commerceand
Economics ProgramResearch School of Social Sciences
WORKING PAPERS IN
ECONOMICS AND ECONOMETRICS
IMMIGRANT BENEFIT RECEIPT:SENSITIVITY TO THE CHOICE OF SURVEY
YEARS AND MODEL SPECIFICATION
Thomas F. Crossley, James Ted McDonald,Christopher Worswick
WORKING PAPER NO. 370
May 1999

1
IMMIGRANT BENEFIT RECEIPT:
SENSITIVITY TO THE CHOICE OF SURVEY
YEARS AND MODEL SPECIFICATION
Thomas F. Crossley
James Ted McDonald
Christopher Worswick*
WORKING PAPER NO. 370
May 1999
ABSTRACT
Receipt of unemployment insurance by immigrant men and social assistance byimmigrant families are analysed using thirteen surveys from Canada. Estimatesfrom a cohort fixed effects model are found to be sensitive to the choice of surveyyears. This is due to the mis-specification of the fixed effects model which isrejected when tested against a model allowing for separate year-since-migrationeffects by arrival cohort. The estimates from the more general model provide littleevidence of higher receipt of these benefits, ceteris paribus, for more recentcohorts or that immigrants assimilate toward greater receipt of these benefits.
ISBN: 0 86831 370 X
* Thomas T. Crossley, Department of Economics, York University, Canada, and Visiting Fellow, Economics Program, Research School of Social Sciences, Australian National University.James Ted McDonald, Economics Department, University of Tasmania.Christopher Worswick, Department of Economics, University of Melbourne.Contact: Thomas Crossley, E-mail: [email protected].
The authors have benefited from discussions with Michael Baker, Charles Beach and Dwayne Benjamin. The usual caveat applies.

2
1. Introduction
Evaluation of the success of immigration policy has often been measured in terms of the
success of the immigrants in the new labour market. One measure of the labour market
performance of the immigrant groups is reliance on government assistance through
unemployment benefits and social assistance.1 The approach in this paper is to re-evaluate
the existing evidence on immigrant use of Unemployment Insurance (UI) and use of Social
Assistance (SA) benefits using the Canadian Survey of Consumer Finances (SCF) data of
Statistics Canada. These cross-sectional data sets have the advantage that they have
detailed information on immigrant status for annual surveys available over a 14 year time
period. The 1985 and 1990 SCF data sets were used by Baker and Benjamin (1995) and
we adopt much of their framework.2 Our primary interest is in investigating: 1) whether
estimates of immigrant reliance on UI and SA are sensitive to the survey years chosen and
2) whether the commonly used cohort fixed effects specification is adequate in terms of
explaining the dynamic behaviour of immigrant use of these programs.3
We find evidence that estimates from cohort fixed effects models of immigrant
receipt of UI and SA are sensitive to the choice of survey years. Tests are performed of the
fixed effects specification versus the alternative specification of separate linear/quadratic
years-since-migration profiles by immigrant arrival cohort. For both receipt of UI and SA,
the restriction implicit in the fixed effects specification is rejected by the data. The estimates
from the more general model do not support two of the main conclusions of Baker and
Benjamin (1995) that: 1) more recent immigrant cohorts have had higher probabilities of
1 Baker and Benjamin (1995) give a good review of the literature on immigrant receipt of governmentbenefits. See also Borjas and Hilton (1996). For examples of analyses on earnings see Chiswick (1978),Borjas (1985) and Baker and Benjamin (1994). 2 The SCF survey is carried out in April of each year. The survey asks respondents information relating tothe survey week (in April) as well as the preceding calendar year. The survey weeks for these two surveysare in 1986 and 1991. In this paper, when referring to a cross-section from the SCF, we will identify thesurvey by the survey year rather than the year of the survey week.3 McDonald and Worswick (1997) use the 1981-1992 SCF data sets and find that the variations in thedifference between the probability of unemployment of recent immigrants compared with the Canadian-born vary in a way consistent with a sensitivity to the business cycle. McDonald and Worswick (1998a) usethe same data and find that the estimates from a cohort fixed effects specification of an immigrant earningsfunction are sensitive to the survey years chosen. They also find that the movement of earnings of recentcohorts over the 1980s and early 1990s are consistent with the rate of earnings assimilation being higher inexpansionary periods and lower in recessionary periods. Duleep and Sanders (1996) find an inverserelationship between entry earnings and growth that is consistent with the rate of assimilation differingacross arrival cohorts. Duleep and Sanders (1997) find evidence that is also consistent with the idea thatimmigrant arrival cohorts differ in terms of their rate of wage assimilation.

3
receiving UI or SA holding years-since-migration constant and 2) that their probabilities of
receiving benefits under these programs have grown, ceteris paribus, with years in Canada.
We would like to stress that, conditional on the survey years used and the model
specification employed, our results are qualitatively the same as those of Baker and
Benjamin (1995). Also, only recently have the full set of SCF data sets become available at
a cost that would allow for an analysis of this kind.
2. Theoretical Issues and Estimating Equations
Logit estimation will be carried out over the binary outcome of whether: 1) the individual
receives unemployment insurance and 2) the family receives social assistance. The first
specification used in the estimation will be referred to as the Fixed Effects (FE) specification and
has the following form:
itittt
tititj
ijj XYRYSMYSMC εαλθθδ +++++ ∑∑ '221 )( (1)
and this is equivalent to equation (1) in Baker and Benjamin (1995).4 The dummy variables,
Cij for j=1,...,J, identify immigrants in each of the seven arrival year cohorts observed in the raw
data: arrival prior to 1956, 1956-65, 1966-70, 1971-75, 1976-80, 1981-85 and 1986-90.5 These
capture the fixed differences in the index across the arrival cohorts, ceteris paribus, and will be
referred to as the fixed effects. Assimilation effects are captured by the years-since-migration
(YSM) variables, YSMit and YSMit2, where YSMit is calculated as the number of years that have
elapsed as of year t since person i first migrated to Canada.6 The variables YRt identify the
survey year that the individual observation appears in.
A second specification that will be used in the estimation allows for separate assimilation
paths by cohort and has the following form:
ititkj
ijitjkj
ijitjititj
ijj ZCYSMCYSMYSMYSMC υβφφφφγ ++++++ ∑∑∑≠≠
'221
221 )()( (2)
4 The only notational differences are: 1) we include dummy variables for the cohorts whereas they presentseparate intercepts for the cohorts and 2) we include a set of dummy variables for the time periods whereasthey include only one since they use only two surveys.5 Inconsistencies exist in terms of the definitions of the post-1980 cohorts across the surveys. These arediscussed in the Appendix.

4
The variables are defined in the same way as in (1) with the exception that a set of year
dummy variables identifying the years 1982, 1984 through 1994 are suppressed and
implicitly included in Z’it. This specification nests (1). The restriction that reduces (2) to (1)
is that each of the φ1j and φ2j, the coefficients on the interaction terms of the cohort dummy
variables with the YSM variables, equals zero. Specification (2) will be referred to as the
Separate YSM Profile specification. The interactions terms between the YSM variables and
the cohort variables allow us to capture different growth rates in receipt of government
benefits for immigrants from different arrival periods. These differences may be due to
differences across immigrant arrival cohorts in terms of their unobserved characteristics or
they may be due to changing characteristics of the Canadian labour market over time that
have differential impacts on immigrants form different arrival periods.
3. The Data and Estimation Sample
The data used in the estimation in the UI section of the paper come from the microdata
tapes titled Individuals age 15 and Over, With and Without Income of the Survey of
Consumer Finances of Statistics Canada. The eleven reference years for the surveys are
1981, 1982 and 1984 through 1994.7 For the analysis on the receipt of UI, the sample is
restricted to men between the ages of 16 and 64 in the survey year in which they appear.
We also replicate the analysis of Baker and Benjamin using data from the SCF Census Family
files and analyse the incidence of use of SA.8
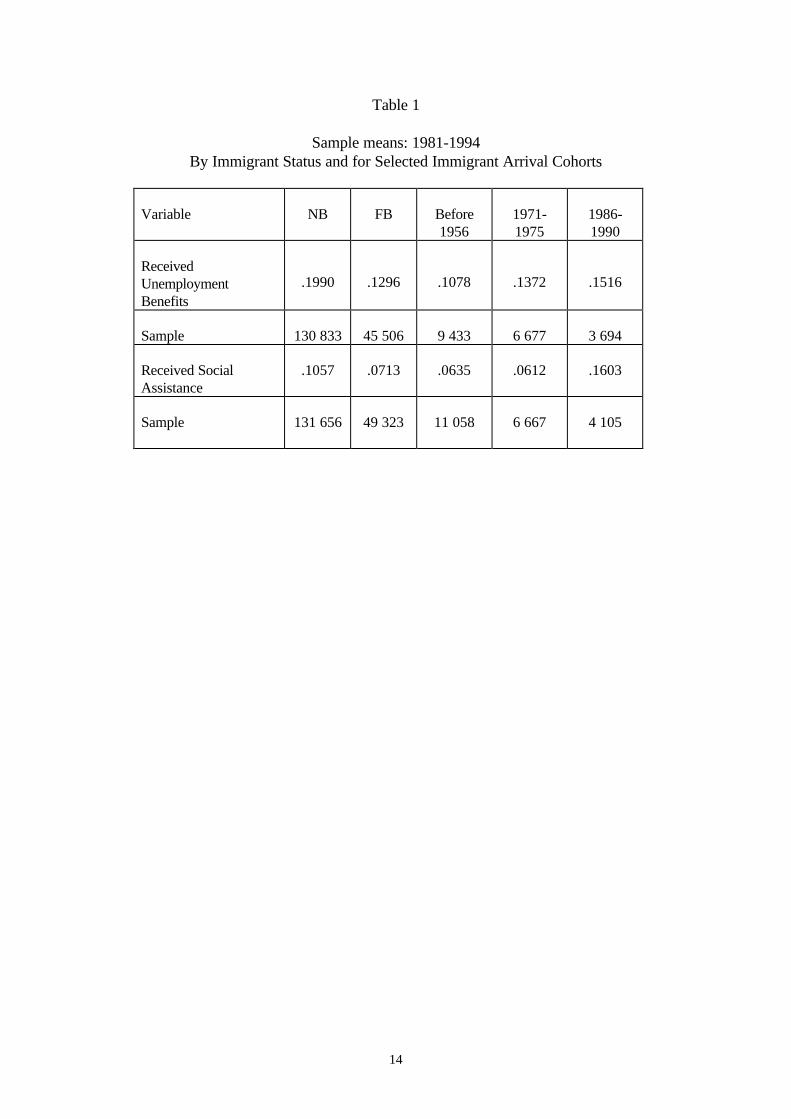
Sample means are presented in Table 1. Native-born men have a higher rate of use
of UI than do immigrant men and this is true for each of the three arrival cohorts presented.
Immigrant use of UI is higher for more recent cohorts than for earlier cohorts. A similar
pattern emerges in the sample means for use of SA by families. Native-born families have a
higher rate of use than immigrant families and the most recent cohort of immigrant families
is the most likely to use SA of the three cohorts presented. The only difference in the
pattern is due to the very high rate of use of SA for the 1986-90 cohort. They have a six
percentage points higher rate of use of SA than do the native-born.
6 Years-since-migration is set to zero for native-born persons.
7 Each survey was carried out in a two week period in the April following the survey year. The survey wasnot carried out in April 1984; therefore, information on the 1983 survey year is not available.

5
4. Estimation Results
4.1 Participation in unemployment insurance
In Table 2, results are presented from Logit estimation over participation in UI using
equation (1) and data from pairs of survey years. The specification of the index includes
controls for demographic characteristics following the definitions used in Baker and
Benjamin’s `Demographic Controls’ specification.9 The results replicate the analysis done
by Baker and Benjamin (1995) as they use the 1985 and 1990 SCF data.10
The different combinations of survey years allow us to investigate the sensitivity of
the results to the choice of survey years. The estimates from the fixed effects specification
should not be sensitive to the choice of survey years under the identifying assumptions: 1)
year effects impact the receipt of UI by immigrant and non-immigrant men to the same
extent and 2) immigrant/non-immigrant differences in receipt of UI are the same across
arrival cohorts up to an intercept shift.
The coefficients on the YSM variables and the arrival cohort variables are highly
sensitive to the choice of survey years. The results presented in column (3) using data from
1988 and 1993 are broadly consistent with those of Baker and Benjamin; however, the
estimates of the cohort differences are much larger. In columns (2) and (4) – where the
1984/89 and 1984/94 survey pairs are used – the point estimates on the YSM variables
imply a decreasing (at least initially) and convex participation in UI/YSM profile rather than
the increasing and concave profile found in column (1) – where the 1985/90 survey pairs
are used. The most striking case is column (4) where a ten year spread of surveys is
employed and the coefficients on the YSM variables are each individually significant. The
coefficients on the cohort dummy variables also do not follow an obvious pattern. Com-
paring these results with those found by Baker and Benjamin leads to opposite conclusions.
8 We are unable to replicate the analysis of rent subsidy due to availability of data.9 The analysis was repeated for their `No additional controls’, `Economic controls’, and `Full Interactions’specifications. In all cases, a similar sensitivity to the choice of survey years is present. These results areavailable from the authors. 10 The survey weeks of these surveys are 1986 and 1991, respectively. The results differ slightly from whatBaker and Benjamin found although they are qualitatively the same. The differences are likely due todifferences in the definition of the YSM variable. Baker and Benjamin do not give the value of YSM theychose for the earliest category, before 1956. We tried a number of values but were unable to exactlyreplicate their numbers.

6
The results from column (1) suggest a general increase in participation, ceteris paribus, for
recent cohorts of immigrants compared with earlier cohorts, and an assimilation towards
greater UI participation with YSM. The estimates from (4) indicate no obvious pattern of
differences across arrival cohorts, ceteris paribus, and a dynamic path that implies less
participation with time in Canada initially with this effect diminishing over time.11
In Table 3, results are presented from Logit estimation using the separate YSM
profiles specification, (2), over the pooled sample of all 13 survey years. The estimates
indicate that the immigrant/non-immigrant difference in participation in UI varies across
cohorts and these differences also vary with YSM. The default cohort, 1971-75, have
significantly higher participation in UI than otherwise similar, non-immigrant men;
however, this difference shrinks with year-since-migration in the first years after migration
at a declining rate. The coefficient estimates are virtually the mirror image of those found
in column (1) of Table 2. There is a great deal of variation in the coefficients on the cohort
dummy variables especially for the pre-1980 cohorts. In order to derive the YSM paths for
these cohorts it is necessary to take the coefficients on the default YSM variables and add
on the relevant coefficients from the interactions of the cohort variable with the YSM
variables. There is not a simple pattern evident in the cohort dummy variables and the
interactions but it is clear that for none of the pre-1980 cohorts do we see cohort effects
and YSM profiles of the kind found in column (1) of Table 2. In all cases we see either a
negative or near zero coefficient on the YSM variable and a positive or near zero
coefficient on the squared YSM term.
A different process appears to determine the participation of the post-1980 cohorts.
For the 1981-85 cohort, we see significantly lower participation in UI upon arrival than for
otherwise similar non-immigrant men. Also, the participation in UI rises quickly with YSM
initially; however, this rate of increase also declines quickly as indicated by the significant
positive coefficient on the YSM interaction and the significant negative coefficient on the
11 Estimation was carried out over all possible combinations of pairs of survey years that are: 1) five yearsapart or 2) ten years apart. Estimation was also carried out using specification (1) over the pooled sampleof all thirteen years. In all cases and for all of their four model specifications, we found a general sensitivityof the results of the kind presented in Table 2 to the choice of survey years.

7
YSM2 interaction term.12 The coefficients on the cohort dummy variable for the 1986-90
cohort and its YSM interactions follow the same pattern; however, they are not individually
significant. This may be due to the limited number of years for which this cohort is
observed in the sample.
A test was performed of the restriction that each of the coefficients on the
interactions of the cohort dummy variables with the YSM interaction variables equaled
zero and this restriction was rejected by the data.13 This restriction reduces specification
(2) to specification (1) and, therefore, this is a test of the fixed effects specification
employed by Baker and Benjamin and a number of other authors in the literature. This
gives a possible explanation for the sensitivity of the results in Table 2 to the choice of
survey years. The Logit model used is mis-specified. Intuitively, the mis-specification is
due to an assimilation away from UI participation for the pre-1980 cohorts and an
assimilation towards UI participation in the early years after migration for the 1981-85
cohort. The fixed effects specification used in generating the results of Table 2 cannot
accommodate differences in the dynamics of participation in UI of this kind across different
cohorts.14
In Figure 1, differences in the predicted probability of receipt of UI between an
immigrant and a non-immigrant are presented by cohort and YSM. The YSM values are
plotted for the ranges of YSM over which each arrival cohort is observed in the data. The
estimates from column (1) of Table 2 are used in generating the probabilities.15 The recent
cohorts have higher probabilities of receipt of UI than the native born after roughly four
years-since-migration. Successive arrival cohorts have higher probabilities of receipt of UI
than their predecessors, ceteris paribus, for all values of YSM. For example, the 1981-85
12 Note that the coefficients on the interaction terms are each larger in magnitude than the coefficients onthe default YSM profile listed in the 1971-75 cohort’s row. To get the total effect of YSM it is necessary toadd the coefficients so that the net coefficient on the YSM variable is .2939 and the net coefficient onYSM2 is –2.030 (after multiplying by 100).13 The Chi-square test statistic with twelve degrees of freedom was 42.06 and the p-value of the test wasless than .0000.14 This may be related to changes in the Canadian labor market after 1980. The average unemploymentrate was higher after the recession of the early 1980s than before (see Card and Riddell, 1993). It may bethat immigrants who arrived after 1980 were particularly sensitive to the changes.15 The demographic characteristics are set at the mean values of AGE and AGE2, and the default categoriesof the remainder of the variables.

8
cohort at ten years-since-migration have probabilities of receipt of UI that are ten
percentage points higher than the non-immigrant men while the 1976-80 cohort at ten
years-since-migration are predicted to have probabilities that are 1.4 percentage points
higher than the non-immigrant men.
In Figure 2, equivalent predicted differences in probability of UI receipt between
immigrants and non-immigrants using the fixed effects specification and the estimates from
Table 3 where estimation is carried out over the pooled sample from all thirteen survey
years using the separate YSM profile specification, (2). The contrast with Figure 1 is
dramatic. The results indicate that, for the majority of cohorts and YSM values, we see
only small differences between the probability of receipt of UI for immigrants compared
with non-immigrants. The convex shape of the profiles for the pre-1980 cohorts is
apparent as is the concave shape of the profiles for the 1981-85 and 1986-90 cohorts. It is
interesting to note that these cohorts see their participation peak over the sample period at
less than ten years-since-migration.16 The fixed effects specification used in developing
Figure 1 is unable to capture both the positive/concave shape of the YSM profiles for the
post-1980 cohorts and the negative/convex shape of the YSM profiles for the pre-1980
cohorts.
4.2 Participation in Social Assistance
In this section, the analysis of Section 4.1 is repeated with the dependent variable indicating
household receipt of SA rather than an individual man receiving Unemployment Insurance.
The sample is taken from the SCF Census Family File rather than the SCF Individuals File.
The formats of Tables 4 and 5, and Figures 3 and 4 mimic those of Tables 2 and 3, and
Figures 1 and 2. The definitions again are designed to match those used by Baker and
Benjamin (1995).
16 It is also worth noting that the values of YSM for which these profiles hit peaks coincide with the timingof the recession of the early 1990s. This may be picking up a greater sensitivity of the use of UI to themacroeconomic conditions of recently arrived immigrant men compared with other men. See McDonaldand Worswick (1997) and McDonald and Worswick (1998a) for similar findings in studies ofunemployment incidence and earnings of immigrant men in Canada, respectively. McDonald andWorswick (1998b) find evidence that the earnings of young men in Canada are more sensitive to thebusiness cycle than are the earnings of older men so that this sensitivity may be in part due to a labourmarket entry effect. An investigation of this possibility is left for future work.

9
In Table 4, results are presented from the Logit estimation over the participation of
the household in SA using the fixed effects specification, (1).17 As was the case for the UI
estimation, we found results that were qualitatively the same as those of Baker and
Benjamin (1995) with only small differences in the parameter estimates. Columns (2)
through (4) give estimates from different combinations of survey years. The sensitivity of
the results to the choice of survey years is evident. In Columns (3) and (4) - where the
1988/93 and 1984/94 survey year pairs are employed - the cohort patterns and significance
of the coefficients on the cohort variables are very similar to those is column (1) - where
the 1985/90 survey year pair is employed. However, the coefficients on the YSM variables
are near zero and not significant. In column (2), two survey years (1984 and 1989) are
employed that are very close to those used in the estimation of column (1) – 1985 and
1990. The YSM profile is upward-sloping (for low YSM) and concave in column (1) and
downward-sloping (for low YSM) and convex in column (2) with the YSM coefficients
being individually significant. Also, the test of cohort equality represented by the equality
of the coefficients on the immigrant cohort dummy variable is rejected in column (1) but
not rejected in column (2) with a p-value of .22.
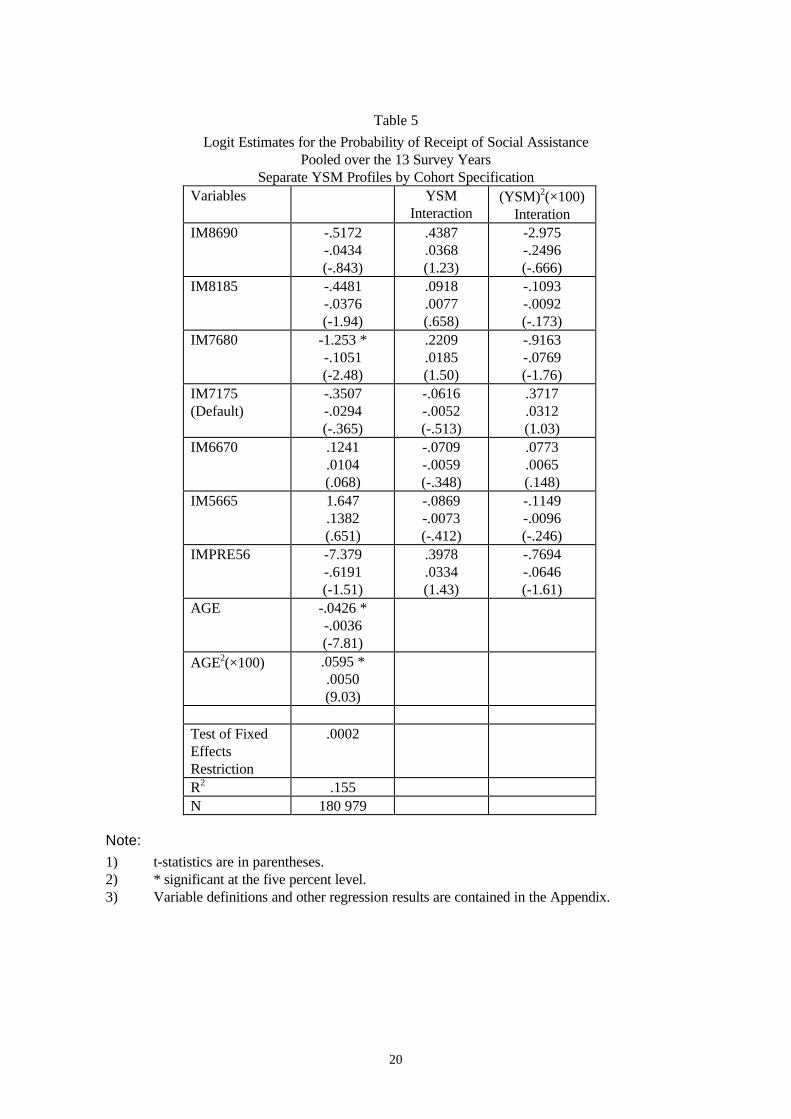
In Table 5, results are presented from Logit estimation of social assistance
participation using the separate YSM profiles specification, (2). The point estimates follow
very similar patterns to those found in Table 5; however, very few of the coefficients are
individually significant. We tested the fixed effects restriction and found that the data
rejected it.18 Therefore, it appears that the sensitivity found in Table 4 to the choice of
survey years can again be attributed to the mis-specification of the fixed effects model.
Figure 3 presents the differences in the probability of receipt of social assistance of
an immigrant family compared with a non-immigrant family by arrival cohort and YSM
over the range of values of YSM observed in the sample years. The predicted probabilities
are generated using the estimates from column (1) of Table 4 where the fixed effects
17 As was the case in the analysis of Section 4.1, in this section we include the demographic variables usedin Baker and Benjamin’s `Demographic Controls’ specification. The analysis was repeated for the otherspecifications used in their paper and similar results were found in all cases.18 This restricts the coefficients on the interactions of the YSM variables with the immigrant cohorts to beequal to zero leaving only the YSM variables in the model. The Chi-square test statistic with twelve degreesof freedom was 36.86 and the p-value of the test was .0002.

10
specification is employed in estimation over the 1985 and 1990 survey years. With the
exception of the 1985-90 cohort, virtually all of the predicted differences are negative
implying lower probabilities of receipt of SA for immigrant than non-immigrant families.
The curves for the pre-1980 cohorts are very similar with more recent cohorts’ curves lying
above earlier cohorts’ curves over the YSM values of overlap. However, the vertical
difference between the curves is quite small. For example, the 1976-80 cohort curve is
roughly 2 percentage points above the curve of the 1971-75 cohort over most of the YSM
values that overlap.
In Figure 4, the same predicted differences are generated by using the parameter
estimates from Table 5 which uses the separate YSM profiles specification, (2), estimated
over the pooled sample of all thirteen cross-sections. A similar pattern emerges where the
86-90 cohort has higher probabilities of social assistance receipt than the native-born and
the more recent cohorts have higher probability receipts than the earlier cohorts. It should
be stressed, however, that the differences are small.
5. Conclusions
The sensitivity of estimates from models of immigrant use of unemployment insurance and
social assistance has been studied using thirteen cross-sections from the Survey of
Consumer Finances of Statistics Canada. The results indicate that estimates from these
models are sensitive to the choice of survey year. This is consistent with recent findings for
the analysis of unemployment probabilities and earnings. A test of the conventional fixed
effects specification restriction (under the alternative hypothesis of separate linear/quadratic
years-since-migration profiles) has been rejected both for unemployment insurance receipt
and social assistance receipt.
The estimates from the more general model indicate that cohort differences (holding
years-since-migration constant) in terms of receipt of unemployment insurance or social
assistance are small and do not in general provide evidence that recent cohorts are more
likely to receive benefits under these programs than are earlier immigrant cohorts. Also,
the evidence is mixed on the issue of whether immigrants are more likely to receive these
benefits with more years of residence in Canada. There is evidence that the rate of receipt
of UI by post 1980 arrival cohorts grew with years-since-migration; however, this effect

11
was only over the first few years after migration. For earlier cohorts, the rate of receipt of
UI declines with years of residence in Canada.
The new results have clear policy implications. The evidence does not support the
hypothesis that changes in the immigrant selection process over time have led to an
increase in the receipt probabilities under these programs for more recent arrival cohorts,
ceteris paribus. The evidence also does not support the hypothesis that immigrants of any
cohorts at any number of years-since-migration represent a significant drain on the public
purse compared with non-immigrants. The probabilities of receipt of benefits under these
programs are rarely found to be higher than those of Canadian-born men.

12
Appendix
Definitions of Variables Listed in Tables
IMPRE56, IM5665, IM6670, IM7175, IM7680: Indicator variables for immigrantswhose year of arrival was prior to 1956, 1956-65, 1966-70, 1971-75 and 1976-80,respectively.
IM8185, IM8690: In Baker and Benjamin’s study these identify immigrants who arrived inCanada between 1981 and 1985 and 1986 and 1990 respectively. Unfortunately, thedefinitions of the post-1980 cohorts are not consistent across the SCF surveys. Thefollowing approximations were used:
1981 IM8185=1 if immigrant arrived between 1981.
1982 IM8185=1 if immigrant arrived between 1981-82.
1984 IM8185=1 if immigrant arrived between 1981-84.
1985 IM8185=1 if immigrant arrived between 1981-85.
1986 IM8185=1 if immigrant arrived between 1981-86.
1987 IM8185=1 if immigrant arrived between 1981-87.
1988 IM8185=1 if immigrant arrived between 1981-88.
1989-94 IM8185=1 if immigrant arrived between 1981-85.
1989 IM8690=1 if immigrant arrived between 1986-1989.
1990 IM8690=1 if immigrant arrived between 1986-90.
1991 IM8690=1 if immigrant arrived between 1986-91.
1992 IM8690=1 if immigrant arrived between 1986-92.
1993 IM8690=1 if immigrant arrived between 1986-93.
1994 IM8690=1 if immigrant arrived between 1986-94.
YSM: Years-since-migration. For the native-born, YSM=0. For observations from the1981 survey: a) immigrants from the 1976-80 cohort have YSM=3, b) immigrants from the1871-75 cohort have YSM=8, c) immigrants from the 1966-70 cohort have YSM=13, d)immigrants from the 1956-65 cohort have YSM=21 and e) immigrants from the 1946-55cohort have YSM=31. For immigrants from later surveys, the YSM values are defined asabove with the difference between the survey year and 1981 added. For the 1981-85 and1986-90 cohorts, YSM is defined analogously taking the YSM value that is appropriategiven the survey year and the range of arrival years listed above that is appropriate for thesurvey year.
Other Controls: These match the controls used in the `Demographic Controls’specification in Baker and Benjamin (1995). They include indicators for: education, urbanstatus, region, marital status, children and mother tongue. In the SA analysis they alsoinclude controls for the age of the spouse, education of head and spouse and familystructure.

13
References:
Baker, M. and D. Benjamin (1994) `The Performance of Immigrants in the CanadianLabour Market,’ Journal of Labor Economics 12, 369-405.
Baker, M. and D. Benjamin (1995) `The Receipt of Transfer Payments by Immigrants toCanada’, Journal of Human Resources, 30(4), 650-76.
Borjas, G.J. (1985)`Assimilation, Change in Cohort Quality, and the Earnings ofImmigrants,' Journal of Labor Economics 3, 463-89.
Borjas, G.J. and L. Hilton (1996)`Immigration and the Welfare State: ImmigrantParticipation in Means-Tested Entitlement Programs,' The Quarterly Journal ofEconomics 111(2), 575-604.
Card, D. and W.C. Riddell (1993) `A Comparative Analysis of Unemployment in Canadaand the United States,’ in Small Differences that Matter: Labor Markets andIncome Maintenance in Canada and the United States, eds. David Card and
Richard B. Freeman, The University of Chicago Press.
Chiswick, B.R. (1978) `The Effect of Americanization on the Earnings of Foreign-BornMen,' Journal of Political Economy 86, 897-921.
Duleep, Harriet O. and Mark C. Regrets (1996) `The Elusive Concept of ImmigrantQuality: Evidence from 1970-1990,’ Discussion Paper, Program for Research onImmigration Policy, The Urban Institute, PRIP-UI-41, April.
Duleep, Harriet O. and Mark C. Regrets (1997) `Measuring Immigrant Wage GrowthUsing Matched CPS Files,’ Demography 34(2), 239-49.
McDonald, J. and C. Worswick (1997) ‘Unemployment Incidence of Immigrant Men in
Canada’, Canadian Public Policy, 23(4), 353-373.
McDonald, J. and C. Worswick (1998a) ‘The Earnings of Immigrant Men in Canada: Job
Tenure, Cohort and Macroeconomic Conditions’, Industrial and Labor RelationsReview, 51(3), 465-482.
McDonald, J. and C. Worswick (1998b) ‘Wages, Implicit Contracts and the BusinessCycle: Evidence from Canadian Microdata,’ Journal of Political Economy,forthcoming.
14
Table 1
Sample means: 1981-1994By Immigrant Status and for Selected Immigrant Arrival Cohorts
Variable NB FB Before1956
1971-1975
1986-1990
ReceivedUnemploymentBenefits
.1990 .1296 .1078 .1372 .1516
Sample 130 833 45 506 9 433 6 677 3 694
Received SocialAssistance
.1057 .0713 .0635 .0612 .1603
Sample 131 656 49 323 11 058 6 667 4 105

15
Table 2
Logit Estimates for the Probability of Receipt of Unemployment Insurance:Selected Pairs of SurveyYears using Fixed Effects Specification
(1)Baker andBenjamin
(2) (3) (4)
Variables 1985 and1990
1984 and1989
1988 and1993
1984 and1994
AGE .1255 *.0170(20.2)
.1032 *.0140(16.2)
.1323 *.0179(19.9)
.1242 *.0168(18.9)
AGE2(×100) -.1823 *-.0247(-22.9)
-.1610 *-.0218(-19.6)
-.1869 *-.0253(-21.8)
-.1786 *-.0242(-21.1)
YSM .1056 *.0143(3.87)
-.0432-.0059(-1.46)
.1002 *.0136(2.95)
-.0417 *-.0056(-2.38)
YSM2(×100) -.1727 *-.0234(-2.95)
.0623
.0084(.937)
.0012
.0002(.017)
.0962 *.0130(2.66)
IM8690 -.2958 *-.0401(-2.39)
.4418 *.0599(3.54)
-.2974 *-.0403(-2.03)
.2545 *.0345(2.33)
IM8185 -.3306 *-.0448(-2.02)
.0580
.0079(.358)
-.8581 *-.1163(-3.19)
-.2306-.0312(-1.38)
IM7680 -.7923 *-.1073(-3.17)
.3864
.0524(1.63)
-1.228 *-.1664(-3.34)
.4640 *.0629(2.48)
IM7175 -1.291 *-.1749(-4.07)
. 6145 *.0833(1.96)
-1.969 *-.2668(-4.46)
.5801 *.0786(2.66)
IM6670 -1.453 *-.1969(-3.95)
.6070
.0822(1.63)
-2.591 *-.3511(-5.19)
.4525
.0613(1.83)
IM5665 -1.549 *-.2099(-3.67)
.5914
.0801(1.37)
-3.069 *-.4158(-5.57)
.2113
.0286(.772)
IMPRE56 -1.455 *-.1971(-2.94)
.7116
.0964(1.41)
-4.326 *-.5861(-6.83)
.1843
.0250(.604)
R2 .058 .056 .056 .052Cohort Test .0002 .0198 .0000 .0000N 67 087 64 244 61 620 62 209
Note:
1) t-statistics are in parentheses.2) * significant at the five percent level.3) Variable definitions and other regression results are contained in the Appendix.

16
Table 3
Logit Estimates for the Probability of Receipt of Unemployment.InsurancePooled over the 13 Survey Years
Separate YSM Profiles by Cohort SpecificationVariables YSM
Interaction(YSM)2(×100)
InterationIM8690 -.1908
-.0259(-.319)
.3508
.0475(1.05)
-3.023-.4096(-.692)
IM8185 -.9424 *-.1277(-5.25)
.4765 *.0646(5.50)
-2.600 *-.3523(-5.46)
IM7680 .2893.0392(1.21)
.1436
.0195(1.84)
-.4315-.0585(-1.46)
IM7175(Default)
1.369 *.1855(2.87)
-.1826 *-.0247(-2.85)
.5703 *.0773(2.80)
IM6670 1.016.1377(1.18)
.0653
.0088(.631)
-.2721-.0369(-.970)
IM5665 2.533.3432(1.77)
-.0190-.0026(-.160)
-.1965-.0266(-.730)
IMPRE56 -.7220-.0978(-.236)
.1877
.0254(1.08)
-.5400-.0732(-1.86)
AGE .1000 *.0135(25.4)
AGE2(×100) -.1450 *-.0196(-29.0)
Test of FixedEffectsRestriction
.0000
R2 .049N 176 389
Note:
1) t-statistics are in parentheses.2) * significant at the five percent level.3) Variable definitions and other regression results are contained in the Appendix.

17
Figure 1
Predicted Immigrant/Non-Immigrant Difference inProbability of UI Receipt by Cohort and YSMFixed Effects Specification - 1985 and 1990
-0.1
-0.05
0
0.05
0.1
0.15
Years-Since-Migration
IM8690
IM8185
IM7680
IM7175
IM6670
IM5665
IMPRE56

18
Figure 2Predicted Immigrant/Non-Immigrant Difference in
Probability of UI Receipt by Cohort and YSMSeparate Profile Specification
-0.1
-0.05
0
0.05
0.1
0.15
Years-Since-Migration
IM8690
IM8185
IM7680
IM7175
IM6670
IM5665
IMPRE56

19
Table 4
Logit Estimates for the Probability of Receipt of Social Assistance:Selected Pairs of SurveyYears using Fixed Effects Specification
(1)Baker andBenjamin
(2) (3) (4)
Variables 1985 and1990
1984 and1989
1988 and1993
1984 and1994
Second Survey .0786.0066(1.70)
.6347 *.0533(6.94)
.5835 *.0490(17.8)
.4949 *.0415(15.2)
AGE -.0501 *-.0042(-5.69)
-.0344 *-.0029(-3.65)
-.0317 *-.0027(-3.68)
-.0374 *-.0031(-4.48)
AGE2(×100) .0690 *.0058(6.48)
.0598 *.0050(5.27)
.0394 *.0033(3.75)
.0463 *.0039(4.53)
YSM .0822 *.0069(2.17)
-.0970 *-.0081(-2.23)
.0429
.0036(1.10)
.0327
.0027(1.70)
YSM2(×100) -.0628-.0053(-.814)
.2083 *.0175(2.25)
.0078
.0007(.103)
.0253
.0021(.643)
IM8690 .1553.0130(.993)
.2473
.0207(1.40)
.2498
.0210(1.51)
.5391 *.0452(4.73)
IM8185 -.6593 *-.0553(-2.95)
.0323
.0027(.145)
-.4819-.0404(-1.51)
-.1303-.0109(-.757)
IM7680 -.8523 *-.0715(-2.47)
.4783
.0401(1.39)
-.8193-.0687(-1.88)
-.5336 *-.0448(-2.48)
IM7175 -1.487 *-.1248(-3.30)
.6297
.0528(1.34)
-1.189 *-.0998(-2.25)
-.7982 *-.0670(-3.15)
IM6670 -1.877 *-.1575(-3.57)
.4738
.0398(.835)
-1.789 *-.1501(-2.97)
-1.320 *-.1107(-4.60)
IM5665 -2.183 *-.1832(-3.60)
.6148
.0516(.938)
-2.082 *-.1747(-3.08)
-1.610 *-.1351(-5.14)
IMPRE56 -2.330 *-.1955(-3.31)
.1424
.0119(.186)
-2.154 *-.1807(-2.76)
-2.101 *-.1763(-5.89)
R2 .187 .156 .168 .1583Cohort Test .0001 .2233 .0011 .0000N 68 305 64 949 63 515 63 771
20
Table 5
Logit Estimates for the Probability of Receipt of Social AssistancePooled over the 13 Survey Years
Separate YSM Profiles by Cohort SpecificationVariables YSM
Interaction(YSM)2(×100)
InterationIM8690 -.5172
-.0434(-.843)
.4387
.0368(1.23)
-2.975-.2496(-.666)
IM8185 -.4481-.0376(-1.94)
.0918
.0077(.658)
-.1093-.0092(-.173)
IM7680 -1.253 *-.1051(-2.48)
.2209
.0185(1.50)
-.9163-.0769(-1.76)
IM7175(Default)
-.3507-.0294(-.365)
-.0616-.0052(-.513)
.3717
.0312(1.03)
IM6670 .1241.0104(.068)
-.0709-.0059(-.348)
.0773
.0065(.148)
IM5665 1.647.1382(.651)
-.0869-.0073(-.412)
-.1149-.0096(-.246)
IMPRE56 -7.379-.6191(-1.51)
.3978
.0334(1.43)
-.7694-.0646(-1.61)
AGE -.0426 *-.0036(-7.81)
AGE2(×100) .0595 *.0050(9.03)
Test of FixedEffectsRestriction
.0002
R2 .155N 180 979
Note:
1) t-statistics are in parentheses.2) * significant at the five percent level.3) Variable definitions and other regression results are contained in the Appendix.

21
Figure 3
Predicted Immigrant/Non-Immigrant Difference inProbability of SA Receipt by Cohort and YSMFixed Effects Specification – 1985 and 1990
-0.1
-0.05
0
0.05
0.1
0.15
Years-Since-Migration
IM8690
IM8185
IM7680
IM7175
IM6670
IM5665
IMPRE56

22
Figure 4
Predicted Immigrant/Non-Immigrant Difference inProbability of SA Receipt by Cohort and YSM
Separate Profile Specification
-0.1
-0.05
0
0.05
0.1
0.15
Years-Since-Migration
IM8690
IM8185
IM7680
IM7175
IM6670
IM5665
IMPRE56