Embed Size (px)
Citation preview
CENTRE FOR ECONOMIC POLICY RESARCH
Australian National University
AUSTRALIAN GAMBLING TAXATION
Julie P. Smith
Economics ProgramResearch School of Social Sciences
Australian National University
DISCUSSION PAPER NO. 402
May 1999
ISSN: 0725 430X
ISBN: 0 7315 2266 4

CONTENTS
Page
INTRODUCTION 1
AUSTRALIAN GAMBLING TAXATION 3
Trends and Patterns of Australian Gambling Taxation 3
'Gambling' wars and fiscal stress 5'Tax expenditures/subsidies' 6The changing gambling tax base 7The level of taxation on gambling 9
The 'Pros' and 'Cons' of Gambling Taxation 11The political appeal of gambling taxes 12Are gambling taxes 'fair'? 13Are gambling revenues economical? 18Taxes on sin and social costs 22Collection of gambling revenues 22
CONCLUSION 23
BIBLIOGRAPHY 25
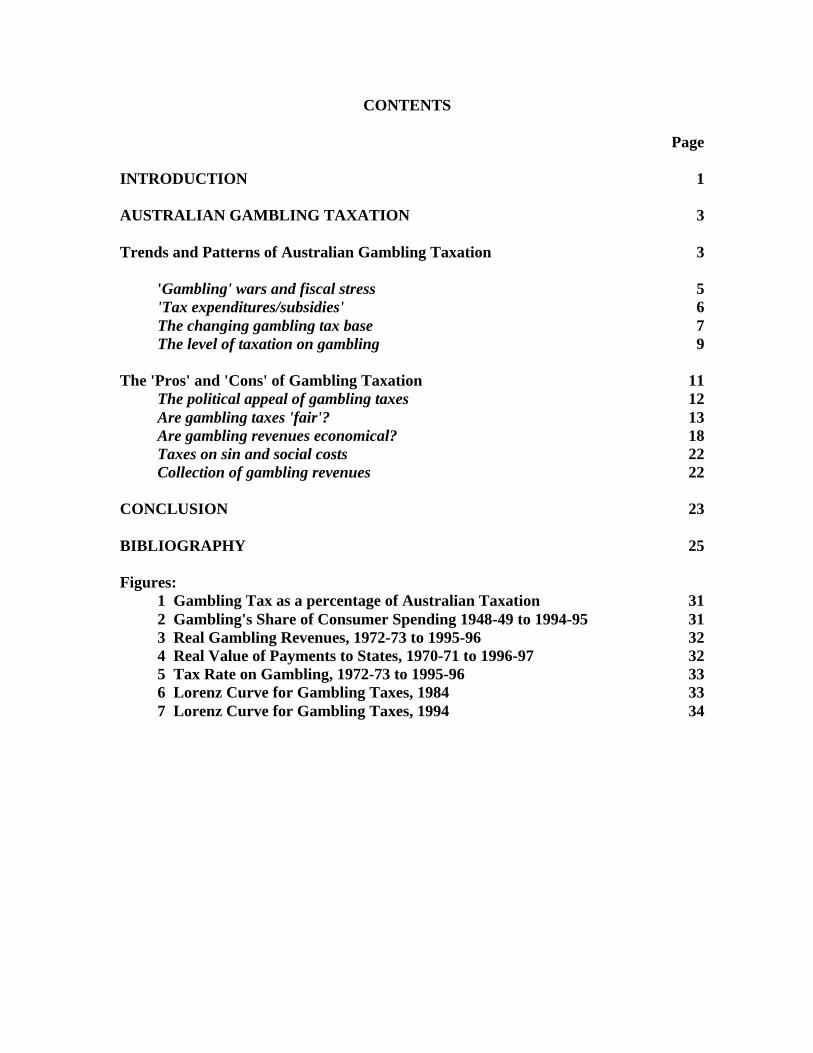
Figures:1 Gambling Tax as a percentage of Australian Taxation 312 Gambling's Share of Consumer Spending 1948-49 to 1994-95 313 Real Gambling Revenues, 1972-73 to 1995-96 324 Real Value of Payments to States, 1970-71 to 1996-97 325 Tax Rate on Gambling, 1972-73 to 1995-96 336 Lorenz Curve for Gambling Taxes, 1984 337 Lorenz Curve for Gambling Taxes, 1994 34
CONTENTS
Page
INTRODUCTION 1
AUSTRALIAN GAMBLING TAXATION 3
Trends and Patterns of Australian Gambling Taxation 3
'Gambling' wars and fiscal stress 5'Tax expenditures/subsidies' 6The changing gambling tax base 7The level of taxation on gambling 9
The 'Pros' and 'Cons' of Gambling Taxation 11The political appeal of gambling taxes 12Are gambling taxes 'fair'? 13Are gambling revenues economical? 18Taxes on sin and social costs 22Collection of gambling revenues 22
CONCLUSION 23
BIBLIOGRAPHY 25
Figures:1 Gambling Tax as a percentage of Australian Taxation 312 Gambling's Share of Consumer Spending 1948-49 to 1994-95 313 Real Gambling Revenues, 1972-73 to 1995-96 324 Real Value of Payments to States, 1970-71 to 1996-97 325 Tax Rate on Gambling, 1972-73 to 1995-96 336 Lorenz Curve for Gambling Taxes, 1984 337 Lorenz Curve for Gambling Taxes, 1994 34

1
INTRODUCTION
Since ancient times, governments have regulated the extent and conditions under which
gambling is permitted. Governments also developed an early financial interest in legalising
gambling, realising that certain forms of gambling were a productive base for taxation. These
dual roles of government as a social guardian, and as a gambling operator, place it under
conflicting pressures to both encourage and discourage gambling.
A leading Italian public finance expert, de Viti de Marco, highlighted the fundamental
policy contradiction in his 1930s text, First Principles of Public Finance (1936):
‘the gambling of some people is punished for the purpose of maintaining public morality, and the
gambling of others is legalised for the purpose of obtaining a public revenue. This contradiction is
sharpened by the very form of the monopoly; for the monopoly unites, in the person of the State, the
agency which is called on to combat the vice, with the one which derives profit from it’...’There is a
fiscal stake involved; this predominates, and paralyses any attempt at repression by the public
authorities.’
Governments rarely allow gambling to operate in a ‘competitive’ market.1 Restricting
competition may serve ‘sumptuary’ objectives of limiting the extent of gambling and thereby
controlling its social costs. Monopolists tend to restrict supply to maximise profit. While
monopoly is thus usually socially inefficient, the restraint on supply may improve efficiency
if it limits provision of a social ‘demerit’ good (Musgrave and Musgrave 1989, 580). The
fiscal monopoly created for the state when the law forbids gambling may therefore also
further social goals (de Viti de Marco 1936).
Governments may thus restrict competition or establish monopolies in gambling to
reduce its social costs. However, the nature of the industry or gambling demand may result in
a tendency to monopoly.
One reason is that gambling is especially prone to criminal involvement, cheating and
fraud. Since problems with fraud and excessive gambling during the nineteenth century,
many governments prohibited and tightly restricted gambling in the interests of ‘consumer
protection’ and ‘public morality’. Governments also closely regulate racing and gaming
activities to ensure games are ‘fair’. Consumer protection is thus an important motivation for
restricting competition in gambling activities. Monopolistic public provision of lottery
gambling has been found in the US to better control fraud and corruption (Clotfelter and
1 See NILECJ (1977). Much economic research on gambling highlights the non-competitive aspects of the
industry. Many economists analysis the industry in a monopoly framework. The analysis by Brinner and
Clotfelter (1975) argues that monopoly is the most appropriate model for economic analysis of state-run
lotteries, the monopoly profits being an implicit tax, and with illegal gambling a market substitute. Livernois
(1987) applies the same monopoly framework in the Canadian lottery industry. Guthrie (1981a) applies the
monopoly model to the parimutuel racing industry, while Guthrie (1981b), extends the analysis to the casino
industry. Martin and Yandle (1990) analyse gambling regulation as a ‘duopoly’ of state and illegal operators.
Suits (1979b) argues state receipts from gambling are economically identical to an excise tax, the revenue
potential a result of inelastic demand deriving from state monopolisation of gambling or restrictions on
alternative gambling suppliers. Eadington (1984 and 1987) analyse the Nevada gambling industry as an
example of essentially unrestricted gambling.
2
Cook 1989). Chapman, Beard et al. (1997) concluded that limiting gambling industry
competition in Victoria facilitated surveillance and control.
However, regulating the fairness of games, and measures to ensure the probity of
operators serve the interests of consumers, operators and treasuries alike. It may be difficult
to identify in whose interests governments are acting when they regulate gambling. For
example, it is argued that existing regulatory policy of casinos in Australia, namely strict
assessment of potential operators to limit casino ownership and management to ‘respectable’
elements, is predominantly industry protection rather than consumer or social protection
(McMillen 1996a; Chapman, Beard et al. 1997) Reducing the risk of gambling through
consumer protection regulation is likely to expand the consumer `market' for gambling.
Another limitation on competition in gambling is that some gambling services have
economies of scale. A number of authors point to the role of declining marginal costs of
gambling operations in creating natural monopolies in some gambling products. Eadington
(1984) notes the importance of economies of scale in the casino gambling industry, as larger
operations could offer greater variety of games and non-gaming services to attract a larger
and more productive clientele. Cook and Clotfelter (1993) also identify scale economies in
the consumption of lotto games because consumers prefer high jackpots almost irrespective
of odds.
High risks, and the resulting need for a large capital base, are said to explain the
concentration evident in English football pools (Rubner 1966). This may also apply to casino
gambling, as is reinforced by the recent incorporation of casino gambling into operations of
large international tourism corporations (McMillen 1985).
In such circumstances of market power and inelastic gambling demand, cutting
gambling taxes to stimulate demand risks overall loss in revenue (Clotfelter and Cook 1989).
Aggregate revenues may not benefit if gamblers switch from one form of gambling to
another. Also, as a recreational activity, gambling requires continuous innovations or
marketing to maintain consumer interest (Weinstein and Deitch 1974; Johnson 1976, 1985;
Clotfelter and Cook 1989; Rychlak 1992; Haig 1985b; Haig and Reece 1985). Rather than
cut prices/ taxes, governments may therefore embark on new forms of gambling, using
advertising and other promotion strategies, or varying the prize structures, effectively altering
the ‘quality’ and range of the product (Haig and Reece 1985).2
The existence of such ‘product life-cycles’ in consumer demand for gambling — and
in government gambling revenues — appears an important reason governments find it
difficult in practice not to get drawn into sponsoring or promoting gambling (Henriksson
1996; Alchin 1989; Haig and Reece 1985). This is especially the case if there are competitive
pressures from neighbouring jurisdictions to retain business by cuts to tax rates.
The overall ‘market’ for gambling may be relatively fixed in the short term by
legislation and a limited number of consumer gambling dollars. Clotfelter and Cook (1989)
2 More recently, gambling has been marketed to consumers as part of a tourist or entertainment resort package
(Robinson 1997; McMillen 1985; Lorenz 1996).

3
show that because of the monopoly structure of the lottery industry, the operator finds it
difficult to increase market share and instead focusses on enlarging the market, through
active promotion and marketing.
The above suggests a number of reasons why governments in search of revenues will
be as likely to ease restrictions on gambling or permit its promotion, as to raise gambling
taxation rates. Against this background, the following section reviews gambling taxation in
Australia.
AUSTRALIAN GAMBLING TAXATION
Trends and patterns of Australian gambling taxation
Although insignificant in Australia’s overall tax system — a mere 2% of national revenues
— gambling taxes have become increasingly important to Australian state governments
(Figure 1). States collected $3.5 billion, or 11%, of their taxes from gambling in 1996–97.
Searching for new revenues and jobs, most states have licensed gaming machines and casino
gambling for the first time during the last decade. Fiscal pressures have drastically altered
state governments’ approach to gambling since the 1980s, forcing greater uniformity in
gambling policies. The dramatic expansion in gambling revenues reflect this expansion of
gambling activity, rather than higher tax rates on gambling. Stable for two decades until the
1990s, real per capita gambling expenditures nearly doubled, to over $700 pa, during the last
five years.
The role of gambling taxes in Australia, and their recent growth, parallels develop-
ments overseas. For example, gambling taxes were around 1–2% of national tax revenues in
other developed countries during the 1960s, and lotteries were of a similar importance to
Australian state governments as in the US in the mid 1980s (Rubner 1966; Clotfelter and
Cook 1987). Likewise, state and provincial governments’ determined pursuit and expansion
of gambling revenues during the 1980s and 1990s has reflected similar forces and raised
similar issues in the US and Canada as in Australia (The Economist 1997; Madhusudhan
1996; NCW 1996; Lorenz 1996; Grinols 1995; Black 1995; Goodman 1994, 1995; Clotfelter
and Cook 1989).
Historically, trends in taxation revenues from gambling in Australia have reflected
state legislatures’ attitudes to legalised gambling and responses to illegal gambling. Legal
gambling remained around 2% of personal consumption expenditures for several decades
between 1920–21 and 1980–81 (Figure 2). After immediate postwar highs,3 gambling and
gambling revenues faded during the 1950s, as new entertainments such as motoring, bowls,
and illegal betting drew consumer interest away from gambling (Haig 1984, 1985a, 1985b).
3 Gambling taxes accounted for 2–3% of state taxes before World War II (Smith 1993). In the immediate
postwar years, there was a sharp rise in gambling associated with limited consumption opportunities and high
disposable incomes. With state governments still adjusting their taxation policies to the loss of income taxation,
gambling revenues temporarily rose to around 15% of state revenues in 1948–49. However, this was a transitory
effect of the post-war consumption boom, not a reflection of contemporary taxation or gambling policies.

4
Until states lost control of income taxation after 1942, gambling taxes had been an
insignificant share of state government taxation.As wartime taxation arrangements became
entrenched from the early 1950s, several states responded to the loss of income tax revenues
by introducing state lotteries. State governments played an increasing role as gambling
‘entrepreneurs’ from the 1960s, with gambling policies aimed squarely at maximising public
revenues (McMillen and Eadington 1986). During the 1960s, state governments maintained
gambling revenues by initiating new legal gambling ventures, such as new lotteries. The
popularity of jackpot lotteries helped increase gambling revenues to 11% of state taxes in the
1970s.
The focus on revenues represented a fundamental change in Australian state
governments’ attitudes to gambling, which had previously been directed primarily at
curtailing illegal gambling through legalised competition (Haig 1984, 1985b; Quiggin 1985;
ACSSA 1997).4 According to McMillen and Eadington (1986), Australian gambling policies
until the 1960s reflected British policy principles of catering to unstimulated demand,
distinguishing between forms of gambling, and strictly regulating to control crime.
During the 1970s, real gambling turnover remained relatively stagnant, reflecting
declining interest in lotteries and the continued downward trend in racing betting. However,
with relatively generous Commonwealth grants, states had eroded their major tax bases by
granting various concessions and exemptions, notably for land and payroll taxes, and
abolishing estate and gift duties.5 They were thus forced to respond to heavy cutbacks under
the Hawke and Keating governments by raising revenues from their remaining increasingly
inequitable, narrow and distorting taxes, including on gambling (Mathews and Grewal 1997,
750).
State and local government own-source taxes increased from around 20% of national
taxation in the 1970s and 1980s to around 24% by 1996–97 (Table 1).
Table 1: State and Local Government Share of AustralianTaxation
Year %1958–59 17
1975–76 21
1981–82 19
1985–86 20
1989–90 21
1996–97 24
Source: ABS 1997b; Smith 1993.
4 For example, legal off-course betting (TAB) was introduced to reduce illegal betting, as well as defend
racing clubs against declining interest in racing.
5 NSW also substantially reduced its heavy reliance on gambling revenues.

5
By the early 1980s, both gaming and racing revenues were declining in spite of initial
rapid increases from new games like Lotto and Instant Lotto. Permitting the spread of
previously prohibited forms of gambling then bolstered state gambling revenues (Figure 3).
From the mid 1980s, casino gambling was licensed on the mainland, and by the early 1990s,
a number of states were removing prohibitions on gaming machines. The licensing of casinos
in Queensland, South Australia (SA) and Western Australia (WA) in 1985–86,6 was
followed by the introduction of gaming machines in most states.7
‘Gambling wars’ and fiscal stress
In North America legalisation of new gambling forms since the 1970s emerged from the
financial stresses experienced by state or provincial governments due to recession, local ‘tax
revolts’, and tighter federal fiscal policies. State competition for gambling revenues and
defensive introduction of gambling — characterised as ‘gambling wars’ — became the
primary force for the spread of gambling.8 Although total gambling activity has expanded as
a result, the growth in total revenues has been limited by state government tax competition
(Stover 1990; Borg, Mason et al. 1993).
Fiscal pressures and ‘gambling wars’ have also been a force for expanding gambling
in Australia, with a 27% fall in the real value of general revenue grants since the mid 1980s
(Figure 4). Virtually all states expanded gambling activity as one of their few autonomous
tools of revenue policy, with the less affluent states such as Tasmania, Western Australia and
Queensland, and recently South Australia often leading the way (Smith 1993).
Defending revenues from legalised gambling in other states contributed to the spread
of casino and gaming machine operations in a number of Australian states (Alchin 1989). For
example, NSW poker machines have long been seen as a drain on revenues from Queensland
and Victorian border towns, a consideration in the licensing of gaming machines in those
states in the 1990s (AIGR and IRU 1995), while Victoria’s casino responded to prospective
and actual casino legalisation in NSW and SA. The 1988 Tax Task Force advocated
introducing a casino in NSW as a measure to protect the state’s gambling revenues from the
prospect of Australian Capital Territory (ACT) casino gambling (Collins, Hunt et al. 1988).
Although licensing new gambling activity brings in new revenues, governments have
been pressured to reduce their tax rates as gambling competition has intensified and profit-
ability declined (McMillen 1996b). Such state government rivalry over gambling revenues
has long been a noteworthy aspect of Australian states’ gambling taxation (Rubner 1966).
6 Tasmania introduced its casino during the early 1970s, with the ACT in 1992–93, Victoria (1994–95) and
NSW (1995–96).
7 NSW had introduced poker machines in 1956 and the ACT in 1976. Queensland in 1991–92, and SA in
1994–95
8 See for example, Suits 1977b; DeBoer 1986; Rose 1986; McMillen and Eadington 1986; Peppard 1987;
Filer, Moak et al. 1988; Clotfelter and Cook 1989; Stover 1990; Rychlak 1992; Jackson, Saurman et al. 1994;
Henriksson 1996.

6
Because gambling revenues tend to decline rapidly during a limited product lifecycle,
gambling taxation may exacerbate state government tax rivalry. With introduction of casinos
in all states and the spread of gaming machines throughout most states, competition for
gambling business has intensified.
The introduction of casinos and gaming machines in Australian gambling activity has
heralded a trend of privatisation of the formerly government-dominated gambling industry
(McMillen 1996b). Privatisation permits gambling enterprises to promote gambling more
intensively than publicly owned bodies. State rivalry to promote gambling business has
manifested in pressures on rates of taxation or the extent of public profit-sharing.
Tax competition is especially intense where there is strong interjurisdictional bidding
for business, such as in Totalisator Agency Board (TAB) betting, or ‘junket’ casino
gamblers, or where new forms of gambling have drawn substantial business from existing
gambling, such as in racing. Some states have reduced taxation of ‘high roller’ gamblers at
casinos in order to compete for business with other states. Racing tax rates have also been
reduced in most states in response to competition from residents placing bets through
gambling operations in other jurisdictions (CGC 1997).
Only lotteries, which are protected from intensive interstate competition by revenue-
sharing agreements, have maintained tax yields in the face of intensified competition since
the 1980s.9
‘Tax expenditures/subsidies’
Offsetting the expansionary trend in gambling tax revenues is the tendency for governments
to use gambling tax concessions to support parts of the gambling industry or compete with
other jurisdictions for the gambling dollar. Such concessions have the same effect on the
budget bottom line as expenditures, and are known as ‘tax expenditures’. The revenue loss or
‘tax subsidy’ provided in this form can represent a significant element of government
spending even though it is not easily scrutinised by the public.
Estimates of the budgetary cost of state government tax expenditures are rare.10 In
NSW the 1988 Tax Task Force broke new ground in identifying and costing a number of tax
expenditures in respect of gambling, as well as other state taxes (Collins, Hunt et al. 1988;
Reece, Maynard et al. 1988). The largest NSW tax expenditures in 1986–87 were for land tax
($1.8 billion), with around $75 million of tax expenditures attributable to gambling tax
concessions. This was equal to 13% of gambling revenues that year. It mainly represented the
bookmakers tax concession, costing $69.8 million.
No comparable study has been done for other states. The extent of gambling tax
concessions is likely to have increased, rather than reduced since 1986–87 with more intense
interstate tax competition and declines in racing and more recently casino taxes in some
9 Payout rates for lotteries are 60% in all states. State differences in revenue yields from lotteries reflect
differences in operating costs, rather than different prize shares. Different operating costs partly reflect
economies of scale in lotteries, especially jackpot lotteries (Cook and Clotfelter 1993).
10 Issues regarding estimating the cost of tax expenditures are discussed in Butler and Smith (1992).

7
states (eg, see Honeysett 1996; McCrann 1997). If the NSW 1986–87 concessions applied
Australia-wide in 1995–96, the cost would have been around $400 million.11 This does not
account for recent further concessions granted by states to some forms of racing betting and
concessional tax rates for some categories of casino gamblers. Nor does it reflect the lower
tax rates on club gaming machines compared to hotels.
Measured against national gambling revenues of $3.3 billion annually, more than
$400 million of tax concessions to the bookmaking and club industry, and to ‘high roller’
casino gamblers, represent a significant loss of revenue, and a substantial tax subsidy to the
gambling industry.
The changing gambling tax base
As a result of the turnaround in state government attitudes to gambling since the mid 1980s,
there have been dramatic changes in the extent and nature of gambling in Australia. Over the
decade to 1995–96, total player losses (‘expenditures’) on gambling more than doubled in
real terms, parallelling a dramatic growth in gaming and gambling industry profit (ABS
1998, 1997a; Edeson 1998; McMillen 1996b). By 1995–96, the total amount wagered
annually (gambling ‘turnover’) was $72.9 billion, or $5375 per capita; on average player
losses accounted for 3% of household budgets (TGC 1997).12
The change in state government policies can be seen in the rising share of gambling
losses in household disposable incomes (HDI) since the late 1980s. According to the TGC,
gambling expenditure has also increased sharply in nearly all states since the mid 1980s.
The greatest contribution to aggregate growth of Australian gambling activity and tax
revenues has been in NSW and Victoria, by virtue of their relative size, but the most rapid
growth occurred in Queensland, WA and Victoria.
Although casino gambling has taken the highest profile in public debate, the spread of
gaming machines in clubs and hotels13 has produced the most dramatic increases in
government revenue and is largely responsible for the rise in the overall national significance
of gambling revenue.14 By 1996–97, casino and gaming machine taxes together provided
from 20%, to as much as 65%, of individual states’ gambling tax revenues (Table 2).
Although in 1970–71, racing accounted for around 70% of gambling revenue in most
states,15 gaming is now the predominant source. Overall, casinos contribute around 12% of
11 Of course, neither the level nor the nature of tax concessions in NSW will necessarily reflect the situation for
other states. Other states may have different concessions, and use somewhat different tax bases.
12 See footnotes 33-34 below for a discussion of statistical terms for gambling activity.
13 While most casinos have gaming machines, only around 7% of machines were in casinos in 1994–95 (ABS
1997a)
14 The ABS includes only ongoing casino and poker machine licence fees in its definition of taxes, viewing
initial casino fees as receipts from the sale of intangible assets. Similarly, the Tasmanian Gaming Commission
data excludes these initial fees from estimates of state casino revenues.
15 Substantial revenue from poker machines made NSW the exception.

8
aggregate gambling revenues, while gaming machines in hotels and clubs provide over 40%.
In NSW and Victoria, the new casinos presently provide 7% and 11% of state gambling taxes
respectively.
Table 2: The Composition of Gambling Revenues
NSW Vic Qld SA WA Tas NT ACT Total
1985–86 Lotteries 32 58 57 57 38 61 75 na 44
Poker
machines
34 na na na na na na na 16
Casino na na 7 8 8 17 na na 2
Racing 34 41 36 34 52 21 25 na 37
Other na 1 na na 2 0 na na 0
1991–92 Lotteries 24 58 60 60 53 52 38 32 43
Poker
machines
35 na 2 na na na na 48 16
Casino na na 13 12 23 21 23 na 5
Racing 34 37 25 28 24 24 38 19 32
Other 8 4 na na na 2 na na 4
1996–97 Lotteries 21 24 34 26 45 31 34 24 26
Poker
machines
44 54 34 49 1 na na 53 43
Casino 7 11 15 7 35 50 20 8 12
Racing 27 10 17 19 20 18 14 14 19
Other 0 1 na na na 2 na 0 0
Source: ABS 1997b.
Where casinos are well established, these revenues account for up to 50% of state
gambling taxes. In WA, where racing remained important until the early 1980s, casino
revenues16 have substantially replaced racing revenues. SA has seen the importance of casino
revenues fall sharply, from 12% to 7% of gambling revenues, since introduction of poker
machines. Licensing gaming machines in Queensland left most of the state’s casino revenues
largely intact. However, there have been dramatic falls in casino tax receipts in ACT and WA
since the opening of the Victorian and NSW casinos (ABS 1997b).
While the importance of poker machines revenue is unchanged in NSW compared to
the early 1970s, Victorian gaming machine revenues grew dramatically in importance since
their introduction from 1991–92, to the present 54% of the state gambling revenues.
Similarly, poker machines in SA now provide half of the state’s gambling taxes, from
virtually nothing five years ago.
16 In WA and Tasmania gaming machines are only permitted at the casino.
9
The level of taxation on gambling
The overall rate of tax on gambling can be assessed by comparing total gambling tax revenue
with gambling tax activity. Tax rates can also be measured as a percentage of the gross, or
net, ‘price’ that is, on a tax-inclusive, or tax-exclusive (ad valorem) basis.17 As is clear from
Figure 7, the tax rate on gambling, peaked in the mid 1980s at around 7% or 44%, depending
on the tax base used,18 and has been declining since. By 1995–96, the average rate of tax on
gambling had fallen to 4–5% on turnover, and 34% on an expenditure basis.
Partly, this trend reflects the deliberate lowering of taxes on racing in some states to
support a stagnating or declining activity. Partly it reflects a compositional shift away from
(mainly state-run) lotteries with very high (‘monopolistic’) implicit tax rates, to privately-
operated gambling activities subject to greater competition and lower taxation rates, such as
casino and poker machine gambling.
Table 3 below shows gambling tax rates from Johnson (1985) for the early 1980s, and
rates calculated for 1989–90 and 1995–96 using Tasmanian Gaming Commission data on
revenue, turnover and expenditure.19
Racing taxes in Australia account for around 5% of gross wagering or ‘turnover’, but
around 37% of expenditures. In the US in 1987 parimutuel racing taxes were 4% of gross
wagering, and 21% of expenditures (Clotfelter and Cook 1989). Australian lotteries, mainly
operated by the public sector, have the highest implicit tax, with revenues of around 32% of
sales (equal to a profit mark-up of around 80%) since the 1980s. This parallels the generally
high, profitability of overseas state-run lotteries (Rubner 1966; Brinner and Clotfelter 1975;
Livernois 1987a; Clotfelter and Cook 1989). Australia-wide taxation on gaming machines
and casinos was a relatively low 27% and 20% respectively of expenditures in 1995–96
17 The definitions of tax rates are detailed below .
18 There are various different ways of measuring this overall tax rate because there are a number of
definitions of the tax base (Johnson 1985).
- One approach compares tax revenues with gross expenditures or turnover, a method commonly
used to compare the ‘take-out’ rate on lotteries. This expresses the tax as a % of the gross ‘price’
paid by consumers, that is, of ‘turnover’.
- Comparing tax revenues with net gambling expenditures or ‘player loss’, indicates the
government revenue share of the gambling enterprise’s ‘net takings’ (that is, after payout of
winnings).18 Net expenditure is the most common measure used by economists for measuring
gambling, and reflects the actual cost to individuals. It is also used in the National Accounts,
which treats winnings as transfers between individuals.
- Measuring tax revenues against gross turnover less government revenues provides another
indication of gambling tax rates.
19 As Clotfelter and Cook (1989) note, the more rapid turnover of winnings in some games makes comparing
different forms of gambling and their effective tax rates problematic. A 95% payout on a poker machine
becomes 49% if winnings are reinvested for 14 successive plays. This is reflected in the different overall
‘takeout rates’ for different forms of gambling, of around 40% for Australian lotteries, compared to 10% for
poker machines and 15% for casinos (which includes gaming machines as well as table games). While it is clear
the implicit tax rate on lotteries is higher than on other gambling, it is not possible to say by how much. This
also complicates comparisons of various gambling activities with taxes on other ‘sins’ such as tobacco or
alcohol (see below).

10
(around 3% on a turnover basis). Comparable estimates for other jurisdictions are not
available.
To some extent the fall in overall gambling tax rates over the last decades reflects
state tax competition, and more generous tax concessions to the gambling industry. National
gambling revenues would be around $80 million or 2–3% higher if 1987–88 average
gambling tax rates for individual gambling applied to actual expenditures on these products
in 1995–96.20 However, the main reason for the fall in average taxation on gambling is the
change in composition of gambling activity towards lower-taxed casino and gaming machine
gambling.
Table 3: Tax Rates on Gambling for Three Expenditure Bases
Gross Net Gross ExpenditureExpenditure Expenditure Less
Government Revenue% % %
1980–81Racing 4 29 6
Lotteries 30 76 46
Poker Machines 3 21 3
Casinos na na 3
Total gambling 5 34 6
1989–90Racing 5 41 6
Lotteries and soccer pools 32 80 46
Poker Machines/EGM/VGM/Club
Keno
3 25 3
Casinos 3 18 3
Total gambling 7 41 7
1995–96Racing 5 37 6
Lotteries and soccer pools 32 82 48
Poker Machines/EGM/VGM/Club
Keno
3 27 3
Casinos 3 20 3
Total gambling 4 34 5
Sources: Tasmanian Gaming Commission 1997; Johnson 1985.
Revenue in 1995–96 would have been around $800 million higher if gambling
activities including casino and gaming machine gambling were levied at the same rates as
racing and lotteries, that is, if the 1995–96 levels of gambling activity yielded the same
average revenue as in the mid 1980s.
20 This assumes NSW poker machine tax rates in 1987-88 were applied to gaming machine expenditures in
states that had licensed them in 1995–96, and Queensland’s 1987–88 casino tax rate of 20% were effective for
the ACT, Victorian and NSW casinos in 1995–96.

11
This suggests diminishing marginal returns to revenue from the recent expansion of
gambling activity, even if total revenues are increasing.
State government reliance on gambling taxation
State and local taxes have risen significantly in recent years, comprising 24% of total
taxation by 1996–97 compared to 20% a decade earlier (ABS 1997b). Gambling taxation
played a significant although not predominant role in this expansion, with some governments
experiencing an uncharacteristic increase in reliance on gambling revenues.
Despite rapid recent growth, gambling taxes remain less important state taxes than
payroll taxes, financial transaction taxes or business franchise fees, which in 1996–97
accounted for a respective 20%, 22% and 16% of state and local taxes. Gambling taxes
remain comparable in importance with motor taxes as a share of state taxes.
From one perspective, the dependence of state governments on gambling is not
exceptional compared to the 1950s. Australian state governments collected an average 17%
of tax revenues from (mainly lotteries and racing) gambling in 1950–51, with Tasmania
collecting 53% from this source (Johnson 1985, 80). The 1980s, when gambling taxes fell to
around 7–9% of revenues in most states, are low against this benchmark. Nevertheless, this
partly reflects a temporary effect of states losing income taxes to the Commonwealth during
the Second World War.
Table 4: Gambling Revenues as a Percentage of State Taxation
NSW Vic. Qld SA WA Tas. NT ACT All states1970–71 19 9 10 7 8 7 na na 12.9
1975–76 13 9 7 5 6 6 na na 9.8
1980–81 14 10 6 7 6 9 na na 10.5
1985–86 11 9 10 8 6 9 5 na 9.7
1990–91 10 9 10 9 7 8 9 7 9.2
1995–96 10 12 12 11 7 8 10 9 10.9
1996–97 10 13 12 12 6 9 9 8 10.9
Source: ABS 1997b; Alchin (1989).
THE `PROS' AND `CONS' OF GAMBLING TAXATION
‘Taxes are imposed to obtain Government revenue. Taxes are imposed to redistribute the
national income. Taxes are imposed to discourage undesirable — but legal — social or
economic acts. Taxes are imposed to provide the State with a tool for prosecuting promoters
of illegal activities. Taxes
are imposed to transfer to the State private windfall profits generated as a result of state
actions.’ (Rubner 1966, 62)

12
The political appeal of gambling taxes
Gambling taxes have considerable superficial appeal to governments. Gambling has long
been a productive revenue base, and makes a welcome, if minor, contribution to public
revenues. With a rapidly expanding revenue base, and responsiveness to growth in the
economy, gambling taxes bring in quick dollars to revenue-hungry governments. An
important consideration for taxation policy, especially of state governments, is how robust
revenues are in the face of economic shocks and whether a tax adds to or reduces overall
variability or riskiness of revenue flows.
Some argue gambling taxes are relatively resilient in recession, as high unem-
ployment may partially offset the dampening effect on gambling of slower incomes growth
(Mikesell 1994; Vrooman 1976). Mikesell and Zorn (1986) found gambling taxes add
volatility to the revenue base and therefore cause uncertainty and difficulties for budget
management and planning although this issue is complex and controversial (Szakmary and
Szakmary 1995; Clotfelter and Cook 1989). In Australia the year-to-year volatility in
gambling expenditures exceeds that of GDP. The NSW Tax Task Force (Collins, Hunt et al.
1988) also found considerable year-to-year volatility in NSW gambling revenues. Because
gambling is a very narrow base trends are difficult to predict (NILECJ 1977). Gambling
revenues are more subject than broader based taxes to unpredictable responses to marketing,
and are less predictable from general trends in consumer purchases and income levels
(Weinstein and Deitch 1974).
Significant medium to longer term economic costs might arise from the role of saving
and borrowing in financing gambling. Surveys of gamblers show a substantial proportion of
gambling is financed by reducing savings or increasing borrowings rather than by lowering
spending on other commodities or services. Correspondingly, high initial levels of
government revenues from a new gambling operation are in effect a ‘bringing forward’ of
revenues, financed by a small number of gambling debtors at highly unfavourable interest
rates. Hence, financing state government deficits by increasing gambling taxation may well
amount to increasing consumer debt at high interest cost among low income gambling
households in order to reduce relatively low-interest public sector borrowings.
While the early years of a new gambling product can be a revenue boon for
governments, reliance on gambling revenues can represent a risk to longer term stability of
public finances. New public spending programs financed from abundant revenues during the
early phase may be unsustainable once interest in a gambling product diminishes. Relying on
the profitability of gambling for public revenues may also produce an excessive government
interest in sustaining gambling activity and have undesirable social and political
consequences. In the light of such unpredictability of revenues, some writers argue monies
for programs funded by gambling revenues cannot prudently be appropriated until those
revenues have been collected (Karcher 1989).
Although gambling taxes undoubtably add to a state government’s revenues, the
overall long-term benefit to public revenues is reduced both because of tax exporting, or
competition between governments, and because spending on gambling reduces other

13
revenues like sales taxes. New revenues from gambling should thus be distinguished from
such transfers of existing revenue (Henriksson 1996).21
Gambling revenues are also vulnerable to increased competition in the gambling
industry. ‘Predatory federalism’ and ‘competition policy’ in Australia have accelerated the
market competition in casino gaming, between the different forms of gambling and between
states (McMillen 1996b). For example, in the casino industry in Australia, governments have
been under pressure to grant lower tax rates, and other fiscal concessions. The casino
gambling industry is said to be highly volatile and insecure (McMillen 1996b). Chapman,
Beard et al. (1997) also anticipated more intensive competition arising from the National
Competition Policy would erode the economic rents created by restricting gambling markets.
The shrinking base for taxing gambling would eventually reduce state gambling revenue.
Recent events in Asia, and evidence of difficulties in Australia’s casino industry
(McCrann 1997; Muller 1997; Lines 1997; Edeson 1998; ABS 1998), appear to confirm the
precarious nature of gambling as a source of long term revenues.22
Are gambling taxes ‘fair’?
‘Some of the lottery’s effects are baldly redistributional: many lose so that a few might win.’
(Clotfelter and Cook 1989)
Whether gambling taxes are ‘fair’ has long been a focus of gambling policy debates. On one
view, gambling taxes are a ‘voluntary’, and therefore fair, tax on discretionary spending.
Others suggest gambling taxes are a regressive and discriminatory levy on the leisure
pursuits of the disadvantaged, attractive to politicians as a ‘tax reform avoidance’
mechanism.
As only a small component of the total tax system, gambling taxes at present levels
are unlikely to have major significance for the overall fairness of the Australian tax system.
The regressivity of other state government revenue sources also partly mitigates their use of
regressive gambling taxes. There is also uncertainty about the true economic incidence of
gambling taxes. Most studies of the incidence of gambling taxes assume consumers pay the
tax. However, the true economic incidence of gambling taxes depends on the particular
characteristics of the gambling market. One of the attractions of gambling as a tax instrument
is said to be that its final economic incidence is on the gambler, regardless of who the tax is
applied to Rubner (1966). The NSW Tax Task Force concluded that a high proportion of
gambling taxes were shifted forward to the final consumers of the service, with a small
percentage of this falling on interstate or overseas residents. Warren (1979) came to a similar
conclusion. On the other hand, if the role of gambling taxation is essentially to tax economic
rents created by government restrictions on gambling, the incidence could be expected to fall
on rents received by gambling operators rather than gamblers.
21 The social costs of gambling may also impact on the expenditure side of the government (Goodman 1995;
McMillen 1985).
22The operating profit of Australia’s 14 casinos fell sharply in 1996–97 to 1.2% from 6.5% in 1994–95 (ABS
1998). This corresponds to a fall of 1% in tax receipts after a 27% increase from 1994–95 to 1995–96.

14
The significance of gambling taxes for tax equity lies mainly in the opportunity
provided by gambling revenues for governments to reduce reliance on more equitable, but
perhaps more politically contentious taxes and to defer necessary reform to the taxation and
federal financial system. Which alternative avenues for taxation are side-stepped by
legislators if gambling revenues are available? Resort to gambling taxation has often been a
strategy to avoid or delay introducing more progressive taxes, such as income taxes, which
are nevertheless, more controversial politically. Because gambling is a more important
recreational expenditure for lower socio-economic groups, some analysts suggest state
gambling taxation is a tax-shifting strategy by the middle class.
Increased resort by state government to gambling revenues highlights the need for
debate:
• over whether giving lower priority to distributional objectives is a transparent and
desirable shift in taxation policy, and
• on whether reducing reliance on gambling taxation by boosting progressive tax
revenues, such as income or assets taxes, would improve overall tax equity.
Assuming gambling taxes do fall on gamblers, the main equity issues are therefore:
• how regressive is gambling taxation compared to other available sources of
revenue?
• are different forms of gambling less regressive than others? and,
• how does the level of taxation on gambling compare with tax rates on other
recreation expenditures?
The extreme concentration of gambling spending among a few heavy gamblers, and
correlations between geographic location and levels of gambling, also raise other key equity
issues.
• how does widening access to gambling alter the distributional burden of gambling
taxation? and,
• is taxation of gambling really a ‘voluntary tax’ and therefore ‘fair’?
Overseas studies leave no doubt that gambling taxes are very regressive, assuming of
course that the economic incidence of gambling taxes is on gambling not operators. A few
forms of gambling, such as casino table games have in the past been the preserve of the well
off, and hence relatively less regressive or even progressive. However, as gambling becomes
more accessible, the burden of gambling taxation is shifting towards lower income groups.
Debates over gambling’s distributional impact often focus on ‘the typical player’, and
their income characteristics. As the typical player may be a middle or high income earner,
reflecting the wide public participation in gambling, some argue gambling taxes are not
inequitable. However, the measure commonly used in economic studies of tax incidence is
how expenditure varies as income increases. A tax is regressive if it falls as a percentage of
income as income rises, and is progressive if it rises.
15
Calculating an index of the inequality of distribution of the tax burden based on the
concept of the Gini measure of inequality of income distribution, Suits (1977a) found US
gambling taxes with an index concentration of –0.16, were as regressive as the US sales tax
(S = –0.15).23 Casino taxes in Nevada were moderately progressive at that time (S = 0.26),
even more so than the US income tax (S = 0.19). This partly offset the very regressive effect
of other forms of gambling, notably instant lotteries (S = –0.31) and numbers games (S =
–0.44). Johnson (1976) found the implicit tax on North American lotteries was more
regressive than sales taxes.
Gambling taxes were also found to be moderately regressive in Australian studies
during the late 1970s and early 1980s (Warren 1979, 1986; Kakwani 1983), comparable to
federal sales tax. Perhaps reflecting the nature of earlier casino taxes Nieuwenhuyen (1983)
judged gambling taxes to show ‘an unstable but distinctly progressive trend’.
However, the shift in consumer demand towards more regressive forms of gambling,
notably gaming machines, and increased accessibility of gambling for lower income groups
suggests that gambling taxation is becoming even more regressive. Different types of
gambling have different distributional effects. Casino taxes were progressive when the main
clientele were wealthy tourists or visitors and the cost of interstate air travel access to early,
remotely located casinos precluded significant participation by other than the affluent.24 As
gambling moves from the resorts to the suburbs, the burden of gambling taxes appears to
have changed. In the US Mason, Shapiro et al. (1989) found casino gambling expenditure
was highly regressive, confirming earlier findings by Suits (1977a) for local gamblers in
Nevada.
In Australia, analysis of HES data on gambling expenditures suggests gambling
taxation is regressive, and increasingly so (Figures 10 and 11). Sample size difficulties and
reporting biases limit the usefulness of the HES data on gambling,25 and gambling tax burden
does not necessarily equate with gambling expenditures. Nevertheless, gambling losses have
become a greater burden on lower income groups since 1984. By 1993–94, gambling had
increased from around 8–9% of recreational expenditures to around 10–11% for households
in the bottom two income quintiles, while it reduced substantially in the higher income
quintiles. Overall, gambling spending has nearly doubled as a share of income in the poorest
40% of households, while falling from already low levels in the incomes of most affluent
40% of households.
Using a ‘Suits index’ of the regressivity of gambling losses based on HES data for
gambling expenditures, a uniform tax on gambling in 1984 would have been roughly
proportional to income (tax concentration index S = 0). By 1993–94, the index suggests a
23 See Suits (1977b) for a discussion of this index.
24 Nevada was the only state permitting casino gambling at the time of Suits’ study. Similar factors would have
influenced the distribution burden of Tasmania’s Wrest Point casino tax burden during the 1970s and early
1980s.
25 Gambling expenditure data from the HES are somewhat unreliable due to the likely underestimation of
gambling losses, and overestimation of gambling winnings by households. Sample sizes for different types of
gambling are also too small to allow the incidence to be estimated by attributing tax rates to each category of
gambling. Relative standard errors are too large even for reliable estimates of total gambling expenditures.

16
highly regressive tax regime, with a concentration index of –0.31. This compares with an
index for income tax of 0.2, and for a uniform tax on all commodity and service expenditures
of –0.16.
Gambling spending is also heavily concentrated among relatively few households and
individuals so that average figures on gambling expenditures give a misleading picture of its
incidence. Numerous overseas studies show that around the heaviest 20–30% of gamblers
account for some 80% or more of total gambling expenditure (Clotfelter and Cook 1987,
1989; Mason, Shapiro et al. 1989; The Economist 1997; Grinols 1996; Mason, Shapiro et al.
1989). Australian data suggests a similar concentration. Unit record data from the HES
suggests around 90% of reported gambling expenditure derives from heaviest 10% of
gamblers.26 The latter implies as much as a third of Australia’s spending on gambling came
from the 1.3% of the population that were compulsive/pathological gamblers in 1991.27
Gambling taxation may thus be much more regressively distributed among gambling
households than across the general population, if the incidence of heavy gambling is greater
in lower income groups than in the population as a whole. This pattern of revenue raising
from addicted gamblers elicits important questions about whether most gambling revenues
are ‘voluntary’ or ‘painless’, and of the fairness and ethics of governments raising perhaps a
third of their $3.5 billion annual gambling revenues by exploiting the vulnerability of less
than 200,000 individuals and their families.
The concentration of gambling spending, and the disproportionate share in the
incomes of poorer households, also has important geographic distributional implications. If
low income populations and heavy gambler populations coincide in the same geographic
area, the adverse social and economic impacts of gambling will be heavily concentrated in
particular localities.28
Another aspect of tax fairness is horizontal equity. Other ‘luxuries’, the
entertainments of the well-off, for example, overseas holidays, recreational goods and
equipment, restaurant meals, etc are not comparably taxed (Johnson 1985) because
Australian consumption taxation largely excludes most services. High gambling taxation
alongside minimal taxation of other recreation or leisure activities is horizontally inequitable.
The proposed goods and services tax (GST) would tax expenditures on recreation and
leisure at similar rates, and improve horizontal equity. However, uniform gambling tax rates
under a GST could have serious consequences for some parts of the gambling industry,
which are presently taxed at relatively low rates to offset higher cost structures (Chapman,
Beard et al. 1997).
26 See also AGB–McNair 1995. The accuracy of this estimate is uncertain because of the known problems
with HES gambling expenditure data. However, it does confirm that the strong tendency towards concentration
of gambling expenditure which is evident in the Victorian survey, operates Australia-wide.
27 Compulsory/pathological gambling as defined by the SOGS criteria was estimated at 161,592 adults, 1.3%
of the population in 1991 (Dickerson 1992).
28 There is some evidence disadvantaged groups or low income earners are deliberately targeted in location of
gambling facilities (see Kaplan (1989; Rychlak (1992).

17
A GST also raises the issue of whether consumption tax policy should continue to
distinguish between ‘essentials’ and ‘luxuries’ such as gambling. A uniform GST levied on
net expenditure would collect only a third of present revenues levied on gambling. In effect,
lower gambling taxes would be financed by higher taxes on ‘necessities’ such as food,
clothing or childcare under a revenue neutral and uniform GST, if specific taxes on gambling
were abolished.
As a tax on a discretionary expenditure, gambling taxes are often viewed as
‘voluntary’, and therefore fair and painless. Those viewing gambling tax as voluntary tend to
discount its regressive effects. As J.S. Mill commented (Holloway 1973, 38), ‘The
indulgences of the poor are as fit subjects for taxation as the indulgences of the rich’.
Reflecting a widely held view that essentials should face lower taxation than luxuries,
Rubner (1966, 64-5) comments that:
‘The most rabid advocate of progressive taxation will concede that the social evil of a
proportionate consumption tax is lessened when much of the total indirect tax is placed on
‘avoidable’ or luxury expenditure. On that score, surely gambling taxes are the least
obnoxious of non-progressive taxes. The rough justice involved in taking away in taxes the
same proportion of stake money from rich and poor punters is surely a price worth paying for
collecting efficiently the highly moral taxes on gambling’.
However, the aggressive marketing of gambling to low income groups and heavy
gamblers raises important economic, political and moral issues about gambling as ‘voluntary’
taxation. As noted earlier, a large share of gambling revenues come from compulsive
gamblers, and marketing strategy is aimed at encouraging more usage among established
players, rather than at recruiting new ones (Clotfelter and Cook 1989). The view of gambling
taxation as ‘voluntary’ is severely undermined where demand is created by intensive
marketing at the gullible or uneducated, and where the consumer ‘choices’ are those of
gambling ‘addicts’.
Finally, some argue the fairness of gambling taxation must take account of how the
revenues are spent, especially as many gambling taxes are ‘earmarked’ or tied in some on
expenditures for worthy social purposes (Clotfelter and Cook 1989). This is known as its
‘budget incidence’ (Musgrave and Musgrave 1989, ch. 15). However, the concensus among
economists is that earmarking gambling revenues does not generally increase overall funding
to such programs. The main role of earmarking is political, allaying public disquiet about
community coffers profiting from gambling, while neutralising opposition from socially
concerned groups and creating a political constituency in favour of gambling. Earmarking is
also used to make the public sector appear smaller to conservative political constituencies
(Campbell and Ponting 1984), or to imply a strong public resource commitment to certain
programs.
Although the public perceives that gambling revenues contribute importantly to social
services, such as hospitals, or education, earmarked revenues are usually only a minuscule
proportion of total funding for such programs. It is also unlikely earmarked gambling taxes
have provided significant additional funding for any particular public programs as
earmarking does not prevent legislatures reshuffing government spending and revenues or
raiding gambling revenue funds (Weinstein and Deitch 1974; NILECJ 1977; Clotfelter and

18
Cook 1989; Rychlak 1992; Clotfelter 1994; Jackson, Saurman et al. 1994; Rose 1986;
Kaplan 1989).
While Karcher (1989) argues that earmarking gambling revenues for spending in poor
neighbourhoods reduces gambling tax regressivity, other studies show the ‘budget incidence’
of gambling taxation is even more regressively distributed because programs financed by
gambling revenues generally benefitted relatively well off income groups (Borg and Mason
1988; Campbell and Ponting 1984; Livernois 1987b).
Are gambling revenues economical?
‘Unless there are strong reasons to believe that people are participating in lotteries against
their own interests or that lottery operation creates strong externalities, lowering the take-out
rate would increase net welfare. If on the other hand, lotteries as seen as a social evil, as they
seem to have been in every state and province before 1964 — then a higher rate may be
justified as a sumptuary tax’. (Brinner and Clotfelter 1975)
In a conventional economic framework, welfare is improved, the lower the tax rate
because higher taxes distort consumption or production decisions (Brinner and Clotfelter
1975; Johnson 1976; Clotfelter and Cook 1987; 1989). The rapid expansion of state gambling
tax revenues since the early 1990s is an element in increased state taxation which is said to
imply a rising economic cost of taxation, because of the narrow and fractured, state
government tax bases (Albon 1997). However, as shown above, the surge in gambling
revenue since the early 1990s has been accompanied by a declining rate of taxation on
gambling, on a widening base. The differences in tax rates on gambling have also been
narrowing. Expansion of gambling revenue may not necessarily imply greater efficiency
losses from gambling taxation.
As Brinner and Clotfelter (1975) point out, any evaluation based on demand curves
and conventional applied welfare concepts rests on assumptions that individuals are best able
to judge what is good for them and that there are no externalities in consumption or
production. Indeed, the economic impact of gambling regulation is likely to be more
significant than the efficiency consequences of gambling taxation.
Putting this major issue aside, the economic efficiency cost of gambling taxation depends in
part on whether they fall on consumers as consumption taxes, or whether they capture from
gambling operators the windfall gains arising from government restrictions on competitive
supply of gambling services. Taxes on gambling also might be interpreted as returns on the
implicit public equity in the industry, or as ‘user charges’ for the legitimacy and implied
government guarantee of operator probity that is bestowed on the industry by tight public
regulation and control. The economic efficiency of gambling taxation also depends on
whether high gambling taxes effectively discourage gambling activity or attribute its costs to
those who generate them.
Where governments restrict gambling activity, ‘economic rents’ or windfalls accrue to the
few enterprises permitted to provide gambling services. Raising revenues as far a possible
from taxes on ‘economic rent’ minimises the efficiency costs of taxation (see Musgrave and
Musgrave 1989, 282). Taxing economic rents may also improve equity by transferring to the
state ‘private windfall profits generated as a result of state actions’(Rubner 1966). An

19
important role of gambling taxes is to capture unearned economic rents in the gambling
industry for public revenue (Holloway 1973).29 Surveying current gambling taxes in Victoria
(Chapman, Beard et al. 1997) concluded taxation of economic rents was a key objective of
state gambling tax policy, and ‘capturing these rents ... appeared to be the main role of much
gambling taxation’.
One approach to the taxation of such economic rents is to sell the rights to conduct
gambling operations to the highest bidder, through up front bidding for a licence.30 Such one-
off licence fees for casino and gaming machine licences have become an important element
of gambling ‘revenues’ although in effect, they represent returns from a public asset sale. For
example, casino licence fees were paid to Queensland and the ACT in 1992–93, to Victoria
in 1993–94 and 1994–95, and to NSW in 1994–95 (CGC 1997, 134). In Victoria, initial
casino licence fees totalling $358.4 million (Chapman, Beard et al. 1997) compare with
Victorian casino taxes of $306 million between 1993–94 and 1996–97 (ABS 1997).
However, up-front licence fees will only fully extract economic rents if bidding is
competitive.
Potential monopoly- and geographic market power from holding a casino licence
provide incentives for ‘rent seeking’ by gambling operators, and encourage ‘directly
unproductive profit seeking’( Grinols1996). This wastes economic resources and erodes
democratic decision-making processes. Bilateral or even multilateral negotiations between
potential operators and a state government, make it difficult to assess whether the full market
price of granting the gambling monopoly is reflected in the fee paid by the winning tenderer.
Government may reduce licence fees as an implicit subsidy to operators to meet objectives
such as promoting development or tourism. In effect the government contributes financial
equity to the project through such concessions. Similarly, net public revenues are reduced if
there are significant public infrastructure costs of establishing and expanding a gambling
operation, and this can be viewed as the public taking an unlisted financial state in the
industry.
If gambling taxes are viewed as taxes on a `product' or commodity, and the fairness of
taxation is not an issue, their efficiency implications depend on how high the tax rates are
and how responsive consumer behaviour is to changes in the tax rate. Theoretically, revenue
is most efficiently raised if the economic distortion (‘marginal deadweight loss’) from an
additional dollar raised by the tax equals that raised from other taxes. This approach is known
as ‘Ramsey taxation’.
However, empirical research on elasticity of gambling demand has provided little
practical guidance along these lines for taxation policy and design (Reece 1984; Collins,
29 Whether such taxes on rents fall on the supplier, or are passed on to the consumer depends on whether a
position of monopoly is fully exploited in practice. In principle, however, taxes on monopoly profit are paid by
the supplier because supply is already at profit maximising levels (Musgrave and Musgrave 1989).
30 This is an approach recommended for other industries with significant economic rents, such as the mining
industry. Because of uncertainty about future taxation, and the risk aversity of firms, competitive bidding will
not extract all rents, and hence ongoing taxation/profit sharing is a common supplement to auctioning licences.
See Church (1985) for discussion of these issues and an extensive bibliography.

20
Hunt et al. 1988; Clotfelter and Cook 1989).31 Estimating gambling demand elasticities is
complicated by the extent to which different gambling products are substitutes.32 There is
also ambiguity about how to specify the ‘price’ of gamble, including whether taxes may
apply to turnover or player losses.33 Based on existing research on demand elasticities for
gambling, Haig and Reece (1985) found Australian gambling tax rates approximated optimal
(revenue maximising) tax rates based on existing knowledge.
As shown earlier, gambling taxation in 1995–96 averaged 34% of gambling
expenditure, or 51% on an ad valorem basis34 if expenditure (ie, player loss) is viewed as the
‘price’ of gambling. The highest taxed form of gambling was lotteries at 82%, with the
lowest rate applying to the net takings of casinos, taxed at an average of around 20%, or 24%
ad valorem. Gaming machine takings were taxed at around 27% and racing at around 37%.
Most taxes on gambling are relatively low compared to rates for other excisable
goods. Albon (1997a) estimates ad valorem rates of taxation of 89% on beer, 234% on
spirits, and 42% on wine. Tobacco pays 212%, while petrol and cars pay around 120–130%.
Gambling taxes are higher than sales tax which generally applies at 22%. Tax rates on
gambling are also high compared to those on many other recreational expenditures or
entertainment services which are usually taxed at low or zero rates at present.
As evident in Table 5, a tax rate of 5%, which is the average applying to gambling
turnover in Australia, implies an average efficiency cost (marginal deadweight loss) for
gambling taxation of 8 cents in the dollar at an elasticity of -1.5. For an elasticity of -0.4. this
falls to 2 cents in the dollar. The present gambling tax rate averaging 35% of gambling
expenditure, implies a marginal excess burden ranging from 12 cents in the dollar for
inelastic demand, and up to 64 cents in the dollar if gambling demand were elastic.
31Most gambling tax analysis assumes that gambling behaviour is relatively unresponsive to the level of
taxation, making it an efficient source of revenue. The incidence of gambling taxes is also typically assumed to
fall on gamblers (eg, see Rubner 1966) implying the supply of gambling services is highly flexible, and
consumer demand relatively unresponsive to price.
32 Existing studies of gambling demand elasticities usually focus on only one type of gambling, eg, racing, or
lotteries and relate to the United States and are of limited usefulness because the cross price elasticities with
other forms of gambling are not known. Early studies of demand for racing betting showed it to be relatively
price responsive, with uncompensated elasticities of demand averaging around -1.5%. However, without
knowing how expenditures on racing relate to other gambling expenditures, or what the underlying elasticity is
for gambling as a whole, it is difficult to draw a firm conclusion about the effect on government revenue of
reducing the tax rate (Reece 1984; Collins, Hunt et al. 1988).
33 In the following analysis, the tax base is taken to be gambling expenditure. Nevertheless, because the ‘price’
of gambling is unclear, so too is the theoretical tax ‘base’. Most studies of determinants of gambling demand
take the ‘price’ of gambling to be a function of the takeout rate that is, of gambling expenditures. However, the
theoretical tax base might be either gambling turnover or gambling expenditures, depending on what consumers
are ‘purchasing’ when they gamble and the structure and level of payouts, ie, the odds of winning and
concentration of prizes. For some gambling products the price may be better reflected by turnover, for others by
gambling expenditures (player losses).
34 Sales and excise taxes are usually expressed as a ‘tax exclusive’ or ‘ad valorem’, basis. The ad valorem tax
rate expressses the tax rate as a percentage of the net-of-tax-price, that is, the ratio of tax to ‘net price kept by
the seller’ (Musgrave and Musgrave 1989, 250). This results in higher percentage tax rates than rates expressed
as a percentage of the gross price paid by the consumer.

21
Table 5: Economic cost of gambling taxation (cents per dollar of revenue)
Marginal excess burden for varying tax rates and price elasticities
Elasticity
Tax Rate (%) Inelastic demand of -0.4 Elastic demand of -1.5
5 2 8
22 8 37
35 12 64
42 13 80
48 15 95
51 16 103
As shown above, even low tax rates on gambling might have a high efficiency cost if
gambling demand were very price sensitive.35 However, most gambling revenues in
Australia come from lower-taxed gambling activities and the expansion of revenues has not
come from increasing gambling tax rates but from expanding the tax base by lifting
restrictions on gambling activity. That is, the resource allocative consequences of gambling
taxation are less significant than the economic consequences of policy-induced growth of the
gambling industry.
Because of the complexity of applying differential rates of taxation to every
commodity, and the scope for exercising political influence to levy discriminatory taxation,
tax policy favours uniform commodity tax rates over `Ramsey pricing' (Stigliz 1988). Taking
this approach some argue tax rates on different forms of gambling should be similar in the
interests of tax neutrality (Alchin 1983). This argument is also extended to gambling tax rates
vis a vis other recreation or leisure expenditures.
Replacing existing gambling revenues with a proportional tax on net expenditures
would require a rate of taxation on gambling of around 34%. This would increase the rates of
taxation on casino and poker machine gambling and drastically reduce it on lotteries.
Considered in the context of a 10% goods and services tax, a uniform tax on
gambling expenditures would raise just over $1 billion of revenue, $2.5 billion less than
current state government receipts. A greater proportion of this revenue than at present would
come from casino and gaming machine gambling, and less from lotteries. The 1975 Asprey
Report on Taxation recommended retaining specific `benefit' taxes36 if the Australian sales
tax were replaced by a broad based valued added tax such as the proposed GST
(Groenewegen 1983). However, it is not clear what arrangements are being made to
compensate States for loss of gambling tax revenues due to introduction of a GST. While
35For example, Albon (1997a), estimates that at a 35% gambling tax rate, an own price elasticity of demand for
gambling of –0.4 implies a marginal deadweight loss at between 10 and 22 cents in the dollar. More elastic
demand, at say –1.0, would raise the economic cost of gambling taxation to the high levels estimated for
tobacco taxes (40c in the dollar).
36Taxes such as those on alcohol, tobacco and gambling also reflect conceptions that it is fairer to tax `luxury'
items than other consumption items.

22
there is apparently no Commonwealth requirement for the States to abolish their gambling
taxes, the Commonwealth's new tax encroaches onto this field of taxation, and may squeeze
the States out, at least to the extent of the revenue collected by the GST on the industry.
The need to resolve this issue between Commonwealth and State governments
provides the opportunity for explicit consideration of achieving an appropriate national
policy on the desirable extent of gambling and the size of the industry.
Taxes on sin and social costs
If society considers gambling a ‘demerit’ good to be discouraged in the interests of a
wholesome society (Musgrave and Musgrave 1989, 58), gambling taxes may improve social
welfare by reducing gambling activity. Similarly, if providing or participating in gambling
results in significant adverse consequences for others, economic resources will be used for
more desirable social purposes if these activities are taxed at higher rates reflecting the social
costs of those ‘externalities’ (Musgrave and Musgrave 1989, 294).
However, the pattern of Australian gambling taxes suggests (‘sumptuary’ taxation)
objectives of reducing spending on gambling, or penalising the most socially harmful forms
of gambling (‘Pigovian’ taxation) are not predominant in the design of gambling taxes
(Chapman, Beard et al.1997) . The rates of taxation on gaming machines, agreed to be most
addictive and producing the highest rates of problem gambling, are relatively low. Taxation
of lotteries, generally seen as benign and less likely to generate social costs (but see below),
is very high. Gambling tax policy appears to be directed more at maximising revenue than
discouraging gambling or taxing most heavily the most addictive forms of gambling, gaming
machine and casino gambling.
Taxation is also perhaps an overly blunt instrument for achieving the social goals of
gambling policy. Regulation may be more effective at restricting gambling and limiting the
harmful effects of problem gambling than higher tax rates. Because excessive gambling
impacts on a gamblers’ family and friends, high gambling taxes may worsen financial
difficulties for problem gamblers, and add to the difficulties of children and spouses
financially dependent on heavy gamblers. That is, prohibitively high rates or ‘user pays’
taxes on gambling may produce more gambling problems than they prevent.
Collection costs of gambling revenues
The final aspect of the economy of gambling taxation is the collection cost. Gambling taxes
typically cost more to collect than most other taxes, although how much so is a matter of
debate.
In NSW Collins, Hunt et al. (1988, 91–2) found collection costs of gambling taxes
were higher than for other state taxes, ranging from $6 to $120 per $1000 of net revenue.
Collection costs for NSW poker and gaming machine taxes, and TAB were around 1–2% of
net revenue or less in the mid 1980s. State lotteries revenues cost around 13% to collect.
Lottery revenues presently cost between 5% and 13% of net revenues to collect in larger
Australian states, but this exceeds 30% in smaller states. In Victoria, casino regulation costs
represent around 10% of state casino tax revenues (Chapman, Beard et al. 1997; ABS 1997).

23
In Australia, income tax administration costs around 1% of revenues to collect, while
sales tax costs just over 0.5% (Collins, Hunt et al. 1988). However, state government tax
systems are relatively narrow, so a reasonable benchmark for efficient state taxes is around
2% of revenues, Nieuwenhuyen (1983). Thus while gambling taxes rank poorly on collection
costs compared to major national taxes they are not so costly compared to important state
taxes.
Nevertheless, how gambling tax collection costs should be measured is controversial,
depending on the perceived objective of gambling policy (Johnson 1976). Proponents argue
gambling taxes are easy and convenient to collect, with minimal compliance costs (Rubner
1966). Opponents cite the low net return of revenue as evidence of the high economic cost of
gambling taxation (Borg, Mason et al. 1991). Fundamentally at issue is whether to count the
payment of prizes and the costs of regulating or running gambling enterprises as tax-
collection costs.
Properly distinguishing regulatory costs may reduce the apparent high cost of
collecting state gambling taxes. However, if the primary purpose of licensing gambling
activities is to raise revenue, it is appropriate to include regulatory costs or operating costs of
state-run gambling enterprises as tax collection costs. In this broader perspective, the
economic costs of generating taxable gambling profits must be balanced against economic
benefits of expanding recreational opportunities for consumers.
CONCLUSION
Gambling revenues are a politically easy tax, and may also serve social objectives.
However, governments are usually closely involved in gambling for social reasons, and
because the industry could not grow beyond a small market unless its integrity and honesty is
validated through government regulation.
In recent times, however, state governments in Australia and in other federal systems
have allowed substantial expansion of the industry in search of jobs, investment and revenue.
A global trend to centralise revenues leaves sub national governments short of taxation
avenues to respond to the demands of their citizens. In competing for gambling business
with other states and jurisdications, state governments have found their fiscal and political
fortunes increasingly tied to the profitability of the gambling industry. This has created what
many citizens have viewed as an excessively close relationship between the industry and the
government regulator.
This in turn has led to excessive focus on the economic and financial returns from
expanding gambling, and less on the longer term fiscal, economic and social consquences of
deregulating and expanding the gambling industry. As competition between governments for
gambling businesses has intensified, tax and other concessions have been granted to attract
new gambling enterprises and new gambling customers. These new forms of gambling
produce less revenue per dollar for the government than traditional publicly owned concerns
such as lotteries. Traditional forms of gambling are generally seen to have less social costs.
24
National market saturation now threatens the viability of some gambling industries
and enterprises, especially as the Asian downturn reduces the tourist market. Close relations
between industry and govenrment lead to pressures for public financial support and other
concessions to preserve the viability of gambling concerns. When government accedes to
such requests to share profit risks with gambling enterprise shareholders, it is not acting as a
government but as an unlisted equity shareholder. Likewise, pressures to privatise, or
deregulate gambling further represent a removal of restrictions on encouraging gambling, to
protect consumers. Such moves typically don't involve removing the economic privilege
bestowed on the industry by the government `integrity guarantee' which establishes a mass
market for gambling and underwrites the value of the gambling industry.
Public concerns at these trends have led to announcement in early 1998 of an inquiry
into gambling by the Commonwealth government's Productivity Commission, which is
attached to the Commonwealth Treasury. It is unfortunate that the Commonwealth
government chose not to involve the States in the establishment of this inquiry which will
necessarily reflect a Commonwealth viewpoint. The Productivity Commission has exemplary
public processes for its inquiries, but it lacks internal expertise on social policy issues. While
it has a proud record in exposing unwarranted industry privilege, it is not well placed to
examine the major issues of citizenship and public trust that underpin gambling policy, nor
are its usual recommendations of privatisation, deregulation, and removing barriers to entry
likely to resolve the public concerns that led to the inquiry.
The Productivity Commission inquiry coincides with major changes to Australia's
system of indirect taxation with the introduction of a GST. The new Commonwealth taxation
of gambling services is likely to force out state governments, and drastically alter the
distribution of taxation across the gambling industry.
The year 1999, is therefore a historic opportunity to step back and evaluate the costs
and benefits of gambling taxation, in a broad context including its social and economic costs,
as well as the well publicised social and economic benefits.
25
Bibliography
Abt, V., J.F. Smith, et al. (1985). The Business of Risk. Lawrence, University Press of Kansas.
AFR (1997). Vietnamese Drug Bosses Linked to Hanson Death Threats. Australian FinancialReview: 3, 11–12 October.
AGB–McNair (1995). Community Gambling Patterns. Melbourne, Victorian Casino and Gaming
Authority.
Albon, R. (1997a). ‘The efficiency of state taxes’. Australian Economic Review 30(3): 1–15.
Albon, R. (1997b). ‘Efficient tobacco taxation: Ramsey and Pigovian consideratins’. Canberra, ANU.
Alchin, T.M. (1983). ‘Gambling taxes: the milch cow of New South Wales’. Economic Papers 2(1):
75–83.
Alchin, T. (1989). ‘Taxation of gambling in Australia’. Economic Analysis and Policy 19(2): 167–84.
ACSSA (Anglican Community Services of South Australia) (1997). Fair Game; Gambling in SouthAustralia. Adelaide, ACSSA.
ABS (Australian Bureau of Statistics ) (1995). Sport, Recreation and Gambling Industries Australia,1994–95 Preliminary, ABS Cat. No. 8692.0. Canberra, AGPS.
—— (1997a). Gambling Industries Australia, 1994–95, ABS Cat. No. 8684.0.
—— (1997b). Taxation Revenue, Australia, 1996-97. ABS Cat No 5506.0.
—— (1998). Casinos, 1996–97. ABS Cat. No. 8683.0.
AIGR (Australian Institute of Gambling Research) (1995). An Examination of the SocioeconomicEffects of Gambling On Individuals, Families and the Community, Including Research into theCost of Problem Gambling in NSW. Sydney, Casino Community Benefit Fund Trustees.
AIGR and IRU (Industry Research Unit (1995). Report of the First Year of the Study into the Socialand Economic Impact of the Introduction of Gaming Machines to Queensland Clubs and Hotels,
AIGR, University of Western Sydney, Industry Research Unit, University of Queensland for the
Department of Family Services and Aboriginal and Islander Affairs.
Black, E. (1995). ‘Gambling mania: lessons from the Manitoba experience’. Canadian PublicAdministration 39(1): 49–61.
Bongiorno, B. (1985). ‘Gambling and Crime’, in Gambling in Australia, G. Caldwell, B. Haig, M.
Dickerson and L. Sylvan, eds. Sydney, Croom Helm.
Borg, M.O. and P.M. Mason (1988). ‘The budgetary incidence of a lottery to support education’.
National Tax Journal 41: 75–85.
Borg, M.O., P.M. Mason, et al. (1991a). ‘The incidence of taxes on casino gambling: exploiting the
tired and poor’. American Journal of Economics and Sociology 50(3): 323–32.
—— (1991b). The Economic Consequences of State Lotteries. Westport, Conn. and London,
Greenwood, Praeger.
—— (1993). ‘The cross effects of lottery taxes on alternative state tax revenue’. Public FinanceQuarterly 21: 123–40, 2 April.
Brinner, R.E. and C.T. Clotfelter (1975). ‘An economic appraisal of State lotteries’. National TaxJournal 28: 395–404.
Buck, A.J. (1991). ‘A Von Thunen model of crime, casinos and property values in New Jersey’.
Urban Studies 28(5): 673–86.
Butler, J.B. and J.P. Smith (1992). ‘Tax expenditures on health in Australia’. Australian EconomicReview (2).
Campbell, C.S. and J R. Ponting (1984). ‘The evolution of casino gambling in Alberta’. CanadianPublic Policy 10(2): 171–75.

26
Chapman, R., J. Beard, et al. (1997). A framework for National Competition Policy Reviews ofGaming Legislation. Canberra/Sydney, Centre for International Economics.
Church, A.M. (1985). Natural Resource Taxation Policies. Canberra, Centre for Research on Federal
Financial Relations, ANU, Research Monograph 41
Clack, P. (1996). ‘The Money Machines. Gaming in Licenced Clubs Across Canberra’, The CanberraTimes, 7 September.
Clotfelter, C.T. (1979). ‘On the regressivity of state operated ‘numbers' games’. National Tax Journal32 (543–48).
—— (1994). ‘Review of: The economic consequences of state lotteries’. Journal of EconomicLiterature 32(1): 147–48.
Clotfelter, C.T. and P.J. Cook (1987). ‘Implicit taxation in lottery finance’. National Tax Journal40(4): 533–46.
—— (1989). Selling hope: state lotteries in America. Cambridge Mass. and London, Harvard
University Press.
—— (1990). ‘On the economics of state lotteries’. Journal of Economic Perspectives 4: 105–9, Fall.
Coleman, M. (1997). Gambling bug brings back the pawnbroker. The Canberra Times, September.
Collins, D., P. Hunt, et al. (1988). Review of the State Tax System; Tax Reform and NSW EconomicDevelopment. Sydney, New South Wales Tax Task Force.
CGC (Commonwealth Grants Commission) (1988). Report on General Grant Relativities 1988Update. Canberra, AGPS.
—— (1992). State tax sharing and health grants 1982. Canberra, AGPS.
—— (1997). Report on General Grant Relativities 1997 Update. Canberra, AGPS.
Cook, P.J. and C.T. Clotfelter (1993). ‘The peculiar scale economies of Lotto’. American EconomicReview 83(3): 634–43.
Cooper, S. and E. Cohn (1994). ‘Equity and efficiency of state lotteries’. Economics of EducationReview 13(4): 355–62.
de Viti de Marco, A. (1936). First Principles of Public Finance. London, Jonathan Cape.
DeBoer, L. (1985). ‘Administrative costs of state lotteries’. National Tax Journal 38: 479–87,
December.
—— (1986). ‘When will state lottery sales growth slow’. Growth and Change 17: 28–36, January.
Dickerson, M. (1992). The estimation of the extent and degree of gambling related ppersonal
problems in the Australian population, AIGR, cited in TasCOSS (1992).
Donzinger, A.J. (1973). The State Lottery; a Not So Regressive Tax. Western Economic Association,
Claremont.
Eadington, W.R. (1984). ‘The casino gaming industry: a study of political economy’. Annals of theAmerican Academy of Political and Social Sciences 464 (July): 23–35.
Eadington, W. (1987). ‘Approaches to the legalisation and commercialisation of casino gambling
throughout the world: causes and public policy concerns’. Faces of Gambling, Sydney, National
Association for Gambling Studies.
Economist, The (1997). Why casinos are a bad bet. The Weekend Australian, 1–2 February.
Edeson, J. (1998). Profits of Australia's 14 casinos drop 86pc. The Canberra Times.
Filer, J.E., D.L. Moak, et al. (1988). ‘Why some states adopt lotteries and others don’t’. PublicFinance Quarterly 16(3): 259–83.
Friedman, J., S. Hakim, et al. (1989). ‘Casino Gambling as a "Growth Pole" Strategy and Its Effect on
Crime’. Journal of Regional Science 29(4) 615–23, November.

27
Goodman, R. (1994). Legalised Gambling as a Strategy for Economic Development. Center for
Economic Development. MA, Amherst.
—— (1995). The Luck Business: the Devastating Consequences and Broken Promises of America'sGambling Expansion. New York, Free Press.
Grinols, E. (1995). ‘Gambling as an economic policy: enumerating why losses exceed gains’. IllinoisBusiness Review April: 6–12.
Grinols, E.L. (1996). ‘Incentives explain gambling's growth’. Forum for Applied Research and PublicPolicy 11(2): 119–124.
Groenewegen, P. (1983). Public Finance in Australia: Theory and Practice. Sydney, Prentice–Hall.
Gruen, A. (1976). ‘An inquiry into the economics of race-track gambling’. Journal of PoliticalEconomy 48 (1): 169–77.
Gulley, D.O. and F.A. Scott (1989). ‘Lottery effects on pari-mutuel tax revenues’. National TaxJournal 42(1, March): 89–93.
—— (1993). ‘The demand for wagering on state-operated Lotto games’. National Tax Journal 46(2):
13–22, June.
Guthrie, R.S. (1981a). ‘The effect of competition on tax revenues in the casino gaming industry’.
National Tax Journal 34(2): 261–65.
—— (1981b). ‘Taxing horserace gambling: the revenue potential’. Public Finance Quarterly 9(1).
Haig, B.D. (1984). Gambling in Australia 1920/21 to 1980/81. Canberra, Australian National
University.
Haig, B. (1985a). ‘Expenditure on legal gambling’, in Gambling in Australia. G. Caldwell, B. Haig,
M. Dickerson and L. Sylvan. Sydney, Croom–Helm: 71–78.
—— (1985b). Legal gambling since 1920–21. Gambling in Australia. G. Caldwell, B. Haig, M.
Dickerson and L. Sylvan. Sydney, Croom–Helm: 28–44.
Haig, B. and B. Reece (1985). Explaining and predicting expenditure on, and revenue from, legal
gambling. Gambling in Australia. G. Caldwell, B. Haig, M. Dickerson and L. Sylvan. Sydney,
Croom Helm: 123–35.
Hancock, K. (1977). ‘The taxation of racing by the Australian States’, in State and Local Taxation,
R.L. Mathews, ed. Canberra, ANU Press, 280–94.
Heavy, J.F. (1978). ‘The incidence of state lottery taxes’. Public Finance Quarterly 6: 415–26.
Henriksson, L.E. (1996). ‘Hardly a quick fix: casino gambling in Canada’. Canadian Public Policy22(2), June.
Hersch, P.L. and J.M. Netter (1989). ‘State prohibition of alcohol: an application of diffusion analysis
to regulation’, in Research in Law and Economics. J. R O Zerbe. Greenwich, CT, JAI Press. 12:
55–70.
Holloway, R. (1973). ‘More gambling, less tax’. Lloyds Bank Review 21–43.
Honeysett, S. (1996). Gambling tax rakes in $1bn. The Australian, 16 May.
Hughes, V. (1996). ‘Gambling and the State’. IPA Review 48(4): 35–41.
Hunter, B. and R.G. Gregory (1996). ‘An exploration of the relationship between changing inequality
of individual household, and regional inequality in Australia’. Urban Policy and Research, 14(3):
171–82.
Jackson, J.D., D.S. Saurman, et al. (1994). ‘Instant winners: legal change in transition and the
diffusion of state lotteries’. Public Choice 80(3–4): 245–63, September.
Johnson, J. (1976). ‘An economic analysis of lotteries’. Canadian Tax Journal 24: 639–51.
—— (1985). ‘Gambling as a source of government revenue in Australia’, in Gambling in Australia.
G. Caldwell, B. Haig, M. Dickerson and L. Sylvan. Sydney, Croom Helm: 78–93.

28
Kakwani, N. (1983). ‘Progressivity index of sales tax on individual expenditure items in Australia’.
Economic Record 59: 61–79.
Kallick, M. and e. al (1979). A Survey of American Gambling Attitudes and Behaviour. Ann Arbor,
MI, Survey Research Centre, Institute for Social Research, University of Michigan.
Kaplan, H.R. (1979). ‘The convergence of work, sport and gambling in America’. Annals of theAmerican Academy of Political and Social Science 445 (445, September): 24–38.
—— (1984). ‘The social and economic impact of state lotteries’. Annals of the American Academy ofPolitical Science 474: 91–106.
—— (1989). State Lotteries; Should the Government be a Player? Lexington, Mass.
Karcher, A.J. (1989). Lotteries. Cited in Ricklak (1992).
Lines, C. (1997). Crown banks on $290m jewel: shareholder pressure forces Melbourne casino to
fast-track purchase of management rights. The Canberra Times, 7 October.
Livernois, J.R. (1987a). ‘The taxing game of lotteries in Canada’. Canadian Public Policy 12(4):
622–27.
—— (1987b). ‘The redistributive effects of lotteries: evidence from Canada’. Public FinanceQuarterly 15(3): 339–51.
Lorenz, V.C. (1996). ‘Gambling dollars ... pennies from heaven?’ Forum for Applied Research andPublic Policy 98, Summer.
Madhusudhan, R.G. (1996). ‘Betting on casino revenues: lessons from state experiences’. NationalTax Journal 49(3): 401–12.
Martin, R. and B. Yandle (1990). ‘State lotteries as duopoly transfer mechanisms’. Public Choice 64:
253–64, March.
Mason, P.M., S.L. Shapiro, et al. (1989). ‘Gaming tax incidence for three groups of Las Vagas
gamblers’. Applied Economics 21(9): 1267–77.
Mathews, R.L. (1977). Business activity taxes and state financial responsibility’, in State and LocalTaxation. R.L. Mathews, ed. Canberra, ANUPress, 259–79.
Mathews, R.L. and B. Grewal (1997). The Public Sector in Jeopardy. Centre for Strategic Economic
Studies, Victoria Universityof Technology, Melbourne.
McCrann, T. (1997). Charity is alive and well — just ask Crown's needy shareholders. WeekendAustralian, 27–28 December.
McMillen, J. (1985). ‘Casino gambling in Queensland: prospects, problems and paradoxes’, in
Gambling in Australia, G. Caldwell, B. Haig, M. Dickerson and L. Sylvan, eds. Sydney, Croom
Helm: 94–104.
—— (1996a). ‘Risky ventures: Casino regulation in a changing market’, in Lady Luck in Australia, J.
McMillen, M. Walker and S. Sturevska, eds. Sydney, Sydney University Printing Service: 2–19.
—— (1996b). Gambling as an industry. Place your bets. Gambling in Victoria. M. Cathcart and K.
Darian–Smith. Melbourne, The Australian Centre, University of Melbourne: 49–70.
McMillen, J. and E. Eadington (1986). ‘The evolution of gambling laws in Australia’. New York LawSchool Journal of International and Comparative Law 8.
Mikesell, J. (1989). ‘A note on the changing incidence of state lottery finance’. Social ScienceQuarterly.
Mikesell, J. and K. Zorn (1986). ‘State lotteries as fiscal saviour or fiscal fraud: a look at the
evidence’. Public Administration Review 28: 311–20 (July/August).
Mikesell, J.L. (1994). ‘State lottery sales and economic activity’. National Tax Journal 47(1):
165–71.

29
Morgan, W.D. and J.D. Vasche (1980). ‘State revenue potential, parimutuel taxation: a comment’.
National Tax Journal 33.
—— (1982). ‘A note on the elasticity of demand for wagering’. Applied Economics 14(5).
Muller, D. (1997). Jewel in Kennett's crown is looking decidedly unsteady. Canberra Times, 27
December.
Musgrave, R.A. and P.B. Musgrave (1989). Public Finance in Theory and Practice. New York,
McGraw–Hill Book Company.
NCW (National Council of Welfare) (1996). Gambling in Canada. Ottawa, Canada.
NILECJ (National Institution of Law Enforcement and Criminal Justice) (1977). The Development ofthe Law on Gambling, US Department of Justice.
Nieuwenhuyen, J. (1983). Committee of Inquiry into Revenue Raising in Victoria. Melbourne,
Victorian Government.
Peppard, D.M. (1987). ‘Government as a bookie: explaining the rise of lotteries for revenue’. Reviewof Radical Political Economics 19 (3): 56–68.
Peters, B.G. (1991). The Politics of Taxation. U.K., Blackwell.
Pinto, S. and P. Wilson (1990). Gambling in Australia, Australian Institute of Criminology.
Quiggin, J. (1985). ‘The economics of gambling’, in Gambling in Australia,. G. Caldwell, B. Haig,
M. Dickerson and L. Sylvan, eds. Sydney, Croom Helm: 94–104.
Reece, B.F.P. (1984). ‘Gambling taxes: a comment’. Economic Papers 3(4): 75–80.
Reece, B.F., D.L. Maynard, et al. (1988). Commissioned Studies: Review of the State Tax System; Taxreform and NSW Economic Development. Sydney, New South Wales Tax Task Force.
Robinson, P. (1997). Let them eat chips. Sydney Morning Herald.
Rose, I.N. (1986). Gambling and the Law. Hollywood, CA, Gambling Times Inc.
Rubner, A. (1966). The Economics of Gambling. London, Macmillan.
Rychlak, R. (1992). ‘Lotteries, revenues and social costs: a historical examination of state-sponsored
gambling’. Boston College Law Review.
Saul, J. (1997). The Unconscious Civilisation. Ringwood, Victoria, Penguin Books Australia.
Self, P. (1985). Political Theories of Modern Government. London, Allen & Unwin.
Simmonds, S.A. and R. Sharp (1987). ‘State lotteries’ effects on thoroughbred horse racing’. Journalof Policy Analysis and Managementt 6(3): 446–48.
Smith, J.P. (1993). Taxing Popularity. Canberra, Federalism Research Centre, ANU.
Spiro, M.H. (1974). ‘On the tax incidence of the Pennsylvania lottery’. National Tax Journal 27:
57–61.
State Government of Victoria. (1994). Review of Electronic Gaming Machines in Victoria.
Melbourne.
Stigler, J.E. (1988). Economics of the Public Sector. New York, W. W. Norton & Co.
Stocker, F.D. (1972). ‘State sponsored gambling as a source of tax revenue’. National Tax Journal25(3): 437–41.
Stover, M.E. (1987). ‘Revenue potential of state lotteries’. Public Finance Quarterly 15(4): 428–40.
—— (1990). ‘Contiguous state lotteries: substitutes or complements?’ Journal of Policy Analysis andManagement 9(4): 565–68.
Suits, D. (1975). The economic case against state-run gambling. Business Week: 67–68.
—— (1977a). ‘Gambling taxes: regressivity and revenue potential’. National Tax Journal 30(1):
19–35.

30
—— (1977b). ‘Measurement of tax progressivity’. American Economic Review 67: 437–41.
—— (1979a). ‘The elasticity of demand for gambling’. Quarterly Journal of Economics 93
(February): 155–62.
—— (1979b). ‘Economic background for gambling policy’. Journal of Social Issues 43(60).
Sylvan, R. and L. Sylvan (1985). ‘Ethics and gambling’, in Gambling in Australia, G. Caldwell, B.
Haig, M. Dickerson and L. Sylvan, eds. Sydney, Croom Helm: 217–31.
Szakmary, A. and C. Szakmary (1995). ‘State lotteries as a source of revenue: a reexamination’.
Southern Economic Journal 61(4): 1167–81.
TasCOSS (Tasmanian Council of Social Services) (1992). Inquiry into the Social Impact of theExtention of Video Gaming Machines Beyond Casinos in Tasmania. Hobart, Tasmanian State
government.
—— (1995). "Taking Care" Some joint approaches to problem gambling by government, industryand community. Country Club Casino, Prospect Vale.
TGC (Tasmanian Gaming Commission) (1997). Australian Gambling Statistics 1972–73 to 1995–96.
Centre for Regional Economic Analysis, University of Tasmania.
Thompson, W.N. and R. Gazel (1996). ‘Casino gambling gaining ground across America’. Forum forApplied Research and Public Policy (Summer): 98.
VCGA (Victorian Casino and Gaming Authority ) (1997). The Impact of the Expansion in Gaming onthe Victorian Retail Sector. Melbourne.
Victoria, State Government of (1994). Review of Electronic Gaming Machines in Victoria.
Vrooman, D.H. (1976). ‘An economic analysis of the New York lottery’. National Tax Journal 29:
482–89.
Warren, N. (1979). ‘Australian tax incidence in 1975–76; some preliminary results’. AustralianEconomic Review 47: 19–27.
—— (1986). Changes in Australian tax incidence between 1975–76 and 1984–85, Centre for Applied
Economic Research, University of NSW.
Weinstein, D. and L. Deitch (1974). The impact of legalised gambling: the socioeconomic
consequences of lotteries and off-track betting.

0
0.5
1
1.5
2
2.5
%
1970-71
1972-73
1974-75
1976-77
1978-79
1980-81
1982-83
1984-85
1986-87
1988-89
1990-91
1992-93
1994-95
1996-97
Figure 1: Gambling Tax as a percentage of Australian Taxation
Sources: ABS 1997b; Alchin 1989.
0
0.5
1
1.5
2
2.5
3
3.5
% ofpersonal
cons/final
cons exp
1948-49
1951-52
1954-55
1957-58
1961-62
1965-66
1968-69
1971-72
1974-75
1977-78
1980-81
1983-84
1986-87
1989-90
1992-93
1995-96
Figure 2: Gambling's Share of Consumer Spending1948-49 to 1994-95
Sources: Haig (1984), Tasmanian Gaming Commission (1997).

0
500
1000
1500
2000
2500
3000
3500
1995-96 prices
1972-73
1974-75
1976-77
1978-79
1980-81
1982-83
1984-85
1986-87
1988-89
1990-91
1992-93
1994-95
1995-96
Figure 3: Real Gambling Revenues, 1972-73 to 1995-96
GamingRacing
Total gambling
Source: Tasmanian Gaming Commission (1997).
0
5000
10000
15000
20000
25000
30000
35000
40000
1970-71
1972-73
1974-75
1976-77
1978-79
1980-81
1982-83
1984-85
1986-87
1988-89
1990-91
1992-93
1994-95
1996-97
Figure 4: Real Value of Payments to States, 1970-71 to 1996-97 191989-90 prices
Total payments
General purpose payments
Source: State Finances Branch, The Treasury

0
5
10
15
20
25
30
35
40
45
1972-73
1974-75
1976-77
1978-79
1980-81
1982-83
1984-85
1986-87
1988-89
1990-91
1992-93
1994-95
1995-96
Figure 5: Tax Rate on Gambling, 1972-73 to 1995-96
as % of expenditure
as % of turnover
0
10
20
30
40
50
60
70
80
90
100
Accum
ulated % of tax
burden
0 10 20 30 40 50 60 70 80 90 100
Accumulated % of householdsincome
Figure 6: Lorenz Curve for Gambling Taxes, 1984

0
10
20
30
40
50
60
70
80
90
100
A
ccumulated %
of taxburden
0 10 20 30 40 50 60 70 80 90 100
Accumulated % of householdsincome
Figure 7: Lorenz Curve for Gambling Taxes, 1994