Embed Size (px)
Citation preview

2 Australian ETF Report - 2018

Contents
About this report 4
What are ETFs 6
Types of ETF 8
Share Market ETF Groupings 10
ETF Market Summary 12
Key Statistics 12
By Sector Group 14
By ETF Issuer 16
By Performance 18
By Funds Under Management (FUM) 20
Rules-based ETFs (non market-cap / smart beta) 22
Shortcomings of smart beta 24
Smart Beta ETFs 26
Active Managed Fund ETFs 28
Why Stockspot avoids active ETFs 30
Ethical investing 32
ETF Sectors 34
Australian Shares 36
Australian Shares (Sectors) 42
Global Shares 44
Global Shares (Sectors) 58
Fixed Income & Cash 62
Currency 66
Commodity 68
Conclusion 71
Glossary 72
www.stockspot.com.au | [email protected] 3

Welcome to our fourth Australian exchange traded fund (ETF) report which aims to help investors understand and compare ASX listed ETFs. We want to provide consumers with an objective, independent view of the ETF landscape.
ETFs continue to be the biggest disruptor to the asset management industry and at the same time are blurring the lines between different styles of investing. Over the past 15 years, over US$2 trillion has moved out of active funds and into index funds and ETFs. Globally the ETF market is projected to reach US$10 trillion by 2020 and be larger than the active managed fund market by 2027 1.
The use of ETFs in Australia continues to grow at a phenomenal rate. The local ETF market grew from $27.2 billion to $36.2 billion (33% growth) over the past year. In Australia ETFs have become popular with individual investors, advisers and Self Managed Super Fund (SMSF) trustees due to their low-cost, transparency and diversification benefits, as well as being available on the ASX.
SMSFs and older Australians are turning to ETFs to earn a better return than cash or term deposits but with lower risk than direct shares. ETFs are giving Australian retirees and pre-retirees exposure to global shares and bonds, improving their overall diversification while reducing risk.
Meanwhile ETFs are becoming the first investment experience for many younger Australians via robo advisers or round up apps.
Recently the Royal Commission into Banking Misconduct has put a spotlight on the conflicts caused by the vertical integration of the banks and typical investment products that they recommend to clients. The beneficiaries of this likely to be
About this report
independent non-aligned advisers – many of whom recommend ETFs.
Over the past year 23 new ETFs have been listed on the Australian Securities Exchange (ASX), with a significant increase in the number of global share ETFs and fixed income ETFs. Active funds have started joining the ETF bandwagon by launching their own ETF-like funds, known as exchange traded managed funds (ETMFs). This is a double edged sword for them, while it may give them access to new distribution channels via the ASX it also makes their typical underperformance vs indexing more visible to the general public.
We’ve analysed over 175 ETFs by looking at factors like fees, performance, size and activity. We also look at recent ETF market trends including the continued growth in global ETFs, the wide gap between the performance of different sectors and styles and the mixed performance of active and smart beta ETFs.
We hope you find the report useful and please let us know your feedback.
Chris Brycki Founder & CEO, Stockspot
1 Reshaping around the investor: Global ETF Research 2017 (EY)
4 Australian ETF Report - 2018

About Stockspot
Stockspot is Australia’s largest and most experienced online investment adviser.
Since 2013, we have helped thousands of Australians grow their savings and have been actively campaigning to increase transparency in the financial industry for consumers.
We make investing easy and affordable. Whether you’re growing your wealth, saving for a home, a family or retirement, we help you do it with the right investment portfolio and guidance.
Your money is managed by experts with an established track record. We look after your investments so you can focus on other important things in life.
Our investment strategies have built a 4 year track record of consistent returns.
Find out more: www.stockspot.com.au
www.stockspot.com.au | [email protected] 5

An exchange traded fund (ETF) is an open-ended investment fund that is traded on a stock exchange. ETFs first emerged in the USA in the early 1990s and their recent explosive growth has led to more options being available across the world, including Australia since their introduction in 2001.
What are ETFs?
6 Australian ETF Report - 2018

COMMON TYPES OF ETFS
BONDS
AustralianIndex
Australiansector
Internationalindex
Internationalsector
FixedIncome
Commodities
ETFs can be traded on the ASX in the same way as shares in a company. Rather than owning shares in a business, an ETF tracks an asset class, such as Australian shares or global shares, and provides direct exposure to a wide range of investments within that asset class.
HOW IT WORKS
BUY / SELL
Investor Broker or Adviser
SecuritiesExchange
TRADE
TRADE
UNDERLYING SECURITIESETF UNITS
Authorised Participants
ETF issuer(e.g. iShares, Vanguard, Betashares)
www.stockspot.com.au | [email protected] 7

INCLUDED IN THIS REPORT
We have covered several types of exchange traded products (ETPs) in this report. Broadly they are all described as exchange traded funds (ETFs), however the ASX has more specific naming conventions to capture some of the subtle differences between exchange traded products:
Types of ETF
Exchange traded fund (ETF) — Under ASX naming conventions, ETF technically refers only to funds that passively track an index. These are usually structured as a managed investment scheme, where investors hold units in a trust. The majority of ETPs are indeed ETFs and the remaining ETPs are types of actively managed funds with additional identifying characteristics.
Exchange traded structured products (SP) — These exchange traded products do not typically invest in the underlying asset, but instead aim to mimic the performance of an index synthetically via a structured agreement or derivative over futures contracts. This structure is most commonly used by issuers creating commodity indices as it is not feasible to hold most physical commodities. Where investors are exposed to counterparty risk of more than 10% of the fund’s net asset value structured products must have the word ‘synthetic’ as part of their name for easy identification.
Exchange traded managed fund (ETMF) — These are also admitted to trading status on the ASX like ETFs, but are actively managed funds. Similarly to ETFs they are typically structured as managed investment schemes.
Exchange traded hedge fund (ETHF) — These are a specific type of exchange traded managed fund that fits within the regulations set out by ASIC criteria and class orders. These are funds that use complex instruments such as borrowing, options and short selling and are required to have the words ‘hedge fund’ in their title for identification. The ‘hedge fund’ title is a little confusing since these funds are not actually hedge funds as most people know them to be, but rather funds that offer leverage like the Geared Australian Equity Fund (GEAR) – or an inverse pay-off to the market like BetaShares Australian Equities Bear Fund (BEAR).
8 Australian ETF Report - 2018

NOT INCLUDED IN THIS REPORT
There are also other investment fund options available on the ASX, which this report does not cover:
mFunds — This is an ASX-linked platform which enables investment in a range of unlisted managed funds via the ASX CHESS system. However there is no standard settlement timeframe across issuers and products. In addition there is no live pricing so investors must wait until after the close of trading each day to know the price of units that have been bought or sold.
Listed Investment Companies (LICs) — These are usually managed funds which are actively managed in a closed ended structure, which means that there is no unit creation/redemption process. Investors in LICs own shares in a company, which may trade at premium or discount to net asset value so there is no guarantee that the prices of LICs will resemble the value of underlying investments. As a result LICs often vary considerably from their Net Asset Value (NAV).
Infrastructure funds and Real Estate Investment Trusts (REITs) — These give investors exposure to portfolios of infrastructure or property assets. Similar to LICs, they can trade at a premium or discount to their Net Asset Value (NAV).
www.stockspot.com.au | [email protected] 9

Our report categorises share market ETFs into three distinct groupings which relate to the underlying indices that they track. It is important that investors understand the differences between these groups as the products have significant differences in their risk, cost, transparency and performance characteristics.
Share Market ETF Groupings
MARKET-CAP BASED ETFSThe first share market indices were designed to measure the broad market and serve as a point of comparison for ‘active’ (stock-picking) fund managers.
They typically weight stocks by size – the stocks with the biggest market value make up a larger portion of the index. Examples of size-weighted indices include popular ones you’ve probably heard of such as the the S&P500 (started in 1957) or S&P/ASX200 (started in 2000).
When John Bogle launched the first index fund in 1975, it was intended as a sensible and low-cost way for individuals to invest into such indices. The Vanguard 500 Index was not intended to beat the market, but simply ensure investors kept up with the stocks in it. Over forty years later, market-cap based indices and ETFs continue to be the most popular ETFs globally.
RULES BASED ETFS (NON MARKET-CAP / ‘SMART BETA’)All index funds, by definition, are passive investments. There’s no fund manager making trading decisions, all buying and selling is done according to a strict set of rules. However, smart beta indices aim to fix some of the perceived shortcomings of weighting investments by market size when building an index.
One example is that during a bubble, some shares can make up a larger and larger proportion of the index, like technology stocks did during the ‘tech boom’ in the late 1990s, or mining stocks when commodity prices rocketed in 2006-2011. This can cause traditional size-weighted indices to ‘overshoot’ during booms and busts.
To address this and other similar observations about size-weighted indices, new ways of constructing indices have emerged – with weights determined by different approaches such as dividends, research ratings, simple averages, or consistency of cash flows. While rules based ETFs are becoming more popular, their ability to outperform market-cap weighted ETFs on a risk-adjusted basis is questionable.
ACTIVE ETFSThese products don’t track an index, they are much more similar to actively managed funds since their investment process is based on the discretionary decisions of fund managers.
They are called active ETFs because they are listed on the ASX within an ETF-like wrapper which typically provides better liquidity and price transparency compared to a listed investment company (LIC) structure. These are actively managed funds.
10 Australian ETF Report - 2018

www.stockspot.com.au | [email protected] 11

ETF Market Summary
+33% $36.2B
+$715m
-$218m
ETF FUNDS UNDER MANAGEMENT
BIGGEST WINNER
BIGGEST LOSER
ETF funds under management grew 33% over the past year to $36.2 billion
Global ETFs and Fixed Income ETFs made up 18 out of 23 new listings
Biggest winner was Vanguard Australian Shares Index ETF which grew by $715 million
Biggest loser was BetaShares Australian Dividend Harvester Fund which lost $218 million
18OUT OF
23
12 Australian ETF Report - 2018

+$3BVANGUARD ETF GROWTH
In Australia small cap and growth shares outperformed banks and dividend shares
Globally tech shares and emerging markets outperformed other sectors and developed markets
Vanguard continued its dominance with $3 billion of ETF growth (45%)
Several active ETFs listed on the ASX but their performance has been lacklustre
SMALL CAP & GROWTH
SHARES
BANK & DIVIDEND SHARES
ACTIVE ETFS
www.stockspot.com.au | [email protected] 13

By Sector Group
Sector Number of Products
FUM ($M) Mar'17
FUM ($M) Mar'18
Annual change in FUM ($M)
Annual change in FUM (%)
Global Shares 66 9,943 14,447 4,504 45%
Australian Shares 41 10,317 12,425 2,104 20%
Fixed Income & Cash 25 2,946 4,340 1,395 47%
Australian Shares (sectors) 9 1,687 2,000 313 19%
Global Shares (sectors) 19 1,005 1,666 660 66%
Commodity 11 780 893 113 14%
Currency 7 569 541 -28 -5%
Totals 178 27,248 36,313 9,065 33%
Source: ASX
ETF Market Summary
14 Australian ETF Report - 2018

By Sector Group
ETF GROWTH BY SECTOR
0
3000
6000
9000
12000
15000Mar'18Mar'17
Currenc
y
Commodity
Global Sha
res (se
ctors)
Austra
lian S
hares (
secto
rs)
Austra
lian S
hares (
strate
gies)
Fixed In
come & Cas
h
Austra
lian S
hares (
broad m
arket)
Global Sha
res (broad
mark
et)
Source: ASX$M
ETF Market Summary
www.stockspot.com.au | [email protected] 15

Issuer FUM($M) Mar'17 FUM($M) Mar'18 Annual change in FUM ($M)
Annual change in FUM%
iShares 7,976 10,594 2,618 33%
Vanguard 7,067 10,230 3,163 45%
SPDR 5,247 5,556 309 6%
BetaShares 3,560 4,543 982 28%
VanEck Vectors 708 1,602 894 126%
Magellan 873 1,211 338 39%
ETF Securities 665 975 310 47%
Russell 603 642 38 6%
Platinum - 275 275 n/a
UBS 244 270 25 10%
Perth Mint 116 134 18 16%
Switzer 60 76 15 25%
Montgomery Investment Management
- 72 72 n/a
AMP 35 49 14 41%
Schroder 28 46 17 61%
K2 54 33 -20 -38%
Aurora 11 7 -3 -32%
Totals 27,248 36,313 9,065 33%
By ETF Issuer
ETF GROWTH BY ISSUER
0
2000
4000
6000
8000
10000
12000FUM($M) Mar'18FUM($M) Mar'17
AuroraK2
Schroder
AMP
Montg
omery Inv
estment
Manag
ement
Switzer
Perth M
int
UBS
Platinu
m
Russe
ll
ETF Secu
rities
Mag
ellan
VanEck
Vectors
BetaSha
res
SPDR
Vangua
rd
iSha
res
Source: ASX$M
ETF Market Summary
Only includes issuers with $250 million in FUM.
16 Australian ETF Report - 2018

These issuers are the businesses that build and ‘issue’ the ETPs to the public. The largest four issuers, iShares, Vanguard, SPDR and BetaShares account for 85% of funds under management but smaller issuers have also experienced strong growth over the past year. Eight issuers grew by more than $100 million and two issuers by more than $1 billion.
iShares (owned by BlackRock) has retained its position as the leading issuer in Australia with $2,618 million in new FUM. Their globally focused ETFs gained from strong share market returns. It launched two new fixed income ETFs in the past the year.
Vanguard continued its rapid growth by growing FUM by 45% and is now just behind iShares with 28% of all FUM compared to iShares’ 29%. It launched four new multi-asset ETPs and a new global bond ETF to expand their fixed income offerings.
SPDR had a relatively low growth rate of 6%, it has struggled to keep up with competitive pressures on fees over the past few years. Australia’s largest ETF by FUM, the SPDR S&P/ASX 200 (STW) received 40% of SPDR’s total inflows. SPDR now hasn’t launched any new ETFs or changed any fees for two years.
BetaShares had strong FUM growth of just under $1 billion as well as launching six new funds. BetaShares has partnered with several active managers to launch new active ETMFs this year. BetaShares has always focused on more actively managed ETF strategies so it’s a natural move for them to partner with other active managers to help manufacturer and distribute their products within an ETMF wrapper.
VanEck Vectors more than doubled its FUM over the year with the highest rate of FUM growth of any issuer at 126%. Its new fixed income ETFs – VanEck Vectors Australian Floating Rate ETF (FLOT) and VanEck Vectors Australian Corporate Bond Plus ETF (PLUS) – accounted for a fifth of their growth.
Magellan continued to attract funds to its actively managed products with a 40% growth rate of FUM. Its flagship international shares fund (Magellan Global Equities Fund [Managed Fund] [MGE]) received majority of the funds and its infrastructure option (Magellan Infrastructure Fund [Currency Hedged] [Managed Fund] [MICH]) also grew by nearly $100 million.
Russell had a low, but positive growth rate for FUM of 6%. Its corporate bond ETF (Russell Australian Select Corporate Bond ETF [RCB]) captured 97% of total FUM growth. Their smart beta value ETF (Russell Australian Value ETF [RVL]) will close down in May due to lack of demand.
Platinum listed its two managed hedge fund products in September 2017. Its Asia focused fund (Platinum Asia Fund [Quoted Managed Hedge Fund] [PAXX]) launched with $30 million under management and global shares fund (Platinum International Fund [Quoted Managed Hedge Fund] [PIXX]) with $40 million. Both products have continued to grow strongly, coinciding with a period of outperformance for their funds.
ETF Securities inherited eight ETFs from their dismantled joint venture with ANZ in May 2017, which are included in the final figures and growth rates. It launched two new sector specific ETFs, an infrastructure product (ETFS Global Core Infrastructure ETF [CORE]) as well as one ETF product that invests in companies associated with robotics and automation. (ETFS ROBO Global Robotics and Automation ETF [ROBO])
The following ETFs were affected by ANZ’s departure from ETFs and are referred to as ETF Securities products throughout the report:
• ETFS Physical Gold ETF (ZGOL)• ETFS Physical Renminbi ETF (ZCNH)• ETFS Physical US Dollar ETF (ZUSD)• ETFS S&P 500 High Yield Low Volatility ETF (ZYUS)• ETFS S&P/ASX 100 ETF (ZOZI)• ETFS S&P/ASX 300 High Yield Plus ETF (ZYAU)• ETFS EURO STOXX 50 ETF (ESTX)• ETFS Morningstar Global Technology ETF (TECH)
UBS continued its gradual FUM growth and launched one new cash ETF (UBS IQ Cash ETF [MONY]).
By ETF IssuerETP Market Summary
www.stockspot.com.au | [email protected] 17

ASX Code ETF Name Issuer FUM($M) Mar'18
1 Year Total Return
Positive performance
UBP UBS IQ MSCI Asia APEX 50 Ethical ETF UBS 9 30.1%
IAA iShares S&P Asia 50 ETF iShares 423 29.1%
IBK iShares MSCI BRIC ETF iShares 39 27.0%
OOO BetaShares Crude Oil Index ETF-Currency Hedged (Synthetic)
BetaShares 30 22.9%
IZZ iShares FTSE China Large-Cap ETF iShares 99 22.1%
Negative performance
HVST BetaShares Australian Dividend Harvester Fund (Managed Fund)
BetaShares 209 -16.2%
MNRS BetaShares Global Gold Miners ETF - Currency Hedged BetaShares 5 -10.4%
ETPMAG ETFS Physical Silver ETF Securities 57 -10.1%
AOD Aurora Dividend Income Trust Aurora 7 -9.2%
QAG BetaShares Agriculture ETF-Currency Hedged (Synthetic) BetaShares 3 -8.8%
Source: ASX
By Performance
Top 5 ETFs by returns Worst 5 ETFs by returns
-50-40-30-20-10
010
20304050
1 year total return
QAGAODETPMAGMNRSHVST
Source: ASX
-50-40-30-20-10
010
20304050
1 Year Total Return (%)
IZZOOOIBKIAAUBP
Source: ASX
ETF Market Summary
These ETFs are the five best and worst performers by returns over the 12 months to March 2018.
We exclude ‘geared ETFs’ from this list as they will generally outperform or underperform similar unlevered funds due to leverage.
18 Australian ETF Report - 2018

POSITIVE PERFORMANCEAsian shares ETFs, in particular Chinese shares, featured heavily this year accounting for four out of the top five ETFs by annual returns. Asian shares had underperformed other regions like the US since the financial crisis. The decision to reduce oil supplies and ongoing political tensions have aided a rising oil price for the BetaShares Crude Oil Index ETF-Currency Hedged (Synthetic) (OOO).
By PerformanceETF Market Summary
NEGATIVE PERFORMANCEThe worst performances of the year came from The BetaShares Australian Dividend Harvester Fund (Managed Fund) (HVST). This fund invests in large ASX shares that are about to pay dividends while also selling futures contracts as a form of hedging to reduce risk. The HVST product has significantly underperformed the Vanguard Australian Shares High Yield ETF (VHY) and generated an annual return of -16.2%.
www.stockspot.com.au | [email protected] 19

ASX Code
ETF Name Issuer FUM($M) Mar'17
FUM($M) Mar'18
Annual change in FUM ($M)
1 Year Total Return
Increases in FUM
VAS Vanguard Australian Shares Index ETF Vanguard 1,819 2,534 715 2.7%
IOZ iShares Core S&P/ASX 200 ETF iShares 608 1,255 647 2.0%
VGS Vanguard MSCI Index International Shares ETF
Vanguard 414 941 527 12.6%
VEU Vanguard All-World ex US Shares Index ETF
Vanguard 771 1,177 406 14.1%
IVV iShares S&P 500 ETF iShares 2,143 2,490 347 11.7%
Decreases in FUM
HVST BetaShares Australian Dividend Harvester Fund (Managed Fund)
BetaShares 427 209 -218 -16.2%
IXI iShares S&P Global Consumer Staples ETF iShares 146 108 -37 1.8%
USD BetaShares U.S Dollar ETF BetaShares 512 476 -37 -0.1%
ILC iShares S&P/ASX 20 ETF iShares 339 306 -33 -2.7%
SLF SPDR S&P/ASX 200 Listed Property Fund SPDR 586 554 -31 -1.3%
Source: ASX
ETF Market Summary By Funds Under Management (FUM)
ETF GROWTH BY FUM
0
500
1000
1500
2000
2500
3000FUM Mar 2017 ($M)FUM Mar 2016 ($M)
IVVVEUVGSIOZVAS0
100
200
300
400
500
600FUM Mar 2018 ($M)FUM Mar 2017 ($M)
SLFILCUSDIXIHVST
Source: ASX Source: ASX
Top 5 by FUM growth Worst 5 by FUM growth
These ETFs are the five best and worst performers by FUM growth over the 12 months to March 2018.
20 Australian ETF Report - 2018

ETF Market Summary
INCREASES IN FUMThe highest fund inflows this year were once again into the large, broad market ETFs. The broad Australian sharemarket ETFs remained popular with Vanguard Australian Shares Index ETF (VAS) and iShares Core S&P/ASX 200 ETF (IOZ) taking the top two places, despite relatively low returns compared to global shares this year.
This continued popularity of Australian share market ETFs is likely coming from switching out of direct shares and underperforming active funds. This group of ETFs that attracted the top inflows demonstrates how Vanguard and iShares have cemented their place and built up a strong reputation for offering low cost, broad market index ETFs.
By Funds Under Management (FUM)
DECREASES IN FUMBetaShares’ Dividend Harvester ETF (HVST) was the only ETF to lose more than $200 million of funds this year. There were also outflows from a more defensive iShares S&P Global Consumer Staples ETF (IXI), SPDR S&P/ASX 200 Listed Property Fund (SLF) and BetaShares U.S Dollar ETF (USD).
www.stockspot.com.au | [email protected] 21

Rules-based ETFs (non market-cap / smart beta
Smart beta is growing investment trend, marketed as a new way to diversify and reduce risk. Here we look at smart beta ETFs in Australia – what they are, how they are built and how they’ve performed.
Smart beta – also known as strategic beta, alternative beta, fundamental beta, advanced beta, enhanced beta, and probably a few other names – aims to combine elements of passive index investing and active fund management to deliver the best of both worlds: transparency, broad diversification, and market-beating returns – all at low cost. What more could you ask for? But before you throw all of your savings into the latest smart beta product, it’s worth digging a bit deeper into what smart beta really is. Smart beta is all about index construction which refers to which stocks (or other assets) make up an index and their relative size within that index.
22 Australian ETF Report - 2018

EMERGENCE OF SMART BETAAll index funds, by definition, are passive investments. This includes smart beta. There is no fund manager making trading decisions and all buying and selling is done according to a strict set of rules.
However, smart beta indices aim to fix some of the believed shortcomings of weighting investments by market size when building an index. One example is that during a bubble, some shares can make up a larger and larger share of the index, like technology stocks did during the ‘tech boom’ in the late 1990s, or mining stocks when commodity prices rocketed in 2006-2011. This can cause traditional size-weighted indices to ‘overshoot’ during booms and busts.
To address this and other similar observations about size-weighted indices, new ways of constructing indices have emerged – with weights determined by different approaches such as dividends, research ratings, simple averages, or consistency of cash flows. This is what’s meant by smart beta.
COMMON SMART BETA STRATEGIESThere are four common smart beta approaches to building indices:
• High dividend strategies that aim to pick stocks with higher dividend yields to boost investor income. e.g. Vanguard Australian Shares High Yield ETF (VHY)
• Other fundamental indices that focus on measures like sales revenue or free cash flow as a more accurate measure of economic contribution rather than using market capitalisation. e.g. Russell Australian Value ETF (RVL) or BetaShares FTSE RAFI Australia 200 ETF (QOZ)
• Equal weighting – the simplest form of index construction that just averages an entire universe of stocks, thus giving each stock the same importance. e.g. VanEck Vectors Australian Equal Weight ETF (MVW)
• Low volatility strategies which target a smoother ride by carefully selecting less risky stocks. e.g. ANZ/ETFS S&P 500 High Yield Low Volatility Fund (ZYUS)
While some of these funds may advertise a new paradigm of investment thinking, they all use fairly transparent, rules-based approaches to prioritise exposure to certain market factors. These factors include style (growth and value), size (large, mid, small), or momentum (consistency). The challenge for investors is in deciding which factors to want exposure to (if any).
SMART BETA BETS ON MARKET FACTORSAt their core, all smart beta ETFs are taking a bet on certain market factors being more important than others:
• Low volatility and high dividend stocks tend to have a bias towards value stocks that have lower growth and more stable earnings since they tend to be less volatile than companies with less predictable profits like mining businesses or biotechnology. However, when investors crowd into low-volatility or high dividend stocks, as they’ve been doing over the past few years, it can push valuations in some sectors (e.g. telecommunications, utilities, and property) to the point that they actually become more risky. This can, perhaps counterintuitively, make low volatility or high dividend strategies dangerous after a period of good returns.
• Fundamental indices may use operating cash flow as a better indication of economic size. Analysis shows these approaches have a strong value stock bias as well.
• An equal weighting methodology introduces a significant bias towards small companies because the stocks that have a lower market size have the same weight in the index as bigger businesses like Commonwealth Bank (CBA). The portfolio will likely also have a value bias because equal weighting will expand the weight of value stocks, which tend to trade at lower price compared to their profit.
www.stockspot.com.au | [email protected] 23

Shortcomings of smart beta
HOW SMART IS IT REALLY?By offering enhanced exposure to some factors, like value and size, smart beta strategies must also be de-prioritising other factors. Because current price reflects every factor used by any investor to estimate a company’s value, a market-size-weighted index also represents an all-factor approach to investing. On the other hand, smart-beta is essentially taking a bet that a few select factors are more important than an all factor (market value) approach.
BACKTESTING CAN GIVE FALSE CONFIDENCESmart beta strategies are often marketed as being able to ‘beat the market’. However the truth is often a lot more murky. Many have only outperformed from backtesting over a select, historical time period which introduces a few significant issues.
Think of an index like a deck of cards. Backtesting lets you shuffle a deck of cards thousands of times until a favourable “shuffle” emerges to match the order you want to show. In essence, backtesting lets the smart beta strategies and ETFs ‘stack a deck’ of stocks in a way that outperformed the index in the past. But there’s no guarantee that the same strategy will work going forward. As a result, many smart beta strategies could have simply worked in the past by chance.
Let’s say you rebuilt S&P/ASX 200 but weighted the companies according to the birthday of their CEOs and found that this new index outperformed a size weighted index by 20% over 15 years. This would not be because January-born CEOs are better at managing businesses than December ones. This would just be an example of how you can use a random set of data to prove any hypothesis when backtesting.
FACTORS USED TO ESTIMATE A COMPANY’S VALUE
• Profits • Regulatory environment • Competitive landscape • Management effectiveness • Expected growth • New products / business • Counterparty exposure • Supply chains • Corporate governance controls • Liquidity • International operations • Hedging activity • Input Prices • Natural disasters • Market Share • Business Model • Industry outlook • Expectations • Off-balance sheet items • Share re-purchases • Accounting irregularities
• Dividends • Assets • Cash flow • Book value • Sales • Volatility
Factors that smart beta focus on
Source: Vanguard
24 Australian ETF Report - 2018

WHAT ABOUT RISK?Some smart beta strategies have been able to outperform the index over the long-term, but the differences in return can usually be explained simply by risk. For example, equal-weight indices of stocks do tend to outperform market-size weighted indices over the long-term. However this can be explained entirely due to equal weight taking more risk (due to having more small stocks). On a risk versus returns basis, you’re no better off owning the equal weight index even though it generated higher returns. Also, there are sometimes lower-cost ways to get the same factor exposure (small companies) and return profile.
Sources: CRSP US Stock and Index Database, S&P Dow Jones Indexes, Federal Reserve
SMART BETA FOLLOWS IN-VOGUE STYLE TRENDSIt’s no coincidence that many of the smart beta funds launched over the past couple of years in Australia have been dividend focused. This is because dividend investment strategies had a great run of performance between 2011 and 2014. ETF issuers know that it’s much easier selling strategies that have done well recently than those that haven’t since people tend to chase returns.
In fact research has shown that on average, new funds launch about 6 months after the peak in their particular strategy compared to the broad index. This is not a coincidence – the product teams launching new funds usually take about 6 months to get them launched so when they decide to launch a fund it is usually at exactly the point that the particular strategy is showing its best results compared to benchmarks. Unfortunately, outperformance tends to end soon after smart beta ETFs are launched. The underperformance of many ‘dividend’ themed ETFs which all launched around the peak of the ‘yield’ theme in 2014/2015 is evidence of this.
Source: Research Affiliates
www.stockspot.com.au | [email protected] 25

Alternative Indices Smart Beta ETFs
ASX Code
ETF Name MER 1 Year Total
Return
Market benchmarkVAS Vanguard Australian Shares Index ETF 0.14% 2.7%
Dividend focusedDIV UBS IQ Morningstar Australia Dividend Yield ETF 0.30% -1.3%
FDIV VanEck Vectors S&P/ASX Franked Dividend ETF 0.35% -3.5%
IHD iShares S&P/ASX High Dividend Yield ETF 0.30% -3.7%
RDV Russell High Dividend Australian Shares ETF 0.34% -2.6%
STI SPDR MSCI Australia Select High Dividend Yield Fund 0.35% -3.2%
VHY Vanguard Australian Shares High Yield ETF 0.25% -2.5%
Averages 0.32% -2.8%
EthicalUBA UBS IQ MSCI Australian Ethical ETF 0.17% 1.2%
FAIR BetaShares Australian Sustainability Leaders ETF 0.49% n/a
RARI Russell Australian Responsible Investment ETF 0.45% -0.8%
Averages 0.37% 0.2%
Value focusedETF UBS IQ Morningstar Australia Multifactor ETF 0.30% 2.1%
RVL Russell Australia Value ETF 0.34% -2.1%
Averages 0.32% 0.0%
Other factorsAUMF iShares Edge MSCI Australia Multifactor ETF 0.30% 7.1%
MVOL iShares Edge MSCI Australia Minimum Volatility ETF 0.30% 9.3%
QOZ BetaShares FTSE RAFI Australia 200 ETF 0.40% 1.0%
ZYAU ETFS S&P/ASX 300 High Yield Plus ETF 0.35% 3.7%
Averages 0.34% 5.3%
PERFORMANCE OF SMART BETA ETFS
26 Australian ETF Report - 2018

Alternative Indices Smart Beta ETFs
AVERAGE RETURNSOver the last year ‘smart beta’ ETFs have had mixed performances compared to the traditional market cap weighted ETF such as Vanguard Australian Shares Index ETF (VAS).
• Dividend and value focused strategies performed poorly, generally with negative returns
• Ethical ETFs had slightly positive returns but underperformed the broad market
• Small and mid cap focused smart beta ETFs including Ex-20 and Equal Weight ETFs outperformed the market but underperformed vanilla small cap ETFs like Vanguard MSCI Australia Small Companies Index ETF (+13.0%)
CONCLUSIONMost smart beta strategies don’t hold up to any analytical rigor as tools for outperformance – typically they pick a factor that has performed well in recent history and launch at the peak of that factors relative performance. We have seen this with dividend themed ETFs over recent years. P-hacking makes it easy to get studies to ‘work’ so ETF manufacturers can come up with an appealing story and then sell a new product. Factors are actually very hard to predict and if they persist they are arbitraged out of the market by more sophisticated investors, or simply reflect different amounts of risk.
Smart beta ETFs give investors the ability to tilt their portfolios towards certain factors. But if you are considering investing in an smart beta ETF, it is important to understand that you are actually taking bets on certain market factors beating others. You should be comfortable with what those factor bets are, and why you are taking them. If you don’t understand the bets you are taking and the only reason you are investing in smart beta is backtesting or recent performance, then what you’re buying into isn’t smart beta as much as it is smart marketing, and that is not smart investing.
ASX Code
ETF Name MER 1 Year Total
Return
Market benchmarkVSO Vanguard MSCI Australian Small Companies Index ETF 0.30% 13.0%
Small-cap focusedEX20 BetaShares Australian Ex-20 Portfolio Diversifier ETF 0.25% 11.8%
MVS VanEck Vectors Small Companies Masters ETF 0.49% 9.0%
MVW VanEck Vectors Australian Equal Weight ETF 0.35% 6.8%
Averages 0.36% 9.2%
Source: ASX
www.stockspot.com.au | [email protected] 27

Alternative Indices Active Managed Fund ETFs (Australian shares)
ASX Code
ETF Name MER 1 Year Total
Return
Market benchmarkVAS Vanguard Australian Shares Index ETF 0.14% 2.7%
Managed fundsAUST BetaShares Managed Risk Australian Share Fund (Managed Fund) 0.49% 0.9%
AOD Aurora Dividend Income Trust 0.97% -9.2%
HVST BetaShares Australian Dividend Harvester Fund (Managed Fund) 0.90% -16.2%
SWTZ Switzer Dividend Growth Fund (Managed Fund) 0.89% -1.1%
YMAX BetaShares Australia Top20 Equity Yield Max Fund 0.79% -1.7%
HBRD BetaShares Active Australian Hybrids Fund 0.55% n/a
EINC BetaShares Legg Mason Equity Income Fund (Managed Fund) 0.85% n/a
RINC BetaShares Legg Mason Real Income Fund (Managed Fund) 0.85% n/a
SMLL BetaShares Australian Small Companies Select Fund (Managed Fund) 0.39% n/a
Source: ASX
COMMENTARYSeveral new Australian active ETFs listed during the year. Of the Australian active ETFs that have been listed for more than a year, all of them underperformed the broad market. This shows how difficult it is for active managers to beat the market after their costs are subtracted from gross investment returns.
28 Australian ETF Report - 2018

Alternative Indices Active Managed Fund ETFs (Global shares)
ASX Code
ETF Name MER 1 Year Total
Return
Market benchmarkIOO iShares S&P Global 100 ETF 0.40% 12.1%
Managed fundsMGE Magellan Global Equities Fund (Managed Fund) 1.35% 11.9%
MHG Magellan Global Equities Fund Currency Hedged (Managed Fund) 1.35% 10.9%
WRLD BetaShares Managed Risk Global Share Fund (Managed Fund) 0.54% 10.2%
UMAX BetaShares S&P 500 Yield Maximiser Fund (Managed Fund) 0.79% 5.8%
MOGL Montgomery Global Equities Fund (Managed Fund) 1.32% n/a
Source: ASX
COMMENTARYGlobal share actively managed ETFs followed a similar trend to Australian managers with none able to outperform the broad market iShares S&P Global 100 (IOO).
While it is unusual for not a single active manager to outperform the broad market, we would expect the average return of active managers to be below their indexed counterparts over longer periods of time due to the impact of fees. This year the unhedged Magellan Global Equities fund would have beaten index funds if it weren’t for its fees.
www.stockspot.com.au | [email protected] 29

Why Stockspot avoids active ETFs
Investing is a zero sum game – every BHP, Telstra and Facebook share is owned by someone. If you only own a few shares and they’re the good ones that went up by more than the market, then it must be true someone else owns the bad stocks that went up less than the market.
All the active managers own all the stocks, so as a group they can only ever deliver the market return before their fees, and less than that after fees. Research including the SPIVA® Australia Scorecard and Stockspot Fat Cat Funds Report consistently shows that ~75% of active managers underperform the market each year. The ~25% that does well tends to be different each year so it’s very difficult to pick winners in active investing.
The shaded green area shows why on average, only 25% of active managers beat the market on any year.
Factors that smart beta focus on
Source: Vanguard. Note that these distributions are theoretical and do not reflect any set of actual returns.
30 Australian ETF Report - 2018

That doesn’t mean that some professionals don’t have a good run. Fund managers can often have a great period of success, but performance tends to ‘revert to the mean’ over the long run. A period of good relative performance by a fund manager is often followed by a period of poor relative performance. There are exceptions where fund managers have been consistent for decades, however it takes 22 years of performance data to have 90% confidence that their performance was actually due to skill and not luck.2
Good active managers do exist but they are rare and by the time they have built a reliable track record they’re often closed to accepting new money, or retired.
Unfortunately because of investor herd chasing behaviour, top performing funds tend to attract lots of money after good performance and before they start to lag. The same happens with ‘hot’ asset classes or sectors of the market – inflows tend to be largest at the top which is exactly when they should be avoided!
Vanguard recently addressed this phenomenon in a research paper. They looked at fund performance for the 36 months after funds received a rating from Morningstar. Their surprising discovery was that the highest 5-star funds actually under-performed the lowly rated 1-star funds by about 1.30%.
Ratings agencies tend to put a lot of weight on recent fund performance. However, fund managers who have performed well over the recent past often perform badly in subsequent years because investment styles are ‘mean reverting’. For example, a ‘value’ fund that beats the market for a few years is prone to underperformance when ‘growth’ stocks excel for a few years. In the Fat Cat Funds Report we found very few managers who were able to consistently outperform the market, even over 5 years.
Similarly S&P Dow Jones Indices analysed 715 past top-performing funds, focusing on U.S. stock funds between 2010 and 2014. It found only 2 funds stayed in the top 25% through the four-year period.
Fund managers struggle to stay on top for an extended period, as most favour a certain investment style (like value or growth) and these styles tend to come in and out of favour with the market.
The lower the fee you pay to have your funds invested, the more money there is left for you. Every dollar you pay in commissions, funds management fees, adviser fees or brokerage come directly out of your returns. Active fund managers as a group have average performance over the long run, so paying them large fees destroys your long term earning potential. This is why Stockspot has avoided recommending active funds to our clients.
2 The Pension Institute Discussion Paper PI-1401
www.stockspot.com.au | [email protected] 31

HOW HAVE ETHICAL FUNDS BEEN GROWING?The past 20 years there’s been a steady increase in funds targeting people who want to invest with social responsibility, moral or ethical philosophy. Ethical investing is now big business with many billions of dollars invested in ethical funds in Australia.
The Responsible Investment Association of Australia (RIAA), estimates there is over $6 trillion invested in ethical strategies around the world.
Ethical investing
Factors that smart beta focus on
Known as ethical investing, sustainable investing or green investing, socially responsible investing is an investment strategy that considers both financial return and social good to bring about social change.
Its history is believed to date back to the Quaker Society in the late 18th Century when members were banned from participating in the slave trade. Seems fair enough today. Back then, it was a bold statement.
Fast forward a few hundred years we saw people question the ethics of companies during the Vietnam War. Dow Chemical, a napalm producer, was boycotted and the subject of protests across America for its war profiteering when a photo was released of a nine-year-old girl running naked and screaming with her back on fire from the napalm dropped on her village. Recently fast fashion brands like H&M and Zara are under scrutiny for labour rights violations, so some ethical funds have stopped investing in these brands.
WHAT IS ETHICAL?People’s idea of what socially responsible investing is can often be different. This makes ethical investing tricky because funds can invest quite differently. You may want a fund that avoids fossil fuels. There are plenty. However those funds may invest in companies involved in gambling or cigarettes – which you may oppose. The IQ MSCI Australian Ethical fund states it doesn’t invest in ammunition or tobacco – both serious killers. That’s great, apart from the small fact there are no ASX listed ammunition or tobacco manufacturing companies in Australia. Dig deeper and you find the fund invests in fossil fuel production which may not fit your definition of ethical.
Most ethical funds invest in the tech giants like Apple and Google which book much of their global profit in tax havens to avoid paying tax in the local jurisdictions in which they operate. Equally, Australian banks feature heavily in most ethical fund portfolios despite the spate of recent scandals exposing how poorly they treat their customers. How ethical is charging dead customers?
You need to look carefully at where ethical funds invest to make sure it aligns with your world view and values. Beautiful photographs and emotive words on a website don’t necessarily translate to a fund operating within your definition of ethical investing.
32 Australian ETF Report - 2018

ARE THEY MAKING GOOD RETURNS?Returns from Australian ethical funds have been mixed. For years they have failed to deliver competitive returns. This has reversed recently and over the last 5 years many ethical funds have beaten the broader index. One reason for the better performance of many ethical funds since about 2010 is an absence of companies like BHP Billiton and Rio Tinto on account of their investments in fossil fuels and coal seam gas. Both stocks had underperformed the market which has helped ethical funds perform well. However over the last year this trend has reversed again and all of the Australian ethical ETFs underperformed the market.
SAVING THE WORLD SHOULDN’T COST THE WORLDSome socially responsible funds charge, in our view, outrageous fees for access to their ethical investment process. Their hope is that people who care about the environment won’t mind that fees are eroding their investment. It is well documented in academia and research including in our Fat Cat Funds Report that any fund charging upwards of 1% per year in management fees will inevitably struggle to deliver even market returns over the long run because of the drag of costs.
Given this, we would question whether it is ethical for any fund (and particularly an ethical fund) to charge over 1% per year in fees, regardless of its social objective.
ETF ISSUERS TAKING A STANDThe popularity of ETFs has resulted in the big three issuers – Blackrock (iShares), Vanguard and State Street Global (SPDR) owning significant percentages of many large companies around the globe. As index funds they can’t sell shares to take a stand on particular issues, but are becoming more active when it comes to voting on all sorts of shareholder issues.
All three major issuers have recently created investment stewardship plans with economic social governance principles that outline their views. These plans maintain that businesses need to consider climate change and diversity in the workforce as part of their future strategies. The issuers’ constantly engage with businesses about their concerns and have shared goals of long-term success.
BetaShares recently launched the BetaShares Australian Sustainability Leaders ETF (FAIR) that screens companies for sustainable business activities and excludes those with exposure to fossil fuels and other areas of ethical concern such as gambling. Likewise the Vaneck Vectors MSCI International Sustainable Equity ETF (ESGI) has exclusions covering a range of industries, with a focus on companies with low fossil fuel use and carbon emissions.
WHAT ARE YOUR VALUES?When investing in a socially responsible fund you should consider your personal values and make sure they match up with what you’re investing in. Fees should also be a consideration when selecting an ethical fund.
www.stockspot.com.au | [email protected] 33
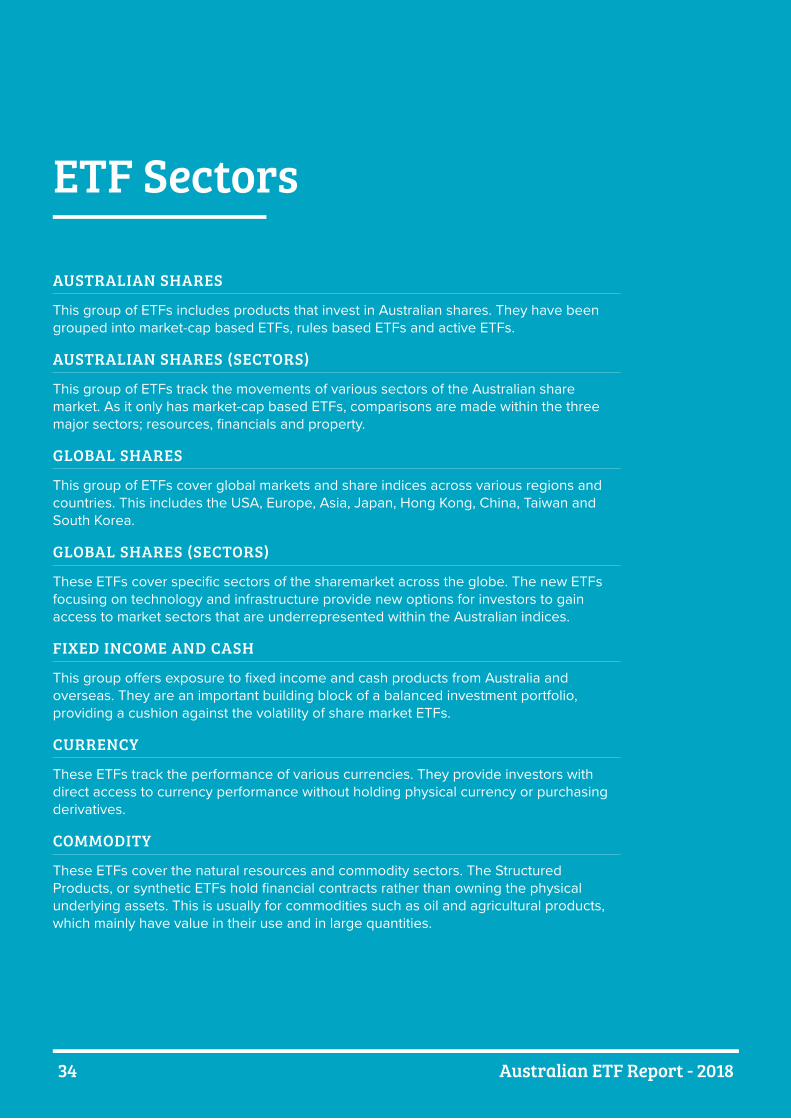
ETF Sectors
AUSTRALIAN SHARES
This group of ETFs includes products that invest in Australian shares. They have been grouped into market-cap based ETFs, rules based ETFs and active ETFs.
AUSTRALIAN SHARES (SECTORS)
This group of ETFs track the movements of various sectors of the Australian share market. As it only has market-cap based ETFs, comparisons are made within the three major sectors; resources, financials and property.
GLOBAL SHARES
This group of ETFs cover global markets and share indices across various regions and countries. This includes the USA, Europe, Asia, Japan, Hong Kong, China, Taiwan and South Korea.
GLOBAL SHARES (SECTORS)
These ETFs cover specific sectors of the sharemarket across the globe. The new ETFs focusing on technology and infrastructure provide new options for investors to gain access to market sectors that are underrepresented within the Australian indices.
FIXED INCOME AND CASH
This group offers exposure to fixed income and cash products from Australia and overseas. They are an important building block of a balanced investment portfolio, providing a cushion against the volatility of share market ETFs.
CURRENCY
These ETFs track the performance of various currencies. They provide investors with direct access to currency performance without holding physical currency or purchasing derivatives.
COMMODITY
These ETFs cover the natural resources and commodity sectors. The Structured Products, or synthetic ETFs hold financial contracts rather than owning the physical underlying assets. This is usually for commodities such as oil and agricultural products, which mainly have value in their use and in large quantities.
34 Australian ETF Report - 2018

www.stockspot.com.au | [email protected] 35

ASX code
ETF Name Issuer MER (p.a)
2018
FUM ($M)
Mar'17
FUM ($M)
Mar'18
Change in FUM
($M)
Traded value in Mar'18
% Spread Historical Distribution
Yield
1 Year Total
Return
Market-cap based ETFs
IOZ iShares Core S&P/ASX 200 ETF
iShares 0.15% 608 1255 647 47,587,459 0.07% 3.8% 2.0%
STW SPDR S&P/ASX 200 SPDR 0.19% 3385 3511 126 374,524,785 0.04% 4.5% 2.3%
VAS Vanguard Australian Shares Index ETF
Vanguard 0.14% 1819 2534 715 122,884,680 0.05% 3.8% 2.7%
ILC iShares S&P/ASX 20 ETF
iShares 0.24% 339 306 -33 12,924,655 0.09% 5.0% -2.7%
VLC Vanguard MSCI Australian Large Companies Index ETF
Vanguard 0.20% 73 78 5 2,510,048 0.06% 4.6% -2.4%
SFY SPDR S&P/ASX 50 SPDR 0.29% 456 472 17 25,403,692 0.05% 5.1% -0.4%
ZOZI ETFS S&P/ASX 100 ETF ETF Securities
0.24% 32 8 -24 164,602 0.19% 5.2% 2.5%
MVE VanEck Vectors S&P/ASX MidCap 50 ETF
VanEck Vectors
0.45% 28 68 40 6,644,647 0.11% 3.8% 12.8%
ISO iShares S&P/ASX Small Ordinaries ETF
iShares 0.55% 64 82 18 4,979,245 0.31% 2.1% 13.7%
VSO Vanguard MSCI Australian Small Companies Index ETF
Vanguard 0.30% 85 154 69 14,038,488 0.13% 3.7% 13.0%
SSO SPDR S&P/ASX Small Ordinaries Fund
SPDR 0.50% 12 19 7 716,179 0.28% 2.5% 16.6%
Averages 0.30% 0.12% 4.0% 5.5%
Totals 6,901 8,488 1,587 612,378,482
Source: ASX
Australian SharesETF Sectors
This group of ETFs includes products that invest in Australian shares. They have been grouped into market-cap based ETFs, rules based ETFs and active ETFs.
36 Australian ETF Report - 2018

ASX code
ETF Name Issuer MER (p.a)
2018
FUM ($M)
Mar'17
FUM ($M)
Mar'18
Change in FUM
($M)
Traded value in Mar'18
% Spread Historical Distribution
Yield
1 Year Total
Return
Rules-based ETFs
AUMF iShares Edge MSCI Australia Multifactor ETF
iShares 0.30% 6 8 1 732,529 0.23% 4.3% 7.1%
MVOL iShares Edge MSCI Australia Minimum Volatility ETF
iShares 0.30% 6 6 0 83,182 0.16% 4.8% 9.3%
ETF UBS IQ Morningstar Australia Quality ETF
UBS 0.30% 19 8 -11 191,535 0.11% 1.5% 2.1%
RVL Russell Australian Value ETF
Russell 0.34% 14 13 -1 919,967 0.07% 4.6% -2.1%
EX20 BetaShares Australian Ex-20 Portfolio Diversifier ETF
BetaShares 0.25% 8 26 18 3,251,510 0.15% 2.2% 11.8%
DIV UBS IQ Morningstar Australia Dividend Yield ETF
UBS 0.30% 27 26 -1 450,884 0.22% 4.2% -1.3%
FDIV VanEck Vectors S&P/ASX Franked Dividend ETF
VanEck Vectors
0.35% 4 4 0 705,225 0.13% 5.8% -3.5%
IHD iShares S&P/ASX High Dividend Yield ETF
iShares 0.30% 257 251 -5 9,959,879 0.11% 5.2% -3.7%
SYI SPDR MSCI Australia Select High Dividend Yield Fund
SPDR 0.35% 175 178 4 8,606,749 0.07% 4.9% -3.2%
VHY Vanguard Australian Shares High Yield ETF
Vanguard 0.25% 780 1014 234 67,082,444 0.07% 8.1% -2.5%
RDV Russell High Dividend Australian Shares ETF
Russell 0.34% 287 280 -7 12,228,495 0.09% 6.7% -2.6%
MVS VanEck Vectors Small Companies Masters ETF
VanEck Vectors
0.49% 55 67 12 7,221,353 0.33% 3.2% 9.0%
ZYAU ETFS S&P/ASX 300 High Yield Plus ETF
ETF Securities
0.35% 16 51 35 7,587,641 0.16% 10.1% 3.7%
QOZ BetaShares FTSE RAFI Australia 200 ETF
BetaShares 0.40% 201 255 55 65,064,792 0.12% 4.2% 1.0%
MVW VanEck Vectors Australian Equal Weight ETF
VanEck Vectors
0.35% 211 447 236 36,425,715 0.09% 3.2% 6.8%
UBA UBS IQ MSCI Australian Ethical ETF
UBS 0.17% 162 176 14 3,535,008 0.09% 4.1% 1.2%
FAIR BetaShares Australian Sustainability Leaders ETF
BetaShares 0.49% 0 99 99 29,774,422 0.15% 0.2% n/a
Australian SharesETF Sectors
www.stockspot.com.au | [email protected] 37

Australian SharesETF Sectors
ASX code
ETF Name Issuer MER (p.a)
2018
FUM ($M)
Mar'17
FUM ($M)
Mar'18
Change in FUM
($M)
Traded value in Mar'18
% Spread Historical Distribution
Yield
1 Year Total
Return
RARI Russell Australian Responsible Investment ETF
Russell 0.45% 61 68 8 2,092,994 0.19% 5.5% -0.8%
Averages 0.34% 0.14% 4.6% 1.9%
Totals 2,289 2,979 690 255,914,324
Active ETFs
AUST BetaShares Managed Risk Australian Share Fund (Managed Fund)
BetaShares 0.49% 32 25 -7 783,716 0.10% 4.3% 0.9%
AOD Aurora Dividend Income Trust
Aurora 0.97% 11 7 -3 131,497 2.67% 8.6% -9.2%
EINC BetaShares Legg Mason Equity Income Fund (Managed Fund)
BetaShares 0.85% 0 7 7 644,226 0.35% 0.0% n/a
HVST BetaShares Australian Dividend Harvester Fund (Managed Fund)
BetaShares 0.90% 427 209 -218 30,232,643 0.13% 11.9% -16.2%
KSM K2 Australian Small Cap Fund (Hedge Fund)
K2 1.31% 20 15 -5 312,715 1.16% 9.8% 12.5%
RINC BetaShares Legg Mason Real Inome Fund (Managed Fund)
BetaShares 0.85% 0 7 7 683,617 0.45% 0.0% n/a
SMLL BetaShares Australian Small Companies Select Fund (Managed Fund)
BetaShares 0.39% 0 20 20 3,809,339 0.52% 1.2% n/a
SWTZ Switzer Dividend Growth Fund (Managed Fund)
Switzer 0.89% 60 76 15 1,594,999 0.50% 3.9% -1.1%
YMAX BetaShares Australia Top20 Equity Yield Max Fund
BetaShares 0.79% 377 382 4 17,711,613 0.18% 9.1% -1.7%
BBOZ BetaShares Australian Strong Bear (Hedge Fund)
BetaShares 1.38% 86 83 -3 35,193,530 0.13% 0.0% -1.6%
BEAR BetaShares Australian Equities Bear (Hedge Fund)
BetaShares 1.38% 57 54 -3 8,748,436 0.11% 0.0% -0.1%
GEAR BetaShares Geared Australian Equity Fund (Hedge Fund)
BetaShares 0.80% 57 70 13 32,846,180 0.13% 7.1% 0.2%
Averages 0.92% 0.54% 4.7% -1.8%
Totals 1,128 955 -173 132,692,511
38 Australian ETF Report - 2018

Australian SharesETF Sectors
ASX code
ETF Name Issuer MER (p.a)
2018
FUM ($M)
Mar'17
FUM ($M)
Mar'18
Change in FUM
($M)
Traded value in Mar'18
% Spread Historical Distribution
Yield
1 Year Total
Return
Overall
Averages 0.50% 0.25% 4.5% 2.1%
Totals 10,317 12,421 2,104 1,000,985,317
Source: ASX
www.stockspot.com.au | [email protected] 39

Australian SharesETF Sectors
AVERAGE RETURNSAustralian share ETFs had a relatively low average return of 2.1% after fees for the year including a 4-5% dividend yield. Market-cap based ETFs fared better than smart beta and active ETFs with a 5.5% average return and the three top performers. Smart beta ETFs returned 1.9% and active ETFs -1.8%.
Despite the large number of new active ETF listings, few had been able to even match the market return or their respective benchmarks.
BEST AND WORST PERFORMERSFunds invested in small cap companies out-performed large cap funds across the three groupings of ETFs, while growth focused shares beat high-dividend paying companies.
For market-cap based ETFs, the SPDR S&P/ASX Small Ordinaries Fund’s (SSO) had the highest returns at 16.6%. This trend was mirrored with iShares S&P/ASX Small Ordinaries ETF (ISO) and Vanguard MSCI Australian Small Companies Index ETF (VSO) having the next highest annual returns at 13.7% and 13.0% respectively. To contrast, the worst performer was iShares S&P/ASX 20 ETF (ILC) with -2.7%, which only includes the twenty largest companies by market capitalisation. The Vanguard MSCI Australian Large Companies Index ETF (VLC) returned -2.4% with the thirty largest companies.
On rules-based ETFs, BetaShares Australian Ex-20 Portfolio Diversifier ETF (EX20) that excludes the twenty largest companies, was the top performer with a 11.8% return. The VanEck Vectors Small Companies Masters ETF (MVS) has the second highest return at 9.3%. This performance was equalled by the iShares Edge MSCI Australia Minimum Volatility ETF (MVOL).
Worst performers
Dividend strategies were the worst smart beta performers with the iShares S&P/ASX High Dividend Yield ETF (IHD) at -3.7%. Four other ETFs with the same yield focus had returns ranging between -3.5% to -2.5%. They include: VanEck Vectors S&P/ASX Franked Dividend ETF (FDIV), SPDR MSCI Australia Select High Dividend Yield Fund (SYI), Vanguard Australian Shares High Yield ETF (VHY) and Russell High Dividend Australian Shares ETF (RDV).
The BetaShares Australian Dividend Harvester Fund (Managed Fund) (HVST) had the worst overall performance in the past year with a -16.2% return, whilst the K2 Australian Small Cap Fund (Hedge Fund) (KSM) returned 12.5% by investing in small companies.
Active share ETFs had the lowest average performance with -1.8%, and were one of only four sub-groups with a negative average return across the entire market.
Top performers
This year’s top performer, BetaShares Australian Ex-20 Portfolio Diversifier ETF (EX20) had avoided weak performance from banks and accessed better performance from smaller shares by excluding the 20 largest companies of the ASX200. Other top performers were VanEck Vectors Small Companies Masters ETF (MVS) and the VanEck Vectors Australian Equal Weight ETF (MVW), both highlighting the trend of smaller companies outperforming the large-caps shares this year.
Other top strategies included the iShares Edge MSCI Australia Minimum Volatility ETF (MVOL) ETF tracking an index made of around 105 companies with lower than average volatility measures and the iShares Edge MSCI Australia Multifactor ETF (AUMF) that ranks stocks based on quality, size, value and momentum.
Dividend and quality strategies had a less successful year, with the majority underperforming Vanguard Australian Shares Index ETF (VAS) and SPDR S&P/ASX 200 (STW).
Some smart beta funds have not attracted enough interest to remain listed. Russell has announced it will close the Russell Australian Value ETF (RVL) in May 2018 due to limited interest in the product.
40 Australian ETF Report - 2018

LARGEST INFLOWS AND OUTFLOWSThe broad Australian sharemarket remained popular with investors, who continue to gravitate towards large ETFs tracking well-known indices.
The iShares Core S&P/ASX 200 ETF (IOZ) grew by $647 million in FUM and received an inflow of $468 million in November 2017 alone. Its competitor, the Vanguard Australian Shares Index ETF (VAS) grew by $715 million in FUM, with an inflow of $321 million in September 2017. These two were responsible for 65% of the funds increase in this group. The iShares S&P/ASX 20 ETF (ILC) had the greatest outflow of $33 million, as well as being the worst performing market-cap based ETF. The ETF S&P/ASX 100 ETF (ZOZI) was the only other ETF with negative FUM growth, with an outflow of $24 million.
For rules-based ETFs, the VanEck Vectors Australian Equal Weight ETF (MVW) received the highest inflow of $236 million. It continues to perform well due to the outperformance of small shares relative to banks. This was closely followed by the $234 million inflow into the Vanguard Australian Shares High Yield ETF (VHY). The UBS IQ Morningstar Australia Quality ETF (ETF) had the greatest outflow with a $11 million decline in FUM.
The BetaShares Australian Dividend Harvester Fund (Managed Fund) (HVST) had the greatest decline in FUM of all products, with a $218 million outflow over the year. The BetaShares Australian Small Companies Select Fund (Managed Fund) (SMLL) attracted the greatest amount of FUM amongst active ETFs, with $20 million since its launch in April 2017. The Switzer Dividend Growth Fund (Managed Fund) (SWTZ) saw the greatest inflows for existing products with $15 million in inflows.
NEW FUNDS AND CLOSURESBetaShares was responsible for all four new products in this category. It launched a new ethical investing option, the BetaShares Australian Sustainability Leaders ETF (FAIR) and the BetaShares Australian Small Companies Select Fund (Managed Fund) (SMLL), a managed fund that invests in small companies. Together with fund manager Legg Mason they also launched two actively managed products focused on income, the BetaShares Legg Mason Real Income Fund (Managed Fund) (RINC) and the BetaShares Legg Mason Equity Income Fund (Managed Fund) (EINC).
Russell Investments announced that its Russell Australian Value ETF (RVL) will stop trading and close down in May due to a lack of demand for the product. Stockspot prefers larger ETFs with at least $25 million in FUM for this very reason - because smaller products are at risk of closing due to being uncommercial.
Australian SharesETF Sectors
OVERALL TRENDSGenerally, the outperformance of small companies and negative returns of dividend strategies and active strategies stand out as key trends. Due to Australian banks having a large weighting in market-cap indices their performance is the largest swing factor in determining whether large cap beats small cap and if market-cap ETFs beat equal weight ETFs.
Vanguard is now responsible for 30.4% of FUM in this group, approaching SPDR’s lead at 33.7%. VanEck Vectors grew rapidly from a small base and almost doubled FUM in this sector.
STOCKSPOT CHOSEN ETFSThe Vanguard Australian Shares Index ETF (VAS) is our current Stockspot portfolio inclusion. It offers exposure to the three hundred largest companies in Australia by tracking the established S&P ASX/300 Index. It has greater diversification benefits than the SPDR S&P/ASX200 (STW) ETF which tracks the S&P/ASX 200, as well as having a lower expense ratio.
Stockspot Themes also include the SPDR S&P/ASX 50 (SFY) for those after a large-cap focus and Vanguard MSCI Australian Small Companies Index ETF (VSO) for those who prefer to tilt their portfolios towards small-cap shares. The Russell Australian Responsible Investment ETF (RARI) is offered as a socially responsible theme option for clients.
We currently avoid smart beta and strategy based ETFs because their fees tend to be higher and returns less consistent. The evidence does not suggest they will improve on results from strategic asset allocation using more vanilla ETFs over the long run. This year’s underperformance from smart-beta ETFs and active ETFs would certainly support our view.
www.stockspot.com.au | [email protected] 41

Australian Shares (Sectors)ETF Sectors
This group of ETFs track the movements of various sectors of the Australian share market. As it only has market-cap based ETFs, comparisons are made within the three major sectors; resources, financials and property.
ASX code
ETF Name Issuer MER (p.a)
2018
FUM ($M)
Mar'17
FUM ($M)
Mar'18
Change in FUM
($M)
Traded value in Mar'18
% Spread Historical Distribution
Yield
1 Year Total
Return
Resources Sector
MVR VanEck Vectors Australian Resources ETF
VanEck Vectors
0.35% 25 81 56 43,282,737 0.12% 3.1% 19.4%
OZR SPDR S&P/ASX 200 Resource Fund
SPDR 0.40% 31 59 28 2,563,907 0.15% 2.2% 17.2%
QRE BetaShares S&P/ASX 200 Resources Sector ETF
BetaShares 0.39% 16 118 101 45,620,842 0.22% 1.4% 17.3%
Averages 0.38% 0.16% 2.2% 18.0%
Totals 73 259 185 91,468,485
Financial Sector
MVB VanEck Vectors Australian Bank ETF
VanEck Vectors
0.28% 28 29 1 1,504,253 0.10% 5.9% -7.4%
OZF SPDR S&P/ASX 200 Financials ex A-REITs Fund
SPDR 0.40% 66 59 -8 5,018,342 0.09% 5.2% -7.2%
QFN BetaShares S&P/ASX 200 Financials Sector ETF
BetaShares 0.39% 18 14 -4 983,216 0.12% 4.1% -6.5%
Averages 0.36% 0.10% 5.1% -7.0%
Totals 112 102 -11 7,505811
Property Sector
MVA VanEck Vectors Australian Property ETF
VanEck Vectors
0.35% 58 103 44 22,281,754 0.14% 6.1% -0.9%
SLF SPDR S&P/ASX 200 Listed Property Fund
SPDR 0.40% 586 554 -31 17,613,130 0.14% 4.1% -1.3%
VAP Vanguard Australian Property Securities Index ETF
Vanguard 0.23% 858 983 125 80,625,544 0.09% 3.1% -0.4%
Averages 0.33% 0.12% 4.4% -0.9%
Totals 1,502 1,640 138 120,520,438
Overall
Averages 0.35% 0.13% 3.9% 3.4%
Totals 1,687 2,000 313 219,494,734
Source: ASX
42 Australian ETF Report - 2018

Australian Shares (Sectors)ETF Sectors
AVERAGE RETURNSThe average return of 3.4% was the fifth highest across ETF groups, ahead of Australian share and fixed income ETFs. This group’s average returns are affected by the wide range of returns, with a 26% difference between the best and worst performers.
BEST AND WORST PERFORMERSWith a focus on one area of the economy, the performance of sector ETFs tends to vary drastically over time.
The resources sector has grown less rapidly after exceptional performances of up to 40% last year, but has provided high returns ranging from 17% to 19% and is the only sector with all positive inflows since November 2017. The VanEck Vectors Australian Resources ETF (MVR) was the top performer with 19.4%, slightly ahead of the SPDR S&P/ASX 200 Resource Fund (OZR) and BetaShares S&P/ASX 200 Resources Sector ETF (QRE) with 17.2% and 17.3% annual returns respectively.
The financial sector ETFs all had negative returns clustered around -7%. The VanEck Vectors Australian Bank ETF (MVB) was the worst performer with -7.4%, SPDR S&P/ASX 200 Financials ex A-REITs Fund (OZF) was slightly behind with -7.2% and BetaShares S&P/ASX 200 Financials Sector ETF (QFN) with -6.5%. These results were impacted by large weightings towards bank shares which lagged the overall market.
LARGEST INFLOWS AND OUTFLOWSOf this group’s $313 million of funds growth, 40% went to Vanguard Australian Property Securities Index ETF (VAP) and 32% to BetaShares S&P/ASX 200 Resources Sector ETF (QRE).
The trend of SPDR S&P/ASX 200 Listed Property Fund (SLF) losing funds in contrast with its lower priced competitors from VanEck Vectors Australian Property ETF (MVA) and Vanguard Australian Property Securities Index ETF (VAP) continued. It had the greatest outflows, with a $31 million decline in FUM.
OVERALL TRENDSThe divergent results of this group’s ETFs highlights the importance of diversifying investment across different sectors. Resources ETFs were top performers and more than tripled their original FUM to overtake financial ETFs as the second largest sub-category. The positive growth of resources ETFs contrasts with the negative returns and FUM outflows of financial sector ETFs. The returns for property ETFs flatlined and despite overall positive FUM inflows, they declined fromm 89% to 82% of this group’s total FUM.
These 3 sectors already account for a significant portion of the general Australian share market. The holdings of the SPDR ASX200 ETF (STW) are ~33% financials, ~18% materials and ~7% property trusts. An additional point to note is that these sectors have concentrated holdings, with the largest few stocks accounting for over half the index.
• Financials: The ‘big four’ banks typically represent around 70% of the S&P/ASX 200 Financials ex A-REIT Index.
• Property: The largest 5 REITs make up nearly 62% of the S&P/ASX200 Property Index, with Scentre Group, Westfield Corp, Goodman Group, Stockland and Dexus dominating this index.
• Resources: BHP, Rio Tinto, Woodside Petroleum make up approximately 49% of the S&P/ASX200 Resources Index, with BHP alone still contributing around 30% of this index.
For this reason we prefer to invest globally for sector diversification and to reduce the concentration towards Australian resource and financial stocks.
STOCKSPOT CHOSEN ETFSStockspot Themes include Vanguard Australian Property Securities Index ETF (VAP) for investors who want more direct exposure to property. It remains the largest, most liquid and lowest fee sector ETF as well as the sector with the lowest representation within the overall Australian market.
www.stockspot.com.au | [email protected] 43

Global SharesETF Sectors
This group of ETFs cover global markets and share indices across various regions and countries. This includes the USA, Europe, Asia, Japan, Hong Kong, China, Taiwan and South Korea.
ASX code
ETF Name Issuer MER (p.a)
2018
FUM ($M)
Mar'17
FUM ($M)
Mar'18
Change in FUM
($M)
Traded value in Mar'18
% Spread Historical Distribution
Yield
1 Year Total
Return
Multiple market
IOO iShares S&P Global 100 ETF
iShares 0.40% 1,121 1,333 211 37,482,477 0.13% 1.9% 12.1%
IHOO iShares Global 100 AUD Hedged ETF
iShares 0.43% 28 35 7 1,867,421 0.43% 11.7% 8.5%
IHWL iShares Core MSCI World All Cap AUD Hedged ETF
iShares 0.19% 4 11 8 462,012 0.49% 1.1% 8.7%
IWLD iShares Core MSCI World All Cap ETF
iShares 0.16% 6 23 17 1,249,061 0.46% 1.5% 12.1%
IVE iShares MSCI EAFE ETF iShares 0.33% 247 316 69 19,260,867 0.18% 2.2% 13.1%
VEU Vanguard All-World ex US Shares Index ETF
Vanguard 0.11% 771 1,177 406 48,679336 0.14% 2.3% 14.1%
VGAD Vanguard MSCI Index International Shares (Hedged) ETF
Vanguard 0.21% 203 386 183 30,301,228 0.10% 5.1% 9.0%
VGS Vanguard MSCI Index International Shares ETF
Vanguard 0.18% 414 941 527 64,115,898 0.07% 2.7% 12.6%
WXHG SPDR S&P World ex Australian (Hedged) Fund
SPDR 0.35% 74 79 4 2,862,156 0.23% 2.9% 10.1%
WXOZ SPDR S&P World ex Australian Fund
SPDR 0.30% 147 167 20 2,049,873 0.18% 2.2% 13.0%
Averages 0.27% 0.24% 3.4% 11.3%
Totals 3,015 4,466 1,451 208,330,329
Source: ASX
Multiple market
The Vanguard All-World ex US Shares Index ETF (VEU) had the best performance amongst ETFs that cover multiple markets with a 14.1% return. The lowest returns were 8.5% from the iShares Global 100 AUD Hedged ETF (IHOO), indicating that the Australian Dollar declined in value against overseas currencies. With an average return of 11.3%, global ETFs performed better than all sub-categories except for emerging market and Asian ETFs.
Multiple market ETFs received 32% of the group’s total FUM to overtake US share ETFs as the largest sub-group. The Vanguard MSCI Index International Shares ETF (VGS) attracted positive inflows each month to achieve the largest overall increase in FUM of $527 million. The second highest overall increase in FUM came from Vanguard All-World ex US Shares Index ETF (VEU) with $406 million. All global ETFs had positive inflows, with the SPDR S&P World ex Australia (Hedged) Fund (WXHG) having the lowest increase in FUM of $4 million.
44 Australian ETF Report - 2018

Global SharesETF Sectors
ASX code
ETF Name Issuer MER (p.a)
2018
FUM ($M)
Mar'17
FUM ($M)
Mar'18
Change in FUM
($M)
Traded value in Mar'18
% Spread Historical Distribution
Yield
1 Year Total
Return
US Shares
IHVV iShares S&P 500 AUD Hedged ETF
iShares 0.10% 108 109 1 6,525,045 0.15% 1.8% 11.4%
IVV iShares S&P 500 ETF iShares 0.04% 2,143 2,490 347 102,994,518 0.08% 1.6% 11.7%
SPY SPDR S&P 500 ETF Trust
SPDR 0.09% 19 19 0.056 1,283,595 0.31% 1.6% 11.9%
IJH iShares S&P Midcap ETF iShares 0.07% 115 141 26 18,252,044 0.23% 1.1% 9.2%
IJR iShares S&P Small-Cap ETF
iShares 0.07% 77 110 32 6,569,370 0.37% 1.0% 10.6%
IRU iShares Russell 2000 ETF
iShares 0.20% 60 74 14 5,115,942 0.36% 1.0% 10.8%
VTS Vanguard US Total Market Shares Index ETF
Vanguard 0.04% 958 1,207 249 47,715,713 0.11% 1.5% 11.7%
NDQ BetaShares NASDAQ 100 ETF
BetaShares 0.48% 88 262 175 43,430,979 0.12% 0.4% 19.4%
Averages 0.14% 0.22% 1.2% 12.1%
Totals 3,568 4,412 844 231,887,206
Source: ASX
US Shares
US shares were supported by strong growth from the technology sector. BetaShares’ NASDAQ 100 ETF (NDQ) was the top performer with a return of 19.4%. The iShares S&P Midcap ETF (IJH) focusing on medium-sized companies had the lowest returns of 9.2%. Interestingly small and mid cap shares underperformed the large tech shares in the US. The opposite has been true in Australia with small and mid size companies beating the large banks.
US share ETFs all had positive inflows, although the lowest increase in FUM was just $0.06 million for the SPDR S&P 500 ETF Trust (SPY). Its competitor and lower fee option, the iShares S&P 500 ETF
(IVV), had the greatest increase in FUM with $347 million. US share ETFs had the highest total increase in FUM with $844 million, but fell behind global ETFs’ $1,451 million inflow.
www.stockspot.com.au | [email protected] 45

Global SharesETF Sectors
ASX code
ETF Name Issuer MER (p.a)
2018
FUM ($M)
Mar'17
FUM ($M)
Mar'18
Change in FUM
($M)
Traded value in Mar'18
% Spread Historical Distribution
Yield
1 Year Total
Return
Asian Shares
IAA iShares S&P Asia 50 ETF iShares 0.50% 258 423 165 20,651,449 0.43% 1.2% 29.1%
VAE Vanguard FTSE Asia Ex-Japan Shares Index ETF
Vanguard 0.40% 26 71 45 11,844,200 0.39% 2.8% 21.4%
IHK iShares MSCI Hong Kong ETF
iShares 0.48% 13 15 2 1,168,668 1.08% 3.7% 15.7%
IKO iShares MSCI South Korea Capped Index ETF
iShares 0.64% 36 41 5 1,519,511 0.77% 2.4% 21.4%
ISG iShares MSCI Singapore ETF
iShares 0.48% 8 6 -2 280,364 0.86% 2.8% 18.1%
ITW iShares MSCI Taiwan ETF
iShares 0.64% 63 47 -16 721,027 1.04% 2.2% 15.7%
CETF VanEck Vectors China AMC A-Share ETF
VanEck Vectors
0.72% 2 10 7 1,035,809 0.41% 0.9% 20.1%
IZZ iShares FTSE China Large-Cap ETF
iShares 0.74% 67 99 32 11,171,206 0.42% 1.9% 22.1%
HUPN BetShares WisdomTree Japan ETF - Currency Hedged
BetaShares 0.58% 25 70 45 11,671,718 0.22% 2.3% 9.3%
IJP iShares MSCI Japan ETF iShares 0.48% 169 238 69 21,750,735 0.22% 1.0% 16.2%
Averages 0.57% 0.58% 2.1% 18.9%
Totals 667 1,019 352 81,814,688
Source: ASX
Asian Shares
Asian share ETFs had the second highest average returns with 18.9%. The iShares S&P Asia 50 ETF (IAA) was the second best performer amongst all ETFs with a 29.1% return. Large companies in Asia had great returns, with regional ETFs providing better returns than any specific national market. They were buoyed by high returns and large exposures to China and South Korea, with technology giants Tencent and Samsung leading the way. The decline of the Australian Dollar versus the Yen negatively impacted the BetaShares
WisdomTree Japan ETF - Currency Hedged (HJPN), which had the lowest return of 9.3%.
The top performer, the iShares S&P Asia 50 ETF (IAA) saw the greatest increase in FUM with $165 million for Asian share ETFs. Despite a positive return of 9.3%, the iShares MSCI Taiwan ETF (ITW) decreased FUM by $16 million. Together with the iShares MSCI Singapore ETF (ISG)’s outflow of $2 million, these were two of only four ETFs to have declines in FUM from this group.
46 Australian ETF Report - 2018

Global SharesETF Sectors
ASX code
ETF Name Issuer MER (p.a)
2018
FUM ($M)
Mar'17
FUM ($M)
Mar'18
Change in FUM
($M)
Traded value in Mar'18
% Spread Historical Distribution
Yield
1 Year Total
Return
European Shares
ESTX ETFS EURO STOXX 50 ETF
ETF Securities
0.35% 3 68 65 15,220,798 0.13% 1.2% 13.4%
HEUR BetaShares WisdomTree Europe ETF - Currency Hedged
BetaShares 0.58% 18 50 32 7,441,487 0.20% 1.5% 1.5%
IEU iShares S&P Europe ETF iShares 0.60% 522 807 285 38,527,821 0.12% 2.1% 13.3%
VEQ Vanguard FTSE Europe Shares ETF
Vanguard 0.35% 64 163 98 11,364,422 0.31% 2.1% 14.9%
Averages 0.47% 0.19% 1.7% 10.8%
Totals 608 1,088 480 72,554,528
Source: ASX
European Shares
European shares rebounded after a period of sluggish growth with average returns of 10.8%, ahead of US share ETF average returns. With the top performer, the Vanguard FTSE Europe Shares ETF (VEQ) returning 14.9% and the only hedged option, the BetaShares WisdomTree Europe ETF - Currency Hedged (HEUR) being the worst performer with a 1.5% return. The unhedged ETFs benefited from the Euro’s gain in value against the Australian Dollar. European shares remains a stable option for investors wanting to diversify from the Australian economy’s higher and more direct exposure to Asia as well as the dominance of US shares in global ETFs.
European share ETFs had the second highest growth rate of FUM with 79%, behind multi-asset ETFs. The iShares S&P Europe ETF (IEU) increased FUM by $285 million with the highest inflows. Even the worst performer, the BetaShares WisdomTree Europe ETF - Currency Hedged (HEUR), managed to attract $32 million in FUM – the lowest increase in FUM for European share ETFs.
www.stockspot.com.au | [email protected] 47

Global SharesETF Sectors
ASX code
ETF Name Issuer MER (p.a)
2018
FUM ($M)
Mar'17
FUM ($M)
Mar'18
Change in FUM
($M)
Traded value in Mar'18
% Spread Historical Distribution
Yield
1 Year Total
Return
Emerging Market Shares
IBK iShares MSCI BRIC ETF iShares 0.72% 26 39 13 1,724,316 0.93% 1.2% 27.0%
IEM iShares MSCI Emerging Markets ETF
iShares 0.69% 435 666 231 38,569,860 0.20% 1.6% 21.4%
VGE Vanguard FTSE Emerging Markets Shares ETF
Vanguard 0.48% 80 209 129 17,467,707 0.27% 1.6% 17.4%
WEMG SPDR S&P Emerging Markets Fund
iShares 0.65% 13 21 8 3,702,359 0.25% 1.3% 21.8%
Averages 0.64% 0.41% 1.4% 21.9%
Totals 553 935 382 61,464,242
Source: ASX
Emerging Market Shares
Emerging market shares had an outstanding year with some of the highest overall returns, as well as the top average of 21.9% amongst all sub-groups. They benefited from growth in China and other major economies such as Brazil and Russia were helped by recovering oil prices as shown by the top performance of the iShares’ BRIC ETF (IBK)’s 27% return. The worst performer, the Vanguard FTSE Emerging Markets Shares ETF (VGE) still had a relatively high return of 17.4%. These performances helped market-cap based ETFs achieve an average return of 14.7%, above the group’s average of 12.8% and ahead of rules-based ETFs’ average return of 12.4%.
All emerging market ETFs had positive inflows. The highest increase in FUM was $231 million for the iShares MSCI Emerging Markets ETF (IEM), although its proportion of the sub-group’s FUM declined from 79% to 71%. Whilst the SPDR S&P Emerging Markets Fund (WEMG) had the lowest increase in FUM of $8 million.
48 Australian ETF Report - 2018

Global SharesETF Sectors
ASX code
ETF Name Issuer MER (p.a)
2018
FUM ($M)
Mar'17
FUM ($M)
Mar'18
Change in FUM
($M)
Traded value in Mar'18
% Spread Historical Distribution
Yield
1 Year Total
Return
Rules-based ETFs
QUS BetaShares FTSE RAFI US 1000 ETF
BetaShares 0.40% 24 38 14 2,488,475 0.14% 2.2% 7.6%
UBP UBS IQ MSCI Asia APEX 50 Ethical ETF
UBS 0.45% 1 9 8 568,515 0.37% 0.3% 30.1%
UBE UBS IQ MSCI Europe Ethical ETF
UBS 0.40% 7 11 4 365,764 0.35% 2.4% 12.5%
UBU UBS IQ MSCI USA Ethical ETF
UBS 0.20% 6 6 1 231,918 0.20% 1.9% 16.7%
UBW UBS IQ MSCI World ex Australia Ethical ETF
UBS 0.35% 19 27 8 664,733 0.24% 1.8% 12.3%
ESGI VanEck Vectors MSCI International Sustainability Equity ETF
VanEck Vectors
0.55% 0 4 4 2,343,900 0.34% 0.0% n/a
MOAT VanEck Vectors Morningstar Wide Moat ETF
VanEck Vectors
0.49% 34 53 19 1,733,727 0.36% 0.9% 9.7%
QMIX SPDR MSCI World Quality Mix Fund
SPDR 0.40% 6 8 2 370,007 0.28% 2.3% 11.2%
QUAL VanEck Vectors MSCI World Ex-Australia Quality ETF
VanEck Vectors
0.40% 184 340 156 29,156,427 0.13% 2.9% 13.9%
WDIV SPDR S&P Global Dividend Fund
SPDR 0.50% 115 169 54 13,306,876 0.23% 4.0% 9.6%
WDMF iShares Edge MSCI World Multifactor ETF
iShares 0.35% 12 29 17 1,724,630 0.41% 4.4% 20.1%
WVOL iShares Edge MSCI World Minimum Volatility ETF
iShares 0.30% 12 10 -2 240,925 0.74% 2.6% 6.3%
UBJ UBS IQ MSCI Japan Ethical ETF
UBS 0.40% 3 5 1 137,017 0.23% 1.4% 12.0%
ZYUS ETFS S&P 500 High Yield Low Volatility ETF
ETF Securities
0.35% 43 50 7 4,899,791 0.22% 6.0% -1.0%
Averages 0.40% 0.30% 2.4% 12.4%
Totals 466 758 292 58,232,705
Source: ASX
www.stockspot.com.au | [email protected] 49

Global SharesETF Sectors
Rules-based ETFs
As rules-based ETFs cover a variety of strategies, regions and countries, the results are more diverse. This includes the top performing overall ETF, the UBS IQ MSCI Asia APEX 50 Ethical ETF (UBA) with a 30.1% return. This ETFs screens out companies involved with tobacco and controversial weapons, although forty of the fifty companies are same as those in iShares S&P Asia 50 ETF (IAA). The worst performer, the ETFS S&P 500 High Yield Low Volatility ETF (ZYUS) had a negative return of -1%. Its strategy of investing in fifty high-yielding US companies underperformed average returns for US share ETFs.
Amongst rules-based ETFs, the largest increase in FUM of $156 million went to the VanEck Vectors MSCI World Ex-Australia Quality ETF (QUAL). It attracted 53% of the total FUM increase for rules-based ETFs and had the largest inflow by over $100 million ahead of the $54 million of the SPDR S&P Global Dividend Fund (WDIV). The iShares Edge MSCI World Minimum Volatility ETF (WVOL)’s decrease of FUM by $2 million was the only negative growth in this group.
50 Australian ETF Report - 2018

Global SharesETF Sectors
ASX code
ETF Name Issuer MER (p.a)
2018
FUM ($M)
Mar'17
FUM ($M)
Mar'18
Change in FUM
($M)
Traded value in Mar'18
% Spread Historical Distribution
Yield
1 Year Total
Return
Active ETFs
BBUS BetaShares US Equities Strong Bear Currency Hedged (Hedge Fund)
BetaShares 1.38% 53 67 13 46,015,090 0.27% 0.0% -25.2%
UMAX BetaShares S&P 500 Yield Maximiser Fund (Managed Fund)
BetaShares 0.79% 87 90 3 4,169,227 0.19% 4.4% 5.8%
GGUS BetaShares Geared US Equity Fund Currency Hedged (Hedge Fund)
BetaShares 0.80% 7 17 10 15,344,298 0.14% 0.7% 17.9%
KII K2 Global Equities Fund (Hedge Fund)
K2 2.05% 33 18 -15 942,416 1.32% 0.0% 12.8%
MGE Magellan Global Equities Fund (Managed Fund)
Magellan 1.35% 768 989 220 32,944,715 0.40% 1.7% 11.9%
MHG Magellan Global Equities Fund Currency Hedged (Managed Fund)
Magellan 1.35% 46 64 18 1,582,784 0.54% 1.7% 10.9%
MOGL Montgomery Global Equities Fund (Managed Fund)
Montgom-ery Investment Manage-ment
1.32% 0 72 72 5,708,440 0.44% 0.0% n/a
PIXX Platinum International Fund (Quoted Managed Hedge Fund)
Platinum 1.10% 0 185 185 23,480,231 0.33% 0.0% n/a
PAXX Platinum Asia Fund (Quoted Managed Hedge Fund)
Platinum 1.10% 0 90 90 7,988,536 0.50% 0.0% n/a
WRLD BetaShares Managed Risk Global Share Fund (Managed Fund)
BetaShares 0.54% 27 30 3 685,621 0.26% 1.0% 10.2%
Averages 1.18% 0.44% 0.9% 6.3%
Totals 1,022 1,621 599 138,861,359
Source: ASX
www.stockspot.com.au | [email protected] 51

Global SharesETF Sectors
Active ETFs
Active ETFs had the greatest variance in returns, including some leveraged funds, which impacted their average return of only 6.3%. The top performer, the BetaShares Geared US Equity Fund Currency Hedged (Hedge Fund) (GGUS) returned 17.9% as it uses leverage to magnify returns from the US share market. The ETF that inverts this strategy to magnify the inverse of US share returns was the worst performer at -25.2%.
Amongst non-leveraged ETFs, the Magellan Global Equities Fund (Managed Fund) (MGE)’s return 11.9% was the top performer but still undershot similar indexed ETFs, and the BetaShares S&P 500 Yield Maximiser Fund (Managed Fund) (UMAX) was the worst performer with a 5.8% return.
An increase of FUM by $220 million for the popular Magellan Global Equities Fund (Managed Fund) (MGE) was the highest for active ETFs. The launch of Platinum International Fund (Quoted Managed Hedge Fund) (PIXX) by Magellan’s traditional fund manager competitor, Platinum had the second highest inflows of $185 million. The only decline in FUM was by K2 Global Equities Fund (Hedge Fund) with a $15 million decrease.
52 Australian ETF Report - 2018

Global SharesETF Sectors
ASX code
ETF Name Issuer MER (p.a)
2018
FUM ($M)
Mar'17
FUM ($M)
Mar'18
Change in FUM
($M)
Traded value in Mar'18
% Spread Historical Distribution
Yield
1 Year Total
Return
Multiple Asset ETFs
GROW Schroder Real Return Fund (Managed Fund)
Schroder 0.90% 28 46 17 1,975,490 0.55% 2.6% 3.2%
DMKT AMP Capital Dynamic Markets Fund (Hedge Fund)
AMP 0.50% 15 27 12 1,305,826 0.69% 5.0% 2.2%
VDCO Vanguard Diversified Conservative Index ETF
Vanguard 0.27% 0 4 4 2,425,682 0.19% 0.6% n/a
VDBA Vanguard Diversified Balanced Index ETF
Vanguard 0.27% 0 11 11 3,856,143 0.24% 0.6% n/a
VDGR Vanguard Diversified Growth Index ETF
Vanguard 0.27% 0 19 19 5,095,096 0.18% 0.8% n/a
VDHG Vanguard Diversified High Growth Index ETF
Vanguard 0.27% 0 44 44 15,056,409 0.16% 1.0% n/a
Averages 0.41% 0.33% 1.8% 2.7%
Totals 43 151 108 29,714,646
Source: ASX
Multiple Asset ETFs
Only two multi-asset ETFs have annual returns so far, the Schroder Real Return Fund (Managed Fund) (GROW) with 3.2% and the AMP Capital Dynamic Markets Fund (Hedge Fund) (DMKT) with 2.2%, to give an unimpressive return of 2.7% for this sub-group. These two active funds significantly underperformed their benchmarks of CPI +4.5% to 5% and other mixed-asset funds that share a similar growth target.
Multi-asset ETFs grew rapidly from a small base with four new ETFs. The Vanguard Diversified High Growth Index ETF (VDHG) had the greatest inflows with $44 million, whilst the Vanguard Diversified Conservative Index ETF (VDCO) only attracted $4 million.
www.stockspot.com.au | [email protected] 53

Global SharesETF Sectors
ASX code
ETF Name Issuer MER (p.a)
2018
FUM ($M)
Mar'17
FUM ($M)
Mar'18
Change in FUM
($M)
Traded value in Mar'18
% Spread Historical Distribution
Yield
1 Year Total
Return
Overall
Averages 0.51% 0.35% 2.0% 12.8%
Totals 9,943 14,451 4,508 882,859703
Source: ASX
AVERAGE RETURNS
Global shares had the highest average return of all groups with 12.8%. This group had the third fastest rate of FUM growth of 45% after global share sector ETFs and fixed income ETFs. With the greatest amount of FUM growth, more than double that of the next group, it managed to overtake Australian share ETFs to become the largest overall group of ETFs.
As was the trend with Australian share ETFs, active global ETFs underperformed the global indexed ETFs. Even the well-loved Magellan Global Equities Fund (MGE) at 11.9% underperformed equivalent global unhedged ETFs which typically returned 12-13%.
54 Australian ETF Report - 2018

Global SharesETF Sectors
NEW FUNDS
There are eight new ETFs in this group, but no new market-cap based ETFs.
The only new rules-based option is the VanEck Vectors MSCI International Sustainable Equity ETF (ESGI), which provides an international option that screens companies for economic, social and governance factors.
Three new active ETFs came from traditional fund managers. Montgomery Investment Management listed the Montgomery Global Equities Fund (Managed Fund) (MOGL) and Platinum quoted two managed hedge funds. This includes Platinum International Fund (Quoted Managed Hedge Fund) (PIXX) and Platinum Asia Fund (Quoted Managed Hedge Fund) (PAXX) as the first active ETFs focusing on Asia.
Vanguard launched four multi-asset products, that piggyback existing unlisted funds. This includes the Vanguard Diversified High Growth Index ETF (VDHG), Vanguard Diversified Growth Index ETF (VDGR), Vanguard Diversified Balanced Index ETF (VDBA) and Vanguard Diversified Conservative Index ETF (VDCO) that have various proportions of defensive and growth assets.
OVERALL TRENDS
Global share ETFs had an outstanding year in terms of returns and FUM increases to overtake Australian shares and become the largest sector. In particular, they benefited from high exposures to the high growth technology sector, with giants Tencent and Samsung leading the way in Asia, as well as the major US companies. US share ETFs have exposure to major companies like Google, Amazon and Facebook – which are now also some of the largest companies in the world by market capitalisation.
Emerging market ETFs also had a stellar year, benefiting from high growth in China in particular. They have the potential for higher growth rates than established economies such as the USA and Europe, but are generally considered to be a riskier investment. Investors also need to consider the tendency of stocks to return to long-term averages. For example, the US sharemarket reached record highs in January of this year, but recent volatility has impacted its annual returns to be lower on average than other regions.
Most global shares ETFs include Australian shares as part of their overall holdings and those excluding them generally have ‘ex-Australia’ in the name. The fact that Australian shares only represent around 1.7% of the world’s total share market value highlights the need for global shares in a diversified portfolio3.
The currency hedged versions of global ETFs also had slightly lower returns, indicating that the Australian Dollar declined in value against other currencies over the year, especially the Euro and Japanese Yen. However, global ETFs often have a large exposure to US shares and little change in exchange rate with the US Dollar means that the overall impact of currency movements was limited.
3 From MoneySmart: The Australian share market has total market capitalisation of $1.9 trillion (as at January 2018)
www.stockspot.com.au | [email protected] 55

Global SharesETF Sectors
STOCKSPOT CHOSEN ETFS
iShares S&P Global 100 ETF (IOO) and iShares MSCI Emerging Markets ETF (IEM) are our current Stockspot portfolio inclusions from this asset group. Both have performed well compared to similar indexed and active products.
Stockspot Themes also include the options of iShares S&P 500 ETF (IVV), iShares S&P Europe ETF (IEU), iShares S&P Asia 50 ETF (IAA), iShares FTSE China Large-Cap ETF (IZZ), iShares MSCI Japan ETF (IJP) and Vanguard All-World ex US Shares Index ETF (VEU) for investors wanting to add country specific exposures to their portfolios.
The BetaShares’ NASDAQ 100 ETF (NDQ) will be offered as an additional theme to provide exposure to the high growth technology sector which is only a small part of the Australian sharemarket.
Overall iShares’ dominance of this category declined from 56% to 49% of total FUM, whilst Vanguard grew from 25% to 29% with a greater amount of FUM growth. iShares also maintains the highest number of products with twenty-two ETFs, including the many single market products. Even with four new launches, Vanguard only has eleven ETFs and generally has more broad, regional focused ETFs.
56 Australian ETF Report - 2018

Global SharesETF Sectors
GLOBAL SHARE ETFS BY ISSUER
iShares Vanguard SPDR Other Issuers
US shares • IVV Large cap (0.04%)• IHVV Large cap hedged
(0.10%)• IJH Mid-cap (0.07%)• IJR Small-cap (0.07%)• IRU (0.20%)
• VTS (0.04%) • SPY (0.09%) • MOAT Strategy (0.49%)• NDQ Technology
(0.48%)• QUS - Large cap
(0.40%) • UBU - Large/mid ethical
(0.20%)• UMAX Yield max
(0.79%) • ZYUS Large cap,
volatility (0.35%)• BBUS Bear fund,
hedged (1.38%)• GGUS Hedged, geared
(0.80%)
Regional market
• IEU Europe (0.60%)• IAA Asia (0.50%)
• VEQ Europe (0.35%)• VAE Asia ex-Japan
(0.40%)
• ESTX Europe (0.35%)• HEUR Europe (0.58%) • UBE Europe (0.40%)• UBP Asia ex- Japan
(0.45%)• PAXX Asia (1.10%)
Developed markets
• IOO (0.40%)• IHOO Hedged (0.43%)• IVE ex-US (0.33%)• IHWL Hedged (0.19%)• IWLD (0.16%)• WDMF Multifactor
(0.35%)• WVOL Volatility (0.30%)
• VEU ex-US (0.11%)• VGS (0.18%)• VGAD - hedged (0.21%)
• WXHG ex- Australia (0.35%)
• WXOZ hedged, ex-Australia (0.30%)
• WDIV (0.50%)• QMIX (0.40%)
• QUAL ex-Australia (0.40%)
• UBW ex-Australia (0.35%)
• WRLD Risk (0.54%) • KII (2.05%) • MGE (1.35%) • MHG Hedged (1.35%)• PIXX (1.10%)• DMKT (0.50%)• GROW (0.90%)• ESGI ethical ex-
Australia (0.55%)
Emerging markets
• IEM (0.69%)• IBK BRIC countries
(0.72%)
• VGE (0.48%) • WEMG (0.65%)
Individual market (non US)
• IJP Japan (0.48%)• IHK Hong Kong (0.48%)• ISG Singapore (0.48%)• ITW Taiwan (0.64%)• IKO South Korea
(0.64%)• IZZ China (0.72%)
• CETF China (0.72%) • HJPN Japan (0.58%) • UBJ Japan (0.40%)
Source: ASX
www.stockspot.com.au | [email protected] 57

Global Shares (Sectors)ETF Sectors
These ETFs cover specific sectors of the sharemarket across the globe. The new ETFs focusing on technology and infrastructure provide new options for investors to gain access to market sectors that are underrepresented within the Australian indices.
ASX code
ETF Name Issuer MER (p.a)
2018
FUM ($M)
Mar'17
FUM ($M)
Mar'18
Change in FUM
($M)
Traded value in Mar'18
% Spread Historical Distribution
Yield
1 Year Total
Return
Market-cap Based ETFs
ROBO ETFS ROBO Global Robotics and Automation ETF
ETF Securities
0.69% 0 76 76 10,315,052 0.34% 0.0% n/a
TECH ETFS Morningstar Global Technology ETF
ETF Securities
0.45% 0 44 44 12,552,028 0.27% 0.8% n/a
HACK BetaShares Global Cybersecurity ETF
BetaShares 0.67% 12 65 52 7,486,202 0.28% 2.3% 13.3%
IXP iShares S&P Global Telecommunications ETF
iShares 0.47% 19 47 28 1,553,884 0.60% 3.0% -2.0%
IXI iShares S&P Global Consumer Staples ETF
iShares 0.47% 146 108 -37 5,699,089 0.36% 1.9% 1.8%
DRUG BetaShares Global Healthcare ETF - Currency Hedged
BetaShares 0.57% 15 21 6 1,851,547 0.36% 0.3% 6.4%
IXJ iShares S&P Global Healthcare ETF
iShares 0.47% 433 482 49 19,088,231 0.34% 1.2% 8.5%
BNKS BetaShares Global Banks ETF - Currency Hedged
BetaShares 0.57% 31 75 44 21,361,105 0.28% 2.1% 9.8%
FOOD BetaShares Global Agriculture Companies ETF
BetaShares 0.57% 5 17 12 2,858,547 0.38% 1.1% 7.1%
FUEL BetaShares Global Energy Companies ETF - Currency Hedged
BetaShares 0.57% 6 16 10 2,504,571 0.33% 3.9% 2.5%
GDX VanEck Vectors Gold Miners ETF
VanEck Vectors
0.53% 55 67 13 5,973,820 0.33% 0.7% -3.4%
MNRS BetaShares Global Gold Miners ETF - Currency Hedged
BetaShares 0.57% 8 5 -3 1,006,836 0.66% 0.5% -10.4%
IFRA VanEck Vectors FTSE Global Infrastructure (Hedged) ETF
VanEck Vectors
0.52% 23 71 48 5,420,053 0.24% 4.0% 1.2%
CORE ETFS Global Core Infrastructure ETF
ETF Securities
0.45% 0 3 3 178,869 0.65% 0.6% n/a
DJRE SPDR Dow Jones Global Select Real Estate Fund
SPDR 0.50% 119 204 86 12,637,447 0.20% 3.6% 1.1%
Averages 0.54% 0.37% 1.7% 3.0%
Totals 871 1,303 431 110,487,281
58 Australian ETF Report - 2018

Global Shares (Sectors)ETF Sectors
ASX code
ETF Name Issuer MER (p.a)
2018
FUM ($M)
Mar'17
FUM ($M)
Mar'18
Change in FUM
($M)
Traded value in Mar'18
% Spread Historical Distribution
Yield
1 Year Total
Return
Rules-based ETFs
ETHI BetaShares Global Sustainability Leaders ETF
BetaShares 0.59% 41 169 128 30,355,389 0.23% 1.3% 16.8%
Active ETFs
GLIN AMP Capital Global Infrastructure Securities Fund (Unhedged) (Managed Fund)
AMP 0.85% 20 22 2 593,589 0.79% 2.3% -0.6%
MICH Magellan Infrastructure Fund (Currency Hedged) (Managed Fund)
Magellan 1.05% 59 159 100 7,172,702 0.47% 2.8% 6.0%
RENT AMP Capital Global Property Securities Fund (Unhedged) (Managed Fund)
BetaShares 0.99% 14 13 -1 554,780 0.87% 1.5% 3.3%
Averages 0.96% 0.71% 2.2% 2.9%
Totals 93 194 101 8,321,071
Overall
Averages 0.61% 0.42% 1.8% 3.8%
Total 1,005 1,666 660 149,163,741
Source: ASX
www.stockspot.com.au | [email protected] 59

Global Shares (Sectors)ETF Sectors
AVERAGE RETURNSThe average returns of 3.8% for global sector ETFs was the fourth highest, ahead of Australian shares, Australian sector and fixed income ETFs. It had the highest growth of FUM at 66% and the $660 million increase in FUM was the fourth largest amount across all groups.
BEST AND WORST PERFORMERSAs sector ETFs focus on specific industries, a wide range of returns from 17% to -10% is not surprising.
The BetaShares Global Cybersecurity ETF (HACK) was the top performer amongst market-cap ETFs with a 13.3% return. The second highest return of 9.8% came from the BetaShares Global Banks ETF - Currency Hedged (BNKS), which contrasts with the negative returns of Australian financial sector ETFs.
The defensive value of gold did not extend to goldminers, as the BetaShares Global Gold Miners ETF - Currency Hedged (MNRS) was the worst performer with -10.4%. Its competitor, the VanEck Vectors Gold Miners ETF (GDX) had the second lowest return with -3.4%.
The only rules-based ETF, which screens for 100 large companies that are climate change leaders, the BetaShares Global Sustainability Leaders ETF had the highest overall returns of the group at 16.8%. The Magellan Infrastructure Fund (Currency Hedged) (Managed Fund) (MICH) was the best performing active infrastructure focused ETF with a 6% return. The AMP Capital Global Infrastructure Securities Fund (Unhedged) (Managed Fund) (GLIN) , its competitor, had the worst return amongst active ETFs with -0.6%.
FUND INFLOWS AND OUTFLOWSThe top performer BetaShares Global Sustainability Leaders ETF (ETHI) gained largest amount of funds at $128 million, which was 19% of all FUM increase in this category.
For market-cap based ETFs, the SPDR Dow Jones Global Select Real Estate Fund (DJRE) had the greatest increase in FUM with $28 million. BetaShares Global Cybersecurity ETF (HACK) had the second highest inflows and quadrupled its funds from $12 million to $65 million in one year. The largest decrease in FUM was the iShares S&P Global Consumer Staples ETF (IXI)’s decreased of $37 million. The worst performer, BetaShares Global Gold Miners ETF - Currency Hedged (MNRS) saw the second worst FUM growth with $3 million decline.
The AMP Capital Global Property Securities Fund (Unhedged) (Managed Fund) (RENT) was the only active ETF with a decline in FUM, decreasing its total by $1 million. There were only three ETFs with negative FUM growth in this group. The top performer, Magellan Infrastructure Fund (Currency Hedged) (Managed Fund) (MICH) saw FUM growth by $100 million, indicating the defensive value of this sector is attractive to investors.
NEW FUNDSAll three new products were market-cap based ETFs issued by ETF Securities. They added a fourth option for infrastructure, ETFS Global Core Infrastructure ETF (CORE), with the lowest fees at 0.45% that tracks a low volatility index.
They also launched two ETFs focused on technology, ETFS Morningstar Global Technology ETF (TECH) tracking the Morningstar® Developed Markets Technology Moat Focus Index mainly containing companies in the USA and ETFS ROBO Global Robotics and Automation ETF (ROBO) covering robotics, automation and artificial intelligence related companies. Expanding into technology and related areas follows the success of the BetaShares Global Cybersecurity ETF (HACK).
60 Australian ETF Report - 2018

OVERALL TRENDSThis group had quite diverse returns as it covers a variety of sectors. Technology and ethical investment options have enjoyed recent popularity with investors due to high recent returns. Sectors such as infrastructure, telecommunications and some property ETFs are more defensive, paying regular income to investors. This sector has relatively high fees compared to general global ETFs, but provides the average Australian investor with easy access to global sectors.
iShares’ dominance of this category decreased as its proportion of FUM declined from 59% to 38%, whilst BetaShares increased its proportion of FUM from 13% to almost 23% with its large number of products in this group.
STOCKSPOT CHOSEN ETFSThe SPDR Dow Jones Global Select Real Estate Fund (DJRE) is currently offered as a Stockspot Theme for exposure to global property. It is the only index ETF that provides exposure to global property, has FUM over $200 million and high liquidity.
Four additional sector ETFs will be offered that provide exposure to small or underweight sectors of the Australian sharemarket, they include:
• The VanEck Vectors Gold Miners ETF (GDX)
• The VanEck Vectors FTSE Global Infrastructure (Hedged) ETF (IFRA)
• The iShares S&P Global Consumer Staples ETF (IXI)
• The iShares S&P Global Healthcare ETF (IXJ)
Global Shares (Sectors)ETF Sectors
www.stockspot.com.au | [email protected] 61

Fixed Income & CashETF Sectors
This group offers exposure to fixed income and cash products from Australia and overseas. They are an important building block of a balanced investment portfolio, providing a cushion against the volatility of share market ETFs.
ASX code
ETF Name Issuer MER (p.a)
2018
FUM ($M)
Mar'17
FUM ($M)
Mar'18
Change in FUM
($M)
Traded value in Mar'18
% Spread Historical Distribution
Yield
1 Year Total
Return
Cash
AAA BetaShares Australian High Interest Cash ETF
BetaShares 0.18% 1156 1234 78 229,008,491 0.02% 2.0% 2.0%
BILL iShares Core Cash ETF iShares 0.07% 0 170 170 6,394,475 0.01% 1.2% n/a
MONY UBS IQ Cash ETF UBS 0.18% 0 1 1 5,000 0.10% 1.4% n/a
ISEC iShares Enhanced Cash ETF
iShares 0.12% 0 25 25 2,734,705 0.01% 1.4% n/a
Averages 0.14% 0.03% 1.5% 2.0%
Totals 1,156 1,430 274 238,142,671
Fixed Rate Bonds
IGB iShares Treasury ETF iShares 0.26% 30 26 -4 7,682,143 0.15% 2.6% 2.8%
ILB iShares Government Inflation ETF
iShares 0.26% 86 109 24 14,588,101 0.32% 0.9% 3.4%
IAF iShares Core Composite Bond ETF
iShares 0.20% 386 529 143 23,529,166 0.06% 2.3% 3.2%
RGB Russell Australian Government Bond ETF
Russell 0.24% 58 60 2 411,722 0.28% 2.8% 1.9%
VGB Vanguard Australian Government Bond Index ETF
Vanguard 0.20% 135 137 3 12,104,609 0.14% 2.9% 3.1%
BOND SPDR S&P/ASX Australian Bond Fund
SPDR 0.24% 28 23 -5 1,408,590 0.18% 2.8% 2.9%
GOVT SPDR S&P/ASX Australian Government Bond ETF
SPDR 0.22% 15 13 -2 439,446 0.18% 2.2% 2.9%
VAF Vanguard Australian Fixed Interest Index ETF
Vanguard 0.20% 611 704 94 28,359,038 0.06% 2.9% 3.2%
RCB Russell Australian Select Corporate Bond ETF
Russell 0.28% 122 159 37 8,822,473 0.25% 4.1% 2.4%
RSM Russell Australian Semi-Government Bond ETF
Russell 0.26% 61 61 0 506,464 0.28% 2.4% 2.0%
VACF Vanguard Australian Corporate Fixed Interest Index ETF
Vanguard 0.26% 29 100 71 7,953,047 0.19% 2.7% 3.9%
62 Australian ETF Report - 2018
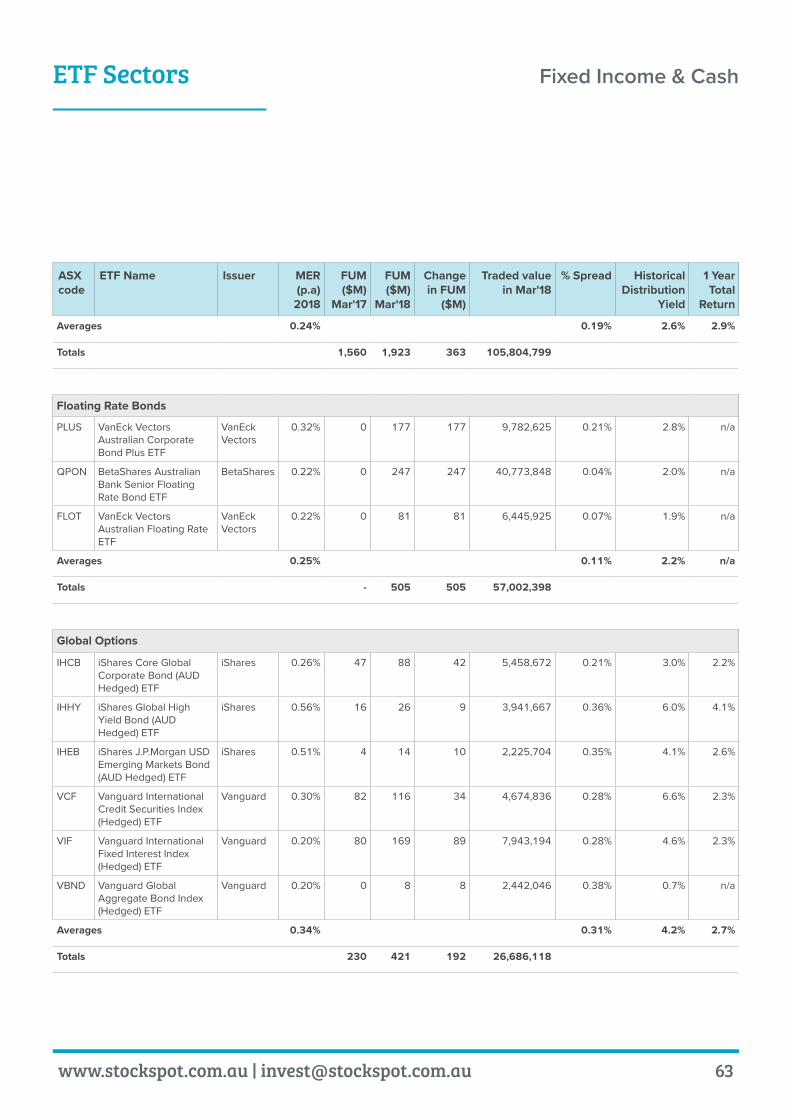
Fixed Income & CashETF Sectors
ASX code
ETF Name Issuer MER (p.a)
2018
FUM ($M)
Mar'17
FUM ($M)
Mar'18
Change in FUM
($M)
Traded value in Mar'18
% Spread Historical Distribution
Yield
1 Year Total
Return
Averages 0.24% 0.19% 2.6% 2.9%
Totals 1,560 1,923 363 105,804,799
Floating Rate Bonds
PLUS VanEck Vectors Australian Corporate Bond Plus ETF
VanEck Vectors
0.32% 0 177 177 9,782,625 0.21% 2.8% n/a
QPON BetaShares Australian Bank Senior Floating Rate Bond ETF
BetaShares 0.22% 0 247 247 40,773,848 0.04% 2.0% n/a
FLOT VanEck Vectors Australian Floating Rate ETF
VanEck Vectors
0.22% 0 81 81 6,445,925 0.07% 1.9% n/a
Averages 0.25% 0.11% 2.2% n/a
Totals - 505 505 57,002,398
Global Options
IHCB iShares Core Global Corporate Bond (AUD Hedged) ETF
iShares 0.26% 47 88 42 5,458,672 0.21% 3.0% 2.2%
IHHY iShares Global High Yield Bond (AUD Hedged) ETF
iShares 0.56% 16 26 9 3,941,667 0.36% 6.0% 4.1%
IHEB iShares J.P.Morgan USD Emerging Markets Bond (AUD Hedged) ETF
iShares 0.51% 4 14 10 2,225,704 0.35% 4.1% 2.6%
VCF Vanguard International Credit Securities Index (Hedged) ETF
Vanguard 0.30% 82 116 34 4,674,836 0.28% 6.6% 2.3%
VIF Vanguard International Fixed Interest Index (Hedged) ETF
Vanguard 0.20% 80 169 89 7,943,194 0.28% 4.6% 2.3%
VBND Vanguard Global Aggregate Bond Index (Hedged) ETF
Vanguard 0.20% 0 8 8 2,442,046 0.38% 0.7% n/a
Averages 0.34% 0.31% 4.2% 2.7%
Totals 230 421 192 26,686,118
www.stockspot.com.au | [email protected] 63

Fixed Income & CashETF Sectors
ASX code
ETF Name Issuer MER (p.a)
2018
FUM ($M)
Mar'17
FUM ($M)
Mar'18
Change in FUM
($M)
Traded value in Mar'18
% Spread Historical Distribution
Yield
1 Year Total
Return
Active Management
HBRD BetaShares Active Australian Hybrids Fund
BetaShares 0.55% 0 61 61 11,416,838 0.16% 1.4% n/a
Overall
Averages 0.26% 0.18% 2.7% 2.8%
Total 2,946 4,340 1,395 439,052,824
Source: ASX
AVERAGE RETURNSFixed income and cash ETFs had the second lowest average returns over the year of 2.8%. This group has the third highest distributions with a 2.7% average, behind Australian shares and Australian sector ETFs. It also had the second fastest FUM growth of 47%, behind global share ETFs, to retain its place as the third largest group by FUM and has the lowest average fee for all groups.
BEST AND WORST PERFORMERSThis group had little variance in performance amongst the ETFs, with all returns ranging from 1.9% to 4.1%. This is unsurprising as all products are driven largely by Australian and global interest rates and credit spreads.
For fixed rate bonds, the Vanguard Australian Corporate Fixed Interest Index ETF (VACF) was the top performer with a 3.9% total return. The Russell Australian Government Bond ETF (RGB) was the worst performer from with a 1.9% return.
Within the global fixed interest suite, the iShares Core Global Corporate Bond (AUD Hedged) ETF (IHCB) had the lowest returns of 2.2%. The 4.1% return from the iShares Global High Yield Bond (AUD Hedged) ETF (IHHY) was the highest overall from this group.
LARGEST INFLOWS AND OUTFLOWSThe three new floating rate bond products received the highest inflows with $505 million in total, ending with greater FUM than global products at $421 million.
Cash ETFs hold bank deposits and aim to provide investors with regular income. The new iShares Core Cash ETF (BILL) attracted the greatest inflows amongst cash products with $170 million in total, which was the greatest total inflow for this group. It saw an inflow of $125 million in July 2017 alone and benefits from being the lowest fee option in this category. In contrast the new option of UBS IQ Cash ETF (MONY) only managed to attract $1 million in total.
For fixed rate ETFs the largest increase of FUM of $143 million went to the iShares Core Composite Bond ETF (IAF), which was 39% of all FUM increase for fixed rate ETFs. The Vanguard Australian Fixed Interest Index ETF (VAF) also managed to increase FUM by $94 million and remains the largest fixed rate bond ETF. The SPDR S&P/ASX Australian Bond Fund (BOND) had the largest decline in FUM of $5 million, whilst the iShares Treasury ETF (IGB) lost $4 million over the year. Generally, corporate bond ETFs received higher fund inflows than government bond ETFs.
All three new floating rate bond ETFs attracted at least $80 million in FUM each. The inflow of $247 million into the BetaShares Australian Bank Senior Floating Rate Bond ETF (QPON) was the greatest for all ETFs in this group. The VanEck Vectors Australian Corporate Bond Plus ETF (PLUS) saw the second highest overall inflow of $177 million, whilst the $81 million inflow into the VanEck Vectors Australian Floating Rate ETF (FLOT) was the lowest amongst the three floating rate options.
64 Australian ETF Report - 2018

Fixed Income & CashETF Sectors
OVERALL TRENDSWhile Australia’s rate has remained 1.5% since August 2016 – the longest stretch without a change on record, investors should be aware of the impact that interest rates and inflation can have on bond returns.
Fixed rate bonds generally benefit from falling interest rates and dropping future rate expectations in Australia. For example, a bond with a fixed 3% initial coupon will become a more attractive investment if the prevailing interest rate falls to 1%, but if the interest rate rises to 5%, the opposite occurs. Bonds with a longer average term to maturity are more sensitive to interest rate changes than shorter-duration bonds. Floating rate bonds offer a coupon that moves in line with interest rate changes.
Newly launched ETFs did particularly well in this group in terms of attracting FUM. The dominance of the large Betashares Australian High Interest Cash ETF (AAA), which invests in short-term deposits, declined from 39% to 29% of this group’s total funds.
STOCKSPOT CHOSEN ETFSThe current Stockspot portfolio inclusion from this asset group is iShares Core Composite Bond ETF (IAF). It provides a good mix of government, semi-government and corporate bonds with a relatively short average duration. This reduces its sensitivity to short-term changes in rate expectations. Fixed rate bonds are our preferred fixed income asset because they are a better hedge against shares than cash or floating bonds.
Stockspot Themes also include Vanguard International Fixed Interest Index (Hedged) ETF (VIF) for global exposure and BetaShares Australian High Interest Cash ETF (AAA) for high-interest cash.
For global ETFs the greatest increase of FUM was the $89 million for the Vanguard International Fixed Interest Index (Hedged) ETF (VIF). All global ETFs had positive inflows, with the Vanguard Global Aggregate Bond Index (Hedged) ETF (VBND) having the lowest increase of FUM with $8 million. iShares and Vanguard now both have three options each, with Vanguard receiving 68% and iShares 38% new fund inflows respectively.
NEW FUNDSThis group had eight new ETFs launched, including three cash ETFs and three floating rate bond ETFs. There were no fee changes.
Investors now have three floating rate bond options to choose from, which already received 36% of new funds. BetaShares Australian Bank Senior Floating Rate Bond ETF (QPON) allocates 80% of its fund to bonds from the largest four banks and 20% to smaller Australian banks. VanEck Vectors Australian Floating Rate ETF (FLOT) also invests in higher yielding bank bonds, while the VanEck Vectors Australian Corporate Bond Plus ETF (PLUS) includes bonds from other lending institutions and listed property trusts too.
The Vanguard Global Aggregate Bond Index (Hedged) ETF (VBND) provides exposure to a mix of government, government-related and corporate bonds from developed markets.
The BetaShares Active Australian Hybrids Fund (HBRD) is the first actively managed hybrid product that invests in hybrid securities issued by banks, bonds and cash.
iShares launched two new cash ETFs, with iShares Enhanced Cash ETF (ISEC) aiming to outperform the S&P/ASX Bank Bill Index and the iShares Core Cash ETF (BILL) aiming to provide returns equivalent to this index. UBS also launched its own cash ETF - UBS IQ Cash ETF (MONY).
www.stockspot.com.au | [email protected] 65

CurrencyETF Sectors
ASX code
ETF Name Issuer MER (p.a)
2018
FUM ($M)
Mar'17
FUM ($M)
Mar'18
Change in FUM
($M)
Traded value in Mar'18
% Spread Historical Distribution
Yield
1 Year Total
Return
Market-cap Based ETFs
USD BetaShares U.S Dollar ETF
BetaShares 0.45% 512 476 -37 41,108,574 0.10% 0.2% -0.1%
ZUSD ETFS Physical US Dollar ETF
ETF Securities
0.30% 10 13 2 939,629 0.13% 0.0% 0.3%
EEU BetaShares Euro ETF BetaShares 0.45% 4 8 4 1,374,657 0.12% 0.0% 15.1%
POU BetaShares British Pound ETF
BetaShares 0.45% 38 27 -12 2,053,115 0.10% 0.0% 12.3%
ZCNH ETFS Physical Renminbi ETF
ETF Securities
0.30% 0.4 0.5 0.0 11,315 0.21% 0.0% 5.3%
Averages 0.39% 0.13% 0.0% 6.6%
Totals 43 36 -8 3,439,087
Active ETFs
AUDS BetaShares Strong Australian Dollar Fund (Hedge Fund)
BetaShares 1.38% 2 3 1 742,030 0.19% 2.0% 1.3%
YANK BetaShares Strong US Dollar Fund (Hedge Fund)
BetaShares 1.38% 1 14 12 2,990,756 0.18% 0.0% -3.7%
Averages 1.38% 0.18% 1.0% -1.2%
Totals 3 17 14 3,732,787
Overall
Averages 0.67% 0.15% 0.3% 4.4%
Total 569 541 -28 45,487,290
Source: ASX
These ETFs track the performance of various currencies. They provide investors with direct access to currency performance without holding physical currency or purchasing derivatives.
66 Australian ETF Report - 2018

CurrencyETF Sectors
AVERAGE RETURNSCurrency ETFs had the third highest average return at 4.4%, behind global share and commodity ETFs.
BEST AND WORST PERFORMERSThe BetaShares Euro ETF (EEU) was the best performer with a 15.1% return. The next top performer was BetaShares British Pound ETF (POU) with a 12.3% return. Despite short-term volatility, the Australian Dollar’s exchange rate with the US Dollar had minimal change, as shown by the flat returns for US Dollar ETF (USD) and ETFS Physical US Dollar ETF (ZUSD).
BetaShares’ hedge fund products for the Australian Dollar and US Dollar exchange rate are the only active ETFs. They involve gearing to magnify the gains and losses of this currency pair, this means they should over or undershoot the returns from the market-cap based US Dollar ETFs. They try to return the inverse values of one another, but the final returns are affected by daily compounding and are unlikely to be exact opposites.
The BetaShares Strong US Dollar Fund (Hedge Fund) (YANK) was the overall worst performer with a -3.7% return, whilst the BetaShares Strong Australian Dollar Fund (Hedge Fund) (AUDS) was just positive with 1.3%. Given the Australian dollar was flat over the period, this shows the high cost of actively managing the daily leverage within these funds.
LARGEST INFLOWS AND OUTFLOWSThe decrease of BetaShares U.S Dollar ETF (USD)’s FUM by $37 million is a larger amount than any other product in this category. Although this ETF’s proportion of the group’s total FUM only declined from 90% to 88%. Despite positive returns, the BetaShares British Pound ETF (POU) had the second greatest decline with $12 million, including an $18 million outflow in November 2017.
The BetaShares Strong US Dollar Fund (Hedge Fund) (YANK) increased FUM by $12 million, starting from only $1.4 million in March 2017. The BetaShares Euro ETF (EEU) saw the second highest FUM growth of $4 million. The inflows and outflows of funds did not correlate with positive and negative returns for this group. There is generally low interest for currency ETFs in Australia.
OVERALL TRENDSCurrency ETFs remain a niche group and are less attractive to general investors than share or fixed income ETFs with the lowest liquidity.
This group is still dominated by BetaShares which holds the vast majority of FUM at 98% with five of the seven ETFs. The Australian-US Dollar currency pair dominates the groups, with four ETF options and 93% of total FUM. There were no new products or fee changes.
www.stockspot.com.au | [email protected] 67

ETF Sectors Commodity
ASX code
ETF Name Issuer MER (p.a)
2018
FUM ($M)
Mar'17
FUM ($M)
Mar'18
Change in FUM
($M)
Traded value in Mar'18
% Spread Historical Distribution
Yield
1 Year Total
Return
Market-cap Based ETFs
QAU BetaShares Gold Bullion ETF (AU$ Hedged)
BetaShares 0.59% 53 55 2 5,593,477 0.39% 0.0% 5.7%
ZGOL ETFS Physical Gold ETF ETF Securities
0.40% 13 14 1 506,264 0.19% 0.0% 6.0%
OOO BetaShares Crude Oil Index ETF-Currency Hedged (Synthetic)
BetaShares 0.69% 40 30 -10 4,923,026 0.38% 0.0% 22.9%
QAG BetaShares Agriculture ETF-Currency Hedged (Synthetic)
BetaShares 0.69% 3 3 0 567,314 0.91% 0.0% -8.8%
QCB BetaShares Commodities Basket ETF-Currency Hedged (Synthetic)
BetaShares 0.69% 9 10 0 656,832 0.93% 0.0% 4.7%
Averages 0.61% 0.56% 0.0% 6.1%
Totals 118 112 -6 12,246,913
Share Product
GOLD ETFS Physical Gold ETF Securities
0.40% 475 583 108 16,311,495 0.17% 0.0% 6.0%
Specialised Product
PM-GOLD
Perth Mint Gold Perth Mint 0.15% 116 134 18 3,811,243 0.37% 0.0% 7.2%
ETP-MAG
ETFS Physical Silver ETF Securities
0.49% 62 57 -5 1,904,100 0.48% 0.0% -10.1%
ETP-MPD
ETFS Physical Palladium ETF Securities
0.49% 2 1 -1 17,539 1.33% 0.0% 18.3%
ETP-MPM
ETFS Precious Metals Basket
ETF Securities
0.44% 5 5 0 9,399 1.40% 0.0% 3.4%
ETP-MPT
ETFS Physical Platinum ETF Securities
0.49% 3 1 -2 65,575 1.12% 0.0% -2.1%
Averages 0.41% 0.94% 0.0% 3.4%
Totals 187 199 12 5,807,856
These ETFs cover the natural resources and commodity sectors. The Structured Products, or synthetic ETFs hold financial contracts rather than owning the physical underlying assets. This is usually for commodities such as oil and agricultural products, which mainly have value in their use and in large quantities.
Physically backed ETFs offer the most direct approach, but incur the cost of storage and insurance. This is the most common approach for gold products and some other precious metals, with procedures for storing gold bars being well established over time.
68 Australian ETF Report - 2018

ETF Sectors Commodity
AVERAGE RETURNSCommodity ETFs had the second highest average returns with 4.8% behind global shares. Their 14% growth rate of FUM was the second lowest and it remained the second smallest group ahead of currency ETFs. This was the only group in which no ETFs paid a distribution.
BEST AND WORST PERFORMERSThe BetaShares Crude Oil Index ETF-Currency Hedged (Synthetic) (OOO) was the top performing ETF overall with a 22.9% return and had the fourth highest return of all ETFs. This came after poor performance in 2015 and 2016. The ETFS Physical Palladium (EPTMPD) also rose strongly with a 18.3% return. Palladium has benefited from the diesel engine ‘test cheating’ by European car manufacturers which broke as news in 2014. Palladium is a component that goes into the catalysts for gasoline engines.
Of the four gold products, the Perth Mint Gold (PMGOLD) had the highest return at 7.2%, whilst the BetaShares Gold Bullion ETF (AU$ Hedged) (QAU) had the lowest with 5.7%. Unusually, silver did not follow gold higher. The ETFS Physical Silver (ETPMAG) was the worst performer with a -10% return. The BetaShares Agriculture ETF-Currency Hedged (Synthetic) (QAG) had the second lowest return with -8.8%.
LARGEST INFLOWS AND OUTFLOWSThe ETFS Physical Gold (GOLD) increased FUM by $108 million from 61% to 65% of the group’s total FUM. The Perth Mint Gold (PMGOLD) received the second highest inflows at $18 million.
Despite being a top performer, investors remained wary of the BetaShares Crude Oil Index ETF-Currency Hedged (Synthetic) (OOO), which had the greatest decline in FUM of $10 million. The worst performer - ETFS Physical Silver (ETPMAG) had the second highest outflow with $5 million.
OVERALL TRENDSThe sector has mixed returns, with some commodities such as oil being relatively cyclical and others such as gold have value as a defensive diversifier for investors. The four gold ETFs played a defensive role in recent periods of sharemarket volatility and their returns ranged from around 5.7% to 7.2%, above the averages for Australian shares. The minor changes in the Australian Dollar resulted in little difference between hedged and unhedged ETFs. ETF Securities extended its dominant position by 2% to hold 74% of FUM in this group, whilst BetaShares’ proportion of FUM declined by 3% to 11%.
STOCKSPOT CHOSEN ETFSThe ETFS Physical Gold ETF (GOLD) is Stockspot’s current portfolio inclusion from this group. Unhedged gold is preferred compared to the hedged version as a diversifier in our portfolios. It provides better protection against declines in the Australian Dollar’s value and a weak local economy.
ASX code
ETF Name Issuer MER (p.a)
2018
FUM ($M)
Mar'17
FUM ($M)
Mar'18
Change in FUM
($M)
Traded value in Mar'18
% Spread Historical Distribution
Yield
1 Year Total
Return
Overall
Averages 0.50% 0.70% 0.0% 4.8%
Total 780 893 113 34,366,264
Source: ASX
www.stockspot.com.au | [email protected] 69

70 Australian ETF Report - 2018

Conclusion
The popularity of ETFs in Australia continues to increase with gusto. This year the strong performance in global shares as well as inflows into fixed income products during times of volatility helped to fuel ETF growth.
The evolution of ETFs are taking available products beyond vanilla ETFs tracking broad market indices, with more actively managed and strategy specific ETFs. Each group has its own set of unique risks and opportunities for investors.
With greater choice comes the need for investors to be more discerning when selecting ETFs for their portfolio. Many of the new products that have launched recently tempt investors to ‘chase’ returns in sectors, markets or strategies that have performed well over the recent past.
Be very careful when reading marketing materials that show that a product has ‘outperformed’ over a period of time. Not only are time periods carefully selected by product issuers to paint a product in the best light, but performance also tends to ‘mean revert’ over the long run so outperformance is almost always only temporary.
Over longer periods all strategies are likely to return to long term averages which is why we prefer to give our clients broad market diversification and steer clear of the hype surrounding short term market fads. There is no ‘free lunch’ when investing, strategies that sound too good to be true are always so.
Even over the past year, several of the ETFs that were heavily out of favour in 2015/2016 like Asian shares (+29.1%) and Oil (+22.9%) have been some of the best performers, well outpacing returns in on-trend markets like US shares (11.7%) and Australian dividend shares (-2.5%).
Disciplined portfolio rebalancing can help achieve a balance between being invested in popular strategies while not getting carried away when they overshoot.
Our advice to clients is simple; invest in a broad mix of assets using ETFs, don’t pick individual stocks, keep your costs low, rebalance occasionally and don’t pay attention to what happens in the short term because it is all just market noise.
www.stockspot.com.au | [email protected] 71

Glossary
Active investing: Also known as active management. An investment strategy that relies on picking stocks or timing the market to beat others.
Asset class: A type of investment such as shares or property, which have similar financial characteristics, are subject to the same regulations and laws.
ASX: Australian Securities Exchange.
Bear hedge fund: A hedge fund designed to provide higher returns as the market falls, it may track the inverse of an index as an ETF.
Broad market ETFs: Track the widest range of securities in the market that has been selected.
Bid/Ask spread: The difference between the highest price paid by a bidder and lowest price offered by a seller for the asset. To buy the investment you need to ‘cross the spread’ and buy from the lowest seller. On the other hand to sell the investment you need to ‘cross the spread’ and sell to the highest buyer.
Bull market: A market where share prices are rising.
Call option: An agreement that gives the investor the option to buy assets at an agreed price on or before a particular date.
Derivative: A security that is dependent on one or more underlying assets.
Distribution yield: A financial ratio that shows how much an ETF pays out in distributions each year relative to its unit price.
Diversification: Spreading your risk across many investments to reduce the impact of any single investment on your overall returns.
Franking credits: When companies have already paid corporate tax the amount of tax the shareholder needs to pay on their dividends is reduced. Franking credits are particularly attractive for people on low tax brackets or in the draw down stages of superannuation.
FUM: Funds Under Management.
Hedged ETF: Funds where strategies are used to neutralise changes in currency movements.
Hedging: Any strategy that looks to reduce the impact of a negative event by making an investment in the opposite direction. For example, life insurance is a form of hedging to reduce the impact of an event (unexpected death) on your family.
Historical Distribution Yield: Actual distribution return over the prior 12 months as a percentage of the unit price.
ICR: Indirect Costs Ratio.
Index: A measurement of a section of a market. It is calculated from the prices of selected assets.
Inflation: This is the gradual increase in prices over time.
Leverage: Also known as gearing. This means borrowing to invest. When prices are rising (shares, houses or anything else), gearing helps to magnify the profits. When prices are falling leverage has the opposite effect, quickly wiping out the value of the investment.
LIC: Listed Investment Company. A managed fund which is actively managed in a closed ended structure and listed on a stock exchange. Unlike ETFs, LICs can trade at significant premium or discount to their net asset value.
72 Australian ETF Report - 2018

MER: Managed Expenses Ratio. The fees shown as a percentage that will be deducted from the total returns every year.
NAV: Net Asset Value. The value of a fund’s asset less the value of its liabilities per unit.
Risk: This means something is unpredictable. When you invest in a share you need to accept the chance that its value may fall tomorrow. When taking on more unpredictability higher returns are expected.
Risk aversion: The human tendency to avoid risk wherever possible even where this sometimes leads to a worse result.
Sector: Specific sections of the market.
Sector ETFs: Track sectors within a market. (e.g. property, financials or resources)
Securities: A financial instrument with proof of ownership that can be traded.
Strategy ETFs: Only include some securities in the market. Securities are selected according to certain rule-based factors. (e.g. dividend yield or research rating)
Synthetic Index: Returns from a financial instrument that is created artificially by combining features of different assets.
Synthetic Returns: Returns from a financial instrument that is created artificially by combining features of different assets.
Unhedged ETF: Funds which are also impacted by changes in currency movements in addition to movements in the underlying investments.
Volatility: The short term ‘ups’ and ‘downs’ in a market.
Yield: The annual return expressed as a percentage of the capital invested. For example, annual dividends of $40 on a $1,000 portfolio would represent a 4% dividend yield.
www.stockspot.com.au | [email protected] 73

Notes
74 Australian ETF Report - 2018

www.stockspot.com.au | [email protected] 75

References in this publication may rely on third parties which Stockspot Pty Ltd – Corporate Representative (No. 453421) of Sanlam Private Wealth (AFS License No. 337927) have not control or accepts no responsibility. Whilst all the information and statements contained in this publication have been prepared with all reasonable care, no responsibility or liability is accepted by any member of Stockspot for any errors or omissions or misstatements however caused or arising. Any opinions, forecasts or recommendations reflect the judgement and assumptions of Stockspot and its representatives on the basis of information as at the date of publication and may later change without notice. This publication is not and should not be construed as an offer to sell or the solicitation of an offer to purchase or subscribe for any investment. This information contains unsolicited general information only, without regard to any investors individual objectives, financial situation or needs. It is not specific advice for any particular investor. Before making any decision about the information provided, you must consider the appropriateness of the information in this document, having regard to your objectives, financial situation and needs. Investment in financial products involves risk. Past performance of financial products is no assurance of future performance.
Stockspot is Australia’s largest and most experienced online investment adviser.
Since 2013, we have helped thousands of Australians grow their savings and have been actively campaigning to increase transparency in the financial industry for consumers. We make investing easy and affordable. Whether you’re growing your wealth, saving for a home, a family, or retirement, we help you do it with the right investment portfolio and guidance.
Your money is managed experts with an established track record. We look after your investments so you can focus on other important things in life.
Join the thousands of Australians already using Stockspot to grow their savings.
Grow your savings the smart way
For more info visit www.stockspot.com.au or contact us at [email protected]
76 Australian ETF Report - 2018