Embed Size (px)
Citation preview

Australian Domestic Gas Outlook Conference
Creating new gas hubs and enabling new supply for southern Australia
David Maxwell
24 March 2021
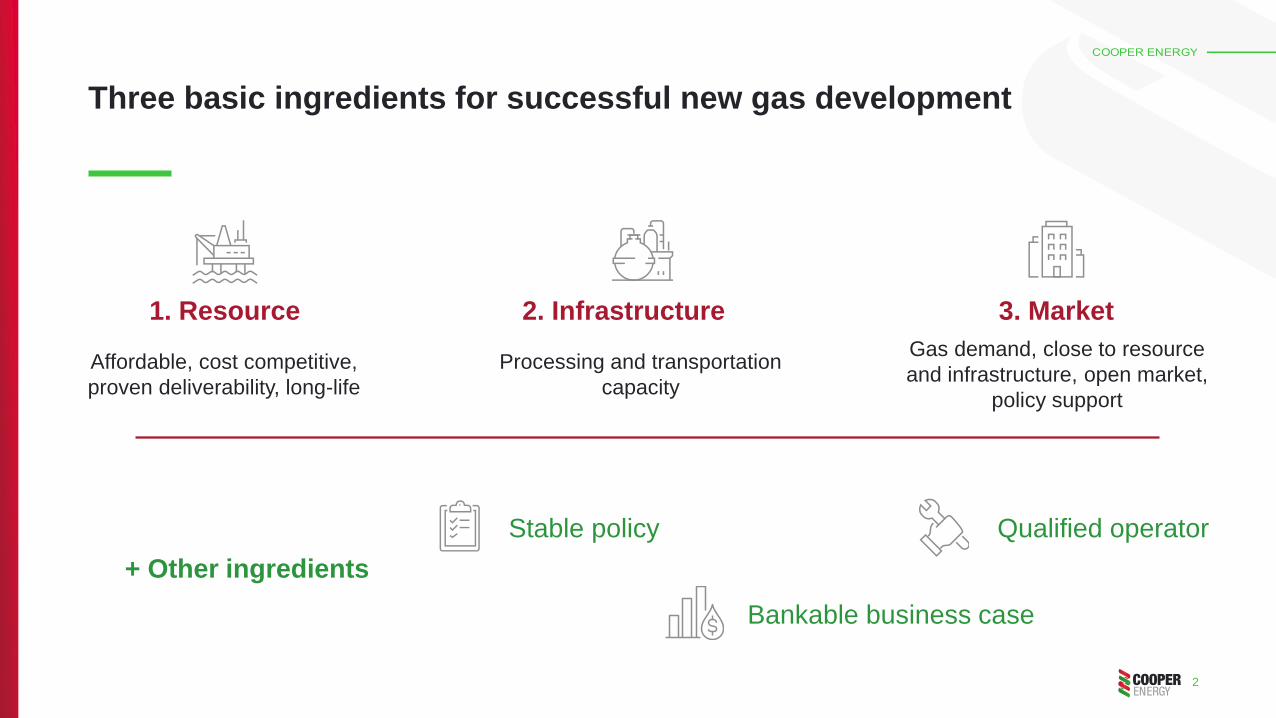
Three basic ingredients for successful new gas development
2
Affordable, cost competitive,
proven deliverability, long-life
Processing and transportation
capacity
Gas demand, close to resource
and infrastructure, open market,
policy support
1. Resource 2. Infrastructure 3. Market
Stable policy
Bankable business case
Qualified operator
+ Other ingredients

Cooper Energy’s twin gas hub strategy
Cooper Energy strategy aligned to fundamentals
3
• Otway and Gippsland basins
• Established infrastructure
connecting southern markets
• Strong gas demand in southern
Australia; supply shortages forecast to grow
1. Resource
2. Infrastructure
3. Market

Disciplined approach to executing upstream gas strategy
4
Long-term cycle for delivery of gas developments1
East coast / southern
gas strategy initiated
2011 2012-16 2015-16 2017 2020 2021+
Next phase of growth
(Athena, OP3D,
Manta)
Gippsland / Otway
acreage acquisitions;
international acreage
divestments
Sole Gas Sales
Agreements signed
with domestic
industrial customers
Sole project
execution
• Two production wells
• 65km gas pipeline
• Umbilicals
• Two shore crossings
• $335m total cost
(below budget of
$355m)
First Sole gas
production
Long-term gas
contracts started
2018-19
Sole debt funding
secured
Net carbon zero
Orbost Gas Plant
funding secured
(sale to APA)
Sole Final
Investment
Decision taken
1. Refer to Appendix for further information on the Sole project
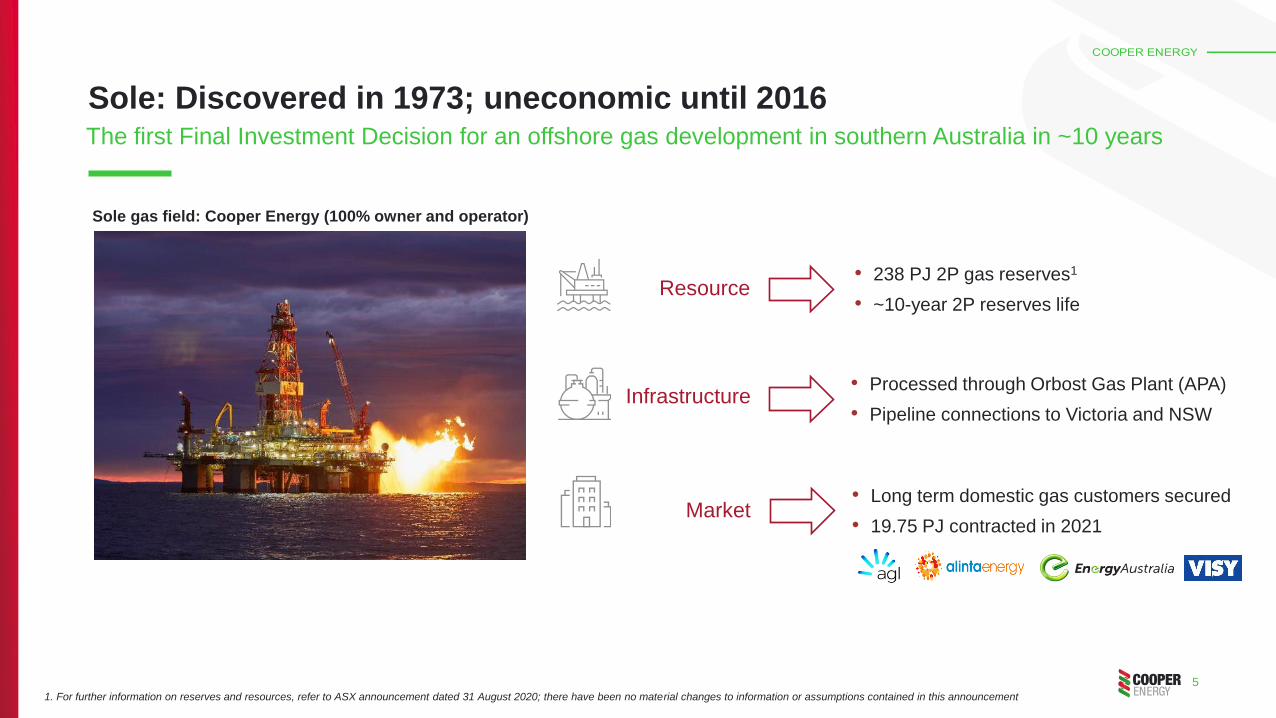
Sole: Discovered in 1973; uneconomic until 2016
5
The first Final Investment Decision for an offshore gas development in southern Australia in ~10 years
Sole gas field: Cooper Energy (100% owner and operator)
• 238 PJ 2P gas reserves1
• ~10-year 2P reserves life
1. For further information on reserves and resources, refer to ASX announcement dated 31 August 2020; there have been no material changes to information or assumptions contained in this announcement
• Processed through Orbost Gas Plant (APA)
• Pipeline connections to Victoria and NSW
• Long term domestic gas customers secured
• 19.75 PJ contracted in 2021
Infrastructure
Resource
Market

6
Sole gas project regulatory figures
6 yearsRegulatory approvals process
25 regulators>150 engagements
129 regulatory approvals

14 15 15
23
45 45
FY16 H1 FY21 Mar-21 Sole at 68 TJ/day Growth projects
Casino Henry Sole Sole at 68 TJ/day
+23
Transformational gas strategyFocus on southern gas markets has delivered a step-change in production and sales volumes
Daily gas production rates (TJ/day)
37 TJ/day
(14 PJ/year)
60 TJ/day
(~22 PJ/year)
83 TJ/day
(~30 PJ/year)
• From no domestic gas production in FY16 to
60 TJ/day today
• Working towards a >100% increase in gas
production rates from H1 FY21 levels
• Further production increases from existing
projects
– Athena Gas Plant
– Otway Phase 3 Development
– Manta appraisal and development
7
No gas
production
+23
Athena,
OP3D, Manta

8
Exploration: Manta,
Elanora, Chimaera
prospective resources
Projects: Manta, Annie
2C resources
Producing fields
2P reserves
Exploration
prospects
four exploration
permits2; multiple
prospects
identified
➢ A broadening pipeline of exploration, appraisal and development opportunities
➢ Project timings align with forecast market gas shortfalls
➢ Progressing high impact exploration prospects
806 PJ(prospective
resources3)
187 PJ(2C resources)
296 PJ(2P reserves)
▲ PJ
Gippsland
Basin
Otway
Basin
Other projects
Annie
Manta appraisal
Clear pathway for new discoveries and converting contingent and prospective resources into reserves1
Opportunities in place for growing gas reserves
1. For further information on reserves and resources, refer to ASX announcements dated 31 August 2020 (reserves and contingent resources as at 30 June 2020; Annie 2C contingent resources), 12 August 2019
(Manta 2C contingent resources), 8 November 2018 (Elanora prospective resources) and 4 May 2016 (Manta Deep, Chimaera East prospective resources); there have been no material changes to information or
assumptions contained in these announcements
2. VIC/P72 and VIC/P75 (Gippsland Basin); VIC/P44 and VIC/P76 (Otway Basin) 3. Unrisked best estimate (P50)

Twin gas hub strategy now in place
9
Optimising supply source to a portfolio of contracts
• Mixture of utility and industrial customers
• Competitive operating cost production
utilising remotely operated subsea tieback
• Concentration around processing hubs at
Orbost and Athena gas plants
• Capacity to expand throughput

437397 388
328274
0
100
200
300
400
500
2020 2021 2022 2023 2024
Forecast southern1 gas demand and productionPJ
Production from existing and committed sources Southern demand
16
(3)(10)
(68)
(113)
(120)
(80)
(40)
-
40
2020 2021 2022 2023 2024
Surplus / (shortfall) in southern production relative to demandPJ
10Source: AEMO Gas Statement of Opportunities 2020
1. AEMO defines southern states as New South Wales, Victoria, Tasmania and South Australia
By 2024, southern gas production expected to lag demand by 113 PJ (~5x annual Sole production)
The gas supply shortage story remains the same
A material gas supply shortfall
forecast by 2024

400
300
200
100
100
200
300
400
2016 2017 2018 2019 2020 20212016 2017 2018 2019 2020
Increasing reliance on Queensland gas to meet southern demandGrowing influence of LNG pricing on domestic gas prices
Qu
ee
nsla
nd g
as
flow
so
uth
So
uth
ern
ga
s f
low
to Q
ue
en
sla
nd
11
South West Queensland Pipeline Flows (QSN Link)1TJ/day
1. Source: Australian Energy Regulator
2. Refer APA website for further information
404TJ/day pipeline
capacity constraint
during winter2
Average monthly gas
flow on South West
Queensland Pipeline

Critical macro settings to support exploration and development
12
• Understanding of supply-side fundamentals
• Recognition that abundance of low-cost gas is gone
• Fair prices to support new developments
• Government support for exploration and development activity
• Customer support through long-term contracting and potential risk sharing of new developments
• Energy policy desperately needed
- encourage transparency and open price market
- support the exit of multinationals without disruption
- respect critical and long-term role of gas as a low-carbon transition fuel
- clarity regarding future restoration liabilities
13
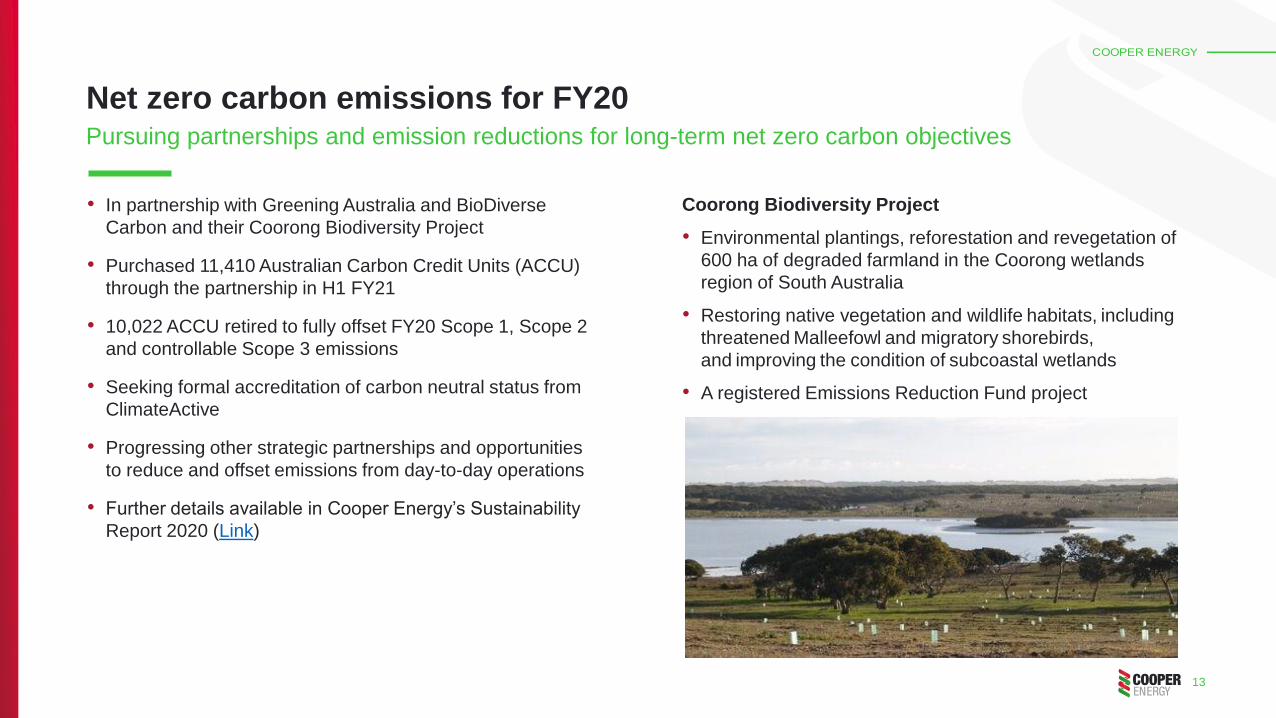
Net zero carbon emissions for FY20 Pursuing partnerships and emission reductions for long-term net zero carbon objectives
• In partnership with Greening Australia and BioDiverse
Carbon and their Coorong Biodiversity Project
• Purchased 11,410 Australian Carbon Credit Units (ACCU)
through the partnership in H1 FY21
• 10,022 ACCU retired to fully offset FY20 Scope 1, Scope 2
and controllable Scope 3 emissions
• Seeking formal accreditation of carbon neutral status from
ClimateActive
• Progressing other strategic partnerships and opportunities
to reduce and offset emissions from day-to-day operations
• Further details available in Cooper Energy’s Sustainability
Report 2020 (Link)
Coorong Biodiversity Project
• Environmental plantings, reforestation and revegetation of
600 ha of degraded farmland in the Coorong wetlands
region of South Australia
• Restoring native vegetation and wildlife habitats, including
threatened Malleefowl and migratory shorebirds,
and improving the condition of subcoastal wetlands
• A registered Emissions Reduction Fund project

Wrap up
• Three basic ingredients for successful new gas development
- resource, infrastructure, market
• Plus critical enablers
- stable policy, bankable business case, qualified operator
• Significant gas supply shortfalls forecast for southern Australia
- with increasing reliance on gas from Queensland
• Otway and Gippsland basins - superior sources of new gas supply for southern Australia
• Cooper Energy’s twin gas hub strategy is part of the solution for growing new gas supply

Appendix
Otway coastline, Pt Fairy, Victoria

Offshore project – Sole gas field (Cooper Energy 100% owner and operator)
• Two production wells and subsea tie-back
• 65km pipeline, umbilicals and shore crossings
• Commissioned on time and below budget
• 238 PJ 2P reserves1
Onshore project – Orbost Gas Processing Plant (APA 100% owner and operator)
• Construction completed in 2019
• Unexplained foaming and fouling impaired production capacity and reliability
• Sulphur absorbers reconfigured in late 2020
• Currently producing at 45 TJ/day with focus on reaching planned production rate of 68 TJ/day
Commercial and financial
• Long-term Gas Sales Agreements initiated 1 December 2020 and 1 January 2021
• Contracted gas supply of 19.75 PJ in 2021
• Long term take or pay contracts in place for 67% of forecast production
• Mixture of utility and industrial customers
• Senior bank debt facility in place with five Australian and international banks
Offshore Sole gas field (Cooper Energy)
Orbost Gas Processing Plant (APA)
16
Production stabilising with improved gas plant performance
Sole gas project
1. For further information on reserves and resources, refer to ASX announcement dated 31 August 2020; there have been no material changes to information or assumptions contained in this announcement

Athena Gas Plant ProjectIncreasing margins, free cash flow generation, gas processing capacity and flexibility
17
• Low-cost processing hub for Casino
Henry and new discoveries
• Ownership of processing capacity enables
marketing of firm gas supply terms
• Capacity to support increased daily
production rates
• Productivity gains from lower inlet
pressure plant
The opportunity
• FID taken July 2020
• $37 million capital cost (gross; Cooper
Energy 50%)
• Plant modifications include compressor and
control upgrades
• Pipeline tie-in
Develop Phase completed
• Commenced October 2020
• Targeting first gas in Q1 FY22
– subject to no material COVID-19
impacts on supply chain and travel
• ~60% complete at 28 February 2021
Execute Phase underway
FID taken
July 2020
Targeting first gas to
plant in Q1 FY22
Status and expected schedule
ASSESS SELECT EXECUTEDEVELOP OPERATE
• ~$0.50/GJ targeted operating cost saving1
• ~3 TJ/day (net) production uplift2
• Increased processing capacity for future
gas developments
Project benefits upon commissioning
1. Estimate of operating cost saving for current production based on forecast Athena Gas Plant costs relative to existing Iona Gas Plant processing tariffs
2. Based on existing wells and infrastructure; increased production attributable to lower Athena Gas Plant inlet pressure relative to the Iona gas plant

Otway Phase 3 Development Project (OP3D)Developing Henry-3 and Annie-2 via the Athena Gas Plant
18
OP3D indicative development concept
• Potential drilling of Henry-3 and Annie-2 in the second half of CY2022,
subject to FID and joint venture approval
• Currently in Select phase; preparing to enter FEED
• Targeting FID in H1 FY22

Abbreviations
$ Australian dollars PPL Petroleum Production Licence
APA APA Group (ASX: APA) PRL Petroleum Retention Lease
bbl Barrels scf Standard cubic feet of gas
Bcf Billion cubic feet of gas TJ Terajoules
bopd Barrels of oil per day YTD Year to date
Cooper Energy Cooper Energy Limited ABN 93 096 170 295
FEED Front End Engineering and Design
FID Final Investment Decision
GSA Gas Sales Agreement
kbbl Thousand barrels
km Kilometres
m Metres
MMboe Million barrels of oil equivalent
MMscf/day Million standard cubic feet of gas per day
n/m Not meaningful
NOPTA National Offshore Petroleum Titles Administrator
OGPP Orbost Gas Processing Plant
PEL Petroleum Exploration Licence
PEP Petroleum Exploration Permit
PJ Petajoules
19

Disclaimer
This presentation may contain forward looking statements, including statements of current intention, statements of opinion and expectations regarding Cooper Energy’s present and future operations, possible future
events and future financial prospects. Such statements are not statements of fact and may be affected by a range of variables which could cause Cooper Energy’s actual results, performance or trends to materially
differ from the results or performance expressed or implied by such statements. There can be no certainty of outcome in relation to the matters to which the statements relate, and the outcomes are not all within the
control of Cooper Energy.
Cooper Energy makes no representation, assurance or guarantee as to the accuracy or likelihood of fulfilment of any forward-looking statement or any outcomes expressed or implied in any forward-looking statement.
The forward-looking statements in this report reflect expectations held at the date of this report. Except as required by applicable law or the ASX Listing Rules, Cooper Energy disclaims any obligation or undertaking to
publicly update any forward-looking statements, or discussion of future financial prospects, whether as a result of new information or of future events.
EBITDAX (earnings before interest, tax, depreciation, depletion, exploration, evaluation and impairment), EBITDA (earnings before interest, tax, depreciation, depletion and impairment), EBIT (earnings before interest
and tax), underlying profit and free cash flow (operating cash flows less investing cash flows net of acquisitions and disposals and major growth capex less lease liability payments) are non-IFRS measures that are
presented to provide an understanding of the performance of the Company’s operations. Underlying profit excludes the impacts of asset acquisitions and disposals, impairments, hedging, as well as items that are
subject to significant variability from one period to the next. The non-IFRS financial information is unaudited however the numbers have been extracted from the financial statements which have been subject to review
by the auditor.
Qualified petroleum reserve and resources evaluator: This Presentation contains information on petroleum reserves and resources which is based on and fairly represents information and supporting documentation
reviewed by Mr Andrew Thomas who is a full time employee of Cooper Energy holding the position of General Manager, Exploration & Subsurface, holds a Bachelor of Science (Hons), is a member of the American
Association of Petroleum Geologists and the Society of Petroleum Engineers and is qualified in accordance with ASX Listing Rule 5.41 and has consented to the inclusion of this information in the form and context in
which it appears. P50 as it relates to costs is best estimate; P90 as it relates to costs is high estimate. Information on the company’s reserves and resources and their calculation are provided in the appendices to this
Presentation.
Numbers in this report have been rounded. As a result, some figures may differ insignificantly due to rounding and totals reported may differ insignificantly from arithmetic addition of the rounded numbers.
Approved and authorised for release by David Maxwell, Managing Director, Cooper Energy Limited.
Level 8, 70 Franklin Street, Adelaide 5000
20