Embed Size (px)
Citation preview

INDUSTRY COMMISSION
AUSTRALIAN DAIRY INDUSTRY
Report No. 14
26 September 1991
Australian Government Publishing Service Canberra

Printed in Australia by P. J. GRILLS, Commonwealth Government Printer, Canberra
ISBN 0 644 22182 8
This work is copyright. Apart from any use as permitted under the Copyright Act 1968, no part may be reproduced by any process without prior written permission from the Australian Government Publishing Service. Requests and inquiries concerning reproduction and rights should be addressed to the Manager, Commonwealth Information Services, Australian Government Publishing Service, GPO Box 84, Canberra ACT 2601

INDUSTRY COMMISSION
26 September 1991 The Honourable John Kerin, MP Treasurer Parliament House CANBERRA ACT 2600 Dear Treasurer In accordance with Section 7 of the Industry Commission Act 1989, I submit to you the report on the Australian Dairy Industry Yours sincerely D L McBride Associate Commissioner

1 AUSTRALIAN DAIRY INDUSTRY
1
TERMS OF REFERENCE
Industry Commission Act 1989 I, PAUL JOHN KEATING, in pursuance of Section 7 of the Industry Commission Act 1989 hereby: 1. refer the Australian dairy industry (at the Commonwealth, State and Territory level) for
inquiry and report by 30 September 1991; 2. specify that, in reporting on market milk and manufactured dairy products, the
Commission identify institutional, regulatory or other arrangements subject to influence by Governments in Australia which lead to inefficient resource use and advise on courses of action to reduce or remove such inefficiencies;
3. without limiting the scope of the reference, request that the Commission give specific
attention to:
a. an evaluation of the marketing and assistance arrangements established by the Dairy Produce Act 1986 (and related legislation);
b. an evaluation of the cheese tariff quota introduced pursuant to Customs Tariff
Amendment Act (No 3) 1986; c. an evaluation of the current regulatory and commercial operations of the Australian
Dairy Corporation (and its subsidiaries); and d. the identification of appropriate institutional, regulatory and other arrangements that
should apply to the manufactured dairy products sector following the termination of the assistance elements of the current arrangements on 30 June 1992;
4. specify that the Commission is to have regard to the established economic, social and
environmental objectives of governments; and 5. specify that the Commission is to avoid duplication of any recent substantive studies
undertaken elsewhere. P.J. KEATING 6 December 1990

CHAPTER I
CONTENTS
PAGETERMS OF REFERENCE vCONTENTS viiABBREVIATIONS xOVERVIEW AND RECOMMENDATIONS xiii
1. INTRODUCTION 1.1 Origin and scope of the inquiry 1 1.2 What the Commission was required to do 1 1.3 Conduct of the inquiry 2 1.4 Structure of this report 3
2. AUSTRALIAN DAIRY INDUSTRY CHARACTERISTICS 2.1 Size and structure of the dairy industry 5 2.2 Industry organisations 11 2.3 Markets for dairy produce 12 2.4 Marketing arrangements 16 2.5 Farm characteristics 18 2.6 Relative costs of producing milk in selected countries 21
3. THE WORLD MARKET FOR DAIRY PRODUCTS 3.1 Characteristics of the world market for dairy products 23 3.2 Policies of the major producing and consuming countries 25 3.3 Australian-New Zealand Closer Economic Relations Trade Agreement 29 3.4 Multilateral Trade Negotiations 33 3.5 International Dairy Arrangement 35 3.6 Distorted world traded prices: implications for providing assistance 36 3.7 Conclusion 40
4. STATE ARRANGEMENTS FOR MARKET MILK 4.1 Regulating the supply and prices of market milk 41 4.2 Health and safety standards 50 4.3 Quality standards 51 4.4 Promotion of fresh milk 52 4.5 Efficiency effects of supply and price controls for market milk 53 4.6 Proposals for change by State governments and industry 59 4.7 Sourcing fresh milk by commercial contracts 64 4.8 Conclusion 67

II REPORT
5. COMMONWEALTH MARKETING ARRANGEMENTS 5.1 The Kerin Plan arrangements for manufacturing milk 695.2 Market support levy and payments 715.3 Domestic prices and producer transfers 745.4 Intra-industry transfers 765.5 Efficiency costs of increased prices for manufacturing milk 785.6 Market milk prices and interstate trade 815.7 Conclusion 835.8 Other Commonwealth influences over dairy marketing 85
6. AUSTRALIAN DAIRY CORPORATION 6.1 Objective and operations of the Australian Dairy Corporation 916.2 Administering the market support and underwriting arrrangements 996.3 Industry information services 1006.4 Generic promotion 1016.5 Export marketing 1046.6 Austdairy 1076.7 Australian dairy industry fund 1096.8 Industry loan service 110
7. OTHER FORMS OF ASSISTANCE TO THE DAIRY INDUSTRY 7.1 Tariffs 1137.2 Cheese tariff quota 1147.3 Underwriting 1207.4 Environmental issues 125
8. MEASURED ASSISTANCE TO THE DAIRY INDUSTRY 8.1 Purpose of measuring assistance 1318.2 The Commission's estimates 1328.3 Criticisms of the Commission's estimates 1388.4 Policy implications of the estimates 147
9. IMPLEMENTATION AND EFFECTS OF THE COMMISSION'S RECOMMENDATIONS
9.1 Objectives of the recommendations 1499.2 Implementation 1509.3 Effects of implementing the recommendations 1529.4 Conclusion 159

AUSTRALIAN DAIRY INDUSTRY
1
ABBREVIATIONS .. negligible - not applicable AAC Australian Agricultural Council ABARE Australian Bureau of Agricultural and Resource Economics ABS Australian Bureau of Statistics ACT Australian Capital Territory ADC Australian Dairy Corporation ADFF Australian Dairy Farmers' Federation ADIC Australian Dairy Industry Council ADPF Australian Dairy Products Federation ANZCERTA Australia New Zealand Closer Economic Relations Trade Agreement AQIS Australian Quarantine and Inspection Service ASIC Australian Standard Industry Classification BMP Buttermilk powder CAP Common Agricultural Policy (EC) CER Closer Economic Relations (see ANZCERTA) cif cost, insurance and freight CPI Consumer Price Index CSIRO Commonwealth Scientific and Industrial Research Organisation DPIE Department of Primary Industries and Energy EC European Community fob free on board GATT General Agreement on Tariffs and Trade IAC Industries Assistance Commission IC Industry Commission kg kilogram kt kilotonne Ltd Limited MTN Multilateral Trade Negotiations na not available nec not elsewhere classified NSWDFA New South Wales Dairy Farmers' Association NZDB New Zealand Dairy Board OECD Organisation for Economic Co-operation and Development PM&C Department of the Prime Minister and Cabinet RWC Rural Water Commission (Victoria) SMA Statutory Marketing Authority SMP Skim milk powder TPC Trade Practices Commission UDV United Dairyfarmers of Victoria UHT Ultra heat treated US United States USDA United States Department of Agriculture USSR Union of Soviet Socialist Republics WMP Wholemilk powder

OVERVIEW AND RECOMMENDATIONS
XIII
OVERVIEW AND RECOMMENDATIONS
The Australian dairy industry is replete with government interventions. These cause inefficient resource use and increased consumer prices for fresh milk and dairy products. The result is a reduction in the total welfare of the Australian community.
The interventions create an artificial distinction between milk for fresh milk consumption (market milk) and milk for manufacturing into dairy products (manufacturing milk). There is a price premium on market milk even though it is no different to manufacturing milk. The interventions include:
• regulated farm gate prices for market milk in all States;
• pooled proceeds from market and manufacturing milk, or supply quotas for market milk;
• regulated processing and distribution of market milk in most States, including set price margins for processors, distributors, retailers and vendors;
• regulated retail prices for market milk in all States except Western Australia;
• restricted interstate trade in market milk between some States;
• a levy on all milk production which is used to subsidise exports of dairy products, thereby increasing the domestic prices of those products;
• a tariff quota which restricts imports of cheese;
• Commonwealth Government underwriting of export returns on certain bulk dairy products; and
• export controls enforced by a Commonwealth statutory body.
These interventions influence the location and scale of the dairy industry. Furthermore, the interventions distort the prices between farmers, processors, manufacturers, distributors, retailers and consumers. Efficiency costs are imposed on the Australian community through overuse of resources in milk production and the opportunity forgone for greater consumption of dairy products at lower price levels. The Commission has estimated that these costs in 1989-90 totalled $29 million; $16 million from the State regulation of market milk, and $13 million from the Commonwealth market support arrangements.

XIV
The Commission has also estimated that the interventions caused Australian consumers to pay around $280 million more for fresh milk and dairy products in 1989-90. This involves an annual loss to consumers and a corresponding gain to the dairy industry. As such, the $280 million is redistributed between sectors of the economy and does not represent a cost of this magnitude to the nation as a whole. However, since consumer prices are higher, they cause some efficiency costs which are included in the above estimate of $29 million for total efficiency costs.
The Commission's recommendations, which must be considered as an integrated package, are aimed at increasing the welfare of the Australian community through:
• removing price distortions, particularly the artificial distinction between market and manufacturing milk, and the unnecessary costs they impose on society;
• ensuring that milk is produced in the least-cost location relative to market outlets;
• reducing the extent of unnecessary government intervention in the industry; and
• ensuring that the industry has the flexibility to adjust to changing circumstances and to capitalise on market opportunities.
Effects of reduced government intervention
Full implementation of the Commission's recommendations would reap significant benefits for the Australian community. Not only would there be benefits from reducing the measurable efficiency costs of $29 million per year, there would also be ongoing gains. These would result from improvements in productivity as a result of more innovative and competitive behaviour with the removal of regulation and protection. Reduced government intervention would facilitate clearer signals to the dairy industry, and produce greater flexibility and dynamism in its responses to those signals.
OVERVIEW AND RECOMMENDATIONS
XV
Modelling work undertaken for the Commission on the effects of implementing its recommendations in the medium term (about five years after full implementation), and the Commission's own analysis, indicate that:
• the farm gate price of manufacturing milk would decline by between five and nine per cent, or two to three cents per litre;
• prices of manufactured dairy products would fall by around 12 per cent as market support payments are reduced;
• the farm gate price of market milk would decline by more than one third, or around 12 to 15 cents per litre;
• the reduction of the farm gate price would allow a similar reduction in the retail price of fresh milk;
• total milk output would likely contract by around five per cent; and
• Australia would remain a net exporter of dairy products.
The removal of regulated margins (which have tended to be squeezed) for processing, distributing and retailing, may offset the initial impact that a fall in farm gate prices for market milk might have on retail prices of fresh milk. Therefore, it is not possible to predict with certainty the overall effect on retail prices in the medium term. However, it is certain that implementing the Commission's recommendations would result, in the long term, in considerable downward pressure on retail prices and in an industry structure conducive to lower retail prices.
Pressures for change
Increased international competition, improvements in technology and changes to government interventions have already caused significant adjustment within the dairy industry. Over the past 20 years the number of dairy farms has declined by two thirds, the number of cows has been reduced by 40 per cent, production per cow has risen by 40 per cent, and total milk production has been lowered by around 15 per cent. There has been rationalisation also in the processing and manufacturing segments of the industry.

XVI
Since 1986, when the current Commonwealth assistance arrangements (the Kerin Plan) commenced, the dairy industry has experienced a substantial reduction in assistance and has become more exposed to the international market for dairy products, including free trade with New Zealand.
The pressures on the industry to be responsive to world prices and to reduce costs are ongoing. The major message of this report is that further reductions in assistance must take place if the dairy industry is to maximise its contribution to national welfare, and that the industry must prepare for increased competition from New Zealand dairy products.
The industry's argument for assistance
In order to justify government intervention, industry representatives pointed to the policies of the European Community and United States which cause over-supply and depress prices on world markets. They argued that removal of assistance would cause too many resources to move out of the Australian dairy industry, from a long-term perspective. This view is based on the premise that eventual reform of EC and US policies will result in a more profitable world market and that Australia, as a low-cost producer of dairy products, would be well placed to benefit from any such reforms. The industry argued that assistance should, therefore, be provided to retain resources in the dairy industry.
The Commission does not consider this approach is a sound basis for providing assistance. Keeping resources in dairying against the day when world dairy markets might be liberalised is a risky strategy. Under current policies, excessive resources are retained in the dairy industry and the costs of so doing are borne by the whole community. It would be more appropriate for the dairy industry to bear the costs.
The Commission has estimated that in 1989-90 the nominal rate of assistance to total milk production was 24 per cent and the effective rate was 61 per cent. These estimates of assistance, which are well above those for most other agricultural activities, have drawn much attention from some participants who have asserted that changes to the Commission's assumptions and methods would yield lower rates. However, estimates based on such alternative assumptions still demonstrate that assistance to the dairy industry is high relative to other agricultural activities. More importantly, the Commission emphasises that particular measures of assistance are just one of many factors it takes into account when formulating recommendations.

OVERVIEW AND RECOMMENDATIONS
XVII
State government interventions
Many State regulations date from an era when refrigeration and transport facilities were inferior by today's standards. They appear to be used for poorly specified social objectives as well as to provide assistance to the farming sector of the industry. However, this inquiry has shown that objectives such as ensuring year-round supply of fresh milk, sourced from within the State at stable prices, cannot be met without imposing unnecessary costs on the Australian community. The problems of regulating prices beyond the farm gate have been recognised in every State, and changes are already under consideration or have been implemented.
State government interventions are also aimed at the conflicting goals of maximising fresh milk prices to farmers and minimising prices to consumers. This has resulted in distorted market signals to the industry, with consequential resource misallocation and unnecessary costs to the whole community.
State dairy industry authorities regulate prices for market milk at the farm gate: in 1989-90 the price for market milk was set in each State at approximately 60 per cent above the average price for manufacturing milk. Such price differentials apply even though only one product - milk - leaves the farm. In States which together account for 70 per cent of Australian milk production, farmers are paid a weighted average of the market and manufacturing prices. These arrangements provide an incentive for excessive and inefficient production and investment.
In the absence of regulation, there would not be separate prices for market and manufacturing milk. Rather, higher prices would apply for milk produced out of season compared with milk produced in season, reflecting the additional costs of production in times of low pasture growth. The Commission considers that the seasonal price differential would be in the range of 10 to 20 per cent.
XVIII
The current price premium for market milk could not be maintained if it were possible to source milk for processing into market milk at a manufacturing milk price. A potential source of milk at such a price is from other States. Therefore, mechanisms have been put in place to ensure interstate trade in market milk between key States does not take place, or does so at prices consistent with regulated prices for market milk. The most formal of these mechanisms is Section 38 of the Victorian Dairy Industry Act 1984. The Commission has received advice from the Commonwealth Attorney-General's Department that, in its opinion, this section is contrary to Section 92 of the Australian Constitution which provides that trade between the States shall be ‘absolutely free’.
The dairy industry has put forward proposals which aim to unify the State market milk sectors into a national sector, with the Victorian price being the national benchmark. The Commission considers that the proposals do not constitute a viable option for change because they do little to dismantle interventions and involve retention of fixed farm gate prices.
The Commission recommends that State controls over the supply and pricing of fresh milk should be removed, and recognises the need to do so gradually to avoid undue disruption to the industry.
Commonwealth Government interventions
To assist manufacturing milk production, Commonwealth legislation enables the industry to impose compulsory levying of all milk production; the funds are paid into a market support fund and are used to raise the returns for exported dairy products. This increases exports and results in higher domestic prices. For example, some Australian cheese may be exported at a price of approximately $2500 per tonne, on top of which the Australian exporter receives a market support payment (export subsidy) of approximately $500 per tonne, increasing total export returns to $3000 per tonne. Domestic prices must rise to $3000 per tonne ($500 above the world price) or else there would be an incentive for all cheese of this type to be exported.
The increase in product prices attracts additional resources to milk production which decreases the availability, and increases the cost, of resources for other activities. Those States in which the majority of milk is used for manufacturing dairy products benefit more than those States in which most milk is used for market milk. In 1989-90 net returns received by Victorian dairy farmers were increased by an estimated $91 million and those of New South Wales farmers were reduced by $2.5 million.
OVERVIEW AND RECOMMENDATIONS
XIX
There is a complex interrelationship between market support payments and the pricing and production of market milk. For this reason the Commission recommends a gradual phasing down of the Commonwealth marketing arrangements. In addition, the Commission recommends retention of the existing Commonwealth mechanism which imposes discipline over interstate trade, the ‘comfort clause’, in order to avoid undue disruption during the phasing period. However, it is ultimately the responsibility of the States to wind back the price differential between market and manufacturing milk, thereby reducing the incentives for interstate trade in milk.
Consistent with its approach of avoiding undue disruption, the Commission also considers that underwriting (direct price support in the advent of a sharp decline in world prices) of certain dairy exports should continue while the marketing arrangements are being phased down.
Commonwealth intervention also includes a tariff of $96 per tonne on imported cheeses, other than those from New Zealand. The Commission recommends that the tariff, which is equivalent to an ad valorem rate of around 2½ per cent, be retained but be reduced in line with any general tariff reductions after 1 July 1996.
A cheese tariff quota provides for a higher tariff of $2100 per tonne on imports in excess of 11500 tonnes per annum. On average the tariff is equivalent to an ad valorem tariff of more than 50 per cent. Since its introduction in June 1987, importers have avoided the $2100 tariff by not exceeding the quota. The quota helps protect the assisted domestic price of cheese. The quota was implemented because of perceived inadequacies of the anti-dumping system. Recent modifications to anti-dumping and countervailing arrangements, which will have general application, address some of the criticisms raised by the dairy industry. The Commission can see no grounds for continuation of the cheese tariff quota.
Australian Dairy Corporation
The terms of reference for this inquiry require the Commission to review the operations of the Australian Dairy Corporation. The Commission has concluded that some of the Corporation's commercial operations are inappropriate for a Commonwealth statutory body and should be terminated. The Corporation should be continued after June 1992 principally to administer the market support payments until they are terminated.

XX
Recommendations
State arrangements for market milk (Chapter 4)
The Commission recommends that:
• State governments should retain responsibility for ensuring the public health and safety of market milk; and
• State controls over supply and pricing of market milk should be removed and, to minimise disruption costs, be removed in according to the following goals:
- legislative and regulatory restrictions to interstate trade in market milk as soon as possible and no later than 1 July 1993
- controls over supply and pricing of market milk beyond the farm gate as soon as possible and no later than 1 July 1996
- supply quotas and administratively set farm gate prices as soon as possible and no later than 1 July 1999.
Commonwealth marketing arrangements (Chapter 5)
The Commission recommends that:
• assistance continue to be provided to the Australian dairy industry by means of a levy on all milk to fund market support payments on dairy product exports;
• the maximum level of market support payments as at 1 July 1992 be set at 20 per cent of average export prices;

OVERVIEW AND RECOMMENDATIONS
XXI
• the level of assistance provided each year thereafter should be phased down in equal annual amounts until 1996 when it should be set at 5 per cent;
• subsequent general reductions in tariffs should apply to the level of assistance of the market support payments; and
• the market support levy revocation clause (comfort clause) remain operative.
Australian Dairy Corporation (Chapter 6)
The Commission recommends that:
• legislation be introduced to continue the Australian Dairy Corporation after 30 June 1992;
• the industry loan service of the Corporation be discontinued;
• the Corporation sell its interest in Austdairy;
• the dairy industry fund be wound-up;
• the Government make a policy statement clarifying ownership of the assets of the Australian Dairy Corporation and Austdairy;
• the promotion levy be repealed;
• the Corporation be given powers to -
- administer market support and underwriting arrangements
- undertake generic promotional activities on the domestic and export markets at the request of the dairy industry
- control exports into quota and the Japanese markets
- provide dairy industry information services; and
• the legislation establishing the Corporation be repealed if, ultimately, the market support arrangements are terminated.

XXII
Tariffs (Chapter 7)
The Commission recommends that:
• the current cheese tariff be retained, but that it be reduced in accordance with any general tariff reductions after 1 July 1996; and
• the cheese tariff quota not be renewed when it ceases on 30 June 1992.
Underwriting (Chapter 7)
The Commission recommends that:
• underwriting of export returns continue to apply at 85 per cent of the long-term trend of export prices until 1 July 1999, at which time underwriting should cease. The Commonwealth's liability in any one year should, however, be limited to the amount of underwriting payments for exports in 1990-91.
INTRODUCTION 1
1 INTRODUCTION
1.1 Origin and scope of the inquiry
This is the final report on the reference to the Industry Commission on the Australian dairy industry dated 6 December 1990. A draft report was released on 18 June 1991.
The Commonwealth legislation which underpins current assistance to the industry, known as the Kerin Plan, expires on 30 June 1992. New legislation must be enacted if assistance is to continue. Through this inquiry, the Commonwealth Government is seeking the advice of the Industry Commission on the nature and extent of any assistance that might be provided to the dairy industry after the current arrangements expire. The issues in the inquiry extend beyond the current Commonwealth assistance arrangements and involve other issues which are the responsibility of State and Territory governments.
The inquiry should also be seen as part of the Government's wider program of micro-economic reform. This program is seeking to change incentives, make markets work better, and to enhance the performance of industry and government throughout the economy.
1.2 What the Commission was required to do
The terms of reference for the inquiry are presented at the front of this report. In brief, they specified that the Commission was to report on all aspects of market (fresh) milk and manufactured dairy products. The Commission was asked to identify institutional, regulatory and other impediments to efficient resource use in the dairy industry which are subject to the influence of governments in Australia, and to make recommendations on action to reduce or remove such inefficiencies.
Specific issues in the terms of reference for the Commission's attention are:
• an evaluation of the Commonwealth's arrangements for the industry (the Kerin Plan);
• the cheese tariff quota;
• an evaluation of the operations of the Australian Dairy Corporation; and
• appropriate arrangements that should apply on termination in June 1992 of the current arrangements.

2 AUSTRALIAN DAIRY INDUSTRY
The Commission must observe the guidelines set out in the Industry Commission Act 1989 which require it to have regard to the desire of the Commonwealth Government:
• to encourage the development and growth of Australian industries that are efficient in their use of resources, self reliant, enterprising, innovative and internationally competitive; and
• to facilitate adjustment to structural changes in the economy and to ease social and economic hardships arising from those changes; and
• to reduce regulation of industry (including regulation by the States and Territories) where this is consistent with the social and economic goals of the Commonwealth Government; and
• to recognise the interests of industries, consumers, and the community, likely to be affected by measures proposed by the Commission.
The Commission must also report on the social and environmental consequences of any recommendations it makes to government.
1.3 Conduct of the inquiry
The dairy industry was referred to the Commission for inquiry on 6 December 1990. An issues paper was distributed to all potential participants and written submissions were invited.
The Commission held informal discussions with relevant Commonwealth and State government departments and agencies, dairy farmer organisations, and dairy product manufacturers and processors. A list of organisations consulted by the Commission is in Appendix A.
In response to industry concerns regarding the measurement of assistance to the dairy industry, the Commission convened a one-day workshop, in April 1991, on assistance measurement. Two papers were prepared and distributed prior to the workshop, the first on why and how assistance is measured, and the second on assistance measurements for the dairy industry (see IC 1991b and 1991c in the list of references at the end of this report). The proceedings of the workshop were transcribed.
Public hearings were held in Melbourne on 30 and 31 July 1991 to allow public discussion of the issues raised in the Commission's draft report. The public hearings were also transcribed. The Commission received 36 submissions prior to the release of the draft report and 29 since the release of the draft report, including 15 submissions that were presented at the public hearings. In preparing the final report the Commission has drawn on all 65 submissions, which have come from a range of participants across the industry, and Commonwealth, State and

INTRODUCTION 3
New Zealand government bodies, and the transcripts of the workshop and the public hearings. A list of participants who have made submissions is at Appendix A.
1.4 Structure of this report
Chapter 2 outlines the characteristics of the Australian dairy industry. Chapter 3 describes the world market for dairy products and the implications for the Australian dairy industry. Chapter 4 investigates the State marketing arrangements and regulations of the dairy industry. The Commonwealth marketing arrangements for dairy products are assessed in Chapter 5 and the operations of the Australian Dairy Corporation in Chapter 6. Chapter 7 covers other forms of assistance, such as tariffs, the cheese tariff quota, underwriting, and environmental issues. Measurement of assistance to the dairy industry is described in Chapter 8. Chapter 9 discusses the implementation and effects of the Commission's recommendations.
Technical information, detailed statistics and the results of the modelling of the recommendations are presented in the appendices. The appendices also contain a detailed description of the Commonwealth and State marketing arrangements.

AUSTRALIAN DAIRY INDUSTRY CHARACTERISTICS
5
2 AUSTRALIAN DAIRY INDUSTRY CHARACTERISTICS
The Australian dairy industry consists of five main segments: farming, manufacturing, processing, distribution and vending, and the administration of the industry by government. The farming segment covers those activities involved in producing milk up to the farm gate. Manufacturing activities include making short-life products such as yogurt and custard, as well as long-life products such as butter, cheese, and the various milk powders. Processing involves the treatment of raw milk for consumption as fresh liquid milk, and distribution to wholesale outlets. Vending activities include the distribution of fresh milk to retail outlets and home deliveries of milk.
The purpose of this chapter is to provide background details about the Australian dairy industry before assessing, in later chapters, the influence of governments on the industry.
2.1 Size and structure of the dairy industry
The total farm gate value of dairy production in 1989-90 was $1749 million, or around 7 per cent of the total value of agricultural output. This farm gate value represented 0.5 per cent of Gross Domestic Product, compared with the total for agriculture of four per cent; these percentages have been relatively stable in recent years.
Dairy manufacturing and processing activities contribute 0.3 to 0.4 per cent to Gross Domestic Product, slightly less than dairy farming.
Employment in the industry during 1990 is estimated to have been around 55 000 which was distributed as follows: farming, 35 000 (mainly owner operators and family members); manufacturing, 10 000; processing, 6500; and vending, 4000. Most of the employment is located in regional areas except for processing and vending which is principally located in capital and regional cities.
The contributions of dairy exports to agricultural exports and total exports are shown in Figure 2.1. The share of dairy exports in agricultural and total exports has changed little in recent years.
2.1.1 Dairy farming
Milk is a highly perishable product and needs to be refrigerated, treated, or processed soon after it is produced. Traditionally dairy farming was located in close proximity to major population centres. With the advent of refrigeration, improved transport, and pressure on land use from

6 AUSTRALIAN DAIRY INDUSTRY
urbanisation, the dairy farming regions are now generally located some distance from the major population centres.
Figure 2.1: Contribution of dairy exports to agricultural exports and total exports, 1989-90
All agricultural exports = $14265 million
Total exports = $58590 million
Source: ABARE 1990, ABS 1990a.
Most dairy farming areas are located in the high rainfall zone, where milk production is dependent on seasonal pastures. However, irrigation is important in northern Victoria, the Riverina in New South Wales, and in parts of Western Australia and Tasmania. One fifth of all irrigated land in Australia is used for dairy farms (see Section 7.4).
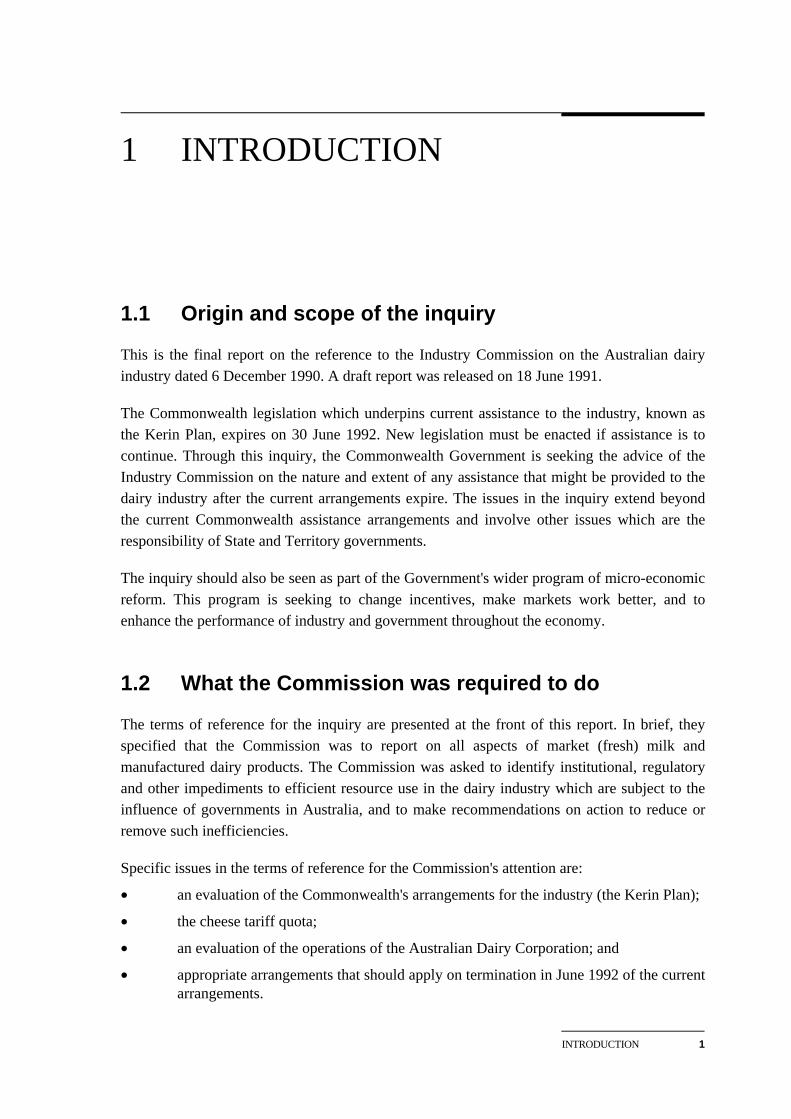
Wholemilk production in Australia for 1989-90 was 6262 million litres. This compares with production of 5430 million litres in 1979-80 and 7551 million litres in 1969-70. Shown in Table 2.1 are the quantities produced in each State (and share of Australian production in brackets) for each of those years. From the table it can be seen that milk production declined and then increased over the twenty year period.
The relative importance of Victoria increased over the period 1970 to 1990, whilst the share of total milk produced in New South Wales and Queensland declined. The production shares for Western Australia, South Australia and Tasmania remained virtually unchanged.
Agricultural exports24%
Other exports76%
Dairy$714m
5%
Wool$4298m
30%
$2694mWheat19%
Other$4187m
29%
Beef & Veal$2372m
17%
AUSTRALIAN DAIRY INDUSTRY CHARACTERISTICS
7
Table 2.1: Wholemilk production a
Year NSW VIC QLD WA SA TAS Australia
(million litres)
1969-70 1413 4057 870 254 483 496 7551
(19) (54) (12) (3) (6) (6) (100)
1979-80 907 3151 506 222 329 315 5430
(17) (58) (9) (4) (6) (6) (100)
1989-90 878 3787 629 267 356 345 6262
(14) (60) (10) (4) (6) (6) (100)
a Shown in brackets is the per cent contribution of each State's production to total Australian production of wholemilk. Source: ADC 1990a (Table 1.4).
The expansion in Victoria occurred in the Northern irrigation area centred around Shepparton. Its share of Victorian milk production has increased from 39 per cent (1429 million litres) in 1986-87 to 43 per cent (1646 million litres) in 1989-90. Some of this increase is a consequence of reduced milk production in Gippsland because of urban encroachment (down from 1316 to 1193 million litres).
For the same three year period, milk production in New South Wales fell from 906 to 878 million litres; a reduction of 8 per cent was evident in the Northern Region, principally a consequence of flooding in the latest year. In Queensland, milk production increased slightly between 1986-87 and 1989-90, from 604 to 629 million litres. The proportion supplied by the Central Region declined from 10.4 to 9.2 per cent where production fell from 63 to 58 million litres. Production levels in the other major producing regions remained virtually unchanged during these years. For further details about milk production in the different regions refer to Table B.4, Appendix B.
Shown in Table 2.2 are details about dairy farm numbers, herd size, and production per cow over the twenty year period to 1990; for regional details refer to Tables B.1, B.2 and B.3, Appendix B. The number of dairy farms declined by around 67 per cent, with the greatest decline occurring in Queensland (76 per cent) and New South Wales (71 per cent); the smallest decline was in Victoria (57 per cent). While dairy cow numbers have also declined since 1971, average herd size increased in all States.

8 AUSTRALIAN DAIRY INDUSTRY
Wholemilk production increased over the past ten years (see Table 2.1) despite the decline in the number of dairy farms and cows. This was achieved by higher production per cow mainly from improved animal husbandry and pasture management.
For Australia overall, the increase per cow was from 2848 to 3804 litres per year or 34 per cent (see Table 2.2).
Table 2.2: Dairy farm numbers, herd size and production per cow
Number of dairy farms Number of dairy cows Average farm herd Average production
1971 1980 1990 1970 1980 1990 1971 1980 1990 1971 1980 1990 ('000 head) (litres per cow)
NSW 7735 3601 2218 654 311 233 97 97 99 2257 2870 3636
VIC 18991 11467 8195 1271 1045 961 98 102 118 3263 3012 3912
QLD 8123 3052 1970 492 247 193 73 82 92 1707 1977 3132
WA 1491 622 496 108 71 64 100 120 105 2586 3105 4205
SA 3836 1730 969 149 103 86 75 77 87 3406 3163 4000
TAS 3117 1522 880 160 103 91 73 79 105 2922 2958 3791
AUST 43293 21989 14728 2833 1882 1631 92 96 109 2609 2848 3804
Sources: ADC 1990a (Tables 1.1, 1.2 and 1.3); State dairy authorities; ABS 1990c (Cat No. 7221.2).
2.1.2 Dairy manufacturing
Dairy manufacturing involves the conversion of wholemilk into products which are generally grouped into two categories: short-life products such as yogurt, custards, cream, ice cream and fresh cheese types; and long-life products such as cheese, butter, milk powders and UHT milk.
Individual plants are designed for the production of specific products. In the short to medium term, there is limited scope to switch to the manufacture of other products. Wholemilk can be manufactured in five main ways into either one of:
• wholemilk powder;
• butter with the joint production of skim milk and butter milk powders;
• butter with the joint production of casein and butter milk powder;
• cheese with the joint production of whey powder or whey protein concentrate; or
• UHT milk.

AUSTRALIAN DAIRY INDUSTRY CHARACTERISTICS
9
The manufacturing segment of the dairy industry has undergone substantial structural change over the past twenty years, particularly so in the last five years. Partly this has been in response to the changes to the Commonwealth marketing arrangements in 1986 (see Chapter 5). Changes have occurred in both the number and size of firms and in the product mix. Mergers and takeovers have featured in the structural adjustment and resulted in greater concentration of ownership in the industry. The effect has been factory closures and investment in new plant and equipment at the remaining factories.
The adjustment can be illustrated with reference to Victoria, the major manufacturing State. In 1983, there were 25 independent factories which accounted for 31 per cent of total wholemilk throughput for Victorian factories. By 1989 the number had reduced to seven and their share of wholemilk throughput to 5.5 per cent. In the meantime, Bonlac Foods Ltd and Murray Goulburn Ltd, both farmer owned co-operatives, had increased their shares of milk throughput: Bonlac from 18.6 to 33.1 per cent; and Murray Goulburn from 20.9 to 39.2 per cent. This means that the two co-operatives now control over 70 per cent of wholemilk throughput. These co-operatives are major producers of bulk products such as butter, cheddar cheese and skim and wholemilk powders, all prominent among Australia's dairy exports.
Since 1986 both co-operatives have invested in plant rationalisation and new equipment: $45 million by Bonlac and $31 million by Murray Goulburn. Other major investments include $33 million in a short-life product plant by Australian Co-operative Foods, Sydney (Submission 14, p. 10).
The product mix of the manufacturing sector has also changed over the past 20 years. Reasons for the change include the loss of the market for butter to Great Britain in 1973, changes in dietary attitudes towards fatty foods and, as already mentioned, changes in the marketing arrangements. It can be seen from Table 2.3 that butter production has declined by more than half since 1969-70, and that casein production is now less than 20 per cent of its earlier level. By contrast, production of wholemilk powder, cheese and yogurt has increased steadily during the past twenty years. In addition, there has been a substantial increase in the range of cheese and yogurt available on the market.
2.1.3 Processing
If milk is to be consumed as fresh liquid milk, its perishable nature requires it to be processed generally within 24 hours of being produced. During this time the milk must be stored below 4 degrees Centigrade. Processing involves pasteurising the milk and packaging into either glass, paperboard or plastic containers for sale to consumers. Around 27 per cent of total milk production is consumed as fresh milk.

10 AUSTRALIAN DAIRY INDUSTRY
Table 2.3: Australian production of selected dairy products
1969-70 1979-80 1984-85 1989-90
(tonnes)
Butter 224 029 84 269 113 939 105 510
Skim and butter milk powder 112 372 67 129 149 270 139 660
Casein 32 267 15 120 8 043 5 328
Wholemilk powder 22 979 75 414 44 649 56 486
Cheese 70 719 151 191 159 576 175 331
Whey powder na na na 19 897
Table cream na 49 710 56 787 na
Yogurt na 27 503 44 919 59 423
Ice cream na 216 427 201 932 196 899
Source: ADC 1990a (Table 1.11 and 1.12).
Most processing plants are located in the capital cities or major population centres. Bulk raw milk is transported by rail and road to these plants. The processing of milk is controlled by the State dairy industry authorities (see Chapter 4). Until the early 1980s, processors were zoned and given exclusive rights to supply particular areas. Zoning has now been removed (or is being removed) in Victoria, Western Australia and Tasmania, but is still operative in the other three States.
The majority of milk in each State is processed by one or two firms. In Victoria over 90 per cent of milk for fresh consumption in 1988-89 was processed by four companies; the two largest, Pura Dairy Products Ltd and Associated Dairies Ltd, processed over 70 per cent between them in about equal shares. For New South Wales, Australian Co-operative Foods processed 56 per cent of fresh milk whilst, for Queensland, Queensland Co-operative Foods processed 41 per cent. Over 70 per cent of Tasmanian fresh milk is processed by Tasmaid; 85 per cent is processed by Farmers Union Foods and Dairy Vale Co-operative for South Australia; and the processing of milk in Western Australia is shared between two companies - Peters WA and Masters Dairy.
Many of the processing companies are also involved in the manufacture of dairy products. The involvement may be direct, as in the case of Australian Co-operative Foods, or indirect such as Murray Goulburn's involvement through owning 15 per cent of Associated Dairies.
2.1.4 Distribution and vending
The distribution and vending of fresh milk has, until recently, been controlled in all States. Vendors were licensed and zoned to supply milk to retail outlets and homes within a given area. The zoning

AUSTRALIAN DAIRY INDUSTRY CHARACTERISTICS
11
of vendors has been, or is being, phased out in Victoria, Western Australia and Tasmania. The zoning system is also being reviewed in the other three States.
The distribution and vending system based on zoning originated when milk was delivered by horse and cart, mainly in glass bottles. Since then changes in packaging to paperboard and plastic, and improvements in home refrigeration, have reduced the need for milk to be delivered fresh daily to homes.
As shown in Table 2.4, the number of vendors and the share of fresh milk home delivered have both declined over the past five years. Many zoned milk runs are no longer viable. In Victoria home deliveries of milk have virtually ceased following the removal of zoning in the early 1980s. By contrast about 39 per cent of fresh milk is still delivered by vendors in Queensland.
Table 2.4: Distribution and vending of fresh milk, 1984-85 and 1989-90
1984-85 1989-90
Number of Vendors
Share Fresh Milk Home delivered
Number of Vendors
Share Fresh Milk Home delivered
(per cent) (per cent)
New South Wales 2191 37a 1763 22
Victoria 172b na 131c 2
Queensland na na 986 39
Western Australia 398a 35 224 19
South Australia 365 40 346 25
Tasmania 134 23d 130 25
ACT 76e 48 68e 34 a Figure for 1985-86. b Number of licences issued to milk vendors. c Number of licences issued to milk vendors in 1987-88. d Figure for 1987. e Home delivery vendors only. Source: State dairy industry authorities and State milk vendor associations.
2.2 Industry organisations
The dairy industry is characterised by having many different autonomous industry organisations, as illustrated in the following chart. The peak policy body is the Australian Dairy Industry Council (ADIC) which draws its membership from most of these autonomous organisations. In addition there are State organisations representing processors, distributors and vendors.

12 AUSTRALIAN DAIRY INDUSTRY
Source: ADIC 1990.
2.3 Markets for dairy produce
There are two main uses for milk - fresh or as a raw material in the manufacture of dairy products. Milk used for these purposes is referred to as market milk and manufacturing milk respectively. Overall for Australia, around 27 per cent of total production is consumed domestically as fresh, liquid milk; 43 per cent for the manufacture of dairy products sold domestically; and 30 per cent for products which are exported.

AUSTRALIAN DAIRY INDUSTRY CHARACTERISTICS
13
In terms of quality, milk can be used for either purpose as it leaves the farm. The quantity of milk that does not meet quality standards for fresh consumption is very small.
The proportions of market and manufacturing milk vary between the States and are shown in Table 2.5. Because of the high proportions of milk used for manufacturing, Victoria, Tasmania and to a lesser extent, South Australia, are referred to as manufacturing States.
Table 2.5: Milk utilisation and markets, 1989-90
NSW VIC QLD WA SA TAS AUST
Milk production (million litres) 878 3787 629 267 356 345 6262 Share market milk/manufacturing
milk (per cent) 66/34 12/88 50/50 56/44 42/58 14/86 27/73Share of products, from manufacturing
milk, exported (per cent) 4 50 13 5 41 32 41Share total milk production
exported (per cent) 2 44 7 2 24 28 30 Source: ADC 1990a (Tables 1.4, 1.5, 1.11, 1.12) and Submission 62; ABARE 1990 (Table 73).
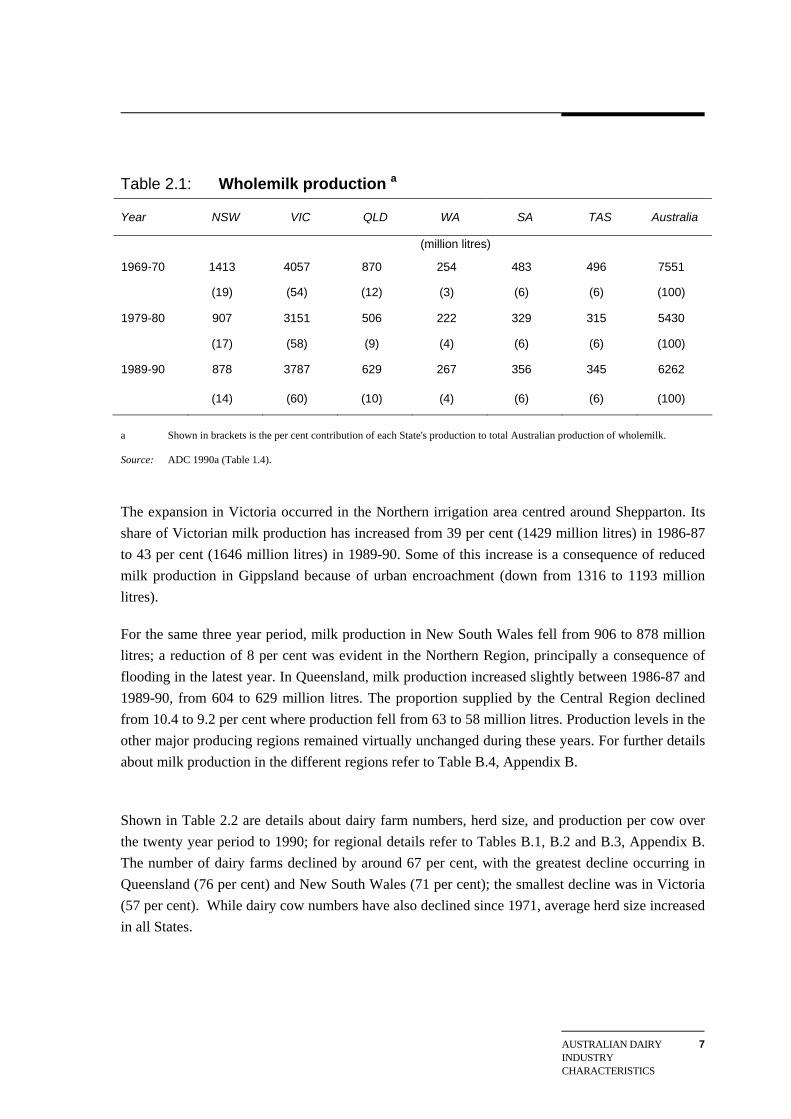
Also shown in the table are the proportions of each State's milk product which are exported as dairy products. Victoria by far is the most dependent on the world market with 44 per cent of its milk production being exported. The prominent role of Victoria in the Australian dairy industry is illustrated in Figure 2.2. The world market for dairy products is discussed in Chapter 3.
2.3.1 Manufactured products
Table 2.6 shows the consumption per head of selected dairy products for the years 1984-85 and 1988-89. Over that period the per head consumption of most dairy products has remained constant or increased. The largest increase, 25 per cent, was in yogurt consumption. Butter consumption recorded the largest decline, 25 per cent. By contrast, margarine consumption declined by only 7 per cent.
14 AUSTRALIAN DAIRY INDUSTRY
Table 2.6: Australian consumption of selected dairy products
1984-85 1988-89
(kilograms per head) Butter
(Table margarine) 3.9
(6.7) 2.9
(6.2) Cheese
(Imports) 8.5
(1.5) 9.2
(1.2) Skim and butter milk powder Wholemilk powder
2.30.7
2.70.9
Casein 0.1 0.1 Table cream 2.7 2.6 Yoghurt 2.8 3.5 Ice cream (litres/head) 12.9 11.6 Source: ADC 1990a (Table 1.22); ABARE 1990 (Table 70).
Figure 2.2: Volume of market and manufacturing milk by State, 1989-90
Source: ADC 1990a.
Prices of dairy products in recent years have increased relatively slowly. Between 1984-85 and 1989-90, the dairy product group of the Consumer Price Index increased by 34 per cent compared with 43 per cent for all foods and 47 per cent for all goods and services. Of the dairy products, the price of cheese has increased most and of milk and cream the least (see Appendix B, Chart B.2).
0
5 00
10 00
15 00
20 00
25 00
30 00
35 00
N S W V IC Q LD W A S A T A S
m illio n litre s
M arke t m ilk M a nu fac tu ring m ilk

AUSTRALIAN DAIRY INDUSTRY CHARACTERISTICS
15
Between 1984-85 and 1989-90, the price of manufacturing milk rose by 82 per cent. This rise for the manufacturing milk price reflects its dependence on world prices for dairy products which increased markedly until 1988-89. However, as illustrated by Figure 2.3, the manufacturing milk price has fallen over the last two years, in a lagged response to declining world dairy product prices.
Figure 2.3: Australian manufacturing milk price and world prices for selected dairy products, 1985-86 to 1990-91
Series 1 Australian manufacturing milk price (cents per litre) Series 2 Skim milk powder world price ($US per tonne) Series 4 Cheddar cheese world price ($US per tonne)
Source: ADC 1990a and unpublished data.
Table 2.7 highlights the overall export orientation of the Australian dairy industry. Imports supply a relatively small share of the domestic market and exports constitute a large proportion of domestic production. With the exception of casein (where traded volumes are relatively small), whey powder imports supply the largest proportion of the domestic market for any product at 14.8 per cent. In comparison, around 50 per cent or more of domestic production for most products is exported.
0
5
10
15
20
25
30
35
40
45
50
1985-86 1986 1986-87 1987 1987-88 1988 1988-89 1989 1989-90 1990 1990-91
cents per litre
500
700
900
1100
1300
1500
1700
1900
$US per
tonne
Series1 Series2 Series4 Series3

16 AUSTRALIAN DAIRY INDUSTRY
Table 2.7: Australia's production, consumption and trade in dairy products, 1989-90
Domestic
consumption Domestic production
Shares of consumption imported
Share of production exported
(tonnes) (per cent) Butter 49 834 111 200 2.0 45.4 Skim and butter milk powder 42 777 1143 700 0.8 67.4 Cheese 151 747 175 331 13.6 28.2 Wholemilk powder 16 264 56 486 7.0 75.2 Casein 2 242 5 328 53.1 81.1 Whey powder and concentrates 7 387 19 897 14.8 76.8 Source: ADC 1990a (Tables 1.15 and 1.16)
2.3.2 Fresh milk
The per person consumption of fresh milk has remained relatively stable over the period 1984-85 to 1989-90. Average consumption for Australia declined only slightly from 103.3 to 102.2 litres per head. As shown in Table 2.8, the consumption per person varies between the States with consumption in Queensland being consistently the highest.
Although fresh milk consumption remained relatively stable, the share of traditional, whole white milk declined from 88 to 80 per cent. This decline was offset by an increase in the share of low/reduced fat milk from 4 to 12 per cent. The share of the fresh milk market occupied by flavoured milk remained constant at 8 per cent.
Table 2.8: Consumption of liquid milk NSW VIC QLD WA SA TAS AUST
(litres per head) 1984-85 98.8 108.2 111.5 93.2 103.7 100.5 103.3 1989-90 96.1 104.6 111.6 99.5 105.4 104.5 102.2 Source: ADC 1990a (Table 1.21).
2.4 Marketing arrangements
Separate arrangements apply to the marketing of manufacturing and fresh (market) milk, despite the fact that generally milk of only one quality leaves the farm. Commonwealth arrangements, known as the Kerin Plan, apply to the marketing of manufactured milk - these are administered by the Australian Dairy Corporation and are discussed in Chapter 5.

AUSTRALIAN DAIRY INDUSTRY CHARACTERISTICS
17
The marketing arrangements for fresh milk are administered by State dairy industry authorities and are discussed in Chapter 4; further details are contained in Appendix C. In essence, the arrangements mean that the marketing of fresh milk is highly regulated. Controls exist, to varying degrees as between the States, over sourcing, pricing, transporting, processing, quality and the distribution of milk.
When combined with the arrangements for manufacturing milk, the industry is separated by arbitrary divisions between manufacturing and fresh milk and by State borders. There is very little interstate trade in fresh milk.
2.4.1 Payment to dairy farmers
In quota States (New South Wales, Queensland and Western Australia), farmers who hold quota, receive an administered price for all milk accepted by their dairy authorities for use as market milk. All other milk produced is paid the manufacturing milk price.
In the non-quota States (Victoria, Tasmania, and South Australia), farmers receive a weighted average price for all milk produced. The market milk price, which is administratively determined, and the manufacturing milk price are weighted by their respective volumes in each month's production to determine the price received at the farm gate.
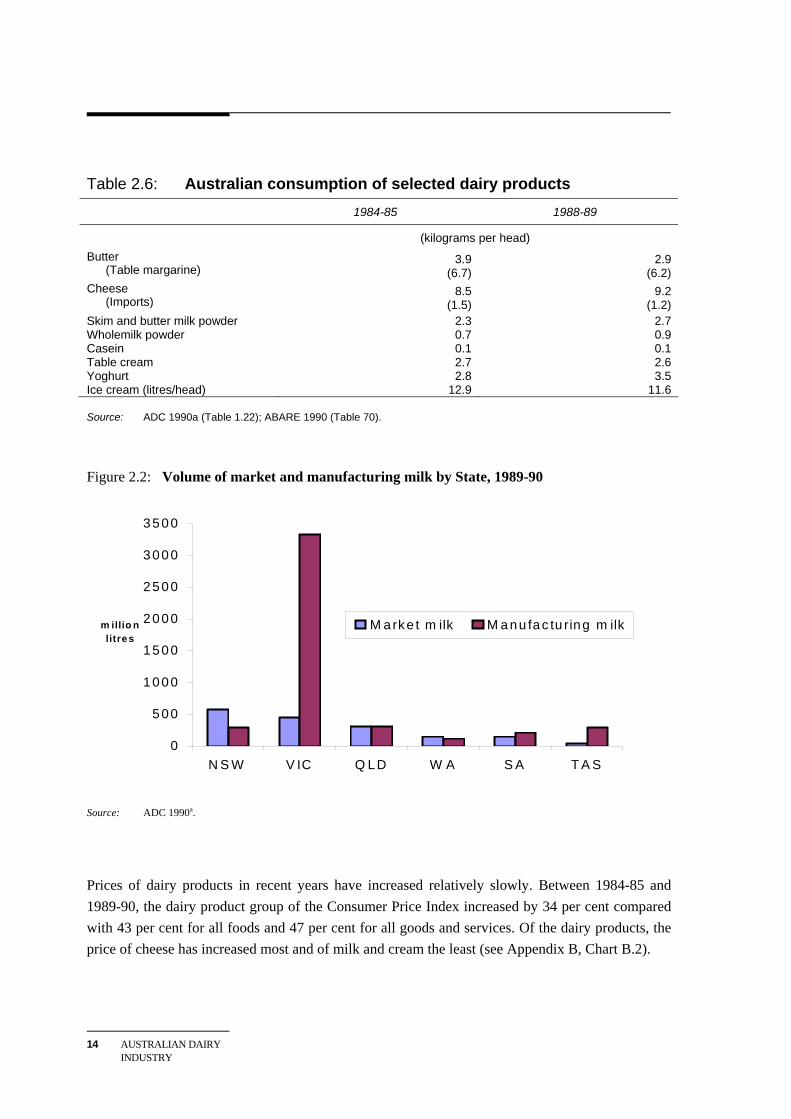
In all States market milk prices exceed those for manufacturing milk. Average prices received by dairy farmers for fresh and manufactured milk in each State for 1984-85 and 1989-90 are shown in Table 2.9. Over the period the difference between the price for fresh and manufactured milk has declined. Victoria had the lowest ratio of market to manufacturing milk prices in 1989-90, but the market milk price still exceeded the manufacturing milk price by around 50 per cent. However, because of the small share of total milk used as fresh milk (see Table 2.5), the higher price for fresh milk resulted in a weighted average price in 1989-90 that was only 1.4 cents per litre (5 per cent) higher than the price for manufacturing milk.
The share of total returns in 1989-90 from fresh milk sales is lowest for Victoria at 16.7 per cent. By contrast, the share was highest for New South Wales at over 77.8 per cent. This is due partly to the higher proportion of total milk sold as fresh milk (66 per cent in New South Wales compared to 12 per cent in Victoria) and the greater difference between fresh and manufacturing prices.
The basis of payments to dairy farmers has gradually changed in recent years from using solely milk fat content to a compositional system which also includes protein content. Payment arrangements are also changing to a basis where dairy farmers bear more of the transport costs of carting their milk. Traditionally the cost of transport has been pooled equally between all farmers. In some States, a pick-up fee is now being charged and, in some instances, a charge based on distance travelled.
18 AUSTRALIAN DAIRY INDUSTRY
Once fully implemented, these changes should ensure that dairy farmers receive clearer signals concerning the market value of their milk and the cost of its transport from farm to factory. Decisions concerning the quality of milk to produce (fat to protein ratios) and location of dairy farming will be less distorted.
Table 2.9: Average farm gate prices received by dairy farmers
NSW VIC QLD WA SA TAS
(cents per litre) 1984-85 Market milk 33.8 29.0 35.0 29.4 28.5 32.9 Manufacturing milk 12.4 13.8 10.6 10.4 13.7 12.9 Weighted average - 15.7 - - 19.3 15.4Ratio of market milk prices
to manufacturing milk prices 2.7 2.1 3.3 2.8 2.1 2.6 Share of total returns from
market milk (per cent) 79.6 23.9 72.9 76.1 56.0 27.6 1989-90 Market milk 41.2 36.8 43.4 37.3 37.4 44.4 Manufacturing milk 22.8 25.1 23.4 22.3 21.2 22.7 Weighted average - 26.5 - - 27.8 25.7Ratio of market milk prices
to manufacturing milk prices 1.8 1.5 1.7 1.7 1.7 2.0 Share of total returns from
market milk (per cent) 77.8 16.7 65.0 68.0 56.0 24.0 Source: ABARE 1990 (Table 71).
2.5 Farm characteristics
Farms must be licensed by the relevant State dairy industry authority to produce milk for sale. Most are single enterprise, family owned and operated businesses; there is very little hired labour employed.
Table 2.10 details income and expenditure for the average family farm in each State for 1989-90. Income from the sale of milk is by far the largest source of income. Calves and culled cows, produced as joint products with milk, form the second largest source of income in all States except Tasmania. In Western Australia beef production is frequently undertaken as a major enterprise in conjunction with dairying so that receipts from livestock sales are relatively high compared with other States.

AUSTRALIAN DAIRY INDUSTRY CHARACTERISTICS
19
Major expenditure items include materials, services, interest, and the market support levy (see Chapter 5). Average farm cash operating surplus was highest for Western Australia and Tasmania at around $50 000; Queensland had the lowest at just under $29 000. This surplus represents the return to the family's labour, management and equity capital.
As noted by the Australian Bureau of Agricultural and Resource Economics, the average farm cash operating surplus of dairy farms increased, in real terms, between 1985-86 and 1989-90. However, reflecting weaker world prices for dairy products, a decline in the financial performance of dairy farms is estimated for 1990-91 (Submission 28, p. 9). Provisional estimates indicate that average farm cash operating surplus declined in the order of 13 per cent between 1989-90 and 1990-91 (ABARE 1991b, p. 71).
Table 2.10: Income and expenditure for the average family dairy farm, 1989-90 a
NSW VIC QLD WA SA TAS AUST
Farm Size (ha) 185 128 208 305 183 176 161 Milk Production ('000 litres) Market 237 64 144 257 135 23 112 Manufacturing 121 393 162 210 199 396 298 Total 358 457 306 467 334 419 410 Income ($'000) Dairy receipts 108 117 80 137 96 104 109 Livestock sales 16 23 17 51 15 21 21 Other 3 7 2 5 8 20 7 Total 127 147 99 193 119 145 137 Income from milk (per cent) 85 80 81 71 81 72 80 Expenditure ($'000) Livestock purchases 5 6 2 12 3 3 5 Hired labour 5 3 2 6 2 4 3 Materials 48 39 39 58 39 47 41 Services 17 19 12 29 16 14 17 Market support levy 7 10 6 10 8 9 9 Other 13 24 10 25 18 17 19 Total 95 100 70 139 86 95 95 Farm Cash Operating Surplus $ 36290 46844 28806 53889 32582 50293 41514 a Preliminary estimates. Source: ABARE 1991b.

20 AUSTRALIAN DAIRY INDUSTRY
Compared with other enterprises, dairy farming is a relatively intensive form of agricultural production (see farm size, Table 2.11), particularly in the irrigation areas. The major alternatives to dairying are sheep and beef cattle, cereal and oilseed crops, horticultural crops, and vegetables. The financial performance of family farms based on these alternatives is compared with dairying for 1989-90 in Table 2.11.
Table 2.11: Relative financial performance of farms, 1989-90 a
Type of farm Dairying Sheep-beef Mixed livestock-crop
Horticulture
Farm size (ha) 161 2 550 1 463 27Capital value ($) 816 490 1 073 560 975 750 347 630 Debt ($) 79 260 85240 116 110 45 850 Cash receipts ($) 136 810 146950 205 170 80 310Cash costs ($) 95 300 110 040 140 680 59 530 Return to capital and management ($) 30 901 5 140 13790 14 370 Off farm income ($) 9 000 10 085 8 860 8 720
Farm income per work year of family labour 17 370 19940 22 100 4 430
Real rate of return (including capital appreciation)
1986-87 -1.8 -3.4 -11.2 -7.2 1987-88 5.5 9.8 10.1 2.8 1988-89 9.0 9.4 12.4 na 1989-90 -11.7 -8.5 -1.2 na 1990-91b -8.7 -11.3 -11.0 na a Preliminary estimates, except for 1986-87, 1987-88 and 1998-89 real rates of return. b Provisional estimate. Source: ABARE 1991b and previous issues.
2.5.1 Seasonality of milk production
Milk production is seasonal. A cow reaches peak milk production approximately six weeks after calving, which is then maintained for the following two to three weeks. For the remaining seven to eight months of the lactation period the quality and quantity of milk produced gradually declines. To maximise milk output and minimise production costs, the farm manager seeks to coordinate the farm's breeding program with pasture growth. The natural flush of pasture growth in Southern Australia occurs in spring, generally October. Calving is commenced in late winter/early spring so that peak lactation coincides with peak pasture growth. Lactation ceases in late autumn when feeds stocks are low.
Although the supply of milk is affected by seasonal factors, the demand for milk remains relatively constant throughout the year. To supply milk during winter it is often necessary to use supplementary feeding to ensure that a cow's nutritional requirements are met. During the colder months, cows use additional energy (supplied by the fodder a cow consumes) to maintain body temperature. The result is lower milk yields per unit of feed, and higher production costs, compared to the warmer months.

AUSTRALIAN DAIRY INDUSTRY CHARACTERISTICS
21
To ensure that milk is supplied during winter it is necessary to provide a financial incentive to dairy farmers to cover the costs of altering the breeding cycle of the farm herd and to compensate for the additional expenses required to maintain production levels. In some States, the dairy industry authorities provide winter incentive schemes to ensure that fresh milk requirements are available during the low production period; in other States farmers are penalised for failure to fill supply quotas. Manufacturing companies also offer higher prices to dairy farmers during the low season in order to obtain sufficient milk supplies of the required quality to maintain factory throughput.
2.6 Relative costs of producing milk in selected countries
Many participants in this inquiry stated that, principally because of its climatic advantages and availability of land, Australia is a relatively low-cost producer of milk. Evidence to support this claim was provided by the Australian Dairy Corporation and is reproduced in Figure 2.4; it covers only direct costs and excludes any returns to land.
Figure 2.4: International comparison of direct costs of milk production a
a Excludes returns to land and to owner labour. Source: ADC Submission 17, p. 3.
0
10
20
30
40
50
60
Japan E C U S A A ust N Z
cen ts pe r l itre

THE WORLD MARKET FOR DAIRY PRODUCTS
23
3 THE WORLD MARKET FOR DAIRY PRODUCTS
About a quarter of Australia's milk production is exported as dairy products. For Victoria, which produces 60 per cent of Australia's milk, the proportion exported is 44 per cent. Export returns, therefore, have an important influence on the profitability of the dairy industry. This chapter outlines the major issues affecting export returns and Australia's position within the world dairy market. The question of whether distorted world prices for dairy products justifies providing assistance to the Australian dairy industry is also examined.
3.1 Characteristics of the world market for dairy products
Most developing and developed countries have sought to be self sufficient in dairy products. A substantial proportion of dairy product requirements, if not all, is met from domestic production. Exports of dairy produce tend to be from production which is surplus to domestic needs. As a result, world trade in dairy product is relatively small. Only about 6 per cent (26 million tonnes in milk equivalents) was traded internationally in 1989 (see Table 3.1). Trade is mainly in the form of long-life products such as cheese, butter, milk powders, casein and condensed milk. There is very little trade in fresh milk. Because of its perishable and bulky nature, fresh milk tends to be consumed close to where it is produced.
Table 3.1: World milk production and dairy product trade, 1989 Milk Production Exports a Exports/Production Exports/World Trade
('000 tonnes) (per cent) European Community 98 954 13 075 13 50 New Zealand 7 237 3 820 53b 15 United States 65 432 2 430 4 9 Australia 6 232 1 572 25 6 Eastern Europe 47 328 1 610 3 6 Canada 8 250 910 7 4 Nordics 8 127 820 11 3 USSR 108 100 .. .. .. Other 120 360 1 660 1 6 Total World 470 020 25 897 5.5 100 a Quantities are expressed in tonnes of milk equivalents calculated from fat and non-fat export data using European Community
milk conversion co-efficients. Casein and fresh products are not included. b This figure would be greater than 75 per cent if exports were calculated on a solids non-fat basis and included all trade in casein
and other dairy products for which exports are minor. Source: ADC 1990a and information supplied directly by the ADC.

24 AUSTRALIAN DAIRY INDUSTRY
World traded prices for dairy products, and volumes traded, are volatile and heavily influenced by the import restrictions and export subsidies of the major producers and consumers of dairy products, especially the European Community, United States and Japan. The volatility reflects the residual nature of world trade; small changes in production of, or demand for, dairy products in the major producing and exporting countries give rise to relatively large changes in world traded prices. The variability in price is aggravated by changes in subsidy levels, especially of the European Community. In 1990, for example, the Community's domestic (intervention) price for butter was 2932 European Currency Units per tonne, 200 per cent higher than the estimated world traded price for butter (ADC 1990a, p. 70).
Prices received in the international market also vary considerably between bilateral quota markets (mainly the European Community and United States) and markets subject to global competition. Bilateral quotas cover the quantity of dairy product that can be traded between two countries. The Australian Dairy Corporation estimates that the returns from Australian cheese exports to the European Community are around 50 per cent higher than returns from non-quota markets (see Section 6.5). Outside bilateral agreements, the major import markets for dairy products are South East Asia; Central, South and North America (the Americas); Africa; the Middle East and the USSR. Details are provided in Table 3.2.
Table 3.2: Dairy product trade and share of major import markets, 1988
Product Asia Americas Middle East Africa USSR World
(per cent) (tonnes)a Butter 8 4 9 14 48 914 473 Cheese 18 18 22 9 <1 761 642 SMP 35 19 17 18 0 1 322 258 WMP 40 25 7 16 8 764 794 Whey Powder 58 12 .. 5 7 104 988 Casein 15 50 1 1 0 169 772 a Quantities are expressed in tonnes of product traded. Source: ADC 1990a (Table 3.7).
3.1.1 Australia's place in the world market for dairy produce
Australia is a net exporter of manufactured dairy products. Australia produces about 1.3 per cent of the world's milk output but accounts for about 6 per cent of world trade. The major products exported include skim milk powder, cheese, butter and wholemilk powder. Table B.9, in Appendix B, provides information on Australian exports of dairy products by importing country, for the period 1984-85 to 1989-90.

THE WORLD MARKET FOR DAIRY PRODUCTS
25
Table 3.3: Major markets for Australian dairy product exports, 1989-90a
Product Asia Americas Middle East Africa USSR World
(per cent) (tonnes)a Butter 55.3 0.8 13.2 7.9 1.4 50 536Cheese 50.5 11.0 27.0 .. 1.5 51 540Skim Milk Powder 77.7 17.5 2.8 .. 0.7 97 031Whole Milk Powder 90.7 1.2 0.1 .. 0.9 42 466Whey Powder 100.0 .. .. .. .. 14 020 Casein 30.2 62.6 .. .. .. 4 257 Total 71.0 10.2 9.0 1.6 1.0 259 850 a The table shows the percentage of Australian dairy product exports entering particular markets and the total quantity
exported for each dairy product. Source: ADC 1990a (Table 3.8).
As can be seen from Table 3.3, Australian exports are concentrated in Asia (71 per cent), particularly South East Asia and Japan, with relatively small shares going to the Americas (10.2 per cent of exports) and the Middle East (9 per cent of exports). This pattern reflects Australia's natural geographical and freight advantages over European Community suppliers. It is also influenced by the extent to which Australia is excluded from other major markets by bilateral quota agreements, import restrictions, or by the impact of export subsidy programs of major competitors.
In 1989-90, Australia had bilateral quota arrangements covering:
• access for 3000 tonnes of cheddar cheese to the European Community, about 6 per cent of total cheese exports;
• access for 4000 tonnes of cheese to the United States, less than 8 per cent of cheese exports; and
• access for 600 tonnes of skim milk powder to the United States, less than 1 per cent of skim milk powder exports.
Apart from the above arrangements, Australia also holds small quotas for several other dairy products, but these arrangements account for less than 1 per cent of total exports. The majority of Australian dairy product exports is sold to non-quota markets.
3.2 Policies of the major producing and consuming countries
The level of world trade and traded prices tend to be highly volatile. The most important factors influencing trade are the dairy industry policies of the European Community, United States, Japan, Canada and New Zealand. Apart from New Zealand, these countries have pursued policies to
26 AUSTRALIAN DAIRY INDUSTRY
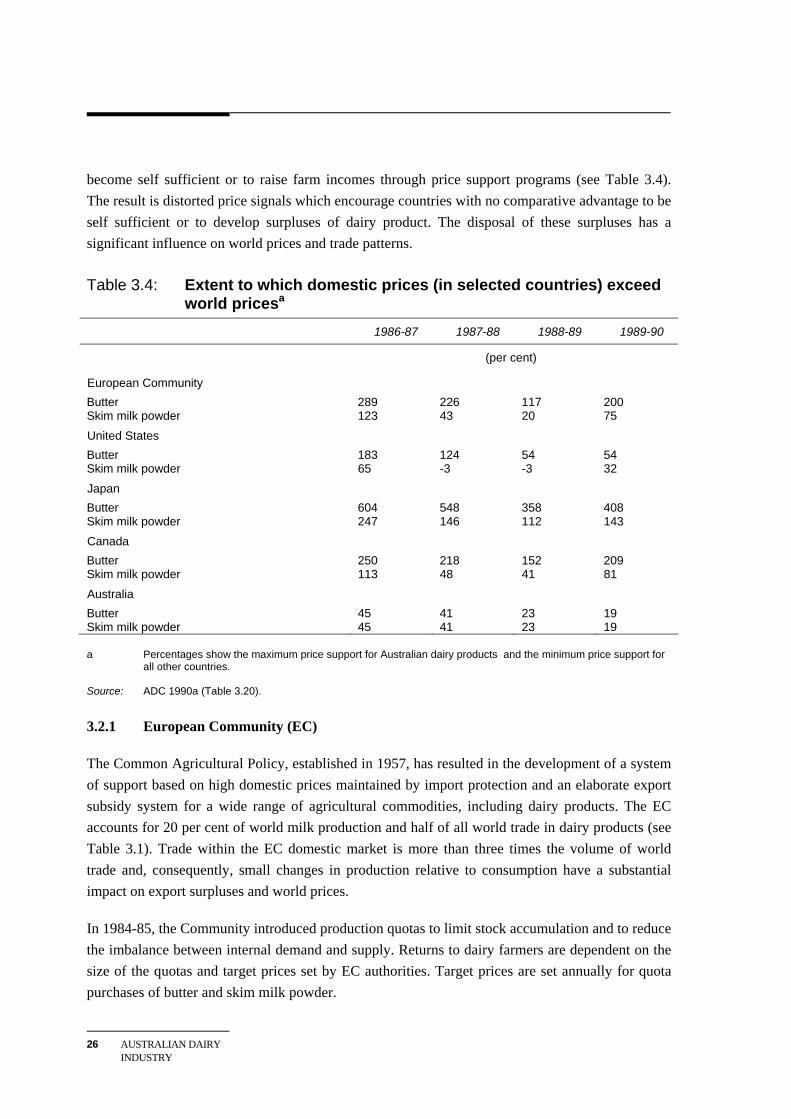
become self sufficient or to raise farm incomes through price support programs (see Table 3.4). The result is distorted price signals which encourage countries with no comparative advantage to be self sufficient or to develop surpluses of dairy product. The disposal of these surpluses has a significant influence on world prices and trade patterns.
Table 3.4: Extent to which domestic prices (in selected countries) exceed world pricesa
1986-87 1987-88 1988-89 1989-90
(per cent)
European Community Butter 289 226 117 200 Skim milk powder 123 43 20 75
United States Butter 183 124 54 54 Skim milk powder 65 -3 -3 32
Japan Butter 604 548 358 408 Skim milk powder 247 146 112 143 Canada Butter 250 218 152 209 Skim milk powder 113 48 41 81
Australia Butter 45 41 23 19 Skim milk powder 45 41 23 19 a Percentages show the maximum price support for Australian dairy products and the minimum price support for
all other countries. Source: ADC 1990a (Table 3.20).
3.2.1 European Community (EC)
The Common Agricultural Policy, established in 1957, has resulted in the development of a system of support based on high domestic prices maintained by import protection and an elaborate export subsidy system for a wide range of agricultural commodities, including dairy products. The EC accounts for 20 per cent of world milk production and half of all world trade in dairy products (see Table 3.1). Trade within the EC domestic market is more than three times the volume of world trade and, consequently, small changes in production relative to consumption have a substantial impact on export surpluses and world prices.
In 1984-85, the Community introduced production quotas to limit stock accumulation and to reduce the imbalance between internal demand and supply. Returns to dairy farmers are dependent on the size of the quotas and target prices set by EC authorities. Target prices are set annually for quota purchases of butter and skim milk powder.

THE WORLD MARKET FOR DAIRY PRODUCTS
27
Prices for other dairy products adjust freely within domestic markets in line with the returns that are guaranteed for butter and skim milk powder producers. An over-supply of dairy products has continued to burden the Community despite the quotas that have been in place for over five years. This problem has been accentuated by a decrease in consumer demand for milk fats in the Community.
In 1989-90 approximately 20 million tonnes of milk were disposed of by the EC authorities. This quantity may be viewed as surplus to domestic requirements at the high internal support prices. Much of the surplus was either disposed of through subsidised export sales or through intervention stockpiling of butter and skim milk powder by EC authorities. The EC provides subsidies on exports of dairy products equal to the difference between the supported EC market price and the average price received on world markets.
However, some 6 to 7 million tonnes of the surplus was disposed of through subsidised domestic sales for purposes other than the manufacture of dairy products, such as industrial uses and animal feed. If not disposed of in this way, the product would have been placed on world markets and further disadvantage existing exporters. The quantity involved was similar to the combined exports of Australia and New Zealand (see Table 3.1).
On 24 May 1991 the EC Agriculture Ministers agreed on the price and supply arrangements for agricultural products to apply in 1991-92. Changes to the EC dairy industry included a compulsory 2 per cent reduction in the 1991-92 production quotas for EC dairy farmers. It is proposed that quotas will be reduced by a further 2 per cent during 1992-93, followed by 1 per cent reductions in the subsequent two years. However, it is proposed to reallocate 1 per cent of the 1992-93 reduction to: dairy farmers producing less than 200 000 litres per year; farmers who had previously been excluded from holding a production quota; and to farmers in areas of pasture based milk production. The 3 per cent real reduction over the period 1992-93 to 1994-95 is to be achieved through a quota buy-up program financed from the budget for the Common Agriculture Policy.
3.2.2 United States of America (US)
The US Government has an objective of supporting the incomes of US dairy farmers through price supports for milk and manufactured dairy products. The current Farm Bill stipulates that the Commodity Credit Corporation must purchase domestic surpluses of butter, cheese and skim milk powder at specified support prices. Provisions exist for the support price to fall if the Corporation purchases of product exceed 2.25 million tonnes (milk equivalent) of product in a specific year.
US domestic prices are maintained using a system of bilateral import quota arrangements to balance domestic supply and demand. Import quotas are of two types: historical quota which must be exercised through a prescribed importer and supplementary quota which can be exercised through any US licensed importer.

28 AUSTRALIAN DAIRY INDUSTRY
During the 1980s, US supply tended to remain in excess of commercial demand and large intervention purchases occurred. In this period the US was a major exporter of skim milk powder, relying upon export subsidies and food aid programs to dispose of domestic surpluses.
3.2.3 Japan
Japan produces approximately 80 per cent of domestic dairy product requirements. Farm gate prices for milk used in manufacturing are fixed by regulation, while farm incomes are supported by direct deficiency payments. The wholesale prices for manufactured products are controlled by the Japanese Livestock Industry Promotion Corporation. Access to the regulated price is dependent on farmers and their co-operatives abiding by government determined production quotas.
Japan is a significant net importer of certain dairy products, mainly cheese and milk powder for use as animal feed. Imports of cheese are not limited by quantitative restrictions, but are subject to a 35 per cent tariff if the cheese is not processed according to local content requirements. The Promotion Corporation manages wholesale prices by use of the regulations which apply to imports of butter and skim milk powder and by the operation of stockpiles when prices are below target levels.
3.2.4 Canada
Canada's policy of self sufficiency in dairy products and price support for dairy farmers has isolated its producers almost completely from world markets. Milk production of each farmer is controlled using a system of production quotas so that domestic output approximates domestic consumption. To protect the internal price structures, imports of dairy products other than certain cheeses and casein are permitted only in response to a demonstrated domestic shortage. Any surpluses of dairy product are sold on the world market using export subsidies.
3.2.5 Union of Soviet Socialist Republics (USSR)
The USSR is the largest dairy producer in the world (see Table 3.1). As the major importer of butter, it can also have a significant influence on the world market for dairy products (see Table 3.2). Its purchases of butter take place on an irregular basis, usually at prices below prevailing market levels. Sales to the USSR occur at subsidised levels and help remove large surpluses from the world butter market (see Section 3.5).
3.2.6 New Zealand
In 1989 New Zealand exported over 75 per cent of total milk production, compared to 25 per cent for Australia. New Zealand is the second largest supplier of dairy products to the world market, with 15 per cent of total sales in 1989 (see Table 3.1). All dairy product exports are controlled by the New Zealand Dairy Board. The Board establishes price differentials between dairy products to encourage dairy companies to produce the necessary mix of products.

THE WORLD MARKET FOR DAIRY PRODUCTS
29
The domestic market for dairy products is influenced by the Dairy Board's role in setting ‘guide’ prices for all major dairy products. The ‘guide’ price is equivalent to the anticipated average export price for a particular product. Dairy companies are required to obtain this price for all domestic sales. The domestic seller has to pay a levy to the Board if the realised export price by the Board is lower than the ‘guide’ price. Alternatively, the Board must pay a refund to the domestic seller if the realised export price is higher than the ‘guide’ price. This arrangement has the effect of equalising the returns from domestic and export sales for dairy companies.
In comparison to Australia, New Zealand has substantially greater access to bilateral quota markets. New Zealand exports 55 000 tonnes of butter to the European Community at prices double the world market price, and almost 9 500 tonnes of cheese to the European Community and 17ÿ400 tonnes of cheese to the United States. The quota arrangements for the export of butter to the Community are to be reviewed at the end of 1992. The higher price received from quota markets increases average export returns of New Zealand above world traded prices. The effect of this also increases domestic prices above prevailing world prices through the ‘guide’ price mechanism.
3.3 Australia - New Zealand Closer Economic Relations Trade Agreement
Trade in dairy products between Australia and New Zealand is subject to the provisions of the Australia-New Zealand Closer Economic Relations Trade Agreement (ANZCERTA and subsequent instruments.
This treaty was established in January 1983 to encourage the development of ‘free and fair’ trade in all goods between Australia and New Zealand. The aim of the agreement was to eliminate barriers to trade between the two countries and foster the establishment of a free trade area.
For the period from January 1983 to June 1990, trade in dairy products was subject to the provisions of a Memorandum of Understanding which was attached to the treaty. The Memorandum was negotiated by the dairy industries in both countries and provided for regular consultations between them. It also stipulated that New Zealand exports of cheese to Australia could not increase at a faster rate than the increase in the size of the Australian cheese market.

30 AUSTRALIAN DAIRY INDUSTRY
During the review of ANZCERTA in 1988, a Protocol was negotiated covering the advancement to 1 July 1990 of free trade in all products. This Protocol was supported by an exchange of letters between the Australian Minister for Primary Industries and Energy and the New Zealand Minister for Agriculture and Fisheries in relation to trade in dairy products. The exchange of letters took effect from 1 July 1990 and extends to 31 December 1992. It stated that the Governments of Australia and New Zealand expected trade to be conducted on the basis of a number of understandings. In particular, these understandings included:
Both countries will work towards the development of a single and integrated market for dairy products,
consistent with the principles of free trade and fair competition contained in the ANZCERTA;
From 1 July 1990, in keeping with the above objective, the New Zealand dairy industry will be expected to
act, in relation to sales into Australia, in the same way as it does when selling in the New Zealand domestic
market;
From 1 July 1990, concerns arising in either country as to the pricing and other marketing practices of the
dairy industries in each other's markets, should be addressed through the respective competition and trade
practices legislation ... (Department of Foreign Affairs and Trade 1988, p. 13)
The exchanged letters also seek to encourage ongoing industry consultation and provide for inter-governmental consultations if required. In commenting on the arrangements set out in the letters of exchange, the Australian Dairy Farmers' Federation stated that:
Since the new agreement came into operation in July 1990, there has not been any substantial evidence that
the New Zealand Dairy Board has been unfairly trading into the Australian market. (Submission 4, p. 47)
However, the Victorian Government noted that:
... the extensive powers of the New Zealand Dairy Board (NZDB) should be examined against the trade
practices and competition laws that apply to dairy trade between Australia and New Zealand. The question
that needs to be addressed is that, given the unique powers of the NZDB, can fair competition exist between
the NZDB and Australian dairy companies. (Submission 34, p. 14)
Controls over the misuse of market power in trans-Tasman trade are examined in Section 5.8.
3.3.1 Dairy product trade between Australia and New Zealand
The potential for trade in dairy products between Australia and New Zealand (according to the provisions of the Protocol) would appear limited. The industries of both countries have similar technical advantages in the production of milk and manufacture of dairy products (see Section 2.6). Both countries have favourable climatic conditions and use low-cost pasture production techniques.

THE WORLD MARKET FOR DAIRY PRODUCTS
31
The on-farm costs of producing milk and the costs of product manufacture are similar. Trade in dairy products is therefore influenced largely by the costs of freight across the Tasman and by domestic prices for dairy products in both countries.
Shown in Tables 3.5 and 3.6 are details about the quantity and value of exports from New Zealand to Australia, and from Australia to New Zealand. The respective shares of exports to the other country relative to total exports in 1989-90, were 1.4 per cent and 1.2 per cent. Because of high transport costs and technical difficulties, there is no trade in fresh milk and only limited trade in short-life dairy products. Trade occurs mainly in long-life products, especially cheese from New Zealand to Australia.
Table 3.5: Australian imports of dairy products from New Zealand
1986-87 1987-88 1988-89 1989-90
('000 tonnes) Milk concentrated or sweetened 586 534 618 1 128 Milk powders 1 973 2 361 3 142 2 305 Whey 233 214 135 368 Butter 5 50 305 1 041 Cheese 7 020 8 297 8272 8 924 Other 0 338 280 355
Total Value ($'000)a 22 411 28 738 33 228 42 994
Share of total New Zealand exports (per cent) na 1.3 1.2 1.4
a $A fob New Zealand port of shipment. Source: ABS 1990b.
Table 3.6: Australian exports of dairy products to New Zealand 1986-87 1987-88 1988-89 1989-90
('000 tonnes) Milk concentrated or sweetened 122 371 309 377 Milk powders 2 138 217 1290 Whey 6 17 141 64 Butter - 5 50 2 000a Cheese 144 138 104 128 Other 167 - 4 57
Total Value ($'000)b 823 1 127 1 346 8 384
Share of total New Zealand exports (per cent) 0.1 0.2 0.2 1.2
a Butter sold to the New Zealand Dairy Board for on-shipment to third country markets. b $A fob Australian port of shipment. Source: ABS 1990a.

32 AUSTRALIAN DAIRY INDUSTRY
Cheese imports into Australia have increased by around 22 per cent over the four years to 1989-90 (see Table 3.5). New Zealand cheese as a proportion of total cheese imports into Australia has increased from approximately 35 per cent in 1985 to 43 per cent in 1990. Despite this growth, New Zealand imports held less than 7 per cent of the Australian domestic cheese market in 1989-90.
3.3.2 Impact of New Zealand imports on Australian dairy marketing arrangements
As discussed in Chapter 5, the Commonwealth marketing arrangements seek to raise prices for dairy products in Australia by subsidising exports. This has the effect of increasing the attractiveness of the Australian market to potential exporters, particularly New Zealand exporters given their close proximity. In the absence of government involvement in the Australian domestic market, there would be little incentive for New Zealand to export to Australia. Since the costs of producing dairy products are similar, and significant shares of total production are exported, prices for dairy products in both countries would be about the same and determined largely by world traded prices. However, the higher domestic price for dairy products in Australia provides New Zealand (and other exporters) with the opportunity to offset the cost of transport and to obtain a greater return from Australia compared with other export markets.
If there were an increase in New Zealand exports to Australia, more Australian dairy products would be placed on to the world market. Given that there is a limited sum of money that can be used to subsidise Australian exports under the current arrangements, the increased imports will reduce the per tonne subsidy which can be paid on Australian exports (see Chapter 5). In turn, this would reduce the extent by which prices for dairy products can be increased on the Australian domestic market and the attractiveness of it to New Zealand exporters. Thus, it may not be in the interests of potential exporters to Australia to expand their market share indefinitely but, rather, to set prices at or near Australian prices and limit the quantity exported so that Australian domestic prices are not undermined.
Evidence presented by the Australian Dairy Corporation indicated that the New Zealand Dairy Board is behaving in this way. Based on the Board's domestic (guide) price for cheddar cheese of $A2710 per tonne, plus shipping costs of $A296, the landed price in Australia is $A3006 compared with an estimated Australian price of $2900. In other products the landed price is either equivalent to, or slightly below, the Australian price (Submission 17, p. 37).
Imports from New Zealand (and other countries) will result in some of the benefits intended for Australian dairy farmers under the Commonwealth arrangements being realised by New Zealand farmers. The Australian Bureau of Agricultural and Resource Economics has modelled the medium-term transfers that would occur if the market support payments were maintained at 1989-90 levels. The results show that: New Zealand farmers would gain $33 million in revenue transfers; Australian producers would lose $30 million; and Australian consumers benefit by $31 million through access to lower priced New Zealand products (ABARE 1991c, p. 32).

THE WORLD MARKET FOR DAIRY PRODUCTS
33
If the potential for New Zealand farmers to benefit is to be minimised, there is a limit to the extent by which Australian domestic prices can be increased above world traded prices. Assuming that New Zealand is complying with the understandings covering trade in dairy products with Australia, the limit will be determined largely by the cost of trans-Tasman shipping; in the case of cheese, this cost represents around 11 per cent of the landed value in Australia. In addition to these shipping costs there are substantial handling, distribution and marketing costs within Australia for New Zealand products. Taken together, these costs would account for most of the 19 per cent price differential reported in Table 3.4. Provided the increase in Australian domestic prices above world traded prices is less than the cost of shipping, distribution and marketing there would be little incentive for New Zealand to export to Australia.
At present, the trans-Tasman shipping arrangements are being assessed and monitored in preparation for review at the 1992 general review of ANZCERTA (Joint-Australian and New Zealand - Ministerial Statement 1991). To the extent that freight rates are reduced as a result of this review, the ability of Australia to raise artificially domestic dairy product prices would also be reduced.
3.4 Multilateral Trade Negotiations
The current round of Multilateral Trade Negotiations under the General Agreement on Tariffs and Trade (GATT) is the first to include explicitly the government programs affecting agricultural trade between member countries; the Agreement does not currently cover agricultural trade. At the commencement of the negotiations, known as the Uruguay Round, in October 1986, the aim of member countries was to achieve greater liberalisation of agricultural trade by reducing or eliminating import barriers, production and export subsidies, and the constraints imposed by sanitary and phytosanitary regulations. The negotiations were to have been completed by December 1990.
Several proposals to liberalise world agricultural trade have been considered during the Uruguay Round. The first was a seven point plan put forward by Australia in January 1987 (Commonwealth of Australia 1987). This plan sought an early halt to increased subsidies and a reduction in the gap between administered domestic prices for agricultural products and those prevailing on world markets. The United States put forward an alternative proposal in July 1987 which sought to phase out over 10 years all import barriers and subsidies which affect international trade in agricultural commodities.
34 AUSTRALIAN DAIRY INDUSTRY
The United States proposal was rejected by the European Community in October 1987. Instead, the Community proposed a two stage strategy. The first stage involved ‘balancing’ the world markets for dairy products, sugar and cereals through a market sharing arrangement between major exporters. For the second stage it was proposed to reduce gradually the level of government price support to farmers and to replace that support with direct income grants.
At the initiative of Australia a coalition of 13 agricultural exporters, the Cairns Group, was formed in August 1986. On behalf of the Cairns Group, the Prime Minister of Australia presented a further proposal for agricultural trade reform in October 1987. This proposal was similar to that of the United States and called for an early reduction in subsidies, trade barriers and stock management.
The Uruguay Round covering trade in all goods and services stalled in December 1990 following the inability of parties to agree on terms for liberalising world agricultural trade. Many of the differences inherent in the original proposals remained unresolved. In particular, the parties failed to agree on binding commitments to liberalise trade in respect of internal support, market access and export subsidies.
The negotiations resumed in February 1991 following the agreement of parties to make binding commitments in these three areas to liberalise world agricultural trade (Minister for Trade and Overseas Development 1991). Technical discussions are proceeding to enable an agreement to be reached but no firm date has been set for such an agreement; the future for agricultural trade reform is uncertain. Even if a general agreement is reached, it will still be necessary for member countries to negotiate specific arrangements covering world trade in dairy products. However, proposals by the European Commissioner for Agriculture and Rural Development (Mr MacSharry) to reform the Common Agricultural Policy may facilitate the liberalisation of world trade. The proposals include a ceiling on the budget for agriculture, reduced milk production quotas, land diversion, and direct income support instead of price support.
If an agreement is reached in the Uruguay Round, there are likely to be implications for the type of assistance arrangements that Australia could provide to its dairy industry. Currently a major form of assistance is through export subsidies, funded by the market support levy, under the Commonwealth arrangements (see Chapter 5). The use of such subsidies may contravene future obligations of Australia following the completion of the Uruguay Round. As stated by the Department of Foreign Affairs and Trade:
In considering the assistance arrangements for the industry from after 1991 the Commission should note that
the Code [governing export subsidies] is expected to be changed in the Uruguay Round of Multilateral Trade
Negotiations and to involve additional and more stringent obligations than those in the Code at present.
(Submission 10, p. 4)

THE WORLD MARKET FOR DAIRY PRODUCTS
35
3.4.1 Effects of liberalising world agricultural trade
In the event that world agricultural trade were liberalised, it is likely that the Australian dairy industry would be a significant beneficiary. Such an outcome is indicated by several recent studies into world agricultural trade.
Horridge, Pearce and Walker (1990) have assessed the implications for Australian agricultural industries of agricultural trade reform in GATT member countries, by linking a world food trade model with the ORANI model of the Australian economy. The results indicate that, if complete world trade liberalisation occurred, world dairy product prices would increase by 32 per cent and the value of Australian dairy product exports would rise by approximately 40 per cent in the short term.
The OECD has simulated various reforms to the dairy policies of OECD countries (OECD 1991). The Ministerial Trade Mandate Model was modified to represent the OECD dairy policies and their effects on the supply of, demand for, and trade in milk and dairy products. The simulations included a ten per cent reduction in market price support in non-quota countries, combined with a ten per cent reduction in milk quotas in countries with production restrictions. The results indicate that, in the medium term, world dairy product prices would rise by 27 per cent and Australian net exports would increase by 18 per cent as a result of these reductions.
These findings highlight the potential benefits to the Australian dairy industry from liberalising world agricultural trade.
3.5 International Dairy Arrangement
The International Dairy Arrangement was established under the auspices of the GATT during the Tokyo Round of multilateral trade negotiations (1973-79). Its main objective is:
... to achieve the expansion and ever greater liberalisation of world trade in dairy products under market
conditions as stable as possible, on the basis of mutual benefit to exporting and importing countries. (GATT
1973)
Australia and other major exporting countries, except the United States, are members of the Arrangement; the United States withdrew in 1985. Signatories to the Arrangement agree to observe minimum prices established for exports of dairy products including cheese, curd, butter, cream and casein. The minimum prices are reviewed annually. In Australia, the minimum prices are enforced by the Australian Dairy Corporation under the provisions of the Dairy Produce Act 1986 (see Section 6.5).

36 AUSTRALIAN DAIRY INDUSTRY
Provisions exist under the Arrangement for the minimum prices to be suspended `in order to remedy difficulties which observance of minimum prices could cause certain participants' (GATT 1973, p. 179). Such a suspension (derogation) was granted in late 1990 to allow sales of butter from members to the USSR at below minimum prices and, by doing so, to help clear butter stocks (GATT 1990).
By including minimum price provisions, the Arrangement is seeking to provide some discipline over the conduct of world trade in dairy products - the ability to grant derogations notwithstanding. As stated by the Australian Dairy Corporation:
... the prospect of essentially futile subsidy wars and the desire to minimise subsidy costs have caused a number
of ... countries to seek "managed" international markets. The GATT International Dairy Arrangement is one such
mechanism. Countries such as Australia and New Zealand have joined the International Dairy Agreement in the
hope that it might be used to moderate the impact on the international market of distortive domestic policies.
(Submission 17, p. 8)
Participants in the inquiry have made little comment on whether Australia should remain in the Arrangement. The Australian Dairy Industry Council indicated that the Australian industry has reached agreement that Australia should withdraw from the Arrangement but notes in its submission that:
... it has an ambivalent attitude toward continued Australian membership of the International Dairy Arrangement.
A resolution for withdrawal was passed in 1987, but is not being acted upon for the time being. (Submission 16,
p. 46)
If the current Uruguay Round were to be successful in liberalising world agricultural trade, the need for the International Dairy Arrangement would cease. In contrast to the Arrangement, the Uruguay Round negotiations are directed at the underlying cause of distortions in world trade, such as restricted access to markets, and production and export subsidies. The Arrangement, however, is seeking to deal only with the symptoms of those causes by trying to enforce minimum world prices. As illustrated by the recent derogation in respect to butter sales to the USSR, such prices do not address the underlying cause of the increased butter stocks which gave rise to the need to grant the derogation in the first place.
In the event that agreement is not reached in the Uruguay Round to liberalise world trade, the International Dairy Arrangement may continue to provide some discipline over world trade in dairy products. However, the Commission does not view the Arrangement as a long-term solution to the distortions (created mainly by subsidies and import restrictions) in the world market for dairy products. Its preferred approach is for the Government to pursue, as it already has, the liberalisation of world agricultural trade through the Uruguay Round.

THE WORLD MARKET FOR DAIRY PRODUCTS
37
3.6 Distorted world traded prices: implications for providing assistance
World traded prices for dairy products are depressed by import barriers, and export and production subsidies of other major exporters, especially the European Community and the United States. As noted earlier (Section 3.4.1), if barriers to trade were reduced in the order of 10 per cent, dairy product prices are estimated to increase by around 27 per cent.
The Australian dairy industry argues that it should continue to be assisted for as long as dairy product exports from the European Community and the United States are subsidised, and that assistance should be by the current market support arrangements which are discussed in Chapter 5.
The industry acknowledges that assistance cannot be provided indefinitely, and asserts that the interventionist policies of foreign governments, which necessitate the assistance it receives, are going to be wound back. The argument follows that if there is likely to be a significant change in the environment facing Australian dairy producers, the removal of existing support structures may reduce the overall efficiency of resource allocation in Australia as it would encourage unnecessary structural adjustment within the industry over the short to medium term. The Australian Dairy Farmers Federation states the argument as follows:
Any change in the CAP will lead to a freer world market and, hence, significant price increases on that
market. Australia is in a very strong position to take advantage of those changes in the CAP and the world
market because of its technical efficiency in the production of dairy products. There must be a continuation of
a support mechanism to ensure the Australian dairy industry remains viable against current corrupted world
markets, so that it would be in a continuing strong position to take advantage of the changes which will
inevitably occur. (Submission 4, p. 14)
One issue which is not addressed by the industry is the time period over which such assistance is being sought. The domestic policies of the European Community and the United States have been depressing world prices for dairy products for over two decades. Although there are some prospects for reform, as indicated by the consideration of agricultural trade in the Uruguay Round and the recent proposals to reform the Common Agricultural Policy, no agreements have been reached that would result in significant and quick reform of the world dairy market. Any specific reform covering trade in dairy products is likely to be implemented gradually over a number of years.
The United Dairyfarmers of Victoria agrees that there is unlikely to be any significant change in the policies of the major exporters within the next five years:
... within the medium term of around 5 years there is no possibility of the EC significantly reducing export
subsidies, domestic price support or high tariffs on imports of dairy products.

38 AUSTRALIAN DAIRY INDUSTRY
The UDV is of the view that any reform that may take place in reducing support to the dairy industry in
Europe will be marginal and will be implemented over a long period. (Submission 9, p. 28)
The current US Farm Bill covers the period 1990 to 1995 and also would act as a restraint on achieving significant trade reform during that period. As stated by the Australian Bureau of Agricultural and Resource Economics:
The prospects for a reduction in dairy support policies in the United States also seem dismal. The 1990 US
farm bill will continue to guarantee a minimum producer price for domestic milk production at US$10.10/cwt
for the next five years. (Submission 28, p. 12)
The possibility that policy reforms will occur in the short term was raised by the Australian Dairy Industry Council:
... we are very strongly of the view that they are going to happen in the next couple of years and they will be
significant. (Public hearing transcripts, p. 9)
The view that the major overseas dairy producing countries will eventually have to reform their costly support policies has been expressed at least since the early 1970s. Justifiably, opinions will vary as to how imminent and extensive reform is likely to be. Not at issue, however, is the cost to the Australian community of continuing existing support measures to its own dairy industry. Current assistance arrangements compel Australian consumers to subsidise dairy production. A consequence is that the Australian dairy industry is larger, and uses more resources, than it would in the absence of the arrangements. These issues and the extent to which the dairy industry is assisted compared to other activities in Australia are explored further in Chapter 8.
The costs of continuing current policies in Australia have to be weighed against the gains that will flow from phasing down dairy industry assistance to a level more akin to that afforded other Australian industries. To delay reform of dairy industry arrangements is to delay receipt of the benefits to the wider community.
Keeping resources in dairying against the day when world dairy markets are liberalised is a risky strategy. The industry argues that delaying reform would be worthwhile so as to avoid structural adjustment costs that would be subsequently rendered unnecessary as distorted markets are opened. If the dairy industry can see some net return to holding on, there are no impediments to its doing so. But to expect the community to continue high levels of support pending reform in overseas countries could prove very costly.
The potential gains from avoiding any readjustment costs are doubtful. As discussed in Chapter 2, the dairy industry has demonstrated a capacity to adjust its output and product mix in response to changing circumstances. Moreover, it is not clear that the specific resources displaced initially from the industry would be the same resources flowing back once any reforms were implemented overseas. Governments are in no better position than industry itself to anticipate the particular deployment of resources most appropriate to the opening of overseas dairy markets.

THE WORLD MARKET FOR DAIRY PRODUCTS
39
And the longer the period over which reform overseas is implemented the greater the costs to the Australian community of continuing current levels of support to its dairy industry.
Industry assistance predicated on predetermined notions about desirable industry structures, or particular developments in world markets, usually end up imposing costs on the community. Recent developments in the Australian wool industry amply illustrate this point. The policy goal for the dairy industry is to set in place arrangements which enhance the ability of producers to adapt to changing market circumstances (both domestically and abroad) and maximise their contribution to national wealth.
As the Prime Minister noted in the Government's March 1991 Industry Statement:
However much our competitors might bend and break the principles of fair trade, our own self interest is
served by a steadfast refusal to return to the days of protectionism. (PM&C 1991, p. 1.7)
Furthermore, to continue to provide assistance by way of export subsidies may compromise the position of Australia and the Cairns Group in the Uruguay Round. It is hard to be credible in requesting other countries to stop using export subsidies whilst Australia continues to do likewise, albeit at a much reduced rate. The New Zealand Dairy Board drew attention to the potential for compromise:
The payment of subsidies (export support payments) ... is contrary to the position Australia has undertaken
with New Zealand and other members of the Cairns Group in the Uruguay Round of multilateral trade
negotiation. A major objective in these negotiations, and in other efforts to reform and improve the conditions
for international dairy trade, has been the disciplining and removal of the distortive effects of export
subsidies. The effects of subsidies paid on exports from Australia may be proportionately less than those paid
by other larger exporters but they are nonetheless a significant source of distortion, compounding the most
serious problem that the Australian and New Zealand dairy industries face internationally. (Submission 3, p.
5)
To further support its position that the Australian dairy industry should continue to receive assistance, the Australian Dairy Industry Council argued that the assistance was a means of applying budgetary pressure on the EC and US to reform their domestic policies:
... withdrawal of Australia from export trade in manufactured dairy products would have the effect of
reducing the budgetary pressure on the EC and US to reduce assistance to its dairy industry, which accounts
for a large share of the total cost of their agricultural support. Maintaining some support to the dairy industry
so that some exports are maintained leaves Australia with one of the few weapons that can be used effectively
in pursuing its objectives in international trade negotiations on assistance to agricultural products, with
potential flow-on effects to other important agricultural commodities as well as the dairy industry.
(Submission 16, p. 45)
The Australian Dairy Corporation also maintains that any reduction in support to the Australian dairy industry would:

40 AUSTRALIAN DAIRY INDUSTRY
... reduce the internal pressures for reform faced by the EC and other major producers as it would increase
their access to international outlets for their surplus output. Such an outcome would undermine the Australian
government's ability to promote reform through international forums such as MTN. (Submission 62, p. 19)
The Commission considers that the potential for Australia to increase budgetary pressure for reform in the European Community and United States would be limited. The greater share of total milk production exported, the much smaller Australian domestic market, and the larger size of the dairy industry relative to other Australian industries, all indicate that the ability of Australia to subsidise its exports would be less than the ability of the Community. This is illustrated by the relative size of the subsidies of the Community compared with those paid by Australia (see Table 3.4). By continuing to subsidise exports, Australia is more likely to impose greater costs on itself, including loss of credibility in international trade negotiations, than cause budgetary pressures for reform in the European Community and the United States.
3.7 Conclusion
The international environment confronting the Australian dairy industry is difficult and volatile. This reflects the impact on world traded prices of the domestic policies of the European Community and United States in particular, the residual nature of the world dairy market, and Australia's position of price taker in that market. The prospects of the present Uruguay Round of multilateral trade negotiations to improve the world trading environment in the foreseeable future are doubtful.
The Australian dairy industry's performance in this external environment will depend on its flexibility and adaptability to changing market opportunities. In turn, its ability to respond to these opportunities will be influenced by the domestic dairy marketing arrangements. The State arrangements for fresh milk are discussed in the next chapter, followed by the Commonwealth arrangements applying to manufacturing milk in Chapter 5.

STATE ARRANGEMENTS FOR MARKET MILK
41
4 STATE ARRANGEMENTS FOR MARKET MILK
The provision of market milk is one of the most regulated activities in Australia.1 In each State there are regulations controlling various aspects of production, processing, distribution, prices, quality, and promotion of market milk. Many in the dairy industry recognise problems associated with State regulations. Acceptance of the need for reform is reflected in current reviews of regulations in Queensland, South Australia and Tasmania, and the consideration of options for reform by governments in New South Wales and Victoria. As from 1 July 1991, Western Australia ceased the practice of setting recommended retail prices, thereby completing the deregulation of market milk prices down to the prices paid by processors. A proposal for nationwide reform of market milk arrangements, known as the ‘Ballarat Agreement’, has been adopted by the Australian Dairy Industry Council.
The purpose of this chapter is to examine the need for, and the effects of, State regulation of the market milk sector.2 The aim is to develop a general approach rather than to address each set of State regulations individually. A detailed description of the regulations in each State is provided in Appendix C.
4.1 Regulating the supply and prices of market milk
The supply of market (or fresh) milk from dairy farms is controlled in each State to ensure adequate supplies of locally produced fresh milk throughout the year. Control is by either supply quotas, compulsory acquisition of all milk, price incentives or a combination of these. The supply control mechanisms of each State are supported by administratively set farm gate prices for market milk.
Retail prices for market milk are also determined administratively in all States except Western Australia. The objective is to maintain stable consumer prices for fresh milk. To help maintain these administered prices, Victoria has placed constraints on trade in market milk to ensure that it is
1 Market milk refers to milk consumed as fresh liquid milk and includes plain white milk, modified (low fat/high
protein) milk and flavoured milk. In some States, UHT milk and milk for fresh cream are also classed as market milk (see Appendix C).
2 Throughout this chapter, use of the word State should be taken as including the Australian Capital Territory. Northern Territory regulations are limited to health and safety issues.

42 AUSTRALIAN DAIRY INDUSTRY
sold at regulated prices if traded interstate. The supply and pricing arrangements for market milk are administered by the State dairy industry authorities.
4.1.1 Farm gate prices and supply quotas
Farm gate prices for market milk are set independently in each State; current prices are shown in Table 4.1. On average, the prices for market milk in 1989-90 were around 60 per cent higher than manufacturing milk prices (see Table 2.9). Farm gate prices are reviewed every three to six months by the State dairy authorities. They are adjusted mainly for changes in the cost of producing milk, but also take into account the threat of interstate trade in fresh milk created by the higher farm gate price relative to manufacturing milk prices.
The mechanisms for ensuring year round supplies of market milk differ. Price incentives are used in Victoria, South Australia and Tasmania. For Victoria and Tasmania, the incentives consist of the higher price for market milk and an additional payment for market milk produced during the winter months. The higher market milk price is the only incentive offered in South Australia to encourage farmers to produce out of season (see Section 4.7.1). The winter incentive is paid to offset the additional costs of producing milk out of season and to encourage farmers to produce milk in those months (see Section 2.5.1). These price incentives are augmented by compulsory acquisition powers in Victoria.
For Victoria and Tasmania, the higher price is shared between all farmers according to the proportion of the State's total milk production in each month which is used for market milk; an arrangement known as ‘equitable sourcing’. If, for example, 12 per cent of Victorian milk is used as market milk in January, all Victorian dairy farmers will receive the higher administered price (currently 38.3 cents per litre) for 12 per cent of their milk for that month.
A similar arrangement applies in the Adelaide metropolitan area in South Australia. However, because dairy farmers in the South East of the State do not have access to the higher priced Adelaide fresh milk market, a levy has been introduced on dairy farmers in the metropolitan supply area (see Table 4.1); the levy is imposed by legislation as a licence fee. Monies raised from the levy are transferred and distributed to dairy farmers in the South East; the transfer amounted to more than $9000 per farm in 1990-91.
The majority of milk produced by farmers in these three States is used for manufacturing purposes. In practice, they are paid a blended price for their milk which is the weighted average price for the quantity of milk sold at the market milk price (plus winter incentive) and the quantity of milk sold at the manufacturing price (see Table 2.9).
Supply Quotas
Supply quotas are used in New South Wales, Queensland, and Western Australia to ensure year round supplies of fresh milk. Although details of the arrangements differ in each of the States (see

STATE ARRANGEMENTS FOR MARKET MILK
43
Appendix C), the principles involved are the same. The quotas require farmers to deliver a specified quantity of milk over a defined period, for
Table 4.1: Prices and margins for one litre of plain fresh milka NSW VIC QLD b WA SA c TAS ACT
Prices Gross producer priced 40.12 38.31 44.82 42.84 41.14 40.33 36.25 Price to processor 48.98 46.29 48.16 49.76 46.01 47.02 39.99 Price to wholesale vendor minimum 73.97 64.04 - maximum 73.97 65.73 74.99 - 69.05 72.20 63.09e
Price to shop minimum 81.75 76.69 - 83.50 77.17 maximum 84.75 78.71 86.24 - 76.72 85.50 77.17 Retail price minimum 93.00 87.00 93.00 - 82.00 90.00 maximum 96.00 91.00 97.00 94.00f 94.00 97.00 90.00Home delivery price minimum 96.00 - 93.00 - 82.00 97.00 90.00 maximum -
Margins
Freight to processor 3.06 3.97 2.45 4.43 2.30 3.15 - Factory testing and handling 1.85 1.58 - 2.38 - 1.69 - Milk authority 3.95 2.43 0.89 2.54 0.53 1.85 3.74 South East Levy - - - - 2.04 - - Country freight - - - - - 0.93 - Processor margin minimum 24.99 17.75 - maximum 24.99 19.44 26.83 - 23.04 24.25 23.10g
Wholesale vendor margin minimum 7.78 12.65 - 11.30 12.81 maximum 10.78 12.98 11.25 - 7.67 13.30 12.81Shop margin minimum 11.25 10.31 6.76 - 5.28 12.83 maximum 11.25 12.29 10.76 - 17.28 11.50 12.83Home vendor margin minimum 22.03 - - maximum 32.03 h 22.01 24.95 24.80 29.14 a As at 5 August 1990 in Western Australia; 1 November 1990 in Victoria, South Australia, Tasmania, South East Queensland and the Australian Capital Territory; as at 11 January 1991 in New South Wales. b South east distribution zone only. c Metropolitan milk distribution zone only. d Refer to Appendix C for details of the price received by dairy farmers for fresh milk. e Weighted average for wholesale (retail outlets) and home vendors. f As from 5 November 1990 the Western Australian Dairy Industry Authority ceased to play a role in setting recommended retail prices. However, the major WA processors continued to publish recommended retail price information. g Weighted average margin paid to processors for sales made to retail vendors and home vendors. h Return to vendor is determined by market forces. Source: State dairy industry authorities.

44 AUSTRALIAN DAIRY INDUSTRY
example, every four weeks or a year; milk is compulsorily acquired in New South Wales. In return the farmer is paid the higher market milk price for that proportion of milk supplied under quota which is used as market milk; this proportion is determined by the total State quota allocated for the period that was required for market milk. Penalties apply for the failure to meet quota quantities and provide farmers with an incentive to produce in excess of quota requirements. However, farmers receive only the manufacturing price for milk not required for market milk purposes.
The higher price for market milk delivered under quota is designed to offset the increased costs of producing milk out of season. The supply quotas and penalties involved, and compulsory acquisition in New South Wales, ensure that adequate milk supplies are produced all year. Quotas provide far tighter control over fresh milk supplies compared with the price incentives offered in the other three States. The majority of milk produced in the quota States is used for fresh milk and, hence, the risk of supply shortfall during the off-season is greater. The quota arrangements virtually eliminate this risk.
Over the past five years, the supply quotas have been made transferable. Rather than being assigned to particular farms (land), the quotas are now traded through exchanges operated by State dairy industry authorities. This change, once fully implemented, should help ensure that lower-cost producers hold quota. The value of quota in a given period will be determined by the difference in returns for market compared with manufacturing milk, differences in production costs, and penalties applying to quota shortfall.
4.1.2 Processing and distribution margins
The regulated farm gate and retail prices for fresh milk mean that all other prices in the marketing chain are also administratively determined (except for Western Australia, home vending margins in Victoria, and vending margins for milk other than plain white milk in Tasmania). These prices determine the margins (that is, payment for services provided) for transport, processing, distribution, retailing and vending fresh milk. The current margins for these activities in the States are shown in Table 4.1. The margins are adjusted, mainly with reference to increases in the costs of undertaking the different activities, subject to the constraints imposed by the established farm gate and retail (consumer) prices.
4.1.3 Consumer prices
Retail prices for fresh milk are not adjusted with changing seasonal supplies. Rather, they are regulated and reviewed every three to six months by the State dairy industry authorities. Factors taken into account during the review by the authorities include movements in the Consumer Price Index; increases in the cost of producing, processing and distributing milk; the price of substitutes; and the constraint imposed by potential supplies of fresh milk from interstate. In some States, maximum and minimum retail prices are set; current retail prices are shown in Table 4.1.
STATE ARRANGEMENTS FOR MARKET MILK
45
Over the past ten years, retail prices for fresh milk have increased at a rate less than the Consumer Price Index (see Appendix B, Charts B.1 and B.2).
4.1.4 Milk distribution zoning and vending
The distribution of processed fresh milk has been tightly controlled in all States through the zoning of processors and vendors. These provide licence holders with exclusive rights to service a particular area or market.
In Queensland, for example, there is a system of processor franchising which gives exclusive access to certain areas to individual processors; seven such franchises have been allocated. In most States, milk vendors are attached to designated processors, and operate in restricted zones. The restricted access system also allows a capital value to accrue to the vending licence or franchise.3
However, over recent years, the regulations governing zoning have been relaxed, or are in the process of being removed, in Victoria, Western Australia, and Tasmania. Victoria, for example, reduced the number of wholesale distribution zones from 661 to 7 in 1986. Distributors can establish operations in any of the seven zones, but must be licensed and restrict their operations to those zones. As a result of the 1986 changes, processors are also allowed to service supermarkets directly instead of through wholesale distributors. In doing so, the processors pick up the vendor margin shown in Table 4.1.
The removal of most regulations over pricing and distribution of fresh milk beyond the farm gate for Victoria was recommended by the Public Bodies Review Committee in its 1989 inquiry into the Victorian Dairy Industry Authority (Public Bodies Review Committee 1989). The thrust of the Committee's recommendations were accepted by the Victorian Government. However, changes based on the recommendations are still to be implemented; the Victorian Government has just released (July 1991) a further discussion paper outlining a number of proposed changes for the pricing and distribution of milk after processing (see Section 4.6).
Tasmania has just announced an independent review of the ongoing deregulation of the State's fresh milk market system. The review will, among other things, assess the effects of deregulating the system beyond the farm gate. To date the deregulation has been mainly in the area of removing vending controls and recommended retail prices for all milk except plain white milk.
3 Because of the capital value of franchises and licences, moral hazard exists as public officials are in a position to grant
or withdraw franchises or licences. Such discretion can result in an allocation of processing or distribution rights which is not based on relative costs of providing services, with consequent losses to the whole community.

46 AUSTRALIAN DAIRY INDUSTRY
The need to dismantle the regulations governing the distribution of fresh milk has also been recognised in New South Wales, Queensland and South Australia. In New South Wales, the Government is currently considering an industry proposal to deregulate the pricing and distribution of milk beyond the farm gate (New South Wales Dairy Industry Conference 1990). Whilst in South Australia and Queensland, government reviews are current into these aspects.4 In the Northern Territory and some rural areas of Queensland, Western Australia and South Australia, zoning controls over the distribution of milk have never applied.
Vending
Retail vending is in general decline due to falling demand for services, despite the fixed zones and regulated margins (see Table 2.4).5 Home deliveries are no longer regarded as essential due to pasteurisation and the wider access of consumers to transport and refrigeration. Reflecting such developments, home vending margins are no longer set by regulation in Victoria with vendors able to determine their own delivery fees. New South Wales has also recently changed its regulations to allow retail vendors to charge a fee of up to 10 cents per delivery. Vending margins are now set only for plain white milk in Tasmania.
The decline in home vending has resulted in a loss of value of vending licences and vendors leaving the industry. Nevertheless, the existence of the zoning regulations and the associated capital value may be a constraint if State governments wish to remove the regulations. The removal of such regulations could greatly reduce or eliminate the capital value of vending licences and could raise questions concerning the liability of State governments for compensation.
4.1.5 Restrictions over interstate trade
The difference in the administered price for market milk and the price paid by manufacturers of dairy products, provides an incentive for interstate trade in market milk. Trade would normally take place if the difference in those prices were greater than the transport costs involved and if the milk concerned otherwise would have been sold for the lower manufacturing price. But if trade did occur, the administered price in the destination State would be undermined and there would be a reduction in the quantity of milk sold by farmers at the higher price in that State.
4 Respectively, the review by the Office of Regulation Review which reported to the South Australian Government in
March 1991 (see Government Adviser on Deregulation, South Australia, 1991), and the review by the Queensland Dairy Industry Review Committee, which completed its work in June 1991. As at 20 September 1991, the Committee's report had not been made public.
5 Milk vending encompasses home deliveries (retail vending) and distribution to retail outlets (wholesale vending). Some milk vendors undertake both of these activities. In Victoria wholesale distributors also operate and source milk directly from the processor for supply to retail outlets and home vendors.

STATE ARRANGEMENTS FOR MARKET MILK
47
Informal industry arrangements have acted to restrict interstate trade in market milk. In addition there are legal mechanisms to ensure that interstate trade in market milk either does not take place or takes place at prices consistent with regulated farm gate prices for market milk.
One mechanism is the market support revocation levy, known as the ‘comfort clause’, of the Commonwealth marketing arrangements which enables any State to take action to suspend the market support levy if the market milk arrangements of a State are being threatened by interstate supplies of fresh milk. The effect of the ‘comfort clause’ is to suppress interstate trade in market milk. This is discussed in Section 5.6 and Appendix E.
Related to the operation of the ‘comfort clause’ is the amendment, introduced in 1987, to Section 38 of the Victorian Dairy Industry Act 1984. This amendment was made following the sale of Victorian milk (by Midland Milk) into the Sydney market at less than prescribed prices and the consequent actions by New South Wales in invoking the ‘comfort clause’ (see Box 1, Appendix E). By invoking the ‘comfort clause’, the market support levy could have been suspended which would have stopped the market support payments on exports of dairy products (see Section 5.2).
Although the lower prices would have been beneficial for consumers of fresh milk and dairy products, such action could have been potentially costly and disruptive to the dairy industry. An alternative mechanism to the ‘comfort clause’ was required to prevent Victorian milk being sold at less than prescribed prices in the Sydney market; this mechanism was provided by the amendment to Section 38. The New South Wales-Victorian Milk Committee stated that the amendment was made ‘to preserve the orderly marketing of milk which was being threatened by the actions of Midland Milk’ (New South Wales-Victorian Milk Committee 1990, p. iv).
The amendment to Section 38 requires all milk processed into market milk within Victoria to be purchased through the Victorian Dairy Industry Authority at market milk prices, irrespective of the market to be serviced. The effect of Section 38 is to restrict interstate trade in fresh milk by increasing the price that Victorian processors have to pay (compared with the price of manufacturing milk) for milk to be traded interstate; that is, the section extends to interstate trade the price controls on market milk which apply to transactions within Victoria. The Victorian Government is also of the view that Section 38 acts to restrict trade in market milk (Public hearing transcript, p. 203).
Since Victoria amended Section 38, dairy farmers have requested similar legislation to be introduced by other States. The effect of similar legislation in each State would be to force processors in all States to pay a similar price for market milk and, thereby, remove the threat of interstate trade on the market milk pricing arrangements of the States. By removing that threat, the artificial separation between the market milk industries of the States, and between market and manufacturing milk, would be perpetuated. Additional restrictions on interstate trade would be created.

48 AUSTRALIAN DAIRY INDUSTRY
A number of submissions from industry organisations disputed that there were restrictions on interstate trade in market milk. The Australian Dairy Industry Council, for example, stated that it:
disagrees with the claim that interstate trade in market milk is restricted. The factual situation is that interstate
trade in market milk is already occurring. (Submission 48, p. 4)
Just because trade is occurring, this does not mean that the amount of trade is not being restricted. Trade in goods subject to tariffs still occurs, but the volume of trade is reduced because the price of the goods has been increased by the tariff. In this way the tariff acts to restrict trade. Similarly, by increasing the price that Victorian processors must pay for milk, Section 38 acts to restrict interstate trade in market milk by reducing the potential returns from such trade.
During the course of the inquiry, the Commission sought the advice of the Commonwealth Attorney-General's Department as to whether Section 38 of the Victorian Dairy Industry Act 1984 contravened Section 92 of the Australian Constitution (that ‘trade, commerce and intercourse among the States, ... shall be absolutely free’). In written advice to the Commission, the Department stated that in its opinion:
s.38 is wholly invalid; it is clearly contrary to s.92 of the Constitution in regard to sale, distribution and
manufacture of milk.
The full text of the Commission's request for advice and the Department's written response are at Appendix D of this report.
The Australian Dairy Industry Council, and a number of other dairy farmer organisations, challenged the usefulness of the advice obtained. The Council asserted that the advice could have been flawed because the Commission ‘may not have briefed [the Attorney-General's Department] on all the facts’ (Public hearing transcript, p. 43). The NSW Dairy Farmers' Association stressed that the briefing tendered, in any circumstance, had a significant bearing on the advice obtained. Instead of the questions asked by the Commission, the Association stated that the more appropriate questions to ask would have been:
Is it legal for the Victorian Government to legislate for such a requirement [for milk processed in Victoria for
market milk purposes to be accepted first by the Victorian Dairy Industry Authority]? and
Is it legal for the Victorian Government to empower the VDIA to set a price on milk it is required to accept?
(Submission 61, p. 2)
The industry organisations claimed that they had obtained other legal opinions which were of the view that Section 38 did not contravene Section 92, but these other opinions were not provided to Commission. The NSW Dairy Farmers' Association said:

STATE ARRANGEMENTS FOR MARKET MILK
49
The NSW industry attaches much importance to the need for s.38 type legislation to maintain pricing
stability, particularly over any phase out period, that it has sought and gained its own advice from the nation's
leading QC on this form of law. We have received a favourable advice but industry has determined it is not
prepared to table that advice at the present time. (Submission 61, p. 2)
The Australian Dairy Industry Council also dismissed the usefulness of the advice obtained by the Commission because it was no more than opinion (Submission 48, p. 5). Section 38 would remain part of the Victorian Dairy Industry Act 1984 until it was repealed by the Victorian government or found to offend Section 92 by the High Court of Australia.
The Commission has decided not to pursue further the question of the constitutionality of Section 38, or section 38 type legislation. The advice the Commission has received is clear enough. The basis for other legal opinions on the same, or on other hypothetical questions, has not been put forward for public scrutiny. In any case, as discussed in Section 4.5, efficiency costs are imposed on the Australian community as the result of restrictions on interstate trade in market milk, such as Section 38. These costs are imposed on the Australian community regardless of the constitutional validity of Section 38, or similar legislation. Because of these costs, the Commission will be recommending that all legislative and regulatory restrictions on interstate trade in market milk should be removed.
4.1.6 Reason for government involvement
Government involvement in the supply and pricing of fresh milk is extensive; it is far greater than for any other food item in Australia. Such involvement has been justified on the grounds that milk is a staple food which must be supplied fresh throughout the year at stable prices to consumers.6 The Queensland Dairyfarmers' Organisation said:
Governments throughout Australia and for that matter, all of the Western World, have reacted to pressures
from consumers for a secure and regular supply of quality fresh milk, by the introduction of regulations
governing supply management, quality and price. (Submission 11, p. 5)
However, from an efficiency viewpoint, the involvement of government can only be justified if there is something of exceptional merit about cow's milk for the human diet; and, if there is something preventing the development of an efficient commercial market for it and for dairy products.
The nutritional benefits of fresh milk, particularly as a source of protein and calcium, are widely known. However, milk is no more essential to a healthy diet than many other basic food items such as vegetables and fruit. These products are not subject to the stringent supply or price controls evident in the supply of market milk.
6 An illustration of the importance placed on fresh milk supplies is provided by the actions of the Victorian Government
in using its essential services legislation only on two occasions, in both cases to ensure milk supplies were available to the community.

50 AUSTRALIAN DAIRY INDUSTRY
Some participants argued that because milk production is highly seasonal, there may be insufficient milk produced during winter months if supply is not regulated. Many agricultural products are seasonal in production, and price fluctuations and occasional discontinuity in supply are characteristics of their markets. However, these markets are not assisted by government intervention similar to that applying to market milk.
If milk is as important to consumers as it is argued (by those who want to maintain regulations), then consumers would be prepared to pay higher prices for milk during months of high production costs. Should consumers not be prepared to pay higher prices during these months, and perhaps substitute UHT milk or milk powder for fresh milk, that would be evidence that they do not place as high a value on fresh milk consumption as do farmers and processors.
The Commission does not accept that there is a need for State governments to stabilize the price of milk to consumers. This position is supported by the South Australian Office of Regulation Review. In its recent Discussion Paper on future dairy marketing arrangements in that State, the Office argued that retail prices for milk should be deregulated:
Competitive forces within and outside the State, and from substitute products, will ensure that market milk
prices will remain at a reasonable level. (Government Adviser on Deregulation, South Australia, 1991, p. 19)
If retail prices were deregulated, more dynamic market responses would be possible as consumers would be given the opportunity to respond to changes in the price of milk due to, for example, changes in seasonal supply. In turn, the behaviour of consumers would provide clearer signals to farmers and processors on which to base their output, product development (including UHT) and pricing decisions.
Some dairy farming organisations argued that the involvement of government in regulating the supply and prices of market milk was justified to help rectify a perceived imbalance in market power held by dairy farmers. They asserted that, without such involvement of government, farmers could be exploited through alleged anticompetitive behaviour by processors, distributors, and supermarkets.
If market power abuse exists, the Commission considers that it should be addressed through competition law which applies equally to all activities. Such abuse should not be addressed through regulations which are specific to the dairy industry. This issue is discussed further in Section 5.8 dealing with the role of the Trade Practices Act.
4.2 Health and safety standards
Governments have a role in setting health and safety standards. Standards for milk and dairy products are set out in the National Food Standards Code, which has been adopted by each State. The Industries Assistance Commission commented on the effects of regulating food standards in its

STATE ARRANGEMENTS FOR MARKET MILK
51
report on the food processing and beverages industries (IAC 1989b). The issues covered in that inquiry will not be re-examined here.
To ensure health and safety, the State dairy industry authorities have been given the responsibility for testing milk throughout the production and distribution chain. However, it is not necessary for the authorities to carry out the sampling and testing. In Queensland and Western Australia, for example, some of these functions are carried by the State Department of Agriculture/Primary Industries under contract.
Other aspects of ensuring the public health and safety of dairy products may be carried out by different government agencies such as State Departments of Health. Rather than have the authorities carry out separate inspection of milk shops and dairy factories, cost savings may be realised if these departments already carry out similar functions for other products, or if they already inspect milk shops and dairy factories for other purposes.
The Commission considers that the task of ensuring public health and safety should be carried out by the government agency which can do the task at least cost. Selecting the least-cost agency would need to be examined on a State by State basis and is beyond the scope of this inquiry.
4.3 Quality standards
A common objective of the State dairy authorities is to provide consumers with high quality milk, an objective which is quite separate from ensuring dairy products meet health and safety standards. The quality of raw milk is controlled through samples taken at the farm gate for testing to ensure that fat, protein and other requirements are met. While these standards are for market milk, they also set the standards for manufacturing milk since samples for testing are taken of all milk at the farm gate, at which stage it is not known how the milk will eventually be used.
The regulation of milk product quality might be justified on the grounds that processors and producers would not provide products of a quality demanded by consumers in the absence of government intervention. However, normal commercial behaviour should provide incentives to develop and maintain appropriate quality characteristics to maximise market share or allow for quality premiums. The rapid growth in market share of low fat milk and cheeses, and calcium enriched milk, demonstrates the responsiveness of processors and manufacturers to the requirements of consumers.
A difficulty in regulating quality standards is that quality is a subjective concept �� what may be considered high quality by one consumer may not be by another. Quality standards may also prevent the supply of lower-priced products that are acceptable to consumers. In either case, by requiring product manufacturers to comply with such standards, costs are incurred unnecessarily.

52 AUSTRALIAN DAIRY INDUSTRY
The Commission believes that industry participants are in the best position to specify and enforce the quality standards that best suit their aims. Because dairy products, especially fresh milk products, are purchased frequently, it is in the interests of manufacturers and milk processors to ensure appropriate and consistent quality. These attributes should enable dairy product manufacturers and processors to establish a brand name for their products. A brand name provides the opportunity to differentiate products and, hence, to obtain a higher price or increased market share.
4.4 Promotion of fresh milk
A common objective of State dairy industry authorities is to promote the sale of milk and dairy products. State dairy authorities engage in two types of promotion: generic promotion, which is used to increase the overall demand for milk; and brand advertising, which is used to promote particular types of milk.
Generic promotion can present difficulties for an industry in raising promotional funds from participants because of the incentive for some to ‘free ride’ on the contributions of others. It is not possible to exclude those who do not contribute to a promotional fund from sharing in the benefits of generic promotion. To overcome this potential problem, State governments have given the State dairy industry authorities the power to collect funds from all participants.
However, ‘generic’ promotion influences the nature and extent of ‘brand’ advertising and brand advertising is seldom free of generic content. The Commission believes that compulsion should not be used to raise funds for generic promotion.
Without compulsion, the Commission considers it unlikely that there would be an underallocation of resources to the generic promotion of fresh milk. If necessary, because of inadequate generic promotion through brand advertising, funds could be raised through voluntary contributions even though free riding may reduce the collection of funds and be seen as inequitable by those who choose to contribute.
There are ways to encourage contributions and partially overcome any perceived free rider problem; for example, by allowing only those who make contributions to feature logos that are identified in the promotional activity. This would also encourage more effective promotion because contributions would be linked directly to the benefits of the promotion. Under the current system, industry participants must contribute even if they believe the promotion is not meeting their marketing requirements.
Specific brands, particularly modified milks, are also advertised by the State dairy industry authorities. The Victorian Dairy Industry Authority argued that it is necessary to maintain an authority with the resources and expertise to conduct a brand based promotional campaign
STATE ARRANGEMENTS FOR MARKET MILK
53
(Submission 6, p. 7). However, when such promotion results in the substitution of one type of milk for another, there does not appear to be any benefit to the industry from promotional expenditure.
In its recently released Discussion Paper on new proposals for reduced regulation in the Victorian market milk industry, the Victorian Department of Agriculture is proposing that the marketing role (including promotional activities) should cease on the 1 January 1994. With the proposed removal of controls over retail prices, the Department considers that responsibility for milk marketing should rest with the private sector. As said by the Department:
Complex regulations controlling market milk (eg, pricing regulations) have constrained the ability and
incentive for private sector companies to develop their own marketing activities. (Victorian Department of
Agriculture 1991, p. 9)
Except for generic promotion, the Milk Processors' Association of Victoria recommended that processors should be responsible for all marketing functions currently undertaken by the Victorian Dairy Industry Authority (Submission 40, p. 2).
The Commission considers that processors and retailers should assume responsibility for promoting the sale of fresh milk products. This has already occurred in Tasmania where the Tasmanian Dairy Industry Authority is no longer actively involved in marketing milk following the privatisation of its sales and promotion functions (Tasmanian Dairy Industry Authority 1991). With private companies being responsible for their own marketing activities, the costs of such activities could be weighed directly against the benefits.
4.5 Efficiency effects of supply and price controls for market milk
If the administrative supply arrangements and set prices for fresh milk, including restrictions on interstate trade, result in different prices to those that would prevail in the absence of regulations, the signals on which production, marketing, consumption and investment decisions are based will be distorted. Decisions based on distorted prices will cause the community's resources to be used less than efficiently and will impose unnecessary costs on society.
4.5.1 Administratively set prices
Farm gate prices, margins for processing, distribution, retailing and vending, and consumer prices are all set administratively by State governments (except for Western Australia where only the prices at the farm gate and delivered prices paid by processors are administratively set). The incentives transmitted by these regulated prices and margins directly determine the levels of output and investment in milk production and in the processing vending and retail sectors. Excessive margins may encourage over-investment in productive resources. If margins are insufficient, some demand may not be supplied and the regulated activity may not be sustained in the long term because re-investment will not take place.

54 AUSTRALIAN DAIRY INDUSTRY
The procedures used in setting prices and margins are in lieu of market forces; each of the activities involved could be carried out by private firms without the need for government involvement. However, difficulties arise in setting prices and margins because of the lack of a market determined reference point. To help address these difficulties, various approaches have been used to try to mimic market forces. Included are cost of production surveys, required rates of return on investments, and movements in the Consumer Price Index. In other instances, political judgments are made, for example, concerning the extent to which consumer prices can be increased.
The cost of production survey technique has been further refined in Victoria by the process known as ‘benchmarking’. This is used in an effort to impose some discipline on firms to reduce costs. It involves undertaking a survey of selected firms, say, in processing to determine an average cost of production. From this group of firms, a subset is selected of those firms which are judged to be low-cost operations. The average cost of production for this subset is then calculated and is adopted as the benchmark average cost of production.
Prices and margins are then set with reference to the average cost of production and benchmark cost. As more weight is given to the benchmark, the price set will increasingly be less than the average cost of production for all firms.
The weight applied to the benchmark farms in Victoria is 12.5 per cent, whilst the weight for benchmark processors is 25 per cent (see Appendix C). This means that the prices set for processors will be a smaller proportion of average costs than for farmers. The disciplines on processors to reduce costs are therefore greater than for farmers.
Benchmarking and other procedures used to help determine prices are based on many arbitrary decisions. Judgements are made in respect to the firms to be included in the surveys; how frequent the surveys should be undertaken; how capital should be valued and depreciated; the costs to include; and the required rate of return on capital invested.
The difficulties which can arise from the need to make such arbitrary decisions is illustrated by the recent review of the processing sector in Victoria commissioned by the Victorian Dairy Industry Authority. The review found that regulated margins were not allowing returns which are adequate for the processors to re-invest:
In the period examined, the Processors achieved a margin that was substantially less that the theoretical
margin. The actual margin achieved for all sectors was approximately 8.1% of the theoretical margin. Since
the theoretical margin is based on a 17% ROI [return on investment], an actual ROI of 1.4% is suggested. In
the current economic environment, such a return is not adequate for this industry. (Submission 31, p. 3)
According to the review, the inadequate rate of return was due to the inability of processors to charge maximum regulated prices at all times, reduced margins as a result of benchmarking and limits on increases relative to the Consumer Price Index, and the exclusion of some business expenses such as goodwill. The inability to charge maximum prices may indicate that the prices

STATE ARRANGEMENTS FOR MARKET MILK
55
have been set too high or that competition prevents them from being charged. The decision to take the other factors into account, and how to do so, is subjective and open to dispute. So too is the level of the required rate of return on investment.
Since the release of the above review, retail prices for milk in Victoria were increased by 3 cents per litre in May 1991. Processors received 43 per cent of this increase (1.3 cents per litre). This compares with normal processor margin of around 22 per cent of the retail price. Compared with dairy farmers and retailers, for example, processors received a far greater share of the increase.
The Commission considers that governments should not be involved in setting arbitrary margins for the processing of milk or the rate of return on investment for private companies involved in milk processing. This view was strongly supported by the Milk Processors' Association in its submission responding to the Commission's draft report (Submission 40, p. 1).
Processing and all other activities associated with producing and consuming milk, are commercial activities (except for public health and safety aspects). The firms which continue to operate, the prices which they can charge consumers, the costs which can be covered, and the rate of return on investment, should all be determined by commercial forces. This would also result in savings to society in that resources would no longer be needed to set prices administratively. In addition, the potential for margins to be squeezed for political reasons would be removed.
4.5.2 Blended prices for market and manufacturing milk
Farmers in Victoria, South Australia, and Tasmania are paid a weighted average price for their milk. This price consists of returns from the higher priced sales of market milk and returns from manufacturing milk, and it increases the average return received by dairy farmers above that received for manufacturing milk. In turn, the manufacturing milk price is an average or blended price from returns received from the sale of dairy products on the world market, export subsidy payments, and returns from domestic dairy product sales. The United Dairyfarmers of Victoria said:
The Victorian Government's maintenance of a Dairy Industry Authority and the gazetting of a farm gate price
for market milk provides considerable assistance to the Victorian dairy industry. In 1987-88, the differential
between the blended manufacturing milk price and the market milk price accounted for 56 per cent of a dairy
farmer's net cash surplus. Without this additional income, the Victorian dairy industry would have been
subjected to greater economic pressure and the viability of the industry would have been threatened.
(Submission 9, p. 62)
In the absence of blended pricing, farmers would produce at a lower level where the production cost of the last unit would match the manufacturing milk price. Regulated farm gate prices for market milk and the blended payment arrangements have led to excessive production and investment in dairy farming. The Commission has calculated the net loss from these additional

56 AUSTRALIAN DAIRY INDUSTRY
resources for Victoria, South Australia, and Tasmania during 1989-90 for a range of own price elasticities of supply.7 The estimates are summarised in Table 4.2.
Table 4.2: Efficiency losses of the State market milk supply arrangements, 1989-90
($ million) Blended pricing States Production losses
(own price elasticity of supply) (0.5) (1.5) (3.2)
Victoria 0.9 2.7 5.5 South Australia 1.5 4.1 7.7 Tasmania 0.3 0.9 1.9
Consumption losses
(own price elasticity of demand) (-0.1) (-0.15) (-0.2 Victoria 1.0 1.4 1.9 South Australia 0.3 0.5 0.7 Tasmania 0.2 0.4 0.5
Quota sourcing States Consumption losses
(own price elasticity of demand) (-0.1) (-0.15) (-0.2) New South Wales 2.1 3.1 4.1 Queensland 1.4 2.1 2.8 Western Australia 0.3 0.5 0.7
Total community losses 8.0 15.7 25.8 Source: Commission estimates.
7 The own price elasticity of supply is the percentage change in the quantity (of milk) supplied in response to a one per cent change in price, assuming other factors do not change.

STATE ARRANGEMENTS FOR MARKET MILK
57
The higher administered price for market milk also imposes additional costs on consumers. The additional costs on consumers in Victoria, South Australia, and Tasmania are also summarised in Table 4.2 for a range of own price elasticities of demand.8
The estimates of additional costs to consumers are based on the assumption that the cost of producing milk out of season would be 20 per cent higher than the cost of producing milk, mainly for manufacturing purposes, in season. The additional costs have been taken into account by assuming that the price of fresh milk would be 20 per cent higher than the price of manufacturing milk. The estimates are also based on the assumption that the decline in farm gate prices for fresh milk will flow through to retail prices.
Furthermore, in calculating the efficiency losses, the average manufacturing price received by farmers in each State has been used as the reference in-season price for manufacturing milk. As these prices include the increased returns from the Commonwealth market support payment arrangements (see Chapter 5), the effect of paying the market support levy on market milk has effectively been removed; that is, the increased reference price more than offsets the market support levy. This means that the estimates of efficiency losses are for those directly attributable to the State pricing arrangements for market milk.
The middle column (column 2) of Table 4.2 shows the estimates of the efficiency losses associated with the elasticities of supply and demand for fresh milk that the Commission considers, based on a survey of the literature, are the most likely to prevail; that is, a demand elasticity of -0.15 and a supply elasticity of 1.5. Based on these elasticities, the total efficiency losses of the State pricing arrangements for market milk to the community are estimated at $15.7 million. If the lower elasticities were to prevail (column 1), total costs to the community are estimated at $8.0 million. Should the higher elasticities prevail (column 3), the annual costs are estimated at $25.8 million.
4.5.3 Quota sourcing of fresh milk
Transferable quotas are used to source fresh milk in New South Wales, Queensland, and Western Australia. Farmers are paid the higher market milk price for milk delivered under quota. Milk additional to quota is sold at the manufacturing milk price.
As with the blended price payment arrangements, the higher farm gate price for market milk means that additional costs are imposed on consumers. These costs have been estimated by the Commission for New South Wales, Queensland, and Western Australia using the same assumptions as for the blended pricing arrangements. The estimates are summarised in Table 4.2 for the selected range of own price elasticities of demand.
8 The own price elasticity of demand is the percentage change in the quantity (of milk) demanded in response to a one
per cent change in price, assuming other factors do not change

58 AUSTRALIAN DAIRY INDUSTRY
The higher price for market milk is reflected in the value of quota. If there were no limits on the transfer of quota, the price of quota would reflect mainly the difference in the price for market and manufacturing milk.9 This means that farmers would make decisions concerning milk production in excess of quota requirements based on the returns from manufacturing milk. Compared with blended pricing, the price received for the last unit of production would not be increased above market returns for manufacturing milk. Therefore, the costs to society of additional resources in dairying are not incurred under a system of (fully) transferable quotas. The major social cost imposed would be the net loss to consumers from too little consumption because of the higher price they have to pay for milk.
However, the benefits in terms of lower social costs would be reduced by limitations on transfers of quota, limits on total quota holdings, and the method of allocating additional quota to the pool. The benefits are also reduced by the costs of administering transfers and monitoring compliance with allocations.
The production quotas used in New South Wales, Queensland and Western Australia may only be transferred through transactions controlled by the State dairy industry authorities. There are several conditions that restrict transfers. For example, in Western Australia a maximum of 420 litres of daily quota can be traded and producers are restricted to a maximum daily quota holding of 2300 litres.
In New South Wales, quota is allocated in thirteen lots of four-week production periods. To be eligible to make a purchase of additional quota, production in a corresponding period in one of the previous three years must be at least 125 per cent of the farmer's present allocation plus the intended purchase. While there is no limit to the amount of quota a New South Wales farmer may hold, they can acquire no more than 104,000 litres per year through the quota exchange. Making the maximum permissible purchase, it would take a new entrant almost three years to acquire the quota holding of the average New South Wales farm (270 000 litres).
Additional units of quota to allow for population growth are allocated to the quota exchange for auction in New South Wales, allowing an efficient allocation of the additional production requirements. In Queensland and Western Australia, additional quota are divided equally among all quota holders - effectively giving an annual grant to farmers, who may chose to sell immediately the allocation through the quota exchange.
In summary, restrictions on the transferability of quota result in resource costs because more resources are required to produce the same amount of milk. This arises because the restrictions
9 The price of quota will also be influenced, but to a lesser extent, by the cost of producing milk at different times of the year and by penalties for quota shortfall.

STATE ARRANGEMENTS FOR MARKET MILK
59
limit the ability of the most efficient farmers to obtain quota. Nevertheless, quotas are a more efficient means of sourcing fresh milk supplies than blended pricing arrangements.
4.5.4 Restrictions on interstate trade in market milk
The restrictions on interstate trade in market milk are discussed in Section 4.1.5. Apart from the costs of monitoring and enforcing the restrictions, two other types of costs may be incurred. The first would arise because the restrictions result in milk being produced in a State at a greater cost compared with producing that milk in another State plus transport costs. More of the nation's resources would be used in producing the milk than is necessary. The second cost arises because consumers have to pay a higher price for milk sourced from within a State compared with interstate supplies.
There is no benefit to the community from incurring either of these costs; they represent losses to society compared with the situation of no government intervention. The Commission considers that the regulatory restrictions imposed by the States on interstate trade in market milk should be removed.
The major incentive for interstate trade in fresh milk at present is provided by the difference between the regulated price for market milk and the price of manufactured milk; and the major reason for the restrictions on interstate trade is to maintain this difference. If the State pricing controls for market milk were removed, such that the price of fresh milk was linked to the price of manufacturing milk (see Section 4.7), the incentive would be reduced. According to the Victorian Government, in such a situation there would virtually be no interstate trade in fresh milk (Submission 34, p. 29). Nevertheless, if the restrictions were removed, decisions concerning where to produce milk and from where it is sourced would not be distorted, but would be based on relative returns and costs.
4.6 Proposals for change by State governments and industry
The industry has long recognised the need for changes to the various regulations at State level. Reform has been taking place continually and reviews of State regulations have been completed recently or are current in all States. However, most reviews have been focussed on altering the regulations to reduce inefficiencies in their operation; there has been a reluctance to examine and discard objectives that may no longer be in the best interests of the community.
The New South Wales Dairy Industry Conference has advised the Minister for Agriculture in that State to deregulate all prices, with the exception of the farm gate price for market milk, and to remove distribution controls, such as the zoning of milk vendors. However, the Conference claims that:
60 AUSTRALIAN DAIRY INDUSTRY
The special situation of the dairy farmer requires that a regulated "farm gate" price for market milk be
maintained to protect the farmer against predatory pricing practices by Australia's heavily oligarch cal retail
structure, which would otherwise be inevitable. (Submission 19, p. 5)
In its Discussion Paper, the South Australian Office of Regulation Review recommends the removal of all regulations, with the exception of a farm gate price for market milk and quality standards to ensure health and safety. The Office's rationale for retaining a regulated farm gate price for market milk is on the grounds that it assists the dairy products manufacturing sector by encouraging the production of surplus milk. This increases the supply and reduces the price of manufacturing milk. The Office argued that this is appropriate because of the export orientation of the manufacturing milk sector and the behaviour of other countries in world markets. It concluded:
The rationale for a fixed farm gate price only exists while world prices are corrupted by subsidies.
(Government Adviser on Deregulation, South Australia, 1991)
While in some reviews there has been a willingness to abandon traditional objectives, resistance to fundamental change has managed to stall reform at the point of implementation. For example, deregulation of pricing and distribution at retail and wholesale levels in Victoria was announced in September 1990, by the (then) Minister for Agriculture and Rural Affairs. It is the Commission's understanding that the changes were not implemented because of resistance from various sections of the industry. Now, some nine months later, the Victorian Department of Agriculture has released a further discussion paper proposing, among other things, the deregulation of market milk prices beyond the processor by 1 January 1994 (Victorian Department of Agriculture 1991).
There appears to be a barrier to reform at the level of the farm gate price and supply controls. The Commission is unaware of any proposal to deregulate the farm gate prices for market milk or to terminate production quotas or vesting of milk. Recent and current reviews focus on pricing and distribution arrangements in the processing, vending and retail sectors.
The Commission notes that there have been encouraging developments in some areas. In Western Australia price controls have been removed down to the delivered price paid by processors following the formal removal, on 1 July 1991, of the system of setting recommended retail prices. In Tasmania, retail prices are now set only for plain white milk and a review was announced in July 1991 of the ongoing deregulation of the fresh milk market beyond the farm gate. It is also noted that some country areas of Queensland, Western Australia and South Australia have remained free of much of the regulations that apply elsewhere in those States.

STATE ARRANGEMENTS FOR MARKET MILK
61
4.6.1 The Ballarat Agreement
The principles contained in the Ballarat Agreement were originally developed by the New South Wales-Victoria Milk Committee (1990). The Committee, which reported to the New South Wales and Victorian Ministers for Agriculture and Rural Affairs in July 1990, was a Victorian initiative to resolve market milk issues. The review was precipitated by sales of Victorian milk into New South Wales which had threatened the marketing arrangements for both market and manufacturing milk. The recommendations of the Committee's final report were endorsed by a national meeting of the Australian dairy industry, held in February 1991 at Ballarat, Victoria, and formed the basis of what is known as the Ballarat Agreement arising from that meeting. This Agreement is reproduced in Box 4.1 Box 4.1: The Ballarat Agreement At the Ballarat Workshop on 17-19 February 1991, dairy industry leaders representing all sectors of the dairy industry agreed to commit to the following manufacturing and market milk arrangements: 1. Manufacturing Milk
National All Milk Levy
Ceiling of 45 cents/kg butter fat content or its equivalent
Maintain current system of market support payments and levy rate
Continue underwriting
Remove Comfort Clause
Implement Section 38 type legislation in all States
An ongoing scheme - no sunset clause
Maintain the cheese tariff quota 2. Market Milk Section 38 type legislation in each State to regulate the farm gate price is the best option for the industry to pursue in order to: protect the market milk margin in all States;
cover products which could erode white milk (as defined in NSW/VIC Market Milk Report); it should recognise the need for special pricing structures; and
UHT milk to have a common price basis regardless of origin or destination.
Source Australian Dairy Industry Council

62 AUSTRALIAN DAIRY INDUSTRY
The proposal aims to unify State market milk sectors into a national sector, with the Victorian price setting the national benchmark. Other States would be free to increase the farm gate price for market milk, but this would be restricted by potential sales of interstate milk based on the Victorian price for market milk. The proposal also seeks to widen the types of milk products which are subject to pricing and supply arrangements.
The most important objective of the proposal is to establish a national price for market milk. Currently, prices are set within each State and apply to milk for processing and sale within that State, except for Victoria which also controls the price of milk processed in Victoria for interstate markets. The potential exists for sales of market milk from other States, sourced at manufacturing milk prices, to undermine the pricing arrangements in the ‘importing’ State. An administered national market milk price to replace State prices would eliminate the effect interstate trade in market milk could have on farm gate prices for fresh milk.
The price received for manufacturing milk provides critical support to the market milk arrangements (see Section 5.6). The incentives for interstate trade in market milk can be expected to increase if manufacturing milk prices fall (in response to a decline in world prices for dairy products), or if Commonwealth assistance for dairy products is reduced. The price differential between market and manufacturing milk would widen, and the pressure to participate in interstate trade at prices below regulated prices would increase.
Such developments would place severe pressure on the regulated prices for market milk, including the regulated prices between the farm gate and consumer. Regulated prices could not be sustained without the local industry losing its market share to milk ‘imported’ from interstate. Such a situation would generate pressures from within the industry to deregulate prices to allow it to compete with ‘imports’.
The Ballarat Agreement does not address the fundamental question of whether there is a need for an administered farm gate price for market milk. If implemented, the proposals would further institutionalise the current system of fixed prices and the ability of State dairy industry authorities to control supply. The principles in the Ballarat Agreement would have the effect of strengthening the arrangements that protect the market milk sector, yet developments in world markets for dairy products require the industry to become more competitive and less reliant upon government support.
The Commission notes that some participants regard the Ballarat Agreement as only an interim step towards greater deregulation of dairy activity. According to the New South Wales Dairy Farmers' Association:
the principles outlined in that set of proposals [the Ballarat Agreement] do not accurately convey to the
Commission or Governments the recognition of industry that further structural change must be addressed and
delivered. (Submission 13, p. 4)
STATE ARRANGEMENTS FOR MARKET MILK
63
The Association proposes that the Ballarat Agreement be adopted for an interim period of at least five years during which commercial alternatives to regulation can be developed. In support of its submission the Association states that there is an understanding gap between farmers and those who advocate economic reform, which would take time to bridge, in order to avoid imposing reform on unwilling subjects. In addition, the Association indicates that there are already several reforms impacting on all sectors of the dairy industry. It specifically refers to proposals being developed in New South Wales to remove controls over milk prices and margins at the processing, distribution and retail level and to remove all zoning of processors and distributors.
Overall, the Commission does not consider that the Ballarat Agreement represents a viable option for change. It seeks to maintain a higher price to farmers for fresh milk, to restrict interstate trade, and to maintain the artificial distinction between manufacturing and fresh milk.
4.6.2 National quota for market milk
A national quota scheme for market milk has also been proposed. It was presented by the General Manager of the New South Wales Dairy Corporation to the National Agricultural and Resources Outlook Conference in 1991 (Davey 1991). The proposal was also considered by the Australian Bureau of Agricultural and Resource Economics in its submission to this inquiry (Submission 28).
The proposal involves a system of national sourcing of market milk and would replace existing State market milk arrangements. The allocation of entitlements to supply market milk would be by transferable quotas. Farmers would be able to supply fresh milk into any State provided they held quota.
The scheme would overcome the restrictions on interstate trade and encourage the production of milk in low-cost regions. But the scheme would maintain artificially high prices for fresh milk which would be capitalised into the value of quota. It would also maintain, possibly indefinitely, the artificial distinction between market and manufacturing milk.
Because all Australian dairy farmers would be receiving the manufacturing price for milk produced above quota, the unnecessary costs of extra resources in milk production from blended pricing would be avoided in Victoria, South Australia and Tasmania. Nevertheless, as with the current quota and blended pricing arrangements, the current net loss to consumers would continue to be incurred under the proposed national scheme. These losses will remain for as long as an artificial distinction is maintained between the market and manufacturing milk sectors.
In addition to the net losses to consumers, there are difficulties and costs in establishing a national quota and its administration. Further difficulties for the administrators of the scheme may arise because of the capital value which accrues to quota holders through the higher price for fresh milk. This value may make it difficult to change or terminate the scheme once implemented because of the potential for compensation claims against governments.

64 AUSTRALIAN DAIRY INDUSTRY
4.7 Sourcing fresh milk by commercial contracts
The Commission does not consider that governments should be involved in the pricing and supply of fresh milk. As for other foods, such matters should be resolved in the market place except for public health and safety considerations.
Fresh milk is highly perishable. It can only be stored, for any length of time, in modified form such as UHT or powdered milk. In addition, the production of milk is seasonal (due to the lactation and pasture growth cycles) and the quality of milk declines towards the end of the lactation period of around nine months.
Given these characteristics, the Commission envisages that, in the absence of government involvement, the supply of fresh milk all year would be organised through commercial contracts between processors and dairy farmers. The Milk Processors Association of Victoria considered that the supply of fresh milk could be organised through commercial contracts (Submission 40, p. 3). The contracts would specify the quantity and quality of milk to be delivered during nominated periods. Commercial penalties for non-performance would apply.
The price to the farmer would also be specified. This price would be based on the manufacturing milk price, particularly in those areas where the majority of milk is used for manufacturing purposes; whilst Australia remains a net exporter, manufacturing milk prices will be influenced by world traded prices for dairy products. In those areas where milk production is predominantly for fresh consumption, the price would be influenced by the cost of importing milk from other supply regions. This cost, in turn, would be determined largely by the price of manufacturing milk in those regions plus transport. The price for fresh milk would no longer be determined administratively, but linked directly to the price of manufactured milk.
Except for short-life products, it is not necessary to produce milk all year for manufacturing purposes. Relative to fresh milk, manufactured dairy products are no longer highly perishable, with shelf lives frequently greater than six months. In addition, the quality requirements for some products are not as stringent as they are for fresh milk. The production of milk for manufacturing can therefore be seasonal, based on synchronising peak lactation with peak pasture growth to minimise milk production costs.
However, the reduced costs of producing milk in season should be assessed against the higher costs which may arise from processing milk on a seasonal basis rather than throughout the year. In some circumstances, the least-cost option for manufacturers may be to offer a higher price to farmers to continue to produce milk out of season so as to keep their plants operating.

STATE ARRANGEMENTS FOR MARKET MILK
65
In the case of fresh milk, it is not possible to close down production for part of the year; milk must be produced year round if the requirements of the fresh milk market are to be met. Additional costs are incurred by farmers from the need to provide supplementary feed during times of low pasture growth (winter mainly). Because peak lactation no longer coincides with peak pasture growth, the milk yield per cow is also less (see Section 2.5.1).
4.7.1 Increased costs of producing milk out of season
If supplies of fresh milk are to be forthcoming, the price paid to dairy farmers for milk produced from lactation cycles out of phase with seasonal pasture growth will need to be higher. The higher price will reflect increased costs, loss of yield, and penalties for supply shortfalls in providing milk out of season relative to the returns from producing milk in season. By basing contractual arrangements with individual farmers according to costs incurred in producing fresh milk, the efficiency losses that arise from pooling the higher returns from market milk sales between all farmers will be avoided.
Because these factors will vary between different regions, and even between farms within a region, it is not possible to determine in advance the size of the price difference needed to produce milk out of season. However, the Commission considers that the difference could be from between 10 and 20 per cent of returns from producing manufacturing milk in season. This judgement is based on the incentives that have been offered to Victorian, South Australian and Tasmanian dairy farmers to produce out of season; and the additional costs of producing milk out of season. The Commission has used a difference of 20 per cent between the price for manufactured milk produced in season and fresh milk in estimating assistance to the dairy industry (see Appendix F), and for modelling the effects of its recommendations on the industry, differences of 10 and 20 per cent were used (see Appendix G).
If account is taken of the higher price paid for market milk in Victoria, the winter incentives paid in the months of April, May, June and July, and the share of milk used as fresh milk for each month, the farm gate price to dairy farmers for the five seasons 1985-86 to 1989-90, for producing milk out of season over a nine month lactation cycle, ranged from 13 to 23 per cent higher than for milk produced in season; with an average of 17.2 per cent. For Tasmania, the incentives for the four seasons from 1986-87 to 1989-90 ranged from 12 to 20 per cent, with an average of 15.3 per cent. The amount of milk produced in both States in response to these incentives greatly exceeded that required for fresh milk consumption throughout the year.
No specific winter incentive is offered to dairy farmers by the Metropolitan Milk Board in South Australia. However, because the higher price for market milk is paid on a greater share of total milk output in the winter months, farmers are effectively receiving an incentive. This incentive has been estimated by the Commission in the range of 30 to 34 per cent for the four seasons from 1986-87 to 1989-90.

66 AUSTRALIAN DAIRY INDUSTRY
Compared with Victoria and Tasmania, market milk constitutes a far greater share of total milk production in South Australia (see Figure 2.2). As a result, the average returns received by South Australian dairy farmers, and the implicit winter incentive, are increased relative to their counterparts in Victoria and Tasmania. However, because milk production in South Australia is a relatively small share of Australia's production, and given the potential to source milk from Victoria, the Commission considers that incentives in the order of 30 per cent or more would not be representative for the fresh milk market overall. Nevertheless, there may be some areas where incentives of this magnitude would be required to ensure year round supplies of fresh milk relative to the costs of transporting milk from other supply regions.
The Australian Dairy Industry Council argued that the Commission should use the ‘Canberra milk tender price, because it would avoid the IC having to engage in assertions, based on guesses and hearsay, about the costs of non-seasonal production and transport costs’ (Submission 48, p. 22). The Commission does not consider that the published tender prices for fresh milk delivered to Canberra provide a guide to the incentives required to produce milk out of season. The tender prices are those paid to the supplying companies. No differential is indicated in the prices between milk produced out of season compared to that produced in season. In addition no information is provided on the prices received by dairy farmers and the incentives provided to offset the costs of producing milk out of season.
Further support for the Commission's judgment concerning the incentive required to produce milk out of season is provided by the additional costs associated with out of season production. In respect to the Riverina area of New South Wales, Lembit and Bhati (1987) have estimated the costs of producing milk all year were 20 per cent higher than the costs of normal seasonal production in adjacent areas of Victoria. The higher costs provide a guide to the incentive required to offset the additional costs of out-of-season supply.
Currently the administered price of fresh milk is around 60 per cent higher on average than the price for manufacturing milk. If instead, the difference were from between 12 and 20 per cent, farm gate prices for fresh milk could fall by between 12 and 15 cents per litre. Consumer prices could be expected to fall by a similar amount. However, the price to consumers will also be influenced by the margins drawn by processors, distributors, retailers, and vendors, in the absence of government controls. If the current administratively set margins are too low, prices to consumers may not decrease by the same amount as farm gate prices; the overall effect on consumer prices is uncertain in the short to medium term.

STATE ARRANGEMENTS FOR MARKET MILK
67
To minimise disruption, and the risk of supply shortfall, the Commission considers that commercial contracts should be developed and implemented before government involvement in the sourcing of fresh milk ceases. It may take two to three seasons for processors to match supplies of fresh milk (on a daily basis) with consumer requirements. It is not possible for farmers to bring forward quickly calving times of their existing herd if they wish to produce milk earlier in the season. The quantity demanded by consumers may also alter in response to changes in the price of milk to reflect the higher costs of producing milk out of season. Rather than pay the higher price, consumers may switch to, for example, UHT milk.
4.8 Conclusion
There is no justification for government involvement in the supply and pricing of fresh milk except for public health and safety requirements. The Commission, therefore, considers that all other supply and pricing controls of the State governments, including restrictions to interstate trade, should be removed. This would allow the price of market milk to be more closely linked to the manufacturing milk price. By doing so, the production and consumption costs which are imposed on the Australian community because of the current arrangements for fresh milk would be eliminated.
The Commission appreciates that if the State controls were removed too quickly, unnecessary adjustment costs would be imposed on the dairy industry. The Commission would want to avoid that and so proposes that changes should be implemented over a period of several years.
A key aspect of ensuring that change occurs without unnecessary disruption, is for there to be some discipline on interstate trade. Failure to maintain discipline could cause the higher administered price for fresh milk in the Eastern States to decline sharply. The Commission's preferred approach for maintaining temporary discipline over interstate trade is through the existing ‘comfort clause’ provisions of the Commonwealth marketing arrangements (see Chapter 5). With the ‘comfort clause’ remaining operative, the Commission considers that all State controls and regulations over interstate trade should be removed by 1 July 1993.
To allow change to proceed without undue disruption, the Commission considers that the involvement of State governments in the pricing and sourcing of milk beyond the farm gate should be removed by mid-1996. This would be followed by the removal of supply quotas and administratively set farm gate prices for fresh milk by mid-1999.
Because of the perishability of milk, and the seasonal nature of its production, the Commission envisages that the current regulated supply arrangements will be replaced by contractual arrangements between processors and individual farmers.

68 AUSTRALIAN DAIRY INDUSTRY
Once again to avoid unnecessary adjustment costs, these arrangements should be in place before the current supply arrangements are terminated and no later than mid-1999.
The Commission will be proposing the phasing down of assistance to the dairy industry provided through the Commonwealth arrangements in Chapter 5. There will thus be pressure for change on both market and manufacturing milk production if its recommendations are accepted. As regulations governing the dairy industry in each State are to an extent unique and, as the degree of change necessary and underway varies, the Commission has not attempted to set a precise timetable for change. Rather, it recommends target years by which goals should be achieved.
In setting the target years, the Commission does not wish to indicate that no action should be taken, for example, in removing supply quotas and administratively set prices until 1 July 1999. Rather, this date represents the time by which all remaining controls should be removed. In keeping with the need to minimise adjustment costs, the Commission considers that it will be necessary to commence the removal of the controls well before this date so as to gradually reduce the effects of the controls. More specifically, the Commission envisages that the differential between market and manufacturing milk prices should be reduced at the same time as the assistance under the Commonwealth arrangements is phased down.
RECOMMENDATIONS
The Commission recommends that: State governments should retain
responsibility for ensuring the public health and safety of market milk; and
State controls over supply and pricing of
market milk should be removed, and to minimise disruption costs, be removed according to the following goals:
− legislative and regulatory restrictions to
interstate trade in market milk as soon as possible and no later than 1 July 1993
− controls over supply and pricing of market
milk beyond the farm gate as soon as possible and no later than 1 July 1996
− supply quotas and administratively set
farm gate prices as soon as possible and no later than 1 July 1999.

COMMONWEALTH MARKETING ARRANGEMENTS
69
5 COMMONWEALTH MARKETING ARRANGEMENTS
Commonwealth arrangements apply to the marketing of manufactured dairy products. The current arrangements - known as the Kerin Plan - provide levy financed assistance to the dairy industry by way of subsidies on dairy product exports, and underwriting. They also provide for the continuing function of the Australian Dairy Corporation. The arrangements are due to expire on 30 June 1992.
The purpose of this chapter is to examine the effects of subsidising dairy product exports from industry funds, including aspects of the interrelationship between the subsidies and the State pricing arrangements for fresh milk. Other Commonwealth influences affecting the marketing of dairy products are also discussed. The operations of the Corporation are considered in the next chapter, whilst details and analysis of assistance provided by the cheese tariff quota and underwriting are deferred to Chapter 7.
5.1 The Kerin Plan arrangements for manufacturing milk
The main enabling legislation for the Kerin Plan is the Dairy Produce Act 1986. Key elements of the plan are the market support levy on all milk, the ‘comfort clause’ to suspend the levy, and market support payments from levy collections to subsidise exports; the phasing out of supplementary market support payments from levies on dairy products sold domestically; and underwriting. Details of the operation of these elements (except underwriting), and of other Commonwealth legislation affecting the marketing of dairy products, are contained in Appendix E.
5.1.1 Problems with previous arrangements (1977-1986)
The Kerin Plan sought to overcome the problems of the previous Commonwealth marketing arrangements for manufacturing milk that operated from July 1977 to June 1986.1 These arrangements involved separate pooling of returns for prescribed products: butter; cheddar and related types of cheese; casein; wholemilk powder; and skim milk powder. For each prescribed product, a levy was imposed on domestic sales, thereby raising prices paid by Australian consumers. Net levy proceeds (after deducting administrative costs) were pooled with export
1 The previous report on the dairy industry by the Industries Assistance Commission contains a detailed assessment of
the previous arrangements (IAC 1983b).

70 AUSTRALIAN DAIRY INDUSTRY
returns for each product. In this way, exports returns were effectively subsidised. The pools for prescribed products were administered by the Australian Dairy Corporation.
A prerequisite for the export of prescribed dairy products was a Certificate of Authority to Export issued by the Australian Dairy Corporation. These certificates specified export values for particular markets and/or products. Exporters were not constrained to sell at these prices but were required to return the full value of the certificate to the Corporation. The exporters, in turn, received the assessed export price determined by the Corporation at the beginning of the production period (usually a financial year). Any surplus resulting from the difference between certificate value and assessed export prices was deposited into the relevant product pool.
Funds in each product pool were distributed equally on all sales of the leviable product. Equalisation averaged export returns from leviable product among manufacturers and distributed funds raised by the levy on domestic sales across all production. As the levies varied between products and the proportions sold domestically also varied, the impact of the levies on the prices received by manufacturers differed between products. Market signals to manufacturers on the relative profitability of different products were thereby distorted.
The equalisation of returns associated with pooling also stifled innovation by averaging the returns for individual manufacturers across all participants in the product pool. Thus there were poor incentives for individual manufacturers to improve their production efficiency, product mix and marketing of their product. Also, the relatively high levels of assistance to the industry reduced the pressures to lower costs and become more competitive on the world market (see Chapter 8).
5.1.2 Objectives of the Kerin Plan
The Kerin Plan was designed to address the adverse affects of the previous arrangements and to improve the competitiveness of the Australian dairy industry. In the second reading speech for the Dairy Produce Bill 1986, the Minister for Primary Industries and Energy stated:
The Government's basic objective is the development of a more efficient and profitable dairy industry, able to
respond as quickly as possible to changing market conditions and technology. (House of Representatives,
Hansard, 7 May 1986, p. 3201)
The objective was to be achieved by reducing the price distortions between products caused by equalisation and product levies, making manufacturers more responsible for their own production and marketing decisions, and by reducing the level of assistance to the industry.
In reducing the level of assistance, the Government's aim was to make the industry more competitive relative to imports. This was to be achieved by progressively reducing the level of domestic price support so that prices were equivalent to the price that New Zealand imports could be sold in Australia on a ‘fair trade basis’ (House of Representatives, Hansard, 7 May 1986, p. 3201).

COMMONWEALTH MARKETING ARRANGEMENTS
71
Export pooling and equalisation payments were to be replaced with a payment system which allowed the full costs and benefits of production and marketing decisions to accrue directly to individual manufacturers, rather than being averaged across all manufacturers, so that production decisions on dairy products were based on relative profitability. Product levies were to be replaced with ‘arrangements designed to provide a more uniform level of assistance to all products’ (House of Representatives, Hansard, 7 May 1986, p. 3201).
In commenting on the objectives of the Kerin Plan, the Australian Dairy Corporation said:
There is no doubt that, by removing all elements of statutory pooling from export marketing and tying market
support rates directly to prevailing world prices, the current arrangements have achieved their objective of
making domestic manufacturers more open to international market forces and more responsive to the returns
achieved through their own marketing efforts. (Submission 17, p. 34)
5.2 Market support levy and payments
Market support payments are made to exporters of dairy products and have the effect of raising export returns. They are, in essence, export subsidies.2 The payments are funded mainly by a levy - the market support levy - on total milk production. The levy is collected by the Department of Primary Industries and Energy and transferred to the market support fund administered by the Australian Dairy Corporation. Details of other sources of revenue for this fund are contained in Appendix E, Section E.2.
In making market support payments, dairy products are divided into six main types - the prescribed products: butter; cheese; skim milk powder; buttermilk powder; wholemilk powder; and casein. Payments to other non-prescribed products, such as ice cream and yogurt, are based on the support payments for prescribed products (see Appendix E). For the four years to 30 June 1990, market support payments for the different products were set (by the Corporation) so that they represented a uniform percentage of estimated average export prices; that is, average export prices as assessed at the start of the season.
The method of setting the support payments has been changed for the 1990-91 season so as to represent a uniform percentage relative to the milk input of the different products. This change was made because the export subsidies paid by the European Community were having a differential impact on the world price of dairy products when measured relative to their milk content.
2 Initially the Kerin Plan also provided for the continuation of the product levies to fund higher export subsidies. This
was to help the industry in the transition to a lower level of price support provided by market support payments. The product levies applied to butter (butteroil) and cheese, and were to be phased out by January 1992; in the event they were phased out by 1 July 1989. Details of the product levies collected and supplementary payments made during the transition period are contained in Appendix E, Section E.4

72 AUSTRALIAN DAIRY INDUSTRY
The Commission is concerned that this changed procedure will alter the relative returns from different products on the world market and, thereby, distort the price signals to which Australian farmers and manufacturers should respond (see Appendix E).
5.2.1 Payment size
The size of the market support payment which can be made is subject to two statutory limits. The first is a maximum support payment of 30 per cent of the estimated average export price. The second limit is determined by the funds that can be raised from the market support levy which is subject to the maximum levy rate of 45 cents per kilogram of milk fat. Import competition provides a third constraint on the size of the market support payments that can be made.
The aim of making market support payments is to enable the dairy industry to exploit the wedge between the prices of imports and of exports by raising domestic prices of dairy products (see Section 5.3). But should domestic prices be raised too far, imports will be attracted into Australia. A rise in imports will increase the quantity of Australian production that has to be sold on the world market and reduce the amount by which domestic prices can be increased through market support payments. The Australian Dairy Corporation said:
The dairy industry recognises that it is no longer possible to set support rates which raise the Supported
Export Return for local producers above the domestic parity price for imports, without encouraging the
transfer of Australian product onto export markets and increased sales of imported product in the domestic
market because of the premium which exists here relative to other markets. (Submission 17, p. 36)
New Zealand is the closest potential exporter of dairy products to Australia. Its costs of producing dairy products are similar and, given the trade agreement with Australia (see Section 3.3), New Zealand imports are likely to be more competitive than imports from other countries. This means that the price of New Zealand imports will have a significant influence on the extent by which domestic prices can be raised in Australia and, hence, on the size of the market support payments. Based on information supplied by the Australian Dairy Corporation, the cost of shipping dairy products across the Tasman to Australia represented from 9 per cent (wholemilk powder) to 13.5 per cent (butter) of the cif (cost, insurance, freight) price of importing dairy products (Submission 17, p. 37). The potential for New Zealand to limit the size of the market support payments is widely recognised in the industry as reflected by the following statement by the Queensland Dairyfarmers' Organisation:
we are fully cognisant of the facts of full CER with New Zealand and recognise that this support to exporters
can not give cover to the domestic price higher than import parity New Zealand, without the inherent risk of
losing market share to New Zealand. (Submission 11, p. 11)
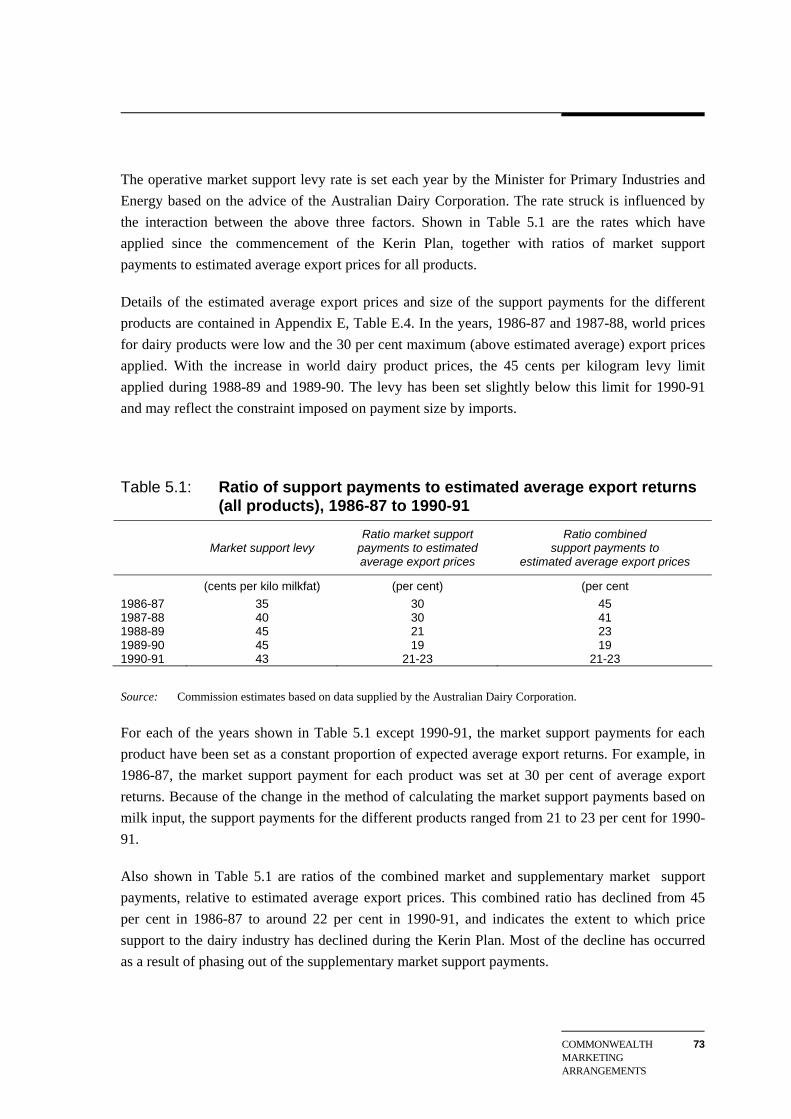
COMMONWEALTH MARKETING ARRANGEMENTS
73
The operative market support levy rate is set each year by the Minister for Primary Industries and Energy based on the advice of the Australian Dairy Corporation. The rate struck is influenced by the interaction between the above three factors. Shown in Table 5.1 are the rates which have applied since the commencement of the Kerin Plan, together with ratios of market support payments to estimated average export prices for all products.
Details of the estimated average export prices and size of the support payments for the different products are contained in Appendix E, Table E.4. In the years, 1986-87 and 1987-88, world prices for dairy products were low and the 30 per cent maximum (above estimated average) export prices applied. With the increase in world dairy product prices, the 45 cents per kilogram levy limit applied during 1988-89 and 1989-90. The levy has been set slightly below this limit for 1990-91 and may reflect the constraint imposed on payment size by imports.
Table 5.1: Ratio of support payments to estimated average export returns (all products), 1986-87 to 1990-91
Market support levy Ratio market support
payments to estimated average export prices
Ratio combined support payments to
estimated average export prices
(cents per kilo milkfat) (per cent) (per cent 1986-87 35 30 45 1987-88 40 30 41 1988-89 45 21 23 1989-90 45 19 19 1990-91 43 21-23 21-23
Source: Commission estimates based on data supplied by the Australian Dairy Corporation.
For each of the years shown in Table 5.1 except 1990-91, the market support payments for each product have been set as a constant proportion of expected average export returns. For example, in 1986-87, the market support payment for each product was set at 30 per cent of average export returns. Because of the change in the method of calculating the market support payments based on milk input, the support payments for the different products ranged from 21 to 23 per cent for 1990-91.
Also shown in Table 5.1 are ratios of the combined market and supplementary market support payments, relative to estimated average export prices. This combined ratio has declined from 45 per cent in 1986-87 to around 22 per cent in 1990-91, and indicates the extent to which price support to the dairy industry has declined during the Kerin Plan. Most of the decline has occurred as a result of phasing out of the supplementary market support payments.

74 AUSTRALIAN DAIRY INDUSTRY
5.3 Domestic prices and producer transfers
Domestic prices for dairy products are increased by the market support payments on dairy product exports. The increase can be explained as follows. The effect of the payments is to increase export returns. This provides manufacturers with an ongoing incentive to supply the export market instead of the domestic market. To offset this incentive so that manufacturers also supply the domestic market, domestic prices must rise to provide net returns equivalent to supported export prices.
This means that domestic prices could be similar to export prices plus the market support payments for the different products. These expected domestic prices are shown in Table 5.2, together with details of average export prices received, market support payments, and where applicable, product levies.
Table 5.2: Supported export returns and domestic prices, 1986-87 to 1989-90
Average export prices received
Market supportpayments
Product a
levies Expected domestic
price Expected increasein domestic price
($ per tonne)
1986-87 Butter 1398 578 668 2644 1246 Cheese (cheddar) 1667 680 234 2581 914 Skim milk powderb 1171 437 - 1608 437 Whole milk powder 1445 611 - 2056 611 Casein 2699 1094 - 3793 1094
1987-88 Butter 1662 546 567 2775 1113 Cheese (cheddar) 1878 725 163 2766 888 Skim milk powder 1377 530 - 1907 530 Whole milk powder 2205 561 - 2766 561 Casein 3942 1302 - 5244 1302
1988-89 Butter 1792 354 351 2497 705 Cheese (cheddar) 2523 574 70 3167 644 Skim milk powder 2343 452 - 2795 452 Whole milk powder 2806 467 - 3273 467 Casein 6010 1166 - 7176 1166
1989-90 Butter 2355 417 nil 2772 417 Cheese (cheddar) 2736 478 nil 3214 478 Skim milk powder 2339 441 - 2780 441 Whole milk powder 2815 441 - 3256 441 Casein 6213 1159 - 7372 1159
a In 1987-88 and 1988-89 the product levies were revised on a 6 monthly basis. Product levies reported for these years are an average of the relevant levy rates. b The rate of support for buttermilk powder is the same as for skim milk powder. Source: Unpublished data from Australian Dairy Corporation.

COMMONWEALTH MARKETING ARRANGEMENTS
75
Reliable data on actual domestic prices for dairy products that have prevailed under the Kerin Plan are not available. Such data would show the extent by which domestic prices have been increased by the market support payments compared with export prices. Although reliable data are not available, the Australian Dairy Corporation said:
it is clear that the current market support arrangements have acted to increase domestic product prices above
those which would have prevailed in their absence. (Submission 17, p. 34)
In the absence of data to the contrary, the Commission has assumed that prevailing domestic prices have been equivalent to the expected domestic prices for dairy products shown in Table 5.2. Based on these prices and the quantity of each dairy product produced in Australia and sold on the domestic market, the Commission has estimated the size of the increased revenue that dairy farmers have received from higher domestic product prices. The increased revenue is commonly referred to as transfers to producers. The estimated transfers for the prescribed products that have applied in each year of the Kerin Plan are shown in Table 5.3. Details concerning the calculation of the transfers are contained in Appendix F.
Table 5.3: Estimated transfers to producers for (prescribed) manufactured dairy products, 1986-87 to 1989-90
Transfers to producers
1986-87 1987-88 1988-89 1989-90 a ($ million)
Products Cheese 88 79 67 57 Butter 32 28 18 24 Skim milk powder 18 25 19 19 Whole milk powder 8 8 6 7 Casein 1 1 1 1
Total 147 141 111 108 a 1989-90 data are preliminary estimates. Source: Commission estimates.
As shown in Table 5.3, the extent by which dairy farmers have gained from higher domestic prices for prescribed dairy products has declined significantly over the life of the Kerin Plan. The estimates shown are for the assistance provided to manufacturers of dairy products. These estimates provide an indication of the maximum benefit that dairy farmers have received from the market and supplementary market support arrangements. If the actual increase in domestic prices for dairy products were less than the expected prices (shown in Table 5.2), because of import competition from New Zealand, for example, the transfers from consumers to dairy farmers would be less than those shown in Table 5.3. The transfers to dairy farmers would also be less if the assumption that all the benefit is passed on by manufacturers is not correct. However even if this assumption is incorrect, the size of the transfer from consumers would remain the same.
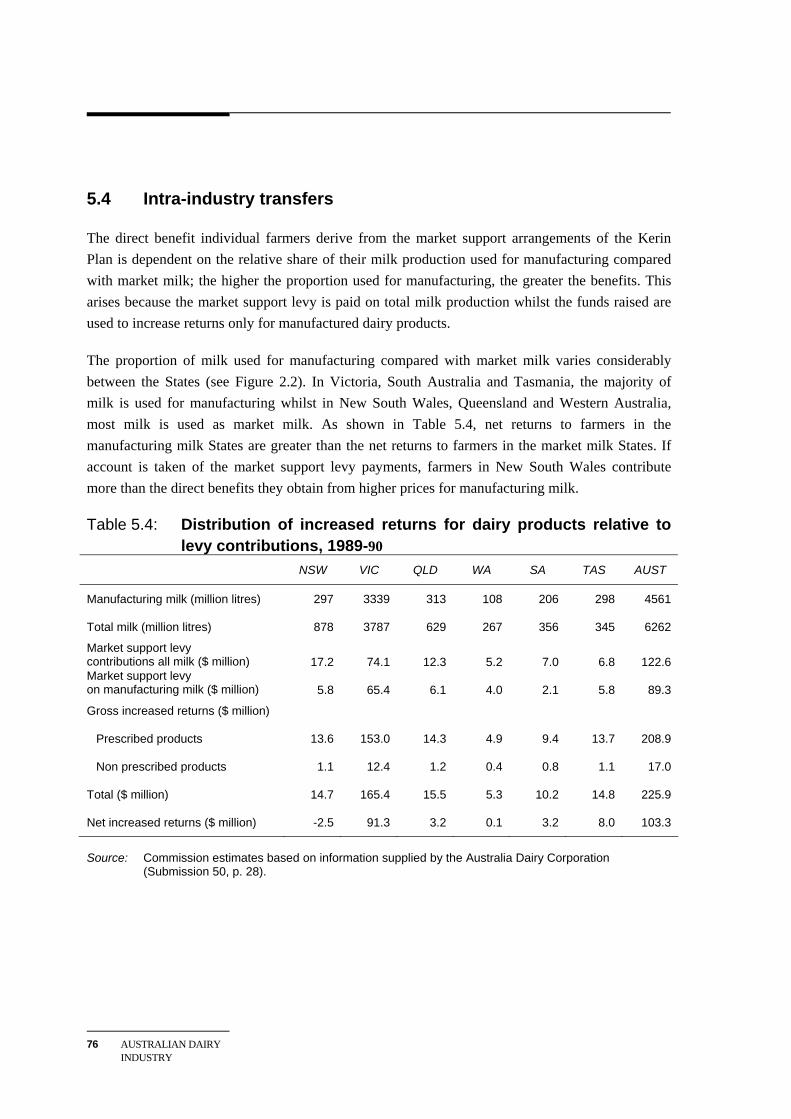
76 AUSTRALIAN DAIRY INDUSTRY
5.4 Intra-industry transfers
The direct benefit individual farmers derive from the market support arrangements of the Kerin Plan is dependent on the relative share of their milk production used for manufacturing compared with market milk; the higher the proportion used for manufacturing, the greater the benefits. This arises because the market support levy is paid on total milk production whilst the funds raised are used to increase returns only for manufactured dairy products.
The proportion of milk used for manufacturing compared with market milk varies considerably between the States (see Figure 2.2). In Victoria, South Australia and Tasmania, the majority of milk is used for manufacturing whilst in New South Wales, Queensland and Western Australia, most milk is used as market milk. As shown in Table 5.4, net returns to farmers in the manufacturing milk States are greater than the net returns to farmers in the market milk States. If account is taken of the market support levy payments, farmers in New South Wales contribute more than the direct benefits they obtain from higher prices for manufacturing milk.
Table 5.4: Distribution of increased returns for dairy products relative to levy contributions, 1989-90 NSW VIC QLD WA SA TAS AUST
Manufacturing milk (million litres) 297 3339 313 108 206 298 4561
Total milk (million litres) 878 3787 629 267 356 345 6262
Market support levy contributions all milk ($ million) 17.2 74.1 12.3 5.2 7.0 6.8 122.6 Market support levy on manufacturing milk ($ million) 5.8 65.4 6.1 4.0 2.1 5.8 89.3
Gross increased returns ($ million)
Prescribed products 13.6 153.0 14.3 4.9 9.4 13.7 208.9
Non prescribed products 1.1 12.4 1.2 0.4 0.8 1.1 17.0
Total ($ million) 14.7 165.4 15.5 5.3 10.2 14.8 225.9
Net increased returns ($ million) -2.5 91.3 3.2 0.1 3.2 8.0 103.3
Source: Commission estimates based on information supplied by the Australia Dairy Corporation
(Submission 50, p. 28).

COMMONWEALTH MARKETING ARRANGEMENTS
77
Victoria is the major beneficiary of the arrangements, both in absolute terms and relative to levy contributions. The Australian Dairy Corporation said:
there is no doubt that the current All Milk Levy provisions involve a transfer within the industry to producers
of manufactured export products. (Submission 17, p. 37)
The data presented in Table 5.4 have been substantially revised from the version contained in the Commission's draft report to take account of additional details supplied by the Australian Dairy Corporation after the release of the draft report. The table now shows the transfers of revenue between the States resulting from the market support levy and payment arrangements taken in isolation.
The total increased returns for dairy products are estimated at $225.9 million based on the assumption that the increase in domestic prices is equal to the market support payments. To obtain these increased returns, dairy farmers paid $122.6 million in levy contributions; their net gain was therefore $103.3 million, the transfer from consumers.
In calculating the increased returns from the market support payments, no transfers from consumers to producers have been included for non-prescribed products. But for this to be the case, it would require prices for non-prescribed products sold domestically to be unaffected by the market support payments on exports of those products. To the extent that domestic prices of the products were increased by the payments, the increased returns shown in Table 5.4 will be under estimated.
If, however, the transfers from consumers to producers had been included for non-prescribed products, the increased returns would have been overstated to the extent that prescribed products, such as butter, are used to make non-prescribed products. This is because of the benefits of the market support payments would be counted twice, once for butter as a prescribed product and then again as an input to the non-prescribed product. The Commission was unable to obtain the data required to calculate the net transfer from consumers to producers for non-prescribed products.
No account is taken in Table 5.4 of the indirect effects of the Kerin Plan on the prices received by farmers for market milk. One major indirect effect is the benefit to New South Wales dairy farmers because of the ‘protection’ given to the market milk arrangements in New South Wales through the Kerin Plan. Mechanisms have been put in place to restrict interstate trade in market milk, especially from Victoria into New South Wales (see Chapter 4).
These mechanisms appear to provide the incentive for the New South Wales dairy industry to continue to make a net contribution to the market support arrangements for manufacturing milk. As a quid pro quo, because of the relative benefits it receives, the Victorian dairy industry appears willing to refrain from making substantial interstate sales of market milk and to forgo the potential higher returns from fresh milk sales in New South Wales.

78 AUSTRALIAN DAIRY INDUSTRY
5.5 Efficiency costs of increased prices for manufacturing milk
Prices received by dairy farmers for manufacturing milk are higher than they would otherwise be because of the transfer from consumers. In Australia, the gross increase in returns for manufacturing milk was estimated at $225.9 million. To achieve this increase producers of manufacturing milk contributed $89.3 million in market support levies, providing a net increase in returns of $136.6 million (see Table 5.4). Given manufacturing milk production of 4561 litres, this means that average returns to farmers from manufacturing milk were increased from 21.4 to 24.4 cents per litre as a result of the market support payments in 1989-90.
The gross increase in dairy product prices paid by consumers, and the net increase in farmer returns for manufacturing milk, impose social costs on the Australian community; these are depicted by the shaded areas in Box 5.1. Because prices for dairy products are higher as a result of the market support payments, consumers have to pay more whilst consuming less than they would be in the absence of such payments.
Some of the increased amount paid by consumers is transferred to producers and is estimated at $108 million for 1989-90 (see Table 5.3). In addition to this transfer, there is a net loss to society because of the increased price for dairy products paid by consumers. For Australia, this loss has been estimated at $1.0 million using an own price elasticity of demand for dairy products of -0.2; $1.2 million using a demand elasticity of -0.25 (considered by the Commission to be the most likely elasticity); and $3 million using a demand elasticity of -0.6.
The net increase in prices paid to farmers for manufacturing milk encourages them to allocate more resources to milk production and to expand output. The cost of these resources is greater than the price received on the world market; their use in dairy production, therefore, imposes a net loss on society. For 1989-90, the loss for Australia has been estimated at $4.1 million using an own price elasticity of supply for milk of 0.5; $11.8 million using a supply elasticity of 1.5 (considered by the Commission to be the most likely elasticity); and $23.5 million using a supply elasticity of 3.2.
Using the Commission's most likely elasticities, the combined consumption and production losses are estimated at $13 million for 1989-90. This and other loss estimates have been calculated to provide a guide to the size of the efficiency costs imposed on the Australian community by the market support levy and payment arrangements. The usefulness of the guide depends on the accuracy of the selected elasticities and on the validity of three assumptions underlying the estimates: that domestic prices for prescribed products increase by the full extent of the market support payments; that there is no increase in the domestic price for non-prescribed products as a result of the payments; and that the Australian dairy industry would remain a net exporter in the absence of the market support arrangements.

COMMONWEALTH MARKETING ARRANGEMENTS
79

80 AUSTRALIAN DAIRY INDUSTRY
As already indicated, no reliable data are available on which to change the first and second assumptions. In respect to the third assumption, should the industry cease to remain a net exporter and become either a net importer, or a non-trader of dairy products, the production and consumption losses associated with the arrangements will be less than those indicated. However, the results of the analysis undertaken for the Commission using the ORANI-F-MILK model indicate that the industry will remain export orientated (see Chapter 9). Research work undertaken by the Australian Bureau of Agricultural and Resource Economics (ABARE 1991c) and the Victorian Government (Submission 65) also indicates that the industry would remain export orientated if the Commission's recommendations were implemented.
The costs to the Australian community would also have been greater if the export subsidies had been paid by the Commonwealth Government from consolidated revenue instead of from a levy imposed on dairy farmers. In this situation, the increase in prices received by farmers would have been 5 cents per litre instead of 3 cents per litre. More resources would have been attracted into milk production, increasing the costs imposed on the community. A government funded subsidy is also more likely to be contrary to the General Agreement on Tariffs and Trade. The costs imposed on consumers through higher prices for dairy products are the same regardless of whether the subsidy is funded from consolidated revenue or by industry.
The above estimates of consumption and production losses are based on average price distortions faced by Australian dairy farmers and consumers as a result of the market support arrangements. The estimates do not, for example, take into account the differing distortions faced by dairy farmers in the States as a result of the revenue transfers shown in Table 5.4. To analyse the impact of the differing distortions would require extensive data on the supply response of farmers in the different producing regions. Such data are not available.
The usefulness of the estimates of the efficiency costs published by the Commission in its draft report were questioned by, for example, the Australian Dairy Corporation (Submissions 50 and 62) and the Australian Dairy Industry Council (Submission 48). Concerns were expressed about the use of the first and third assumptions noted above; the use of supply elasticities which were too high; and the static, accounting nature of the Commission's analysis. Based on a further survey of the literature, the Commission has revised the elasticities used to calculate the efficiency losses. However, the elasticities used for the draft report were in the same range as those now used.
The Commission acknowledges the limitations imposed by the static, accounting nature of its analysis. However, it considers that the analysis presented provides a useful guide to the size of the efficiency losses involved. This is particularly so given the lack of detailed data from which to conduct a more disaggregated, dynamic analysis.

COMMONWEALTH MARKETING ARRANGEMENTS
81
5.6 Market milk prices and interstate trade
In analysing the impact on prices received by dairy farmers under the Kerin Plan, no consideration has been given to prices for market milk. Traditionally there has been a strong separation between the marketing arrangements for market milk and those for manufacturing milk. Responsibility for market milk has resided with the States (see Chapter 4) and for manufacturing milk with the Commonwealth. But improved transport and farm milk quality (most milk is suitable for use as market milk) have acted to make the distinction completely arbitrary. Milk can now be transported over long distances at relatively low cost which is making it increasingly difficult for States to maintain higher administratively set prices for market milk.
However, the increased price for manufacturing milk from the market support payments lowers the difference between the two prices and reduces the incentives for interstate trade in market milk. In this way, the marketing arrangements of the States for market milk, and the Commonwealth arrangements for manufacturing milk, are linked. The Victorian Government said:
Because the manufacturing price is higher there is a reduced incentive for processors to attempt to trade
interstate which makes the premium price for market milk more secure. (Submission 34, p. 30)
As just noted, the difference between market and manufacturing milk prices provides an incentive for interstate trade in fresh milk. The incentive arises because milk which would otherwise be sold at the lower manufacturing price, say, in Victoria can be transported to Sydney and sold at the higher price prescribed for market milk in New South Wales. In doing so, the ability of New South Wales to maintain that higher price is reduced, as is the benefit to New South Wales dairy farmers from market milk sales. These farmers are also net contributors to the benefits, realised mainly by Victorian farmers, from the Kerin Plan.
The Victorian Government has modelled the effects of State and Commonwealth Government policies on the Australian dairy industry. In reporting the results of the model it stated:
When the model is run with no policies of any kind in place there is negligible trade between States,
suggesting that the only incentive for interstate trade in market milk is the difference in prices between
market milk and manufacturing milk, transport costs being high enough to make interstate trade unprofitable
otherwise. (Submission 34, p. 29)
In the development of the Kerin Plan, New South Wales dairy farmers sought protection from the need to make market support levy contributions in the face of competition from interstate trade in market milk. This protection was provided by the market support levy revocation clause, known as the ‘comfort clause’. The NSW Dairyfarmers Association said:

82 AUSTRALIAN DAIRY INDUSTRY
NSWDFA was not prepared, as part of the Kerin Plan, to lock in to a five year imposition of the all milk levy
(at an average cost off the top of $7000 per farmer) if during that five year period interstate trade in milk
became a reality. We needed an "out clause" to relieve our farmers of that imposition so they could more
readily compete on the market place. (Submission 38, p. 6)
The ‘comfort clause’ provides for the suspension of the market support levy at a time of ‘significant disruption or change in that [market milk] sector’ (House of Representatives, Hansard, 7 May 1986, p. 3208). By suspending the levy, the market support payments would end, thereby reducing the funds to subsidise exports of manufactured dairy products. In turn, the reduced returns for manufactured dairy products would most adversely affect milk returns for Victoria, given the dependence of farmers in that State on sales of milk for manufacturing purposes.
The ‘comfort clause’ has been invoked twice in 1987 by New South Wales in response to Victorian milk being sold in the Sydney market at less than prescribed prices (see Appendix E, Box 1). On neither occasion was the levy actually suspended because action was taken by the dairy industry authorities of New South Wales and Victoria to limit the volume of milk sold into the Sydney market. The ‘comfort clause’ thus acts to protect the pricing arrangements of the States by restricting interstate trade in market milk. However, because of concerns about the effectiveness of the ‘comfort clause’, the Victorian Government amended Section 38 of the Victorian Dairy Industry Act 1984 in November 1987 (see Section 4.1.5). The amendment effectively removed the incentives for Victorian processors to trade processed milk interstate and so helped preserve the benefits to New South Wales dairy farmers from their higher priced fresh milk market.
In response to the Commission's draft report, several participants considered that the ‘comfort clause’ would not provide the discipline over interstate trade in market milk (to prevent a sharp decline in market milk prices) sought by the Commission. This was mainly because, in contrast with Section 38, the ‘comfort clause’ did not seek to stabilise the price for market milk directly. The Australian Dairy Industry Council stated that:
the industry believes that Section 38 gives the capacity to ensure all farmers are treated equitably in the
supply of market milk and that Section 38 gives the state governments the capacity to set a farm gate price for
farmers that will be adhered to by processors of milk irrespective of the destination for which they are
sending their product. (Submission 48, p. 5)
The Australian Dairy Corporation also expressed concerns about the continued use of the ‘comfort clause’. The Corporation argued that the ‘comfort clause’ impacted adversely on its planning and budgeting processes because the funding of the market support payments could be suspended at short notice. Such a suspension could have a number of important equity considerations (Submission 50, p. 21).

COMMONWEALTH MARKETING ARRANGEMENTS
83
The Commission accepts that the ‘comfort clause’ does not seek to stabilise farm gate prices for market milk in the same direct manner as would section 38 type legislation. Rather, the ‘comfort clause’ acts indirectly to impose some discipline on interstate trade in market milk which, in turn, seeks to stabilise farm gate prices for the milk. Its effectiveness depends on influencing the behaviour of people so that they refrain from making interstate sales of market milk. The influence derives from the financial loss they would incur if the market support levy was suspended and the market support payments ceased as a result of their actions.
Despite its indirect method of operation, the Commission still considers that the ‘comfort clause’ would provide sufficient discipline over interstate trade during the phasing period for implementing its recommendations. This judgment, however, is dependent on State governments taking action to reduce the differential between market and manufacturing milk. As discussed above, by reducing the differential, the incentive for interstate trade in market milk is also reduced. Failure of the States to reduce the differential would increase the incentives for interstate trade and, in doing so, increase the potential for market milk prices to decline sharply. Such a sharp decline would bring about the necessary realignment of market and manufacturing milk prices, but could impose unnecessary disruption costs on the industry.
The Commission is unaware of any other mechanism available to the Commonwealth through which to provide some discipline over interstate trade in market milk during the phasing period in mind. It is not prepared to consider the use of section 38 type legislation because of the advice received from the Commonwealth Attorney-General's Department that such legislation is contrary Section 92 of the Australian Constitution (see Section 4.1.5). Even if the legislation were found not to offend the Constitution, it would be inappropriate to introduce additional section 38 type legislation given the Commission's approach of removing all restrictions on interstate trade by 1 July 1996.
5.7 Conclusion
By imposing a levy on all milk and using the funds raised to increase returns to dairy farmers for manufacturing milk, the Kerin Plan has explicitly linked the marketing arrangements for market and manufacturing milk. The link is reinforced by the ‘comfort clause’.
The link has helped maintain the higher prices for market milk and the unnecessary costs that these prices impose on consumers of fresh milk. As estimated in Chapter 4, these higher prices have imposed efficiency costs on the Australian community in the order of $15.7 million based on the Commission's most likely estimates of the elasticities of supply and demand. These costs are additional to the efficiency losses in the order of $13 million estimated for the Commonwealth market support arrangements using the same, most likely elasticities.

84 AUSTRALIAN DAIRY INDUSTRY
The Commission considers that such costs should not continue to be imposed on the Australian community and that the involvement of government in the marketing arrangements should be changed.
There are two considerations which have to be assessed in the decision to remove the involvement of government. The first is whether the removal should be complete, whilst the second is concerned with whether the removal should be phased over a number of years.
So far as the first consideration is concerned, the Commission believes that, for so long as there is general tariff protection for manufacturing, then there should not be complete removal of government assistance to the dairy industry. As far as possible, the assistance provided through government involvement should the same as that provided to manufacturing industries. This means that current assistance of around 20 per cent through the market support arrangements should be phased down to 5 per cent by July 1996, in order to be equivalent to the Government's scheduled reduction in general tariffs to 5 per cent by that date. Any further reductions in general tariffs after that date should be reflected in similar reductions in assistance to the dairy industry.
The industry argued that providing assistance to the dairy industry at 5 per cent of export parity prices was not equivalent to a 5 per cent tariff for manufacturing because the tariff was relative to import parity. As already stated, research undertaken by the Australian Bureau of Agricultural and Resource Economics, the Victorian Government, and by the analysis undertaken for the Commission, indicates that the dairy industry will remain export orientated if government involvement in the industry were removed. In this situation, export parity represents the appropriate price on which to assess the extent to which the dairy industry is assisted. However, in respect to manufacturing industries, most would remain import competing in the absence of government involvement and import parity becomes the relevant benchmark on which to assess assistance. The granting of 5 per cent (nominal) assistance to both the dairy industry and manufacturing industries would provide assistance of similar orders of magnitude relative to the prices that would prevail in the absence of government involvement.
The Commission's preferred method of providing assistance to the industry is through the current market support levy on all milk and the market support payments on dairy product exports. The costs imposed on the Australian community through this method are less than the costs which would be imposed if the support payments were funded by government.
The Australian Dairy Corporation suggested that the amount of assistance should be phased down by reducing the rate of the market support levy, rather than by reducing the ad valorem rate of assistance. The Corporation considered that reducing the levy rate would be less distortionary and administratively more efficient (Submission 50, p. 20). The Commission's objective is to reduce the amount of assistance to the dairy industry over a number of years in the least distortionary and disruptive way possible. It believes that this objective is more likely to be achieved by reducing the

COMMONWEALTH MARKETING ARRANGEMENTS
85
ad valorem rate of assistance to the industry each year. Implicit in this judgment is that the efficiency gains from reducing assistance in this manner will outweigh the greater administrative difficulties of concern to the Australian Dairy Corporation.
The Commission is mindful that, should Commonwealth assistance be removed too quickly, it would place the dairy industry under considerable pressure and may result in unnecessary adjustment costs being incurred. This would be particularly so if market milk prices were to decline sharply because of interstate trade. The Commission's preferred method for avoiding a disruptive decline in of market milk prices is to retain the market support levy revocation clause.
RECOMMENDATIONS
5.8 Other Commonwealth influences over dairy marketing
5.8.1 Trade Practices Act
Three issues have emerged in the inquiry that involve the provisions of the Trade Practices Act 1974, particularly Part IV dealing with restrictive trade practices. Two concern the potential for abuse of market power to the detriment, in the first instance, of dairy farmers but ultimately the whole community through a loss of efficiency. These issues are:
The Commission recommends that:
assistance continue to be provided to the Australian dairy industry by means of a levy on all milk to fund market support payments on dairy product exports;
the maximum level of market support payments as at 1
July 1992 be set at 20 per cent of average export prices; the level of assistance provided each year thereafter should
be phased down in equal annual amounts until 1996 when it should be set at 5 per cent;
subsequent general reductions in tariffs should apply to the
level of assistance of the market support payments; and the market support levy revocation clause (comfort clause)
remain operative.

86 AUSTRALIAN DAIRY INDUSTRY
the concentration of buyers of milk and sellers of dairy products; and
the adequacy of competition laws in dealing with price discrimination in trans-Tasman trade.
The third issue concerns possible collusion between State dairy industry authorities in interstate trade of market milk. As discussed in Chapter 4, there are efficiency costs in any arrangement that limits trade in market milk.
Concern was expressed by a number of participants about the potential for market power abuse in the absence of statutory marketing arrangements in the dairy industry. The Australian Dairy Farmers Federation said:
There are more than 15,000 individual dairy farmers producing milk in Australia. The large number of
producers have no power in the market place, which is characterised by a relatively small number of
processors and an even more highly concentrated domestic retail sector which is the market place for the vast
majority of the milk and milk products that the farmer produces. (Submission 4, p. 22)
The Federation then argued that:
The only mechanism producers have to counter the market power of the processing and retailing sectors of
the food industry is through Statutory Marketing Authorities and Statutory Marketing Arrangements.
(Submission 4, p. 22)
The issue of an imbalance in bargaining power as a rationale for the existence of statutory marketing authorities was examined in the Commission's Statutory Marketing Arrangements for Primary Products report. That report concluded that:
under certain conditions the provision of countervailing power might be sound. Such conditions include a
lack of buyer contestability arising from one processor squeezing out all competition because of economies of
size, non-exposure to international (and regional and interstate) trade in the commodity (and possibly end
products) and limited substitution prospects. However, the Commission did not find any cases where these
conditions were satisfied. (IC 1991d, p. 58)
Establishing a statutory marketing arrangement to overcome market power abuse is not costless and the costs could outweigh any benefits of redressing the imbalance of power. The Commission concluded in its report on statutory marketing arrangements that the ‘granting (primary producers) statutory power to increase their domestic returns is not likely to be sound from a wider community's viewpoint’ (IC 1991d, p. 3).
The Industry Commission considers that if problems of imbalance of marketing power exist they should be addressed through generally applicable competition laws.

COMMONWEALTH MARKETING ARRANGEMENTS
87
Australia's competition laws are principally contained in the Trade Practices Act 1974, administered by the Trade Practices Commission.3 Part IV of the Act contains provisions that seek to deter behaviour that reduces or prevents competition in a market. The Act's provisions apply to the pricing behaviour of firms to the extent that they prevent anti-competitive agreements; price agreements between either buyers or sellers; predatory pricing where it has the purpose of damaging a competitor; and, in certain circumstances price discrimination. A single buyer offering only one outlet or purchase price does not breach the Act unless its purpose is to damage a competitor.
The solution currently available to producers to counter the market power of a single buyer is through collective marketing agreements. As most agreements of this kind would contravene the Act, an exemption or authorisation is required. There are three main ways of gaining an exemption: by regulation; by authorisation; or, where an arrangement is specifically endorsed by Commonwealth, State or Territory legislation.
Under Section 172(2)(a), certain activities of organisations (or bodies) which perform functions in relation to the marketing of primary products can be exempted by regulation. Responsibility for proposing exempting regulations lies with the Commonwealth Attorney-General, but such regulations are subject to disallowance by the Commonwealth Parliament. The major weakness of the regulation process is that the criteria for approval does not centre on the wider community interest and the effects on economic efficiency. This procedure has not been used extensively, with the alternative of authorisation being the preferred means for granting exemption.4
Exemption by authorisation is the Trade Practices Commission's preferred procedure for exempting arrangements designed to provide primary producers with countervailing market power. Not all such arrangements can be authorised. For instance, the Trade Practices Act 1974 does not allow for the authorisation of compulsory price agreements. In 1989 the Trade Practices Commission stated that it could not support an amendment to the Act to allow authorisation of price agreements as they are ‘highly anticompetitive, encourage economic inefficiency and would herald a wholesale departure from the basic tenet of the Trade Practices Act’ (TPC 1989, p. 21).
Unlike regulation, authorisation is a public process and applications must satisfy a public benefit test:
For arrangements that may substantially lessen competition, the applicant must satisfy the Commission that
the provisions of the arrangement result in a benefit to the public that outweighs any anticompetitive effect.
(TPC 1989, p. 3)
3 A right of private action is also available under the Act. 4 Not all restrictive practices can be authorised and must use the regulation procedure. For example, voluntary price
agreements involving less than 50 parties cannot be authorised.

88 AUSTRALIAN DAIRY INDUSTRY
The Industry Commission considers that the public benefit would be maximised by allocating resources effectively. The Industry Commission notes, however, that the concept of a public benefit outlined in the Trade Practices Commission's, Rural Guideline, appears to include factors which are not related to economic efficiency.
The Industry Commission also considers that a market power imbalance is not likely to arise in the dairy industry if it were to be deregulated and the statutory marketing authorities ceased to regulate the markets. Increased concentration in an industry does not necessarily mean that there is a lack of effective competition. As stated in the IAC Food Processing Report; ‘despite high and increasing concentration in most sectors ... the food processing and beverages industries are generally competitive and/or contestable’ (IAC 1989b, p. xii).
Furthermore, the dominant role of farmer owned cooperatives, and the increasing vertical integration between farming, processing and manufacturing, indicates that farmers are not without market power. In Victoria, for example, during 1989-90, 65 per cent of manufacturing milk - or 57 per cent of all milk - was purchased by cooperatives. The major co-operatives also have a ‘foothold in the pasteurised milk processing sector’ (Australian Dairy Products Federation, Submission 14, p. 14). By virtue of this ownership factor, the interests of dairy farmers should be protected in the prices paid by processors for milk.
In summary, the Industry Commission considers that increasing concentration among buyers of dairy products is unlikely to result in abuse of market power. The Trade Practices Act 1974 is the preferred means of ensuring those buyers with market power do not exercise it to the detriment of the Australian community. Some changes to the Act would improve its ability to deal with monopsony. For example, amending the misuse of market power provisions to make monopsony pricing more readily actionable and extending the price discrimination provisions to cover the actions of buyers as well as sellers. These areas should be addressed rather than exempting or authorising arrangements that confer countervailing power on producers.
The second issue of the potential for abuse of market power in trans-Tasman trade was also of concern to some participants. As noted in Chapter 3, the New Zealand Dairy Board is a legislated monopoly that controls New Zealand's dairy exports. Because of this monopoly position, the Australian Dairy Farmers' Federation expressed concern at the potential for the Board to cross-subsidise sales into the Australian market (Submission 4, p. 4).
The Commission considers that there are several factors which would act to limit the monopoly behaviour by the New Zealand Dairy Board. Dumping controls were removed on trans-Tasman trade and competition laws extended to cover relevant anticompetitive conduct when Article 4 of the ANZCERTA - Protocol on the Acceleration of Free Trade - was introduced in 1990. The Trade Practices Act 1974 has been amended to prohibit a corporation, with substantial market power in a trans-Tasman market, from taking advantage of that power for the purposes of eliminating or

COMMONWEALTH MARKETING ARRANGEMENTS
89
substantially damaging a competitor, preventing entry into a market, or deterring a person from engaging in competitive conduct (TPC 1990). The amendment should provide the Australian dairy industry with a means of redress should anticompetitive practices in trans-Tasman trade in dairy products emerge.
The third issue is whether the Act would apply in situations where State dairy industry authorities negotiate market share agreements and use their powers to enforce the agreement on processors and purchasers of market milk. Section 45 of the Act prohibits anticompetitive contracts, arrangements or undertakings. However, Section 51(1) of the Act exempts those activities specifically authorised by Commonwealth, State and Territory legislation from its provisions. During the late 1980s, the New South Wales and Victorian dairy industry authorities appear to have concluded an arrangement that, except for the Section 51(1) exemption, may well have contravened the Trade Practices Act (see Appendix E, Box 1).
The Industry Commission considers that arrangements of this kind are anticompetitive and are likely to impose efficiency losses on the Australian community. Anticompetitive market behaviour should only be exempted from the provisions of the Trade Practices Act if the exemption results in a net benefit to the Australian community. The November 1991 special Premiers' Conference will consider whether the provisions of the Trade Practices Act should be extended to cover statutory marketing authorities.
5.8.2 Export Quality Control
All dairy exports are subject to quality standards inspection by the Australian Quarantine Inspection Service. A brief outline of its involvement is provided in Appendix E. The rationale and effects of government intervention in export quality control was examined in the Industries Assistance Commission's report on the food processing and beverages industries (IAC 1989b, pp. 88-89) in which several recommendations were made on export quality control; the Government has yet to address these elements of the Commission's recommendations. The Commission will not re-examine these issues in this report.

AUSTRALIAN DAIRY CORPORATION
91
6 AUSTRALIAN DAIRY CORPORATION
The Australian Dairy Corporation has undergone significant change over recent years. Changes have occurred in respect to its own internal structure and accountability to industry and Parliament and to its operations within the dairy industry. Many of the changes are the result of the Commonwealth Government's reforms of primary industry statutory marketing authorities announced in January 1986 (Commonwealth of Australia 1986) and the marketing arrangements for dairy products introduced with the Dairy Produce Act 1986. Pressures for change have also occurred as a result of developments in the world dairy market.
The 1986 reforms of the statutory marketing authorities have recently been reviewed for the Commonwealth Government by a Committee chaired by Professor Davis; its report is known as the Davis Committee Report (Commonwealth of Australia 1990). Statutory marketing arrangements for agricultural commodities have also been the subject of separate inquiry and report by the Industry Commission (IC 1991d). The purpose of this chapter is to evaluate the regulatory and commercial operations of the Australian Dairy Corporation.
6.1 Objective and operations of the Australian Dairy Corporation
The Australian Dairy Corporation is a statutory authority constituted under the Dairy Produce Act 1986. 1 The objective of the Corporation is to enhance the profitable production and marketing of Australian dairy produce. This objective is pursued through a number of functions which are specified in the Act and reproduced in Box 6.1. It is also pursued through its subsidiary, Austdairy (see Section 6.6).
As indicated by the functions, the Corporation is concerned mainly with the export of dairy products and with the generic promotion of dairy products on both the export and domestic markets. Although the Corporation is involved in the promotion of fresh milk, it is not directly involved in its marketing - this is the province of the State dairy industry authorities (see Chapter 4). In addition to its marketing activities, the Corporation is responsible for administering the market support and underwriting arrangements. 1 The origins of the Corporation date back to 1924 with the introduction of the Dairy Produce Control Act and the
establishment of the Dairy Produce Control Board. This Board was responsible for regulating the export of butter and cheese and its distribution and sale overseas.

92 AUSTRALIAN DAIRY INDUSTRY
6.1.1 Accountability of the Corporation
The Corporation is accountable to both Parliament and to industry through the Australian Dairy Industry Council (ADIC). Part of the Corporation's accountability process involves the preparation, in consultation with the Council, of corporate and annual operating plans. These plans are also subject to approval by the Minister for Primary Industries and Energy.
The way in which the Corporation accounts to industry was assessed in the recent Davis Committee Report (Commonwealth of Australia 1990). The Corporation currently reports, at a public meeting, to the Australian Dairy Industry Council and, through it, to the industry. The Davis Committee has recommended instead that the Corporation report to an annual general meeting of its stakeholders - the levy payers from both the farming and manufacturing sectors.
Box 6.1: Functions of the Australian Dairy Corporation.
As specified in Section 7 of the Dairy Produce Act 1986, the functions of the Corporation are:
(a) to improve the marketability of Australian dairy produce; (b) to promote the consumption of Australian dairy produce, both in
Australia and in foreign countries; (c )to assist in the marketing of Australian dairy produce for export and
for trade and commerce among the States, between States and Territories and within the Territories;
(d to control the export from Australia of dairy produce; (e) to control the marketing of dairy produce that has been exported from
Australia; (f) to advise the Minister on matters relating to the marketing of dairy
produce including matters related to the export from Australia of dairy produce;
(g) to provide assistance by way of loans to manufacturers of dairy
produce in Australia; (h) to deal in dairy produce; and (j) such other functions as are conferred on the Corporation by or under
an Act.
Source: Dairy Produce Act 1986, Section 7.

AUSTRALIAN DAIRY CORPORATION
93
The Government has accepted this recommendation (Minister for Primary Industries and Energy 1990c). The Commission understands that the changes stemming from the Davis Committee Report in respect to the Australian Dairy Corporation may not be enacted until legislation is introduced to replace the current Commonwealth arrangements when they expire on 30 June 1992.
The Australian Dairy Industry Council is partly funded from the dairy industry fund administered by the Corporation and received $430 000 from the fund in 1989-90 (see Table 6.2). This money was paid to offset the costs incurred by the Council in meeting accountability obligations placed on it by the Corporation's enabling legislation.
However, such payments may make the Council an inappropriate body through which the Corporation accounts to industry about its performance. There is a potential conflict of interest on the part of the Council in acting as a watch dog, on behalf of individual farmers and manufacturers, over an organisation from which it receives part of its funding.
The Australian Dairy Industry Council strongly disagreed that a potential conflict existed from receiving part of its funding through the Australian Dairy Corporation:
There has never been any suggestion of the ADC pressuring the ADIC in respect of its accountability or other
responsibilities under the Act, and nor should it be expected, given the strongly held and agreed view,
between industry and the ADC, that the assets associated with the ADC, Austdairy, and the Dairy Industry
Fund are ultimately owned by the industry. (Submission 48, p. 16)
The Commission considers that effective accountability depends on the existence of ‘arm's length’ relationships between an organisation and its stakeholders. Not only should the relationship be at arm's length, it must also be seen as such. Even if, as claimed, the Corporation has not pressured ‘the ADIC in respect of its accountability and other responsibilities’, the receipt of money by the Council from the Corporation may give rise to the perception that the relationship is not at arm's length. As a result, the credibility of the accounting process of the Corporation to industry could be undermined.
The effectiveness of the accountability process is also enhanced if an organisation reports directly, in a public setting, to its stakeholders; that is, to those directly affected by the activities and financial performance of the organisation. In the case of the Australian Dairy Corporation's responsibility to industry, this means reporting directly to individual farmers and manufacturers and not to the Australian Dairy Industry Council as the representative organisation of these individual stakeholders. Reporting to the Council would only be as effective as direct reporting to individual stakeholders if:
the (potentially conflicting) interests of all individual stakeholders, including non-members of the Council and its affiliated bodies, were conveyed by the Council to the Corporation; and
94 AUSTRALIAN DAIRY INDUSTRY
if all individual stakeholders were provided with the same opportunity to be made aware of the Corporation's performance irrespective of their membership status.
The effectiveness of the accountability of the Corporation to the industry would be increased if the Corporation were to report to an annual general meeting of stakeholders as recommended by the Davis Committee and accepted by Government. This would provide all individual stakeholders with the opportunity to question the Corporation on its performance and to receive direct feedback about that performance. The potential for some stakeholders to be disenfranchised would be removed.
In addition, the potential for a conflict of interest on the part of the Council would be reduced. In accounting to industry though an annual general meeting, the need for the Corporation to make direct payments to the Council would be removed. This should ensure that the Government's guideline concerning payments by statutory marketing authorities to industry organisations are met:
SMA funds derived through statutory powers should not be paid to private industry organisations in any
circumstances where they could contribute to agro-political activities. (Commonwealth of Australia 1986, p.
6)
In respect to payment of funds to industry organisations, the Government has rejected the Davis Committee's recommendation that the boards of the authorities take full responsibility for determining the level and specific purposes of funding to industry bodies (Minister for Primary Industries and Energy 1990c).
6.1.2 Board membership
The Corporation has an eleven person Board. Except for the Chairperson, Managing Director, and Government Member, members are chosen by a selection committee according to their knowledge and expertise from across a wide range of fields including milk production, product promotion, international marketing, finance and business management.2 Appointment to the Board is by the Minister for Primary Industries and Energy and is normally for a period of three years.
This method of selecting board members was part of the 1986 reforms to Commonwealth statutory authorities to make them more accountable and commercial (Commonwealth of Australia 1986). In its response to the Davis Committee report, the Government has signalled its intention to consider further the issue of how board members are selected because of its continuing concerns about the influence of industry politics over the operations of statutory marketing authorities (Minister for Primary Industries and Energy 1990c).
2 Membership of the selection committee consists of a presiding member, appointed by the Minister for Primary
Industries and Energy, and four other members appointed by the Minister on the nomination of the Australian Dairy Industry Council.

AUSTRALIAN DAIRY CORPORATION
95
6.1.3 Funding the Corporation
The Corporation and its subsidiary, Austdairy, are financed directly from trading activities, interest, and the corporation and promotion industry levies. There is no direct government financial support for the Corporation. Government support is provided indirectly, however, through the Dairy Produce Levy (No. 1) Act 1986 (by the use of excise powers) to impose the industry levies. The levies are collected by the Department of Primary Industries and Energy for which a service fee is paid (see Table 6.2). The corporation and promotion levy rates are set in consultation with the Australian Dairy Industry Council and are currently 1.05 and 4.65 cents per kilogram of milkfat respectively (details about the market support levy are discussed in Chapter 5). Legislative limits of 2.5 and 5.5 cents respectively apply to the corporation and promotion levies.
Table 6.1: Australian Dairy Corporation income, 1988-89 and 1989-90 1988-89 1989-90
($'000)
Export sales of dairy produce Corporation 65 800 77 966 Austdairy 66 715 132 515 50 664 128 630
Levies Corporation 2 882 2 822 Promotion 13 588 12 495 Market support 123 443 122 082 Supplementary market support 21 855 161 768 (-652) 136 747
Interest Administration fund 157 454 Promotion fund 536 867 Market support fund 1 525 3 435 Supplementary market support fund - 168 Dairy industry fund 1 836 2 193 Trading operations 567 383 Industry bridging finance 5 771 10 392 5 399 12 899
Other income 1 974 1 771
Total operating income 306 649 280 047
Total operating expenses (refer Table 6.2)
279 197 269 858
Operating surplus 27 452 10 189 Source: ADC 1990b.

96 AUSTRALIAN DAIRY INDUSTRY
Table 6.2: Australian Dairy Corporation expenditure, 1988-89 and 1989-90 1988-89 1989-90
($'000)
Cost of export sales Corporation 61 141 73 097 Austdairy 65 640 126 781 49 865 122 962
Market support fund Payments 107 522 118 064 DPIE levy collection costs 147 107 669 66 118 130
Supplementary market support fund Payments 14 090 (-4) DPIE levy collection costs 98 14 188 20 16
Promotion Domestic 10 772 9 949 Export 983 11 755 744 10 693
Interest Trading operations 1 419 2 507 Bridging finance 5 517 6 936 5 164 7 671
Administration Export sales 1 416 1 524 Market support fund 1 535 1 443 Supplementary market support fund - 2 Promotion 2 551 2 120 DPIE levy collection costs
(promotion and corporation levy) 112 29
Dairy industry fund 2 023 2 134 ADIC operating expenses 443 430 Other 3 788 11 868 2 704 10 386
Total operating expenditure 279 197 269 858 Source: ADC 1990b.
Shown in Tables 6.1 and 6.2 are the income and expenditure details for the Corporation (and its subsidiary, Austdairy) for 1988-89 and 1989-90. Respective gross income for the years were $307 and $280 million. Operating profits were recorded in both years, $27 million and $10 million respectively.3 The administrative costs of the Corporation declined by around $1.5 million to $10.4 million in 1989-90 from $11.9 million in the previous year.
3 The operating surplus of the Australian Dairy Corporation is not liable for tax. This amounts to full imputation of
shareholders' dividends. Trading profits of its subsidiary, Austdairy, are taxable according to the tax laws of Hong Kong.

AUSTRALIAN DAIRY CORPORATION
97
In his address to the 1990 Annual General Meeting of the Australian Dairy Industry Conference (now Council), the Chairman of the Corporation stressed that many steps had been taken towards making the Corporation a ‘leaner and meaner’ organisation (Frearson 1990). There had been a reduction in administrative costs of 8 per cent real per annum over three consecutive years. Staff numbers had declined from 110 to 103 during 1989-90.
6.1.4 Commercial autonomy and ownership
A thrust of the Commonwealth's reforms for primary industry statutory marketing authorities was to make them self-funding, autonomous commercial organisations (Commonwealth of Australia 1986). Some recommendations of the Davis Committee are also designed to increase the autonomy of statutory marketing authorities and to make them more accountable for their actions (Commonwealth of Australia 1990). In respect to the Australian Dairy Corporation, the Government has accepted the recommendations to remove the need for the Minister for Primary Industries and Energy to approve the annual operating plans of the Corporation and to approve any transactions by the Corporation that are expected to make a loss.
The Government has also announced that it intends to introduce legislation so that it is not responsible for (non-government guaranteed) borrowings of statutory marketing authorities. In doing so, a ‘right to fail’ element would be introduced into the activities of the authorities and place them on a more equal footing with private firms (Minister for Primary Industries and Energy 1990c).
However, in its 1986 policy statement, the Commonwealth also recognised that there was a limit to the extent to which statutory authorities could be commercially independent. Because of their statutory basis, the authorities were to be accountable to the Parliament through the Minister for Primary Industries and Energy and subject to a general reserve power of direction from the Minister. The reserve powers were only to be used in exceptional circumstances involving actions by an authority which conflicted with Government policy (Commonwealth of Australia 1986, p. 23).
Because of the statutory basis of the Corporation and the Ministerial responsibilities involved, the possibility cannot be ruled out that direct government financial support would be provided if losses were incurred by the Corporation through its commercial activities. For political reasons, the Government may decide to make good such losses should they occur even though there is no legal requirement for it to do so; that is, Government may not be prepared (or able) to allow statutory authorities to fail. As stated in the Commission's report on statutory marketing authorities:
Nevertheless, Governments have sometimes provided assistance when SMAs have run into trouble. In effect
there has been an implicit government guarantee to many of these authorities, rather than one that is explicit.
(IC 1991d, p. 129)

98 AUSTRALIAN DAIRY INDUSTRY
This is illustrated by the extent to which the Government has been prepared to assist the wool industry beyond its legal requirement in respect to the floor price scheme operated by the Australian Wool Corporation.4 Because of this potential, taxpayers are bearing a residual commercial risk associated with the trading activities of the Australian Dairy Corporation. Hence, the Commission considers that there is a limit to which Ministerial control over the commercial operations of the Corporation can be relaxed, especially given the need for the Corporation to account to Parliament.
In response to the draft report, the Australian Dairy Corporation argued that the Commission had overstated the risks associated with its commercial trading activities (Submission 50, pp. 3-4). The Corporation asserted that the risks faced by Australian taxpayers were minimal because the Corporation only traded on a firm contract basis into selected markets (see Section 6.5) and its fund raising and futures trading activities were prescribed in its enabling legislation. In addition, should a trading loss be incurred by the Corporation, the loss would be debited against the industry-financed market support fund.
Although these factors would act to limit the commercial risks associated with the Corporation's activities, they do not remove completely the need for Ministerial control over the activities of the Corporation. The use of statutory powers to impose the market support levy to finance the market support fund which may be used, in the first instance, to make good any commercial losses incurred, constitutes sufficient justification for continued Ministerial control over the Corporation's commercial activities.
Associated with the issue of commercial autonomy is the question of ownership of assets (including financial reserves) of the statutory authorities. In most instances, the assets have been obtained from funds raised from industry, albeit from compulsory levies, and not from taxpayer funds. In the case of the Australian Dairy Corporation, this would indicate that the assets belong to the dairy industry. Questions of equity arise, however, as to whom should benefit if the assets were sold or, in the case of financial reserves, distributed.
4 There was no legal requirement on the Commonwealth Government to become involved in the difficulties
associated with the wool floor price scheme operated by the Australian Wool Corporation. The initial response of the Government was to provide loan guarantees to the Corporation which gave access to finance at preferential interest rates. When the Government reduced the floor price to 700 cents per kilogram clean, it provided $300 million to offset the difference between the market price and previous floor at the end of the 1990-91 season. The Government has also increased the assistance available through the Rural Adjustment Scheme which has the potential to assist wool growers in financial difficulties as a result of the collapse in the floor price scheme

AUSTRALIAN DAIRY CORPORATION
99
An alternative view is that, because of the statutory backing for the Corporation and the use of statutory powers to raise funds, ownership of the assets legally resides with the Commonwealth Government. If this is the case, the extent to which statutory authorities can be commercially independent and responsible for their actions is restricted - governments have a responsibility to ensure that the value of their assets is maintained.
Consistent with its position as expressed in the report on statutory marketing authorities, the Commission considers that the Government should make a policy statement clarifying its views on the ownership of the assets of the Australian Dairy Corporation and its subsidiary, Austdairy (IC 1991d, p. 116). Several organisations, including the Australian Dairy Corporation (Submission 50, p. 4) and the Australian Dairy Industry Council (Submission 48, p. 14), strongly supported the Government making a policy statement concerning the ownership of these assets.
6.2 Administering the market support and underwriting arrangements
Under the Dairy Produce Act 1986, the Australian Dairy Corporation is charged with the responsibility of administering the arrangements for the market support scheme and for underwriting. The purpose of this section is to assess whether the Corporation should continue to administer such arrangements if they were to be continued after 30 June 1992.
Administering the arrangements requires information about the size of payments to be made for different dairy products and to whom the payments are to be made. Also required is a financial system for making the payments. The decision concerning the organisation to carry out these functions should be determined by relative administrative costs. This means, therefore, that any argument to transfer the functions to another organisation - public or private - should be based on potential savings in the costs of administration.
Some indicators suggest that the administrative costs are likely to be lower for the Corporation. Firstly, the Corporation has been administering the arrangements since 1986 and has in place the required information, data bases and financial systems. Second, the Corporation has gained the confidence of the industry in the way it handles the commercially sensitive information required to administer the arrangements.
If the functions were to be transferred to another organisation, significant costs may be incurred in developing the capacity to administer the arrangements. To a large extent the capital costs of developing the required capacity has already been incurred (sunk) by the Corporation. In its report on statutory marketing authorities, the Commission acknowledged that:
100 AUSTRALIAN DAIRY INDUSTRY
An SMA may be an efficient vehicle for delivery of assistance if it is provided for market related objectives
or through prices and volumes sold. However, it is difficult to justify the provision of assistance as a sound
objective for statutory marketing arrangements in their own right. (IC 1991d, p. 73)
According to the Corporation, the costs of administering the market support arrangements in 1988-89 and 1989-90 were $1.54 million and $1.44 million respectively. The costs represented around 1.4 and 1.2 per cent respectively of the support payments. These figures suggest there is little scope for another organisation to achieve substantial cost savings because of inefficiency in administration by the Corporation.
The Commission considers that the amount of assistance through the market support payment system should be reduced to be equivalent to that provided by the general rate of tariff (5 per cent) by 1 July 1996; any further reductions in the general tariff rate after that date should also apply to assistance to the dairy industry (see Chapter 5). Under these circumstances, even if another organisation were more efficient, the potential to achieve significant cost savings to the industry would be limited; especially if the support arrangements were to cease soon after that date in line with any future government decisions to reduce the general rate of tariff to zero. The short period over which any alternative arrangements would operate would limit the opportunity for savings to offset the (transaction) costs of transferring the administration to another organisation, or for any new body to develop the necessary administrative capacity.
For above reasons, the Commission considers that the Australian Dairy Corporation should continue to administer the market support payment arrangements until they are terminated.
6.3 Industry information services
The Australian Dairy Corporation currently collects and compiles industry information and statistical data. These are published annually as the ‘Dairy Compendium’. Some of the information published in the Compendium is generated by, and needed for, the administration of the market support and underwriting arrangements. The information is also used extensively by industry and government for analytical and policy work.
The Compendium could be published by other organisations. Much of the information is already public and derived from a diverse range of sources such as State Departments of Agriculture/Primary Industry; State dairy industry authorities; the Australian Bureau of Agricultural and Resource Economics; the Australian Bureau of Statistics; the United States Department of Agriculture; and the United Nations' Food and Agriculture Organisation.
However, because of the complementarity between functions, the costs of providing industry information services are likely to be lower for the Corporation than if provided by a separate organisation. The data collected by the Corporation can be tailored to provide the information

AUSTRALIAN DAIRY CORPORATION
101
required to administer the above arrangements. The necessary confidentiality restrictions applying to commercial sales data can also be readily enforced by the Corporation.
The Commission considers that, whilst the Corporation is required to administer the market support and underwriting arrangements, it should continue to collect and publish industry data.
The Australian Dairy Corporation argued in its submission to the draft report that there was an underlying need to provide information services which was independent of its role in administering the market support payment arrangements (Submission 50, pp. 6-7). This need arose from the free rider problem associated with the public good characteristics of the information and potential confidentiality difficulties in obtaining some of the information. But the Commission is of the view that these problems do not constitute, in their own right, sufficient justification for establishing or retaining a statutory marketing authority.
The Commission considers that some form of government involvement would be required to reduce or overcome the free rider and confidentiality problems. What is at issue is the form and extent of that involvement. The involvement could be by making another government body, such as the Australian Bureau of Agricultural and Resource Economics, responsible for collecting and publishing information about the dairy industry. Alternatively, the government could contract out the task to private enterprise. The decision about which option to use should be based on the relative cost of producing the amount of information required so that there is not an under-provision of information services from the perspective of the Australian community.
6.4 Generic promotion
A specific function of the Australian Dairy Corporation is to promote the consumption of Australian dairy produce both in Australia and overseas. Expenditure on these activities, which are funded by a specific promotion levy on industry, totalled $11.76 and $10.69 million respectively in 1988-89 and 1989-90. Over 90 per cent in each year was spent on domestic promotional activities. Further promotion is undertaken by the State dairy industry authorities in respect to market milk ($14 million in 1989-90) and by firms for their own products.
The involvement of the Corporation in promotional activities is restricted to generic promotion of dairy products on the domestic and export markets.5 According to the Corporation, such promotion should be distinguished from brand advertising by companies which is directed to the specific attributes of their products in different market segments and which seeks to increase a company's market share relative to its competitors. By contrast, generic promotion is directed
5 Generic promotion in the domestic market is directed mainly at informing consumers of the health and nutritional
aspects of dairy products compared with substitutes. On the export market it is directed towards establishing markets, and particularly goodwill, for Australian dairy produce.
102 AUSTRALIAN DAIRY INDUSTRY
mainly at increasing the total demand for dairy products in the domestic market or for Australian dairy produce on the world market. As stated by the Corporation:
to be effective, generic promotion must focus on the longer term market expanding activities which are seen
to be independent of the specific brand considerations. (Submission 17, p. 16)
However, as noted in Section 4.4, it is not possible to distinguish completely between generic promotion and brand promotion. The amount and type of generic promotion undertaken will influence the nature and extent of brand promotion and vice versa.
Nevertheless, the benefits of generic promotion are more likely to accrue to the industry rather than individual firms. In these circumstances, individual firms are not able to capture solely for themselves the benefits of their promotional activity; that is , they are not able to exclude others from the benefits. There is, thus, an incentive for individuals to ‘free ride’ on the contribution of others. As a consequence, individual firms are unlikely to invest in generic promotion even though it may be in their collective interest to do so.
The promotion levy on all milk is a means of raising the necessary funds for generic promotion and of overcoming the free rider problem. This statutory levy is currently collected by the Department of Primary Industries and Energy and allocated to the Corporation to undertake promotional activities on behalf of the industry. In its report on statutory marketing arrangements, the Commission considered that such involvement of government could only be justified if ‘free riding’ problems existed:
Overall, where free rider characteristics are evident, some form of government intervention may bring about a
more efficient outcome. In these circumstances the provision of market information, market research and
generic promotion through a statutory scheme with the objective either of reducing marketing costs or
stimulating demand may be sound. Where free riding is not a problem, the objective is not sound. (IC 1991d,
pp. 65-66)
The dairy manufacturing and processing segments are characterised by a number of relatively large firms which are represented nationally by the Australian Dairy Products Federation. Because of this structure, it is unlikely that the free rider problem would be sufficient to warrant statutory intervention. If the firms considered that generic promotion would increase the total demand for their products over and above the increase from their own brand advertising, the funds required could be raised on a voluntary basis through the Federation. Peer pressure amongst members of the Federation is likely to minimise the potential for free riding.
The Australian Dairy Products Federation considered that the structure of the industry it represented would not overcome the free rider problem:
The ADPF does not agree with the Commission's assessment of the structure of the industry, its organisation,
the absence of free riding, and as such with the recommendation that the compulsory promotion levy cease.
(Submission 51, p. 10)

AUSTRALIAN DAIRY CORPORATION
103
The major reason advanced by the Federation was that the industry is made up of a relatively large number of smaller organisations, many of which are not members of the Federation. The Federation expressed the concern that ‘the free riding problem exists to such an extent in the dairy industry that it is unlikely there would be generic promotion’ (Public hearing transcript, p. 55).
The Federation then went on to say:
For example, the ice-cream federation represents ice-cream manufacturers and it has carried out generic
promotion of ice-cream but not all ice-cream manufacturers have participated because a lot of them have been
just happy to sit there and watch other people put the money up. (Public hearing transcript, p. 56)
The Commission considers that a compulsory statutory levy should not be used to raise funds for generic promotion. In the absence of compulsory levies, the Commission does not believe that there would be an underallocation of resources to generic promotion of dairy products because some firms would still find it in their interests to fund such promotion. The removal of the statutory levy would also place a greater responsibility on private firms to develop their own advertising/promotional activities and to balance the benefits of those activities against their costs.
Even more fundamental to the issue of the free rider problem, is the question of whether governments should be acting, directly or indirectly, to increase the consumption by individuals of milk and dairy products. Such action would only be warranted if milk possessed qualities of exceptional merit that were essential for the human diet and that, in the absence of government involvement, individuals would not consume milk and dairy products in sufficient quantities for a healthy society. In other words, milk was a ‘merit good’ whose consumption had to be encouraged by government to ensure that a socially optimum amount was consumed.
Milk and dairy products are no more essential for a healthy diet than other food items such as fresh fruit and vegetables. From this perspective, by seeking to increase the demand for milk and dairy products relative to other food items, the motive for undertaking generic promotion would appear to be purely commercial. Once again, there is no underlying justification for government involvement is generic promotion.
If manufacturers of dairy products still wished to raise funds voluntarily for generic promotion, the Commission considers that the Corporation may be an appropriate organisation to carry out such activities whilst it continues to administer the market support arrangements. However, such promotional activities do not constitute, in themselves, a reason for having such a statutory marketing authority.

104 AUSTRALIAN DAIRY INDUSTRY
6.5 Export marketing
Under the Dairy Produce Act 1986, the Corporation has statutory powers to control exports; that is, powers to make the final decision over exports sales in respect to quality, price, quantity, payment arrangements, and by whom delivery is effected. However, as indicated in Chapter 5, the Corporation's involvement in export marketing has declined under this Act, mainly as result of the end to export pooling and equalisation, and is now subject to the agreement of the Australian Dairy Industry Council. Its trading activities are now limited to markets where the Corporation and Council judge that the exercise of statutory controls over exports has a clear potential to increase export returns to Australia.
Increased export returns would be realised only if the structure of the market in the importing country provided preferential access to higher prices (rents) which would be dissipated if exports from Australia were not co-ordinated. Currently the Corporation exercises its export controls in respect to four markets:
the European Community where Australian access is limited to a quota of 3000 tonnes of cheddar cheese per year;
the United States market where Australian access is limited to a quota of 4000 tonnes of variety cheeses per year;
the bulk cheese market in Japan for processing/shredding cheeses; and
the bulk butter and skim milk powder markets for government instrumentalities in Japan.
The Corporation also exercises its export control powers to ensure that the minimum prices of the International Dairy Arrangement are observed. Consistent with the views of the Davis Committee (Commonwealth of Australia 1990, p. 45), the Commission considers that, whilst Australia remains a signatory to this agreement, it is appropriate to use export control powers to ensure exporters of dairy products comply with Australia's obligations under the Arrangement. These powers should continue to be exercised by Corporation for so long as it is required to administer the market support arrangements.
Exports of dairy products by the Corporation to the four markets in 1989-90 totalled around 24 000 tonnes, about 8 per cent by weight of total dairy product exports. A further 14 000 tonnes were exported by the Corporation's subsidiary, Austdairy. The remaining 261ÿ000 tonnes (87 per cent) were exported directly by manufacturers or through commercial traders.

AUSTRALIAN DAIRY CORPORATION
105
In making sales to the European Community and Japanese markets, the Corporation buys product from Australian manufacturers and then sells the product into the markets. Any trading profits obtained by the Corporation are transferred to the market support fund for subsequent distribution to product manufacturers.
The Corporation considers that it is capturing significant increased returns for Australia through its activities in fulfilling the European Community quota (Submission 17, p. 21). It estimated that the average fob prices for Australian cheddar to the United Kingdom in 1988-89 and 1989-90 were $A3680 and $A3720 per tonne respectively. The corresponding prices from non-quota markets were $A2372 and $A2530 per tonne implying rents of $1308 (55 per cent) and $1190 (47 per cent) attributable to the quota. To forgo such rents would result in a loss to Australia.
Access to the Japanese market is not controlled by quotas and both the Corporation and commercial companies are involved in trading to Japan. The Corporation is the largest exporter of Australian dairy products to Japan. Its activities are restricted to trade in bulk commodities, mainly cheese; Corporation trading accounted for over 90 per cent of the total quantity of cheese exported (in the range of 15 000 to 25 000 tonnes per year) to Japan. Because quotas do not apply and commercial traders are also involved, increased returns from the Japanese market would be obtained only if there were limited competition between importers and in the distribution of imports within the Japanese market; that is, if there was a high concentration and limited competition among buyers.
Prima facie evidence exists to suggest that there is limited competition among importers of bulk products into Japan. Wholesale prices for dairy products (butter and skim milk powder) are controlled by the Japanese Livestock Industry Promotion Corporation. Part of this control involves regulating imports of dairy products (see Section 3.2.3). Based on information provided by the Australian Dairy Corporation, prices received in the Japanese market were higher than prices obtained in the Philippines which is Australia's next largest market for bulk cheddar cheese.
The Corporation is not involved in trading into the United States market. Its involvement is by way of allocating export licences to individual firms. These firms must export through an importer licensed in the United States. Two types of quota apply: historical quota which must be exercised through a prescribed importer and supplementary quota which can be exercised through any United States licensed importer.
According to Lavery International, the amount of cheese subject to quota was determined with reference to commercial quantities traded prior to their imposition. In this sense, the quotas were ‘earned’ by the exporters into the United States market at that time. By contrast, the quota of 3000 tonnes into the European Community was in the form of a ‘windfall’ as a result of bilateral agreements associated with the Tokyo Round of Multilateral Trade Negotiations (Submissions 36 and 44).

106 AUSTRALIAN DAIRY INDUSTRY
The Corporation considers that Australia is only obtaining a small percentage of the potential higher returns that are available from the United States market compared with the single desk selling operation of the New Zealand Dairy Board (Submission 17, p. 22). The Corporation's assessment is based on its own data about the average value of Australian exports; data on the average value of New Zealand exports, published by the Department of Statistics, New Zealand; and data on average import values from Australia and New Zealand published by the United States Department of Agriculture (USDA 1991). According to the data of the Department of Agriculture, average values of Australian imports into the United States during 1988 to 1990 were in the range of 11 per cent to 17 per cent lower than the average value of imports from New Zealand.
Lavery International raised concerns about the assessment of the Corporation because sales by Australia and New Zealand into the United States were made on an entirely different basis - it was not possible to compare fob values (Submission 44, pp. 3-4). According to Lavery International a reduction in the order of 16 per cent should be made to the New Zealand fob price to be comparable to the Australian fob price. Adjustments should be made for the lower shipping costs from New Zealand, the higher costs of storage for New Zealand, and the price premium obtained for the New Zealand product because of its lower moisture content. Such adjustments greatly limit the usefulness of comparing export returns to make judgments concerning the extent to which rents are being achieved from the United States market by Australian exporters, compared with the single desk selling operation of the New Zealand Dairy Board. Lavery International said:
the ADC's comments on the USA quotas/markets are not based on a full understanding of the details and do
not seem to take account of important commercial and business considerations. We are not uncomfortable
with the current arrangements and pricing and our supplying manufacturers appear to concur with us.
(Submission 36, p. 6)
In its draft report, the Commission suggested that, if only a small share of the potential higher returns from the United States quota were being realised, then the rights to service that market should be auctioned. This appears to have been an unrealistic suggestion for two reasons. Firstly, the quotas allocated were based on the commercial quantities traded by individual firms and did not represent a potential ‘windfall’ to all Australian exporters. Secondly, it would appear that part, if not all, of the ‘rights’ associated with the quotas reside with licensed United States importers. If this were to be the case, the Commonwealth Government would not be in a position to auction the access rights to the United States cheese quota market.
If the current Multilateral Trade Negotiations were to be successful in achieving complete trade liberalisation for agricultural commodities, the need to control access to quota markets and the Japanese market would not apply - any increased returns would be dissipated. Nevertheless, should the negotiations prove unsuccessful or complete liberalisation is not achieved, the Commission does not consider that the Corporation should retain export powers just to control access to quota markets which result from bilateral negotiations, or to the Japanese market. Potential increased

AUSTRALIAN DAIRY CORPORATION
107
returns for Australia from those quota markets could be captured by auctioning access rights and could be administered by the Department of Primary Industries and Energy.
However, whilst the Corporation continues to administer the market support arrangements, and the industry is adjusting to its recommended marketing changes, the Commission considers that the Corporation should continue to control exports to the quota and Japanese bulk markets, and to monitor adherence to the minimum price provisions of the International Dairy Arrangement.
The Australian Dairy Corporation considered that there were ‘strong benefits accruing from the continued operation of export controls in their own right’ (Submission 50, p. 11). These benefits derived from its ability to extract higher returns from the European Community quota market and the Japanese bulk market, combined with its ability to monitor adherence to the minimum price provisions. The Corporation said:
the long term strategy outlined in the draft report can be expected to reduce Australian welfare rather than act
to improve it. It will also transfer a number of costs associated with administering export trade from the
industry to Australian tax-payers through the necessary increase in government expenditure in this area ...
(Submission 50, p. 11)
The Corporation then stated that:
the linking of future roles to the continuance of support arrangements is not valid. The value, to the industry
and nation, of the various roles of the Corporation are not invalidated by the existence or otherwise of market
support ... (Submission 50, p. 16)
Nevertheless, the Commission considers that the underlying reasons for maintaining a separate statutory marketing authority for trade in dairy products are weak. As already stated, in the absence of the Corporation, the activities and functions could be carried out by another, existing arm of government, such as the Department of Primary Industries and Energy. Particularly in the medium to long term, the Commission considers that the costs to the Australian community will be less if the activities and functions are carried out by an existing arm of government rather than by a separate statutory authority.
6.6 Austdairy
Austdairy is a fully owned subsidiary of the Australian Dairy Corporation registered in Hong Kong. The activities in which it can engage are set out in the Dairy Produce Act 1986. Unlike the Corporation, Austdairy is able to source product from outside Australia.
The charter of Austdairy is to trade in dairy products and livestock on a competitive basis with the aim of maintaining or developing overseas markets for Australian dairy produce. Trading profits from Austdairy are credited to the dairy industry fund (see Section 6.7) and are the major source of revenue for that fund.

108 AUSTRALIAN DAIRY INDUSTRY
According to the Corporation, the rationale for Austdairy stems from the need to develop outlets for Australian produce over the longer term and that there is insufficient incentive for individual firms to do so; that is, there is a free rider problem. For example, Austdairy and its predecessors have been actively involved in developing access for Australian product in the Asian milk recombining markets. Because of the time, expense, and long pay-back periods involved, private firms would not have undertaken such an investment. As a result, access to those markets through long-term supply agreements would not have eventuated.
The Commission is sceptical about the claim that Austdairy was critical in developing access for Australian dairy products to the Asian recombining markets. If it were true that individual companies would not invest to develop long-term markets, questions arise concerning whether government should be involved in such development and whether Austdairy is the most appropriate vehicle of involvement.
Through the operations of Austdairy, there is a risk that trading losses may be incurred. If incurred, there is also the risk that some of the loss may be picked up by Australian taxpayers though its parent, the Australian Dairy Corporation. As discussed above (see Section 6.1.4), this would arise if the Government choose to make good any losses incurred by Austdairy even though it does not have a legal obligation to do so.
The Davis Committee was also concerned about the commercial involvement of statutory authorities in the marketing chain through activities such as those of Austdairy. This was particularly so where compulsory levy mechanisms were being used to finance activities which could be undertaken by private enterprise. The Committee said:
Where SMAs are involved in commercial ventures, the Committee recommends that these be subject to
sunset provisions with the aim of privatisation of each venture at the end of the prescribed period.
(Commonwealth of Australia 1990, p. 14)
The Australian Dairy Corporation argued that the Commission's concerns about the risks to taxpayers were ‘greatly overstated’ and would not be substantiated by ‘a closer examination of the company's commercial practices and the limitations imposed on its operations by both the Corporation Board and the Act’(Submission 50, pp. 12-13). Since it commenced operating in 1965, Austdairy (and its predecessor) had only incurred two losses. On both occasions, the losses were accommodated by the company's own reserves.
The Corporation also argued that the operations of Austdairy were based solely on voluntary participation from industry organisations; Austdairy ‘did not have, or rely upon, statutory powers for its operation’ (Submission 50, p. 12). If this is the case, it leaves open the question as to why Austdairy has to be a fully-owned subsidiary of the Australian Dairy Corporation which does have statutory powers.

AUSTRALIAN DAIRY CORPORATION
109
The Commission still considers the advice of the Davis Committee to be sound and proposes to recommend that the Corporation should sell its interests in Austdairy. If firms do not consider that it is in their individual interest to invest in long-term market development, but there are benefits to the industry from doing so, the preferred approach of the Commission is for the industry to operate on a voluntary contribution basis as outlined for generic promotion. The Commission can see no justification for government involvement, albeit indirect, in activities such as those carried out by Austdairy.
How the proceeds from the sale of Austdairy would be distributed will depend on the outcome of the Government's deliberations in respect to ownership of the assets (see Section 6.1.4). If the Government considers that the assets belong to, or the proceeds should be returned to, the industry, one option would be to channel the funds through the Rural Adjustment Scheme so that they can be targeted to assist the industry to adjust.
The Australian Dairy Industry Council was strongly opposed to the suggestion of channelling funds through this scheme:
The industry requires that its assets continue to be applied for the betterment and development of the industry,
under industry guidance (and does not agree that these assets should be used to facilitate people leaving the
dairy industry). Second, the Rural Adjustment Scheme is a non-industry specific program, and as such, the
dairy industry would not be agreeable to its funds being applied in this general way. (Submission 48, p. 14)
6.7 Australian dairy industry fund
The dairy industry fund is established under the Dairy Produce Act 1986 which specifies the payments that can be made into and out of the fund. The balance in the fund stood at $14.3 million on 30 June 1990.
Included in the types of expenditure which can be made are payments to the dairy research fund, the International Dairy Federation, and the Australian Dairy Industry Council. The fund is not essential for the major activities of the Corporation, such as administering the market support arrangements. Nor has the fund been established to address any specific free rider problem (see Section 6.4) which might justify its operation.
Accordingly, the Commission considers that the dairy industry fund should be wound-up. The current balance in the fund could be treated in the same way as that suggested for the proceeds from the sale of Austdairy.
The Australian Dairy Corporation and the Australian Dairy Industry Council both argued that the fund should be retained.

110 AUSTRALIAN DAIRY INDUSTRY
Although the Corporation considered that the uses of the fund should be reviewed, future uses should include ‘substantial emphasis on the enhancement of the export opportunities for Australian dairy products, including trade-linked investments, and generic export promotion, where considered appropriate’ (Submission 50, p. 15). The Council considered that the ‘existing arrangements for DIF [dairy industry fund] have been previously negotiated with Government and allow the industry to invest its assets to further the development of the industry, particularly in the area of enhancing and developing trade linked investment’ (Submission 48, p. 14).
6.8 Industry loan service
The Dairy Produce Act 1986 empowers the Corporation to make loans to local manufacturers. The loans are in the form of bridging finance so that manufacturers can pay for the milk used in making products before sale proceeds are realised. The Commission considers that it is part of normal commercial practice for companies to have to pay for inputs before product sales are made. Any shortfall in their cash position is met from reserve funds or borrowings from the commercial capital market. Particularly with financial deregulation, the Commission can see no justification for the Corporation in providing financial services to individual companies.
The Australian Dairy Corporation and the Australian Dairy Industry Council both argued that the loan service should be retained as the service provided clear net benefits to the industry. This was because use of the service was voluntary; had not incurred bad debts but had, in fact, generated a positive return; and because of the specialised knowledge of the Australian Dairy Corporation (Submission 48, p. 11 and Submission 50, pp. 14-15).
However, the Corporation borrowing on behalf of individual companies does not alter the commercial risks associated with the monies lent to the companies. If the risks were altered, that would indicate that lenders to the Corporation perceive it to be a lower risk. This would only be the case if the Government were to guarantee the borrowings of the Corporation and, indirectly, the borrowings of the individual companies. The Commission believes that it is inappropriate for government to distort the financial market in this way.

AUSTRALIAN DAIRY CORPORATION
111
RECOMMENDATIONS
The Commission recommends, consistent with the phasing out of market support arrangements, that: legislation be introduced to continue the Australian Dairy
Corporation after 30 June 1992;
the industry loan service of the Corporation be discontinued;
the Corporation sell its interest in Austdairy;
the dairy industry fund be wound-up;
the Government make a policy statement clarifying ownership of the assets of the Australian Dairy Corporation and Austdairy;
the promotion levy be repealed;
the Corporation be given powers to -
- administer market support and underwriting arrangements - undertake generic promotional activities on the domestic
and export markets at the request of the dairy industry
- control exports into quota and the Japanese markets - provide dairy industry information services; and
the legislation establishing the Corporation be repealed if,
ultimately, the market support arrangements are terminated.

OTHER FORMS OF ASSISTANCE TO THE DAIRY INDUSTRY
113
7 OTHER FORMS OF ASSISTANCE TO THE DAIRY INDUSTRY
Other forms of assistance are available to the dairy industry besides the State and Commonwealth marketing arrangements covered in Chapters 4 and 5. They include tariffs, the cheese tariff quota and underwriting, all of which are discussed in this chapter. In addition, several environmental issues pertinent to the dairy industry (irrigation, effluent control and packaging) are examined to determine if they also provide assistance.
7.1 Tariffs
The dairy products subject to tariffs are casein and most cheeses. The rate of duty on casein is five per cent but that is to be removed on 1 January 1992. Cheese is subject to a tariff of $96 per tonne, with the exception of the following cheeses which can be imported free of duty:
Roquefort and Stilton 1
cheese made wholly from goats' milk with the exception of Fetta and Kasseri
surface ripened soft cheese having:
i. a fat content in the dry matter of not less than 50 per cent by weight, and
ii. a moisture content of not less than 65 per cent by weight of the non-fatty matter
cheeses from New Zealand, Papua New Guinea and the South Pacific Forum countries
For imports of dutiable cheeses in excess of 11ÿ500 tonnes per annum, the tariff is increased to $2100 per tonne (see Section 7.2).
The average value of cheese imported into Australia in 1989-90 was $3920 per tonne. The tariff rate of $96 per tonne was thus equivalent to an average ad valorem rate of approximately 2 ½ per cent. There is, of course, considerable variability in the price of imported cheeses. Accordingly, this average rate of 2 ½ per cent is for a range of ad valorem equivalent rates from between 1 and 4 per cent.
Thus, the tariff on cheese already meets the Government's program of general tariff reductions whereby most rates now above 5 per cent are to be reduced to 5 per cent by 1 July 1996.
1 These particular varieties do not receive EC export subsidies and were granted duty free access as part of a 1983
Multilateral Trade Negotiation undertaking. In return, Australia gained quota access to the EC for 3000 tonnes of cheese.

114 AUSTRALIAN DAIRY INDUSTRY
The Commission can see no reason for any different or special treatment for cheese tariffs. There should be no increase in the current nominal tariff, and it should conform to any further general tariff reductions after 1 July 1996.
As a general principle, the Commission favours ad valorem tariffs rather than specific tariffs because the former result in a more uniform degree of assistance and fewer market distortions than the latter; as world prices for cheese fall, the specific tariff increases the rate of assistance. The specific tariff for cheese imports is one of the few remaining specific rates in the tariff. However, the Commission judges that the potential gains from altering the basis of the tariff at this stage would be small. This judgement is based on the relatively low tariff rate and the application of the tariff to only about half of cheese imports (or 7 per cent of domestic cheese consumption). The Commission is conscious, also, of the need to avoid unnecessary change given that other recommendations in this report could entail significant adjustment costs for the dairy industry.
RECOMMENDATION
7.2 Cheese tariff quota
7.2.1 Details of the quota
The protection afforded to Australian cheese manufacturers from imports of dutiable cheese was increased on 1 June 1987 with the proclamation of the Customs Tariff Amendment Act (No 3) 1986. A quota of 11 500 tonnes per annum was imposed on cheese imports subject to the tariff of $96 per tonne (see Section 7.1) - imports in excess of 11 500 tonnes became subject to a much higher tariff of $2100 per tonne.
This tariff level was set above the $A equivalent of the highest European Community export refunds (subsidies to producers) on cheeses at the time. The tariff quota applies to most varieties of cheese; the exceptions being Roquefort and Stilton, soft surface ripened cheese, and cheese imports from New Zealand, Papua New Guinea and South Pacific Forum countries (all of which are exempted from the standard tariff of $96 per tonne). Under legislation the quota will cease on 1 July 1992.
The quota was allocated to importers on the basis of their 1985-86 import volumes. Quota holders are free to sell all or part of their allocation. Details of transfers are registered by the Australian Customs Service and are published together with the amounts owned by individual quota holders.
The Commission recommends that the current cheese tariff be retained, but that it be reduced in accordance with any general tariff reductions after 1 July 1996.

OTHER FORMS OF ASSISTANCE TO THE DAIRY INDUSTRY
115
7.2.2 Origins of the cheese tariff quota
The introduction of the quota stems from a successful countervailing duty action taken by the Australian Dairy Industry Conference (now Council), on behalf of six Australian cheese manufacturers in 1983. The Australian Customs Service determined that Edam, Gouda and blue vein from Europe were receiving export subsidies and this was causing material injury to the Australian industry. Accordingly, Australia was entitled to take action under the GATT and the Customs Tariff (Anti-Dumping) Act 1975.
Following the imposition of cash securities, equal to the export subsidies, Australia and the European Community entered into negotiations to find a mutually agreeable solution. The Community made an undertaking to reduce its subsidies and to ensure that the prices of EC cheeses sold on the Australian market would not be to the detriment of the Australian industry. In return, Australia removed the countervailing duties and repaid the cash securities.
In May 1986 EC export subsidies on a number of cheeses exported to Australia were increased by between 135 and 185 per cent following complaints from Community traders that their market share in Australia was being eroded. Australia and the European Community negotiated a voluntary export restraint subject to agreement being reached on an appropriate reference quantity. During these negotiations Australia developed and passed, but did not proclaim, legislation to establish the cheese tariff quota arrangements.2 The legislation was proclaimed in June 1987 after negotiations failed to reach an agreed reference quantity on a voluntary export restraint.
7.2.3 Effects of the cheese tariff quota
Assistance from the current Commonwealth arrangements relies on domestic prices being raised above prevailing world prices (see Chapter 5). For this type of assistance arrangement to be effective there needs to be some mechanism to ensure consumers do not substitute to imported cheese when the prices of domestically produced cheese rise. The export refunds available to EC cheese producers in 1986 had the potential to reduce market share of Australian cheese producers, particularly for non-cheddar varieties, towards which consumer preferences were shifting. The objective of the cheese tariff quota is to protect the domestic market share of Australian cheese manufacturers. At the Commission's public hearings the Australian Dairy Products Federation stated that the cheese tariff quota was necessary to maintain the Commonwealth marketing arrangements:
We are suggesting that the quota is a valuable component, enhances the performance of the manufacturing
milk support arrangements ... the principal objective is to raise domestic prices. The existence of the quota
provides that opportunity ... (Public hearing transcript, p. 57)
2 When introducing the current Commonwealth dairy marketing arrangements, the Government stated that it would
consider protective measures other than existing anti-dumping and countervailing duty measures.

116 AUSTRALIAN DAIRY INDUSTRY
Table 7.1 shows that importers use most of the quota to import varieties of cheese which compete with only one third of total Australian cheese production. However, if the tariff quota was removed importers may choose to supply a wider range of varieties than they do now. Thus, the protective benefit of the cheese tariff quota extends beyond those producers facing immediate competition from dutiable imports.
Table 7.1: Australian cheese consumption, 1989-90 Cheese Types
Australian Products
(1)
Imported Products
(2)
Dutiable Imports
(3)
Total Consumption
(1) + (2)
('000 tonnes) Cheddar and Cheddar type 81.3 7.2 0.1 88.5 Fresh Types 12.9 - - 12.9 Specialty Cheeses 36.8 13.5 10.4 50.3 All Cheese 131.0 20.7 10.5 151.7
Sources: ADC 1990a, pp. 20-21 and unpublished data provided by the Corporation.
For the past three years, annual dutiable cheese imports have amounted to about 10ÿ500 tonnes, which is less than the quota. The reasons why individual quota holders do not fully use their allocation will vary with individual circumstances. However, the substantial penalties incurred for any imports above quota appear to be the main factor accounting for the under-utilisation of the quota.
The Commission notes that by setting the quota at the level of 1986 dutiable imports, market growth has been reserved for Australian and New Zealand producers. Since 1986 the volume of imports has changed little whereas cheese consumption has increased by around 15 per cent. However, the market share of domestic cheese producers is not absolutely guaranteed by the tariff quota arrangements because of two sources of price competition.
The most significant source of price competition is from New Zealand imports, which in accordance with ANZCERTA, are exempt from import restrictions. However, in the short run, the competitive pressures from New Zealand do not have equal impact on all varieties of cheese. This is acknowledged by the Australian Dairy Products Federation:
The Quota, therefore is more effective in protecting the industry in varieties of cheese that are not readily
substituted by imports from New Zealand. (Submission 14, p. 35)
For instance, the market share of New Zealand cheddar increased from around 4 per cent to 10 per cent of the Australian market between 1987 and 1990. However, the market share of New Zealand Gouda declined from 9 per cent to 5 per cent, despite a 31 per cent increase in Australian consumption of this cheese.

OTHER FORMS OF ASSISTANCE TO THE DAIRY INDUSTRY
117
The second source of price competition is from cheese imports within the quota limit of 11ÿ500 tonnes. The extent to which domestic manufacturers can raise their prices above the prevailing world price is limited because quotas are not allocated on specific varieties so importers can adjust their pattern of imports to take advantage of commercial opportunities and increase their market share at the expense of the Australian manufacturers. Thus, this flexibility in the current arrangements provides at least some potential competition for domestic manufacturers. The Australian Dairy Corporation noted the opportunity for competition within the tariff quota arrangements:
The tariff quota does not limit import competition for specific varieties of cheese in any year. (Submission 17,
p. 43)
Although import competition is not eliminated by the tariff quota, the effect of that competition is reduced by limiting the volume of imports to a maximum of 11ÿ500 tonnes. The Australian Dairy Industry Council said:
Prices of most varieties tend to fluctuate, with periods of heavy discounting of one variety in certain
locations, followed by low prices of other varieties in other locations. This pattern of sporadic and periodic
discounting suggests that the Australian domestic market still suffers from intermittent dumping. However,
the market penetration of such dumped imports is limited by the quota. (Submission 16, p. 17)
7.2.4 Alternative mechanisms
There are alternative mechanisms available to the industry should it claim ‘unfair’ import competition. The Customs Tariff (Anti-Dumping) Act 1975 provides for:
anti-dumping action where goods are imported at lower prices than in their home market which causes injury to Australian producers; and
countervailing action where goods are imported which have been produced and exported with the benefit of subsidies and which cause injury to Australian producers.
The industry obtained a countervailing duty against subsidised cheese imports in 1983. Despite this success, the Australian Dairy Products Federation favours a broader measure such as the cheese tariff quota for the following reasons:
the Australian system for taking countervailing action is administratively cumbersome and involves
considerable delay. This means Australia has a relatively weak defensive mechanism in a trading
environment that is characterised by such disruptive systems, and that blanket measures such as the Cheese
Tariff Quota are the best and preferable mechanisms for dealing with the discriminatory practices of our
competitors. (Submission 14, p. 32)

118 AUSTRALIAN DAIRY INDUSTRY
The Federation noted the following concerns with respect to current anti-dumping/countervailing duty mechanism: the complexity of arrangements; procedural delays before levies are imposed; finite duration of levies in all circumstances; and the difficulty of proving material injury in the case of differentiated products. Moreover, the Federation argued that, because of the speed and flexibility with which EC subsidies can be applied to different products, anti-dumping actions are too inflexible:
the opportunity to export at heavily subsidised prices applies to all member states of the European
Community, and, as such, means that unless the entire community is countervailed for all cheeses, there
would exist the constant threat of material injury to the Australian market. (Submission 14, p. 31)
The Commonwealth Government has implemented a series of changes to the anti-dumping mechanism. In September 1988 new arrangements for investigating dumping complaints were established, including an Anti-Dumping Authority to advise as to whether dumping or countervailing duties should be imposed. The guidelines under which the Authority operates require it to:
have regard to the Government's intention that anti-dumping duties are not used as a substitute means of
providing assistance to import competing industry in Australia, nor to shield industry from the need to adjust
to changing economic conditions. (Minister for Science, Customs and Small Business, 1988)
The Customs Amendment Act (No.82) 1991 introduced the following changes to the anti-dumping system, foreshadowed in the Government's March 1991 Statement:
The statutory time limit for the Australian Customs Service to investigate a dumping complaint was reduced by 40 days to 135 days. Since April 1988 this time limit has been reduced from 250 to 135 days. The Senate Standing Committee on Industry, Science and Technology noted that Australia has one of the shortest time periods for investigating dumping claims (Senate Standing Committee 1991, p. 29);
The criterion of ‘material injury’ was broadened to include injury to producers of raw agricultural inputs in cases of alleged dumping of processed product;
Protection was increased by basing provisional protection on the full dumping margin rather than the margin just sufficient to avoid injury to the domestic industry; and
Protection from injurious dumping now applies for a full three years. Previously, if duties existed on the same product from a different source the period of protection was limited to the sunset date of the earlier determination.
These changes, which have general application, address some of the dairy industry's criticisms of the anti-dumping arrangements, particularly procedural delays and inflexibility.

OTHER FORMS OF ASSISTANCE TO THE DAIRY INDUSTRY
119
Further changes to the anti-dumping system have been recommended in a report by the Senate Standing Committee on Industry, Science and Technology. Included in the Committee's report are several proposals to accelerate the anti-dumping process and reduce the costs to industries pursuing an application.
In responding to the Commission's draft report several participants, while acknowledging the recent changes, restated their criticisms of the anti-dumping arrangements. For example, the Australian Dairy Products Federation said:
in our view the improvements neither overcome the fundamental weakness of the system nor obviate the need
to take remedial action against the persistent subsidisation of imports. (Submission 51, p. 7)
7.2.5 Conclusion
When considering the dairy industry's concerns, the Commission is aware that other industries must prove the existence of dumping before being afforded protection. Currently the dairy industry is under no such obligation and therefore is receiving preferential treatment. Moreover, if the potential damage to the domestic industry from subsidies is as obvious as the industry argues then the prospects of successful countervailing actions, within the current anti-dumping system, should be high.
The cheese tariff quota complements the current Commonwealth marketing arrangements by protecting domestic market share. However, should the Government accept the Commission's recommendation that market support payments be phased down to 5 per cent by 1 July 1996, the complementary role of the cheese tariff quota will be diminished, while the cost to consumers of restricting imports will not.
Furthermore, the Commonwealth marketing arrangements were not introduced to shelter the Australian dairy industry from import competition. The cheese tariff quota limits imports from most sources to an arbitrary level, without any of the assessments that accompany anti-dumping actions. The use of such a blunt policy instrument imposes additional costs on the community. Quotas enable manufacturers to increase their profitability by limiting competition in the market at the expense of consumers who are denied access to cheese at lower prices. The Commission considers that there are no special circumstances that warrant preferment of the dairy industry.
RECOMMENDATION
The Commission recommends that the cheese tariff quota not be renewed when it ceases on 30 June 1992.
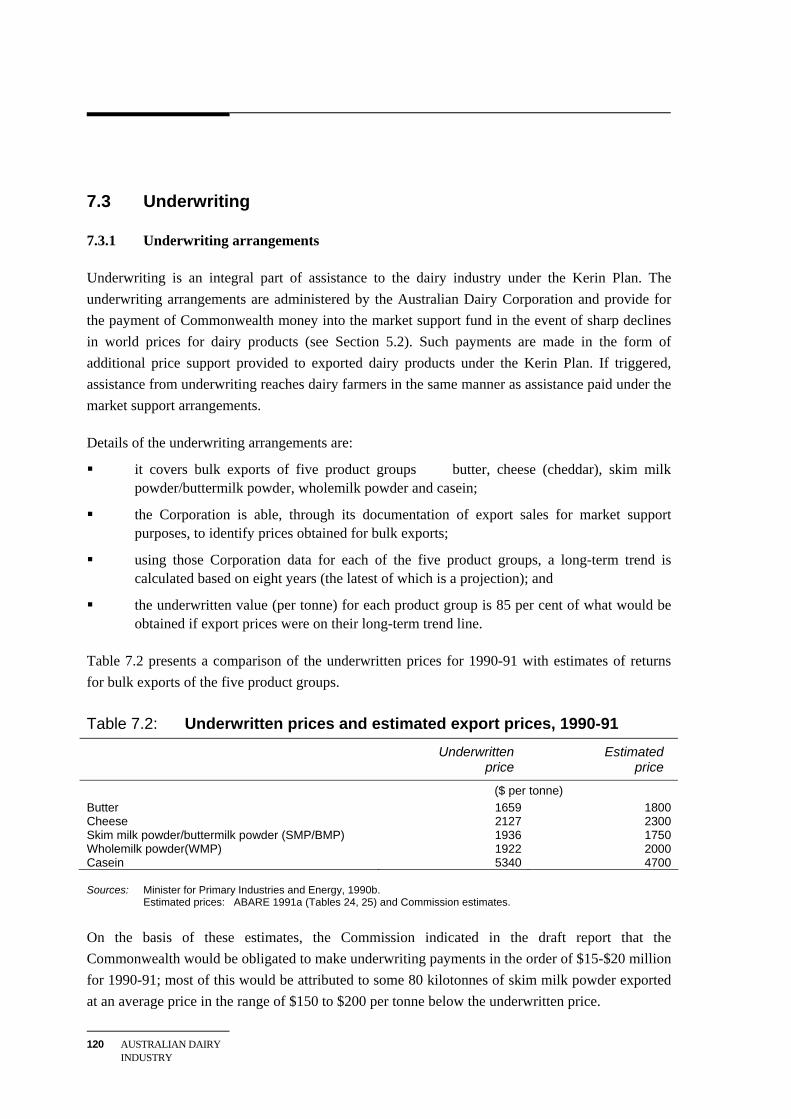
120 AUSTRALIAN DAIRY INDUSTRY
7.3 Underwriting
7.3.1 Underwriting arrangements
Underwriting is an integral part of assistance to the dairy industry under the Kerin Plan. The underwriting arrangements are administered by the Australian Dairy Corporation and provide for the payment of Commonwealth money into the market support fund in the event of sharp declines in world prices for dairy products (see Section 5.2). Such payments are made in the form of additional price support provided to exported dairy products under the Kerin Plan. If triggered, assistance from underwriting reaches dairy farmers in the same manner as assistance paid under the market support arrangements.
Details of the underwriting arrangements are:
it covers bulk exports of five product groups �� butter, cheese (cheddar), skim milk powder/buttermilk powder, wholemilk powder and casein;
the Corporation is able, through its documentation of export sales for market support purposes, to identify prices obtained for bulk exports;
using those Corporation data for each of the five product groups, a long-term trend is calculated based on eight years (the latest of which is a projection); and
the underwritten value (per tonne) for each product group is 85 per cent of what would be obtained if export prices were on their long-term trend line.
Table 7.2 presents a comparison of the underwritten prices for 1990-91 with estimates of returns for bulk exports of the five product groups.
Table 7.2: Underwritten prices and estimated export prices, 1990-91
Underwritten
price Estimated
price
($ per tonne) Butter 1659 1800 Cheese 2127 2300 Skim milk powder/buttermilk powder (SMP/BMP) 1936 1750 Wholemilk powder(WMP) 1922 2000 Casein 5340 4700 Sources: Minister for Primary Industries and Energy, 1990b. Estimated prices: ABARE 1991a (Tables 24, 25) and Commission estimates.
On the basis of these estimates, the Commission indicated in the draft report that the Commonwealth would be obligated to make underwriting payments in the order of $15-$20 million for 1990-91; most of this would be attributed to some 80 kilotonnes of skim milk powder exported at an average price in the range of $150 to $200 per tonne below the underwritten price.

OTHER FORMS OF ASSISTANCE TO THE DAIRY INDUSTRY
121
The Commonwealth payments under underwriting cannot be made until the trading year has been completed and a budget allocation has been obtained. However, during 1990-91 the Australian Dairy Corporation drew on the cash surplus in the market support fund and increased support payments for dairy products in anticipation of Commonwealth underwriting assistance (ADC 1990c). The 1991-92 budget contained an allocation of $22.5 million to allow for underwriting payments. The Corporation is expected to finalise a detailed claim which is to be sent to the Minister for Primary Industries and Energy by the end of September 1991. The Commission understands that the claim for the 1990-91 season will be around $22 million.
In August 1991, the Minister announced the underwritten values for 1991-92 for each of the five products groups, together with forecast export prices. That information indicates that a small underwriting payment ($1-2 million) may be in prospect for exports in 1991-92.
The prospective payments for the 1990-91 year will be the first under the Kerin Plan. Different underwriting arrangements were in effect prior to 1986-87. For example, the payments made in 1983-84 and 1984-85 were on the basis of trigger prices equivalent to 95 per cent of a three-year moving average of gross equalised pool returns for each product category. The underwriting payments made under earlier schemes are set out in Table 7.3; they were predominantly for exports of butter.
Table 7.3: Commonwealth underwriting payments for dairy products, 1976-77 to 1984-85
Butter Cheese SMP/BMP WMP Casein Total ($ million)
1976-77 5.1 - 0.4 - 0.4 5.9 1977-78 11.5 - - 0.4 0.7 12.6 1978-79 12.9 - - 2.3 - 15.2 1979-80 - - - 4.7 - 4.7 1983-84 8.2 - 5.4 - - 13.5 1984-85 0.7 - - - - 0.7
Sources: IAC 1983b, (Table A3.22); information provided by DPIE for 1983-84 and 1984-85.
7.3.2 Effects of underwriting
Underwriting payments from the Commonwealth enable market support payments to be kept at a higher level during troughs in world prices than is possible using only the market support levy as the main source of funding. When triggered, underwriting increases export returns, and so increases domestic prices in the same fashion as the regular market support payments. Underwriting may enable some dairy farmers and some manufacturers to survive until more favourable market conditions emerge.
122 AUSTRALIAN DAIRY INDUSTRY
The existence of an underwriting scheme, even if it is not triggered, can contribute to a misallocation of resources by:
reducing the riskiness of dairy farming through placing the cost of that insurance on the whole taxpaying community rather than on dairy industry participants;
as a consequence of the reduced risk, attracting more resources over the long term into the dairy industry than would have been in the absence of underwriting;
impeding adjustment through holding resources in the industry when they could be better used in other activities; and
blurring price signals about the relative market value of different products if underwriting favours some products, as appears to have been the case in the past with butter exports.
7.3.3 Government principles for and decisions on underwriting schemes
The Commonwealth Government has recognised the efficiency costs of underwriting schemes and noted the need to ‘increase the role of industry in meeting the costs of reducing uncertainty and improve the transmission of price signals to growers and consequently their production decisions, resulting in greater efficiency in the use of rural resources’ (Commonwealth of Australia 1988, p. 140). In its May 1988 Economic Statement, the Government set down the following principles for reviewing such schemes:
the underwritten price should be set at a level which ensures that price underwriting is triggered only by extraordinary downward price movements;
industry should assume increasing responsibility for meeting the costs of reducing uncertainty;
the reference price for underwriting should be closely aligned to world prices. Where a formula is used to determine the reference price, it should be based on a period sufficiently short to ensure that international price developments are not masked from producers;
as far as practicable, the underwritten price should be announced in time for it to be taken into account in determining the current season's production; and
there should be transparency in the calculation of the reference price and estimates of the reference price should be updated regularly and announced publicly. (Commonwealth of Australia 1988, p. 140)
As of May 1988 there were underwriting schemes for four industries: apples and pears, dried vine fruits, wheat and dairy products. The Industries Assistance Commission reported on apples and pears in January 1990 (IAC 1990) and recommended abolition of the underwriting scheme; the Commonwealth Government is implementing that recommendation. In its report on the dried vine fruits industry (IAC 1989a), the Commission recommended the phasing down of a wide range of market support measures and the abolition of underwriting from the end of the 1990 crop year.

OTHER FORMS OF ASSISTANCE TO THE DAIRY INDUSTRY
123
In the event, the Commonwealth Government decided to extend underwriting for another three years to provide a temporary safety net while the industry was adjusting to the removal of other support mechanisms and in recognition of the very heavy regional concentration of the dried vine fruits industry (Minister for Primary Industries and Energy 1990a). Underwriting for the wheat industry now takes the form of government guarantees for the borrowings of the Australian Wheat Board rather than through underwritten prices for different classes of wheat.
7.3.4 Comments by participants
There is widespread support in the dairy industry for continuing an underwriting scheme funded by the Commonwealth. For example, the Australian Dairy Industry Council said:
The underwriting arrangements are viewed by the industry as a measure to help protect the industry from the extreme dislocations caused by sudden increases in high export subsidies in northern hemisphere countries.
It is the ADIC's view that underwriting provisions should continue and be included in the marketing arrangements for the industry beyond June 1992. (Submission 16, p. 16)
United Dairyfarmers of Victoria argued that the potential assistance available from underwriting needs to be increased to a more ‘realistic’ level:
The UDV submits that the current factor of 85 per cent of the 8 year linear regression of export values is ultra conservative and a more realistic approach would be to have a factor of 90 per cent of the 6 year linear regression of export values. (Submission 9, p. 83)
The draft report recommendation to continue the underwriting arrangements was supported by the Australian Dairy Industry Council, the Australian Dairy Farmers Federation, and the United Dairyfarmers of Victoria. However, the Council and the Federation opposed the proposed maximum payout limit of $20 million in any one year, on the grounds that such a ceiling was ‘undesirable’ and would ‘not improve the operation of the scheme’ (ADIC Submission 48, p. 19), and was ‘not valid’ (ADFF Submission 43, p. 10).
The United Dairyfarmers of Victoria proposed a wholesale sales tax on dairy products that would be triggered by sudden downturns in international prices with the proceeds being distributed to dairyfarmers. The Commission does not favour such a scheme because the revenue for the support payments would be raised in a manner that would potentially distort consumption, and lead to efficiency costs in addition to those associated with the existing underwriting arrangements.
Strongest criticism of underwriting came from the New Zealand Dairy Board. It said:
the basis on which underwriting values are set is arbitrary with no recognisable relationship to actual and
foreseeable developments with respect to international market returns, nor to industry needs. (Submission 3,
p. 5)

124 AUSTRALIAN DAIRY INDUSTRY
Furthermore, the Board asserted that underwriting should be reviewed and rescinded because it:
is not consistent with the central elements of the Australian dairy industry marketing and support
arrangements. It involves direct transfers from the Australian government to Australian dairy farmers,
encouraging the maintenance and development of the industry at a level which would not otherwise be
expected. Nor is it consistent with the objectives and principles of the GATT and the ANZERTA agreement.
(Submission 3, p. 5)
In response to the draft report the South Australian Government noted that:
underwriting is an inefficient method to target needy producers and distorts market signals. If additional
money is available for support to agriculture then those resources could be used more efficiently and
equitably by carry-on assistance type schemes targeted to specific needy farmers. (Submission 53, p. 5)
7.3.5 Conclusion
The Commission can find no sound reason for exempting the dairy industry from the general policy of making Australian industries ‘assume more of the responsibility for meeting the costs of price uncertainty’ (Commonwealth of Australia 1988). There is no justification in the long term for providing underwriting support to the dairy industry. However, in recognition of the short-term transitional costs to the industry while market support arrangements are phased down, and in order to avoid undue disruption during that process, the Commission accepts that underwriting should continue to act as a safety net for some years yet. Such continuation must be conditional on a phasing out of the market support arrangements as recommended in Chapter 5.
Continuation of underwriting needs to be accompanied by a mechanism to encourage the dairy industry to assume increasing responsibility for meeting the costs of price uncertainty. The Commission has come to the view that the simplest such mechanism is for the Commonwealth to limit its liability for underwriting payments made after June 1992. A limit set at the highest payment for exports in any year between 1976-77 and 1990-91 would seem reasonable.
RECOMMENDATION
The Commission recommends that underwriting of export returns continue to apply at 85 per cent of the long-term trend of export prices until 1 July 1999, at which time underwriting should cease. The Commonwealth's liability in any one year should, however, be limited to the amount paid for exports in 1990-91.

OTHER FORMS OF ASSISTANCE TO THE DAIRY INDUSTRY
125
7.4 Environmental issues
This section presents information on three environmental issues of particular relevance to the Australian dairy industry: irrigation, effluent control and packaging. The purpose of doing so is twofold:
to investigate whether the industry is assisted or taxed with respect to these issues (no allowance is made in the measured assistance estimates presented in Chapter 8 for such environmental factors); and
the Commission is obligated to inquire into and report on the environmental consequences of its recommendations.
7.4.1 Irrigation
Many dairy farms are dependent on irrigation for adequate and consistent pasture growth. This dependency is highest in Victoria where two thirds of the 8800 dairy farms use irrigation. Information on the use of irrigation in dairying is not readily available: the most comprehensive data relate to areas farmed, as set out in Table 7.4. In the case of Victoria, 22 per cent of the total area used for dairy farming is irrigated, and for New South Wales it is just under 10 per cent.
Table 7.4: Irrigated dairying areas, by State and for Australia, 31 March 1990
Dairy cattle a
irrigation area
Dairy cattle a
farm area Per cent of dairycattle area that
is irrigated
Total irrigated
area
Per cent of totalirrigated area
used for dairying
('000 hectares) ('000 hectares) ('000 hectares) New South Wales 46 487 9 813 6 Victoria 237 1065 22 526 45 Queensland 19 547 4 312 6 Western Australia 7 151 5 27 26 South Australia 15 191 8 99 15 Tasmania 10 143 7 44 23 Australia 334 2587 13 1823 18
a Based on Australian Standard Industry Classification 0187 for milk cattle.
Sources: ABS unpublished statistics; ABARE 1990b (Table A15).
The proportion of total dairy area that is irrigated is not an accurate indication of the importance of irrigation to total milk production because irrigated farms produce more milk per hectare. For example, one third of milk production in Western Australia occurs on irrigated dairy farms, even though only 5 per cent of the dairy farming area is irrigated (WA Dairy Industry Authority 1990, p. 33).

126 AUSTRALIAN DAIRY INDUSTRY
Importantly, an increasing proportion of total milk production in Australia occurs on irrigated dairy farms. This trend is apparent in a 40 per cent decline of milk production in the Victorian Gippsland region (which has relatively high rainfall) since 1986-87, in part a consequence of Melbourne's suburban expansion to the east, and a corresponding expansion of production in the northern region of the State where irrigation is prominent (ADC 1990a, p. 13). The 1.6 million litres of milk produced in the northern region accounts for about 40 per cent of all Victorian milk production.
Whether the dairy industry obtains assistance from its reliance on irrigated pastures depends on two factors. First, do water prices properly reflect all costs of providing irrigation services? Second, does the dairy industry pay for the ‘external’ costs, the most prominent of which are salinity and the eutrophication (oxygen depletion) of the waterways?
The provision and pricing of irrigation water is being reviewed in many States so that the full costs to society of using irrigation water might better be reflected in the prices paid by farmers. However, this is an evolutionary process which as yet would have had little effect on the type of agriculture undertaken and where these activities take place. The Industry Commission has restricted its observations on these issues to Victoria, which accounts for 71 per cent of irrigated dairy farming, and New South Wales, which accounts for 14 per cent. A spokesperson for the Rural Water Commission (RWC) of Victoria said that:
Existing tariff structures have remained unchanged for many years and reflect the crux of social and economic objectives of earlier stages of water resources development. Generally they do not reflect costs imposed on the system by customers nor do they reward efficient use of water.
It is proposed to develop and introduce revised tariff structures which:
achieve fairer cost sharing;
assist in water use efficiency; and
allow sound administration including introduction of quarterly billing. (RWC 1991)
The inadequacy of irrigation charges in Victoria is stated by the Victorian Department of Water Resources as follows:
RWC customers are currently meeting only 35 per cent of the real costs of irrigation, stock and domestic water supplies. Sixty five per cent of RWC costs are being funded by taxpayers of Victoria ... The Government of Victoria has $2660 million tied up in RWC assets. At present the annual loss to the Government for interest and return on equity ... is about $137 million. (1989, p. 32)
For New South Wales, pricing may reflect even less of the real economic cost of providing irrigation. Water charges in irrigated areas in 1988-89 were 22 per cent lower, in real terms, than five years earlier (New South Wales Department of Water Resources 1989, p. 33). The Rural Water Commission of Victoria has indicated that the subsidy per unit of irrigation water is higher in New South Wales than in Victoria:

OTHER FORMS OF ASSISTANCE TO THE DAIRY INDUSTRY
127
The economic real rate of return for gravity irrigation in Victoria was 1.20%, whilst in NSW the figure was negative 3.49%.
Victoria recovers 125% of irrigation operating costs, whilst NSW recovers 65%. Operating costs used here comprise operations, maintenance and administration, including headworks but exclude some hidden subsidies like superannuation.
The economic real rates of return of drainage services were -0.85% in Victoria and -1.88% in NSW.
Drainage operating cost recovery was 100% for Victoria and 44% for NSW. (Submission 39, p. 1)
Given the dairy industry's extensive use of irrigation water as documented above, and the recognition that water pricing only partially reflects the full costs of providing and using the water, there are grounds for concluding that assistance is currently being provided via the dairy industry's use of irrigation. While planned increases in the real price of irrigation water may lead to more efficient use of water and may temper further growth of irrigated dairying, the consequence of inappropriate prices in the past has been for taxpayers to subsidise the production of milk.
In response to the draft report, the United Dairyfarmers of Victoria stated that an inquiry commissioned by the Victorian Government is challenging the references upon which the Industry Commission concluded that inappropriate irrigation prices were subsidising dairy farmers in that State. The Industry Commission has not attempted to conduct a review of the operations of the irrigation providers in each State within the confines of this report. The pricing arrangements for irrigation services and their efficiency implications will be among the matters considered in the current Industry Commission inquiry into water resources and water waste disposal.
Perhaps more worrying from a long-term perspective are the salinity and eutrophication costs incurred by all irrigated agricultural activities of which dairying is dominant. In areas where dairy farming is a major activity, a Victorian report on salinity noted that:
A shallow watertable threatens about 385,000 hectares of Australia's largest irrigation area, the Goulburn
Murray Irrigation District. This salt-prone area includes 72 per cent of the Kerang Region and 22 per cent of
the Shepparton Region. Already about 140,000 hectares of land in these regions is damaged by salt.
(Government of Victoria 1987, p. 8)
Salinity control programs costing many hundreds of millions of dollars are planned and being put into effect in these regions, yet there is scepticism that the problem can be overcome.
The drainage of water from irrigated properties creates another set of problems. The run-off from dairy farms typically is high in nitrates and phosphorous which encourage algae and weed growth. Drainage channels can be blocked and the oxygen level of the water depleted.

128 AUSTRALIAN DAIRY INDUSTRY
7.4.2 Effluent control
An important environmental issue, for both dairy farms and dairy factories, is the responsible management of effluent.
The problems on dairy farms stem from the large volume of excrement (50kg per cow per day) and disposal of water used in washing down milking sheds and the run-off from irrigation. According to the CSIRO:
dairy farms are probably significant contributors to the contamination of regional surface and groundwaters
wherever they are a major form of land use. (CSIRO 1990)
The onus is on farmers to retain effluent on the property. A standard method of treating waste water is with two ponds: the first is a deep pond where the effluent is broken down by a natural biological action under anaerobic conditions; the effluent then passes to a second shallow pond where oxygen returns to the fluid which then can be used for irrigation purposes.
Effluent control in dairy factories centres around the high use of water, on average equivalent to the volume of milk processed (Lyons et al 1989), and the high biological oxygen demand of the waste water. The disposal of whey, a by-product in cheese-making, is a particular problem. The overall magnitude of effluent disposal has been described as:
about 250 tonnes per day of BOD [biological oxygen demand] released from Australia's dairy factories ... in
rough terms that equates to the sewerage of about one million people. (ADPF 1990)
In some regions there appears to be minimal monitoring by the State authorities to ensure responsible management of dairy effluent. It is not clear to the Commission as to which State departments and agencies have responsibility for these matters. The Commission is not able to reach a conclusion on whether dairy farmers and factories are meeting the costs of any environmental damage incurred by their effluent. The environmental impacts of water use and waste water practices in Australia will be considered in the Commission's concurrent water inquiry.
7.4.3 Packaging of dairy products
The two principal environmental aspects of packaging milk and other dairy products are the energy costs associated with paperboard, glass and plastic containers, and their relative merits in terms of waste disposal. A comparison of key parameters for fresh milk packaging is presented in Table 7.5.
The decline in recent years in the extent of home delivery of fresh milk has resulted in a smaller and smaller role for reusable glass milk bottles. There has been a rise in the share of milk packaged in paperboard cartons and in plastic containers.

OTHER FORMS OF ASSISTANCE TO THE DAIRY INDUSTRY
129
Table 7.5: Characteristics of fresh milk packaging
Paperboard Glass a Plastic
Proportions used (per cent by volume of milk) b
50 5 45Mass per litre (grams) 1035 1667 Total energy use (mega-joules per litre) 3.8 3.4 3.0 Carbon dioxide emissions (grams/litre) 252 323 283 a Based on 10 uses of a 600ml reusable glass bottle. b Based on dairy industry authority annual reports for New South Wales, Victoria and Queensland. Use of glass
bottles ceased in Victoria in October 1987; for the other two States glass bottles account for 8 per cent of usage. Sources: Dairy industry authority annual reports; Prpic and Davey (1990).
The paperboard cartons utilise imported sheeting manufactured from cold-climate softwoods, covered in a film of plastic. Their advantage lies in ease of handling and low transport costs because of relatively light weight. Their low carbon dioxide (a principal greenhouse gas) emission, as indicated by the estimates above, is open to challenge. Figures contained in the Commission's report on recycling (IC 1991a, vol I, p. 94) for all beverage containers suggest that paperboard and reusable glass are both inferior to plastic in this respect.
Reusable glass bottles have the advantage of lower energy costs (per litre of total usage of the bottle) in initial production, but that can be more than offset by the subsequent higher transport costs of the relatively heavy container and the significant energy costs of cleaning between each use:
The greatest problem with the reusable glass bottle was (and still is) the need for rigorous cleaning before each use. This process consumes significant amounts of energy, water and detergents and requires the disposal of large volumes of washing wastes. Despite this investment in pre-use cleaning, those dairies which still use the pint bottle face the continuing and expensive nightmare of chemical or foreign-body contamination of their bottled product. Indeed, it has been largely these economic, environmental and health costs of preparation for re-use which has made the re-usable milk bottle an impracticable anachronism. (Prpic and Davey, 1990)
The favourable energy usage estimates for reusable glass bottles quoted in the Commission's report on recycling (IC 1991a, vol I, p. 94) are based on 25 reuses of the bottle. For milk bottles this may be an overestimate; industry participants suggest that milk bottles are used no more than 10 - 14 times before being recycled.
High density polyethylene plastic milk bottles typically sold by supermarkets are made from ethane, a by-product from oil and co-product of natural gas. The relatively light weight of these containers results in low transport costs as for cartons but they are superior in terms of total energy use compared with cartons.
In respect to waste disposal, plastic milk bottles may present problems because they are not biodegradable. In the Commission's inquiry into recycling, the increase of plastics in the waste

130 AUSTRALIAN DAIRY INDUSTRY
stream was a matter of concern to participants (IC 1991a, vol. I, pp. 102-103). However, like glass, plastic milk bottles can be recycled into products other than for use with food and beverages. Such recycling is currently undertaken in Victoria and Queensland (IC 1991a, vol II, p. 87-88); products include plastic pallets, plastic piping and containers for motor oil. In doing so, final disposal of the plastic is delayed.
By contrast, paperboard cartons can be used only once before disposal. Provided charges cover the full cost to society of waste disposal, the need to dispose of cartons in this way is not necessarily a disadvantage.
However, in its inquiry into recycling, the Commission considered that charges were generally too low to cover the full costs to society of waste disposal (IC, 1991a, vol I, pp. 13-14).
7.4.4 Conclusion
Of the three environmental issues discussed above, there is some evidence which suggests that current irrigation policies provide an element of assistance to the dairy industry. The Commission does not have sufficient information to reach any such conclusion with regard to effluent costs imposed by the dairy industry. The environmental impact of waste water practices will be considered in the Commission's water resources inquiry. With regard to packaging, the Commission concluded in its recycling inquiry that the environmental effects of using and disposing of different containers should be addressed by ensuring that waste disposal charges are set to cover the full social costs involved.
More generally, the Commission concludes that acceptance of its recommendations in this report would have no significant environmental consequences.

MEASURED ASSISTANCE TO THE DAIRY INDUSTRY
131
8 MEASURED ASSISTANCE TO THE DAIRY INDUSTRY
In the course of this inquiry many industry representatives expressed their concern as to the estimates of the levels of assistance to the Australian dairy industry and the methods the Commission used to derive those estimates. In response to those concerns the Commission convened a one day workshop in April 1991 in order to provide a forum for the industry to offer constructive criticism of the Commission's approach (see Appendix A for a listing of the organisations represented). Two background papers (IC 1991 b and c) were prepared for the workshop, the first on why and how assistance is measured and the second on details of the assistance measures for the dairy industry. This chapter explains the purpose of measuring assistance, provides the Commission's estimates and discusses their limitations, and assesses the policy implications of the assistance measures.
Information and comments provided by participants during the course of the inquiry have enabled the Commission to revise the methods and data used to estimate levels of assistance provided the different dairy activities. In particular, a new method has been introduced for monitoring the assistance provided by State government control over the supply and pricing of market milk. The new method indicates that assistance provided by those arrangements is higher than indicated previously. The Commission has also provided estimates of assistance for the total dairy farming activity and for the total dairy industry. Details of the measurement of assistance to the different dairy activities are given in Appendix F.
8.1 Purpose of measuring assistance
Governments in Australia intervene in the markets for both the inputs and the outputs of most industries. There is a wide range of different types of intervention: included are tariffs on competing imports, import quotas, export subsidies, price controls or restrictions, regulatory requirements, tariffs on capital and material inputs and the government provision of services. The interventions may thus both advantage and disadvantage a particular industry. In either case they typically muffle and often distort market signals that should be the basis on which decisions are made concerning an industry's use of resources, mix of products and pricing of its products. The consequence is industries which contribute less than they could to the overall well-being of Australians.
Assistance is the general term used to describe the effect of government interventions, irrespective of whether an intervention advantages or disadvantages a particular industry and irrespective of

132 AUSTRALIAN DAIRY INDUSTRY
whether or not it involves a government budgetary outlay. Measuring assistance is about quantifying the extent of relative advantage or disadvantage conferred by intervention on particular industries. The purpose of measuring assistance is to allow comparisons to be made of the relative incentive effects of interventions on different industries, and how these change over time or with different policies.
As a general rule, the greater is the extent of net assistance available to one industry relative to other industries, the more likely that industry is adopting production and pricing strategies that do not make the best use of Australia's resources. High levels of net assistance inflate the returns available to factors of production (land, labour and capital) and so may encourage additional resources to the industry, or may allow resources to be retained in the industry, when they could yield more wealth if some were used elsewhere in the economy.
The consequences of allocative inefficiency are widespread because overall economic growth is dampened. It is important to note that allocative inefficiency can occur even if the industry is operating in a technically efficient manner whereby input usage is minimised for any given level of output.
Compared with dairy industries in countries other than New Zealand, there is evidence that internationally, the Australian dairy industry is a ‘low-cost’ supplier of dairy products (see Section 2.6). This, however, is not the relevant consideration when comparing the relative incentive effect of Australian interventions on different industries in Australia. What is important, for the purposes of efficiently allocating Australian resources, is the place of the dairy industry within the total Australian economic environment, not government policies overseas. The purpose of measuring assistance provided to the Australian dairy industry (and all other industries) is to compare its degree of assistance with that of other Australian industries, particularly other agricultural industries.
8.2 The Commission's estimates
The Commission's annual estimates of assistance to Australian agricultural and manufacturing industries respectively provide measures of assistance for milk production on farms by end use, and for production of milk products by manufacturing establishments grouped into industries on the basis of the major products produced (see IC 1990, Appendices 9 and 11). Details of more recent assistance estimates for these two main sectors of the Australian dairy industry are provided in Appendix F of this report.
The two interventions identified as having the major influence on assistance in the Australian dairy industry are the export subsidies provided to manufactured dairy products under the Commonwealth market support arrangements (generally known as the Kerin Plan) and State government controls over supply and pricing of market milk for processing into fluid or wholemilk products. Those statutory marketing arrangements have significant effects on the prices of

MEASURED ASSISTANCE TO THE DAIRY INDUSTRY
133
manufactured dairy products and liquid milks. Details of them are provided in Chapters 4, 5 and 6 and details of the estimates of their assistance effects are given in Appendix F.
The two main measures used by the Commission to summarise the effects of assistance to producers are the nominal and effective rates of assistance.� The nominal rate of assistance measures the level of assistance provided on the products of an industry. It is the percentage by which producer returns are increased by assistance, relative to the situation of no assistance.
The effective rate of assistance measures the net assistance received by an industry and relates it to the net contribution the industry makes to the economy. Net assistance takes into account the subsidy effect of assistance on an industry's output, the tax effect of assistance on the intermediate inputs it uses, and the effect of any special measures to influence the use of land, labour or capital in an industry. The net contribution an industry makes to the economy is measured by value added - the difference between the returns from outputs and the costs of the goods and services purchased from other industries and used to produce those outputs. Value added represents the returns to the use of the nation's resources of land, labour and capital in an industry.
Formally, the effective rate of assistance is the percentage by which returns to value added in an industry are increased by net assistance relative to the situation of no assistance. Therefore, the effective rate allows comparisons of the extent to which industries have been advantaged or disadvantaged by assistance relative to each other and over time. In general, disparities in effective rates of assistance are indicative of distortions in resource use and thus efficiency losses resulting from government interventions.
8.2.1 Nominal rates
The nominal rates of assistance to milk production by end use are given in Table 8.1 and to manufacturing dairy industries in Table 8.2. For comparison, the nominal rates for total agriculture and total manufacturing are also included. The new estimates recorded in the tables refer to revised estimates of market milk assistance for 1988-89 and 1989-90. The methodology used for the new estimates for market milk is illustrated for 1989-90 in Appendix F, Table F.5. In respect to nominal assistance to manufactured dairy products, shown in Table 8.2, the new estimates for market milk only affect the measured estimates for liquid milk and cream. The other manufactured products listed in Table 8.2 do not use market milk as an input.
These estimates indicate that output returns to farmers from milk, and to manufacturers from dairy products, have been considerably enhanced by existing marketing arrangements. However, the levels of assistance have declined substantially in recent years. When measured on a consistent basis, the nominal rate for total milk declined from 54 per cent in 1986-87 to 18 per cent in 1989-90 and for the milk products industry group from 23 per cent to 9 per cent over the same period.

134 AUSTRALIAN DAIRY INDUSTRY
Table 8.1: Nominal rates of assistance for milk production by end use, 1986-87 to 1989-90
1986-87 1987-88 1988-89 Old
1989-90 Old
1988-89 New
1989-90 New
(per cent) Manufacturing milk 50 45 21 17 21 17 Market milk 60 54 24 19 43 37 Total milk 54 49 22 18 29 24 Total agriculture 8 5 4 3 4 3 Note: The new estimates result from revised estimates for market milk for 1988-89 and 1989-90, details of which are
given in Appendix F, Table F.5. Source: Commission estimates.
Table 8.2: Nominal rates of assistance for dairy manufacturing industries, 1986-87 to 1989-90
ASIC code
Industry 1986-87 1987-88 1988-89Old
1989-90Old
1988-89 New
1989-90New
(per cent) 2121 Liquid milk and cream 19 16 9 8 13 112122 Butter 35 30 18 17 18 17 2123 Cheese 25 18 13 9 13 9 2124 Ice cream and frozen confections 11 8 5 4 5 4 2125 Milk products nec 26 20 12 11 12 11 212 Milk products 23 18 11 9 13 11 21-34 Total manufacturing 12 11 10 9 10 9 Note: The new estimates for liquid milk and cream and for total milk products result from revised estimates for market milk for 1988-89 and 1989-90, details of which are given in Appendix F, Table F.5. Source: Commission estimates.
In part, the declines in nominal rates represent the lowering of assistance for manufactured dairy products with the introduction of market support payments and the phasing out, by July 1989, of supplementary market support payments financed from product levies on butter and cheese. The declines also reflect the increases in export returns achieved for manufactured dairy products during that period. This had the effect of narrowing the margin between farmer returns from the administratively set prices for market milk and the assisted returns from manufacturing milk after adjustment for the costs of assurance of out-of-season supply. The margin is directly reflected in the nominal rate for market milk. The more recent decline in export returns from manufactured dairy products means there will be a widening in the gap and an increase in the nominal assistance to market milk.

MEASURED ASSISTANCE TO THE DAIRY INDUSTRY
135
The declines in nominal rates of assistance also reflect the effect of the ceiling of 45 cents per kilogram of milkfat placed on the market support levy which has limited the rate, but not necessarily the amount, of export subsidies to below the set maximum of 30 per cent. This is directly reflected in the nominal rates of assistance to all the milk products industries, except liquid milk and cream, and to a lesser extent, ice cream and frozen confections.
As noted in Appendix F, not all the nominal rates are measured directly. The nominal rate of assistance to manufactured milk is derived from assistance provided to the dairy products manufactured from it, and the nominal rate of assistance to liquid milk and cream is derived from the assistance provided to market milk. This reflects the economic reality that, although those products are not traded internationally, the level of returns to them is set by the level of assistance provided manufactured dairy products and market milk respectively.
In both cases, to derive estimates of the nominal rates, simplifying assumptions were used. To estimate the nominal assistance provided manufacturing milk, the simplifying assumption was made that the assistance derived from export subsidies and domestic market price support offset all the added costs of assistance to dairy product inputs, except the butter and cheese levies used to finance the supplementary support payments, and was reflected in increased prices paid for manufacturing milk.� To estimate the nominal assistance provided liquid milk and cream, a further simplifying assumption was made that the assistance derived from State government control of market milk, and paid for in milk prices by processors, was fully reflected in the prices charged for liquid milk and cream. As indicated in the following sub-section, these assumptions imply that measured net assistance to the processing and the manufacturing industries depends on assistance to non-dairy inputs and outputs and the costs of the butter and cheese levies.
In part, the simplifying assumptions reflect the lack of a basis for partitioning the measured assistance to dairy products between manufacturing and milk production. They also recognise that State regulation of processing margins for market milk uses cost-based methodologies. For manufacturing milk, they reflect the importance of co-operative ownership and competition keeping pressure on manufacturing margins. In addition they reflect the observation that manufacturing and processing margins are relatively insensitive to changes in the respective values of the dairy products and market milk. For market milk, the sensitivity analysis reported in Appendix F indicates that a very large proportion of the assistance to manufactured dairy products would have to accrue to manufacturers, before there would be any difference to the view that a high rate of nominal assistance is provided for manufacturing milk.

136 AUSTRALIAN DAIRY INDUSTRY
8.2.2 Effective rates
The effective rate of assistance provides a more complete measure of assistance. As indicated above, it relates the net effect of all assistance that directly affects production to the notional returns to value added that would occur in the absence of assistance. In this way, a summary measure is provided of the net effect of government interventions that allows comparisons of the relative incentives to use resources in different activities.
The effective rates of assistance to milk production by end use are given in Table 8.3 and to manufacturing dairy industries in Table 8.4.
The estimates indicate very high rates of effective assistance for the production of milk and generally low or negative rates for the processing and manufacturing of that milk. The results also indicate that, in recent years, there have been substantial declines in the very high effective rates of assistance for the production of milk, and that the low effective rates for the processing and manufacturing industries have increased.
Table 8.3: Effective rates of assistance for milk production by end use, 1986-87 to 1989-90
1986-87 1987-88 1988-89 Old
1989-90 Old
1988-89 New
1989-90 New
(per cent) Manufacturing milk 181 150 51 40 51 40 Market milk >250 205 61 45 137 107 Total milk 213 171 55 43 77 61 Total agriculture 19 13 9 9 9 9
Note: The new estimates result from revised estimates for market milk for 1988-89 and 1989-90, details of which are given in
Appendix F, Table F5.
Source: Commission estimates.
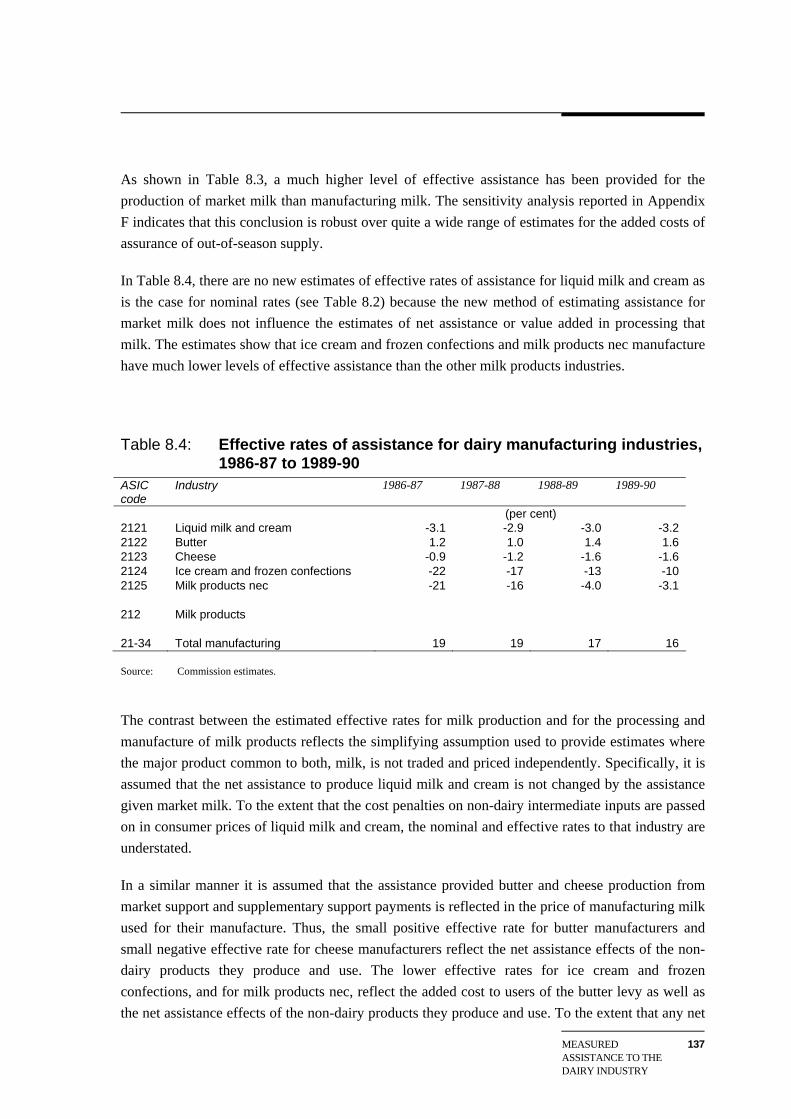
MEASURED ASSISTANCE TO THE DAIRY INDUSTRY
137
As shown in Table 8.3, a much higher level of effective assistance has been provided for the production of market milk than manufacturing milk. The sensitivity analysis reported in Appendix F indicates that this conclusion is robust over quite a wide range of estimates for the added costs of assurance of out-of-season supply.
In Table 8.4, there are no new estimates of effective rates of assistance for liquid milk and cream as is the case for nominal rates (see Table 8.2) because the new method of estimating assistance for market milk does not influence the estimates of net assistance or value added in processing that milk. The estimates show that ice cream and frozen confections and milk products nec manufacture have much lower levels of effective assistance than the other milk products industries.
Table 8.4: Effective rates of assistance for dairy manufacturing industries, 1986-87 to 1989-90
ASIC code
Industry 1986-87 1987-88 1988-89 1989-90
(per cent) 2121 Liquid milk and cream -3.1 -2.9 -3.0 -3.2 2122 Butter 1.2 1.0 1.4 1.6 2123 Cheese -0.9 -1.2 -1.6 -1.6 2124 Ice cream and frozen confections -22 -17 -13 -10 2125 Milk products nec -21 -16 -4.0 -3.1 212 Milk products 21-34 Total manufacturing 19 19 17 16 Source: Commission estimates.
The contrast between the estimated effective rates for milk production and for the processing and manufacture of milk products reflects the simplifying assumption used to provide estimates where the major product common to both, milk, is not traded and priced independently. Specifically, it is assumed that the net assistance to produce liquid milk and cream is not changed by the assistance given market milk. To the extent that the cost penalties on non-dairy intermediate inputs are passed on in consumer prices of liquid milk and cream, the nominal and effective rates to that industry are understated.
In a similar manner it is assumed that the assistance provided butter and cheese production from market support and supplementary support payments is reflected in the price of manufacturing milk used for their manufacture. Thus, the small positive effective rate for butter manufacturers and small negative effective rate for cheese manufacturers reflect the net assistance effects of the non-dairy products they produce and use. The lower effective rates for ice cream and frozen confections, and for milk products nec, reflect the added cost to users of the butter levy as well as the net assistance effects of the non-dairy products they produce and use. To the extent that any net

138 AUSTRALIAN DAIRY INDUSTRY
cost penalty is reflected in lower manufacturing milk prices, the effective rates for the milk products group of industries are underestimated and the nominal and effective rates of assistance for manufacturing milk are overestimated.
The sensitivity analysis reported in Appendix F indicates that a very large proportion of the assistance provided to manufactured dairy products would have to accrue to the manufacturing activities before there would be any change to the conclusion that high nominal and effective rates of assistance are provided for manufacturing milk production.
The declines in recent years in the effective rates for manufacturing milk principally reflect the declines in assistance to manufactured dairy products, notably the removal of the supplementary support payments as discussed above under nominal rates. Similarly, the declines in effective assistance to market milk principally reflect the narrowing of the margin between farmer returns from the administratively set prices for market milk and the assisted returns from manufacturing milk after adjustment for the costs of assurance of out-of-season supply.
The phased removal of the special product levy on the butter input to the ice-cream and frozen confections, and milk products nec industries is reflected in the significant decline in the negative rates of effective assistance to those industries. Like the other milk products industries, they have also been affected by the general reductions in assistance to non-dairy inputs and outputs. In its March 1991 Statement, the Government foreshadowed further major reductions to non-dairy assistance (PM&C 1991).
The Commission has recommended that there be a phased reduction in the assistance provided the dairy industry. In particular, it has recommended that the Commonwealth phase down the level of export support to dairy products to 5 per cent and that the States deregulate the supply of market milk. The reduced level of assistance to dairy products is estimated to lower the effective rate of assistance to manufacturing milk production to 5 per cent. If the supply and pricing of market milk were deregulated by the States, the estimated effective rate of assistance to market milk production would be one per cent. While no additional assistance would be provided market milk, its production would nevertheless continue to benefit indirectly from the assistance provided production of manufacturing milk.
8.3 Criticisms of the Commission's estimates
In the course of this inquiry, and particularly at the assistance measurement workshop held in April 1991, the dairy industry presented many criticisms of the Commission's estimates. Some criticisms were directed at the accuracy and relevance of the data used by the Commission. For example, it was pointed out that Australian Dairy Corporation statistics of market milk sales for New South Wales included sales of New South Wales sourced milk to the Australian Capital Territory for processing into liquid milks and that milk used for producing cream in New South Wales was paid a manufacturing milk price rather than the regulated market milk price. It was also pointed out that

MEASURED ASSISTANCE TO THE DAIRY INDUSTRY
139
the Australian Bureau of Agricultural and Resource Economics (ABARE) data on market milk unit returns for New South Wales and Tasmania were on a different basis to those for other States. In these cases the estimates have been revised using more appropriate data.
Other criticisms focused more on general principles or assumptions adopted in deriving assistance estimates. Those criticisms are discussed in the remainder of this section. There are six principal issues:
the treatment of non-traded inputs;
the choice of import parity or export parity as the basis for estimating assistance;
the use of actual (‘subsidised’) world trade prices in deriving assistance measures;
the benchmark price for market milk relative to manufacturing milk in a deregulated environment;
the measurement of assistance to dairy farming instead of milk production; and
the measurement of assistance to the total dairy industry instead of to individual dairy activities.
8.3.1 Non-traded inputs
Some dairy industry representatives argued that the assistance measures should take into account the disadvantages imposed on the industry in its use of non-traded inputs. For example, United Dairyfarmers of Victoria (UDV) observed that:
Significant non-traded inputs are also consumed by dairyfarmers with items such as electricity, irrigation
water, transport, rates and taxes being highly inflated due to Government policy of protecting the providers
from international competitiveness. (Submission 9, p. 20)
The UDV also drew attention to their view that the regulated wages system adds to the costs of manufacturing dairy products in Australia.
The Commission agrees that, in principle, interventions which change the cost to users of such services from those that would prevail if the services were priced to reflect full-cost recovery of efficient provision, should be taken into account in measuring assistance. However, even if all such adjustments could be made, there is no certainty that the dairy industry would be shown in a more favourable light as seems to be implied by those industry representatives who seek the inclusion of non-traded inputs.
The assistance measures attempt to capture relativities between industries. Thus, including the user-cost effects of assistance to non-traded inputs in the estimates would only be useful if they were
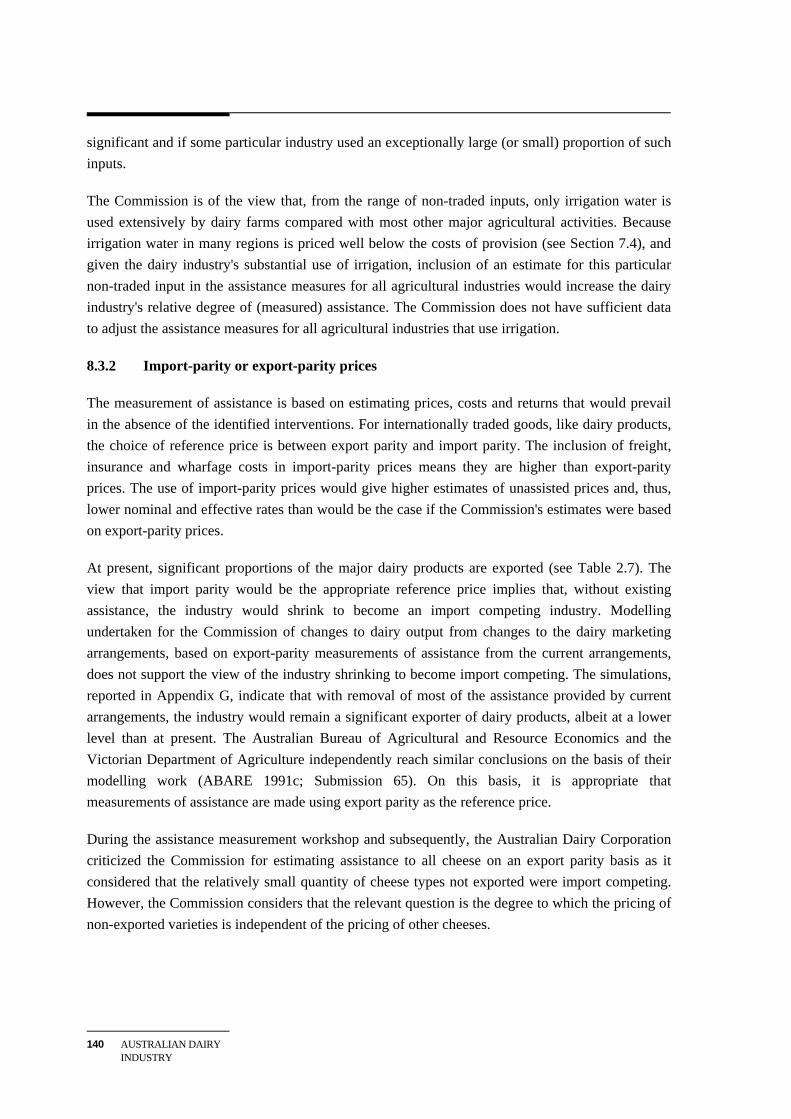
140 AUSTRALIAN DAIRY INDUSTRY
significant and if some particular industry used an exceptionally large (or small) proportion of such inputs.
The Commission is of the view that, from the range of non-traded inputs, only irrigation water is used extensively by dairy farms compared with most other major agricultural activities. Because irrigation water in many regions is priced well below the costs of provision (see Section 7.4), and given the dairy industry's substantial use of irrigation, inclusion of an estimate for this particular non-traded input in the assistance measures for all agricultural industries would increase the dairy industry's relative degree of (measured) assistance. The Commission does not have sufficient data to adjust the assistance measures for all agricultural industries that use irrigation.
8.3.2 Import-parity or export-parity prices
The measurement of assistance is based on estimating prices, costs and returns that would prevail in the absence of the identified interventions. For internationally traded goods, like dairy products, the choice of reference price is between export parity and import parity. The inclusion of freight, insurance and wharfage costs in import-parity prices means they are higher than export-parity prices. The use of import-parity prices would give higher estimates of unassisted prices and, thus, lower nominal and effective rates than would be the case if the Commission's estimates were based on export-parity prices.
At present, significant proportions of the major dairy products are exported (see Table 2.7). The view that import parity would be the appropriate reference price implies that, without existing assistance, the industry would shrink to become an import competing industry. Modelling undertaken for the Commission of changes to dairy output from changes to the dairy marketing arrangements, based on export-parity measurements of assistance from the current arrangements, does not support the view of the industry shrinking to become import competing. The simulations, reported in Appendix G, indicate that with removal of most of the assistance provided by current arrangements, the industry would remain a significant exporter of dairy products, albeit at a lower level than at present. The Australian Bureau of Agricultural and Resource Economics and the Victorian Department of Agriculture independently reach similar conclusions on the basis of their modelling work (ABARE 1991c; Submission 65). On this basis, it is appropriate that measurements of assistance are made using export parity as the reference price.
During the assistance measurement workshop and subsequently, the Australian Dairy Corporation criticized the Commission for estimating assistance to all cheese on an export parity basis as it considered that the relatively small quantity of cheese types not exported were import competing. However, the Commission considers that the relevant question is the degree to which the pricing of non-exported varieties is independent of the pricing of other cheeses.

MEASURED ASSISTANCE TO THE DAIRY INDUSTRY
141
Further, the Commission also considers that, because in the long run there would be a high degree of substitutability between all cheeses in both production and demand, the prices of non-exported cheeses would be strongly influenced by the prices of other cheeses. Thus, it is more appropriate to measure assistance to non-exported cheeses on the same basis (that is, export parity) than to measure assistance to non-exported cheeses based on import-parity prices or to ignore the assistance that may be provided to these cheese types.
Even if credence were given to the Australian Dairy Corporation's argument, there would be little difference to the Commission's estimates of assistance provided cheese production. For example, if all non-cheddar varieties that are not exported in significant quantities were included in the Commission's estimates on an import parity basis, the estimated benefit from higher domestic prices would be reduced by only $4 million or around 7 per cent of the total estimated benefit to cheese from higher domestic prices (Australian Dairy Corporation, Submission 62, p. 7).
It is also relevant to note that at present the Commission's estimates of assistance have been limited to the five major dairy products and that, no account has been taken of the assistance from the domestic market sales of other products with dairy input that qualify for market support payments on their exports (see Appendix F, Table F1). For example, in 1989-90 some $17 million of the total export subsidies of $118 million were for those other products. Some of the $17 million was paid to offset the higher domestic prices paid for the five major dairy products included in some of those products. However, the balance was for other dairy products manufactured from milk such as condensed milk and whey powder. The Commission has not taken into account the domestic price support provided to those products as it was unable to obtain the required information.
8.3.3 ‘Subsidised’ world prices
In several submissions to this inquiry, the point was made that if world trade in dairy products were liberalised, world prices would be of the order of 30 per cent higher than at present (see Section 3.4.1). The contention was that these higher prices should be used when measuring assistance to the Australian dairy industry. Clearly higher trade prices would increase the estimate of unassisted output returns and, in turn, would lower estimates of nominal and effective rates of assistance.
The Commission rejects the usefulness of making such adjustments because the practical reality is that current returns from export sales reflect actual returns achieved from the use of land, labour and capital to supply those markets - these returns reflect the opportunities that are available to Australia. Therefore, the Commission considers that assistance should be measured on the basis of actual world prices instead of those prices that could exist if other countries' interventions were removed.

142 AUSTRALIAN DAIRY INDUSTRY
8.3.4 Benchmark price for market milk
For the major dairy farming areas, it is clear that in a more open market, farm returns for market milk would more closely reflect the returns from the alternative use of milk for manufacturing dairy products than has occurred in the past. However, in the absence of a more open market for sourcing, processing and distributing market milk, it is difficult to be precise about how much assistance is provided by the current State arrangements.
As outlined in Appendix F, the measurement of assistance to market milk has been made on an individual State basis. For Victoria, Tasmania and Western Australia assistance was formerly measured as the difference between the regulated farm-gate price for market milk and a benchmark price derived from the farm-gate price for manufacturing milk, plus an out-of-season allowance based on the Victoria winter incentive payments.
For New South Wales, Queensland and South Australia, assistance was measured as the difference between the regulated farm-gate price for market milk and a benchmark price based on the Victorian price for manufacturing milk, plus transport and an allowance for out-of-season supply based on Victorian winter incentive payments.
During the inquiry, the Australian Dairy Corporation submitted estimates of milk freight rates from Victoria to other eastern State capital cities which were higher than those previously used by the Commission in estimating market milk assistance. With higher milk freight rates from Victoria, higher benchmark prices and lower estimates of assistance to market milk were derived for Queensland, New South Wales and South Australia. As indicated in Appendix F, the higher freight rates give a benchmark price for Queensland that is well above the regulated market milk price. Given that significant value attaches to the right to supply market milk in Queensland (as reflected by the price of entitlements), this calls into question the usefulness of this method of establishing benchmark prices. Further, supplies of locally produced out-of-season milk are available at much lower prices than the benchmark price based on transporting milk from Victoria.
As discussed in Appendix F, research undertaken by the Australian Bureau of Agricultural and Resource Economics indicates that, in a deregulated market, most market milk would be supplied locally and that interstate trade would be likely to occur only at certain times of the year, such as autumn or winter. Rather than increase prices paid to farmers in, for example, New South Wales and Queensland in order to increase local supplies out of season, the least-cost option could be to transport some additional milk from interstate. Research by the Victorian Department of Agriculture for the Victorian Government independently supported the findings of the Australian Bureau of Agricultural and Resource Economics.
Thus, the Commission considers that the benchmark price for market milk for Queensland, New South Wales and South Australia should be changed from the assisted manufacturing milk price in

MEASURED ASSISTANCE TO THE DAIRY INDUSTRY
143
Victoria plus transport, to an Australian average manufacturing milk price plus a margin for local transport and the cost of assurance of out-of-season supply. In the absence of a more open and competitive market for the supply of fresh and processed milk, it is not possible to be precise about the margins that would be established to cover the regional costs of assurance of out-of-season supply. However, it is clear that this margin would vary between major centres of population depending on their location relative to suitable land for dairying - being relatively low in Melbourne, Adelaide, Perth and Hobart and higher in Brisbane and Sydney.
As discussed in Chapter 4 and Appendix F, the farm-gate price for producing market milk out of season includes a margin above the price for manufacturing milk produced in season. This margin covers both the specific winter incentive payments and the market milk premium. In recent years, this margin has been between 13 per cent and 21 per cent in Victoria, 12 per cent to 20 per cent in Tasmania and 30 per cent to 34 per cent in South Australia. Specific winter incentive payments contributed only from 4.2 to 8.2 percentage points of the total in Victoria and from 3.0 to 7.3 percentage points of the total in Tasmania. There are no specific winter incentive payments in South Australia.
The specific winter incentive payments made in Victoria and Tasmania may not be a good guide to the cost of assurance of out-of-season supply. The payments are made in addition to the higher prices already received as a result of monthly pooling of the additional returns from sales of milk for market milk purposes on the basis of total monthly milk production. Thus, the total margin is considered to be a better guide of the incentive required to cover the additional costs of out-of-season supply.
The Canberra milk market has been put forward by the Australian Dairy Industry Council as providing a suitable benchmark for market milk assistance estimates (Submission 48, p. 21). As discussed in Appendix F, the public tendered prices for milk supplied to the Canberra market indicate that, when due allowance is made for the costs of collection, handling and delivery, there is virtually no margin above manufacturing milk prices for supplies from Victoria and a margin of around 20 per cent for supplies from New South Wales. While supportive of the new method of estimating the assistance provided by State arrangements, care would need to be exercised in extending the results of Canberra's experience in tendering for fresh milk supplies in view of the constraints that are imposed by current State arrangements on the ability of producers, processors, wholesalers and retailers to respond to the needs of consumers.
Finally research by Australian Bureau of Agricultural and Resource Economics indicates that the costs of year-round production in New South Wales are some 20 per cent higher than those of normal seasonal production (Lembitt and Bhati 1987). While indicating the additional costs of year round supply, the results may also be used to indicate the incentive required to offset the additional costs of out-of-season supply.

144 AUSTRALIAN DAIRY INDUSTRY
In the absence of more definite information on the incentive required to ensure out-of-season supply, the Commission has chosen an average margin of 20 per cent of the assisted manufacturing milk price for all States. While obviously not representative of any particular region, overall it is believed to be an adequate indication of the incentive that would be required.
The changed basis for measuring assistance to market milk results in higher estimates of assistance to market milk in Queensland, New South Wales, South Australia and for Australia as a whole. However, lower estimates of assistance to market milk are indicated for Victoria, Tasmania and Western Australia. Dual estimates for 1989-90 are given in the tables to indicate the effect of changing the method of measuring assistance to market milk production. The sensitivity of the estimates to different margins for the costs of out-of-season supply are given in Appendix F.
As noted in Appendix F, measurement of market milk assistance from manufacturing milk returns ignores the fact that such a benchmark includes the net effect of assistance to manufacturing milk - currently estimated to be around 3 cents per litre. If allowance is made for the assistance to manufacturing milk, then for 1989-90 the nominal assistance to market milk would increase by 15 percentage points to 52 per cent and the effective rate by 85 percentage points to 192 per cent.
In the absence of a clear specification of the nature and extent of interstate trade that would arise with more open sourcing, pricing and distribution of market milk, uncertainty must necessarily attach to any estimates of the assistance provided to market milk by the current arrangements. Nevertheless, the overwhelming conclusion is that production of market milk is highly assisted.
8.3.5 Assistance to dairy farming
A number of participants considered that it would be more meaningful to estimate assistance to dairy farming per se rather than to milk production by end use. Some had concerns about the way the Commission accounted for other farm activities and for by-products of milk production, such as bobby calves, in deriving cost structures for milk production by end use from Australian Bureau of Agricultural and Resource Economics dairy farm survey data �� details of which are given in Appendix F. Defining an agricultural industry on the basis of all the activities undertaken on a given type of farm would be more consistent with the way manufacturing industries are defined by the Australian Bureau of Statistics and used by the Commission in its estimates of assistance to manufacturing establishments. These establishments are classified to industries on the basis of major outputs and include all activities undertaken at the establishments.
However, the estimation of dairy assistance on a farm establishment basis would be inconsistent with the way the Commission measures assistance to agricultural commodities. For agriculture, assistance is measured on a commodity specific basis to reflect the importance of specific assistance to individual agricultural commodities.

MEASURED ASSISTANCE TO THE DAIRY INDUSTRY
145
It is recognised that the production of milk involves sales of bobby calves and culled cows. But to provide consistency in the estimates of assistance as between agricultural activities, it has been necessary to treat their production as separate activities. This has been achieved by allocating costs between milk production and the production of bobby calves and culled cows in proportion to their respective revenue shares.
When estimated on a farm establishment basis, the nominal rate of assistance for 1989-90 was 18 per cent and the effective rate was 42 per cent. On a milk production basis, the nominal and effective rates were 24 per cent and 61 per cent respectively. The lower nominal rate for dairy farming as opposed to milk production reflects the effect of averaging the high level of assistance to milk production, which comprises some 78 per cent of total farm receipts, with the much lower level of assistance to the other receipts, which are largely from sales of beef and veal. The nominal rate for dairy farming is a weighted average of the two. Similarly, as total dairy farm costs are allocated to milk and other dairy farm receipts on the basis of revenue shares, the lower effective rate for dairy farming also reflects the weighted average of the relatively high net assistance to milk and low net assistance to other outputs.
8.3.6. Total dairy industry assistance
A number of participants considered that it would be more meaningful to provide an estimate for the total dairy industry rather than separate estimates for milk production by end use, milk processing and for the different types of dairy product manufacture. They pointed to the interdependence between milk production and the processing of that milk into fresh milk products or the manufacture of it into dairy products. These participants pointed to an apparent conflict between measures which show high assistance to milk production and low assistance to milk processing and dairy product manufacture.
As pointed out by participants, high effective rates of assistance usually indicate that community welfare could be improved if some resources were diverted to lower assisted industries from the more highly assisted industries. This, in their view, implied the absurd notion that community welfare could be improved by transferring resources from the highly assisted milk production industry to the lowly assisted milk processing and dairy product manufacturing industries. However, these industries are directly linked because milk, the main output of dairy farms, is also the main raw material for the processing and manufacturing industries. This means that the growth and development of one cannot be considered in isolation from the other. For example, to the extent that additional agricultural resources are attracted to milk production by assistance, additional manufacturing resources are required to manufacture dairy products from that milk.
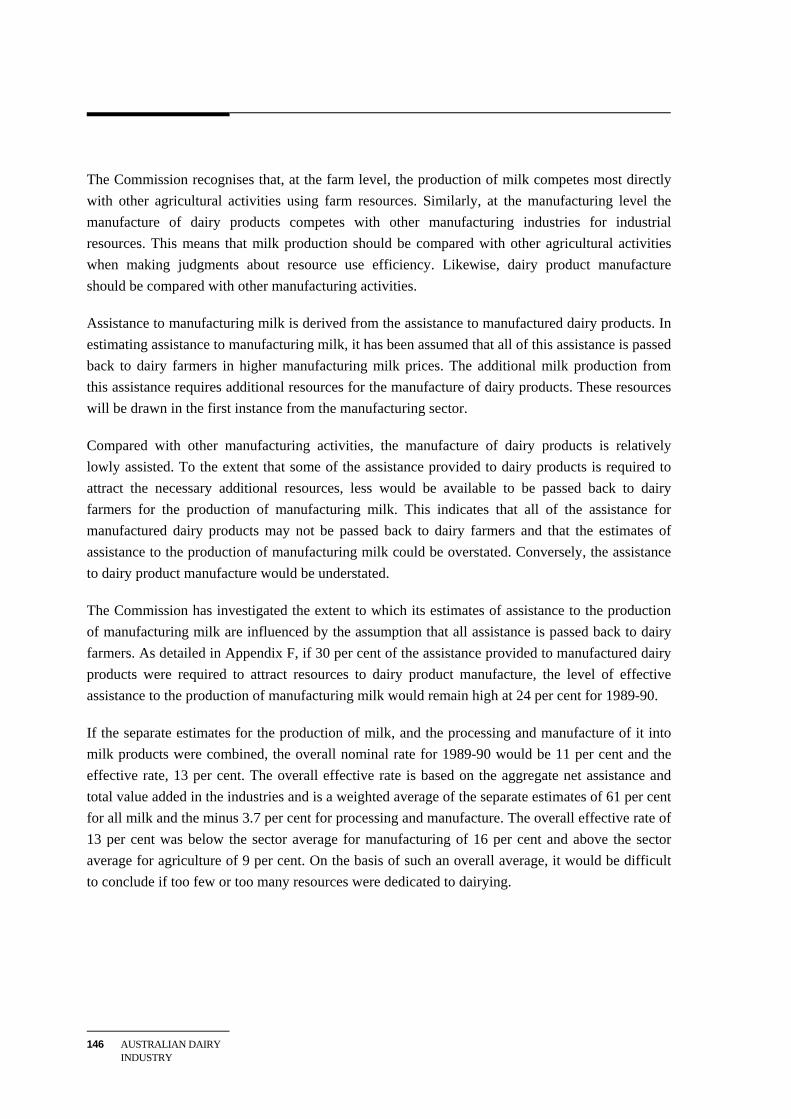
146 AUSTRALIAN DAIRY INDUSTRY
The Commission recognises that, at the farm level, the production of milk competes most directly with other agricultural activities using farm resources. Similarly, at the manufacturing level the manufacture of dairy products competes with other manufacturing industries for industrial resources. This means that milk production should be compared with other agricultural activities when making judgments about resource use efficiency. Likewise, dairy product manufacture should be compared with other manufacturing activities.
Assistance to manufacturing milk is derived from the assistance to manufactured dairy products. In estimating assistance to manufacturing milk, it has been assumed that all of this assistance is passed back to dairy farmers in higher manufacturing milk prices. The additional milk production from this assistance requires additional resources for the manufacture of dairy products. These resources will be drawn in the first instance from the manufacturing sector.
Compared with other manufacturing activities, the manufacture of dairy products is relatively lowly assisted. To the extent that some of the assistance provided to dairy products is required to attract the necessary additional resources, less would be available to be passed back to dairy farmers for the production of manufacturing milk. This indicates that all of the assistance for manufactured dairy products may not be passed back to dairy farmers and that the estimates of assistance to the production of manufacturing milk could be overstated. Conversely, the assistance to dairy product manufacture would be understated.
The Commission has investigated the extent to which its estimates of assistance to the production of manufacturing milk are influenced by the assumption that all assistance is passed back to dairy farmers. As detailed in Appendix F, if 30 per cent of the assistance provided to manufactured dairy products were required to attract resources to dairy product manufacture, the level of effective assistance to the production of manufacturing milk would remain high at 24 per cent for 1989-90.
If the separate estimates for the production of milk, and the processing and manufacture of it into milk products were combined, the overall nominal rate for 1989-90 would be 11 per cent and the effective rate, 13 per cent. The overall effective rate is based on the aggregate net assistance and total value added in the industries and is a weighted average of the separate estimates of 61 per cent for all milk and the minus 3.7 per cent for processing and manufacture. The overall effective rate of 13 per cent was below the sector average for manufacturing of 16 per cent and above the sector average for agriculture of 9 per cent. On the basis of such an overall average, it would be difficult to conclude if too few or too many resources were dedicated to dairying.

MEASURED ASSISTANCE TO THE DAIRY INDUSTRY
147
However, such overall averages are of limited use. They reflect the combined effect of relatively efficient and inefficient uses of resources and may not indicate where changes to government interventions could improve efficiency. If improvements in efficiency are to be gained, there is no substitute for a detailed analysis of the government interventions contributing to a relatively high effective rate of assistance to milk production and the changes that are required in government policies to improve economic efficiency.
8.4 Policy implications of the estimates
The Australian Dairy Corporation expressed concern about drawing unqualified policy conclusions from measures of assistance (Submission 17, p. 29). The Commission is concerned to dispel any view that its individual policy recommendations are made solely on the basis of measures of assistance or particular model results. As indicated throughout the report, the Commission has sought to gain a thorough understanding of the Australian dairy industry and of the effects of individual interventions on that industry.
Measures of assistance and the modelled results of policy changes, like those given in Appendix G and in submissions by Australian Bureau of Agricultural and Resource Economics and the Victorian Government, have been useful for improving the Commission's understanding of the dairy industry and for highlighting the importance of various government interventions that influence its growth and development. They have emphasised the need to phase down levels of assistance over a period of years in order to avoid unnecessary adjustment costs being imposed in the dairy industry. But the recommended levels of continuing government support to the industry are not dependent on precise measured levels of assistance, nor on precise outcomes as predicted by econometric models.

IMPLEMENTATION AND EFFECTS OF THE COMMISSION'S
149
9 IMPLEMENTATION AND EFFECTS OF THE COMMISSION'S RECOMMENDATIONS
Government is extensively involved in the production and marketing of milk and dairy products. However, apart from public health and safety considerations, there is no justification for government interventions which have the effect of distorting prices and consumption and investment decisions. These distortions impose unnecessary costs on the Australian community.
There is already general recognition from within the dairy industry of the need to change the marketing arrangements for fresh milk beyond the farm gate. Such change has been implemented, or is being considered, in all States. But the willingness of the industry to consider change does not yet extend to removing government controls over setting farm gate prices for fresh milk or to the Commonwealth market support payment arrangements.
The dairy industry has undergone substantial adjustment under the Kerin Plan and significant gains in productivity by the farm and manufacturing sectors have been realised - the amount of assistance has declined significantly. Nevertheless, the pressures on the industry to be responsive to world prices and to reduce costs are ongoing. In particular, imports from New Zealand under the free trade agreement with Australia have the potential to impose significant pressure on the industry.
The ability of the industry to respond to such pressures will be impaired if governments continue to distort price signals and otherwise reduce the industry's flexibility.
9.1 Objectives of the recommendations
The Commission has made a number of recommendations to reduce or remove the involvement of government in the production and marketing of milk and dairy products. The recommendations are set out separately with respect to State marketing arrangements for fresh milk (Chapter 4), Commonwealth arrangements for manufacturing milk (Chapter 5), the Australian Dairy Corporation (Chapter 6), and tariffs, the cheese tariff quota, and underwriting (Chapter 7).
However, as the production and marketing of market milk and manufacturing milk are closely linked, the Commission's recommendations should be considered as an integrated package. They are designed to improve the welfare of the Australian community and, in particular, to:

150 AUSTRALIAN DAIRY INDUSTRY
reduce the extent of government involvement in the industry;
simplify and reduce the costs of administering the dairy marketing arrangements;
remove price distortions and the unnecessary costs imposed on society by the current arrangements;
remove the artificial distinction between market and manufacturing milk;
ensure that milk is produced in the least-cost location relative to market outlets;
ensure that the industry has the flexibility to adjust rapidly to changing circumstances and to capitalise on market opportunities; and,
in an overall sense, improve the competitiveness of the Australian dairy industry on the world market.
9.2 Implementation
The Commission's estimates of assistance to the dairy industry indicate that, although there has been a substantial decline in the level of assistance during the Kerin Plan, it remains highly assisted relative to other activities. Notwithstanding the difficulties of estimation, the estimates indicate that the industry is gaining considerable financial support from the marketing arrangements for market milk and manufactured dairy products. The Commission is concerned that, should this support be removed suddenly, unnecessary adjustment costs would be imposed on the industry. The Commission is thus proposing that its recommendations be fully implemented over a number of years.
Rather than set a precise timetable for change, the Commission is suggesting the pre-announcement of target dates by which specific goals should be achieved. This will provide a degree of flexibility as to when certain goals are achieved whilst allowing those directly affected the opportunity to plan the necessary adjustments to their operations. The goals and their target dates are described below.
The responsibility for implementing the Commission's recommendations resides with both the Commonwealth and State governments. Close cooperation between them will be essential if the benefits of the Commission's recommendations are to be realised fully whilst, at the same time, minimising adjustment costs to the dairy industry. These costs will only be minimised if the States take action to reduce the margin between market and manufacturing milk prices at the same time as assistance is phased down under the market support arrangements, and if some discipline is maintained over interstate trade in market milk. Too rapid a move to unrestricted interstate trade, and the associated sharp decline in market milk prices, would impose unnecessary adjustment pressure on the dairy industry.
The Commission is proposing the retention of the market support levy revocation clause (‘comfort clause’) as a means of imposing some discipline on interstate trade in market milk until the margin

IMPLEMENTATION AND EFFECTS OF THE COMMISSION'S
151
between the two prices is reduced. As the margin declines, the incentive to trade interstate will decline and, with it, the potential for a sharp fall in market milk prices.
Target dates for achieving proposed changes
July 1992 to July 1996 After July 1996
Remove cheese tariff quota - July 1992. Further reductions in market support payments and tariffs on dairy product imports in line with general changes in protection.
Phase down market support payments - commencing July 1992 Remove State controls restricting interstate trade in fresh milk - by July 1993.
Cease the operations of the Australian Dairy Corporation - when market support payments finish.
Phase down and remove State controls over the supply and prices of fresh milk beyond the farm gate - by July 1996.
Phase down and remove State farm gate prices and supply quotas for market milk - by July 1999.
Set market support payments at 5 per cent - July 1996.
Terminate underwriting - by July 1999
At the draft report hearing, a number of participants were concerned about the potentially disruptive effects of implementing change to the Commonwealth arrangements whilst the State arrangements remained virtually unchanged. The Victorian Government, for example, stressed the need for close cooperation in implementing the Commission's recommendations. It considered that an improvement in efficiency was dependent on the Commonwealth, States and industry cooperating and managing change. Of particular concern to the Victorian Government were the consequences for efficiency of not coordinating the removal of assistance. It stated that:
if the manufacturing milk assistance measures are removed at a faster rate than the market milk arrangements,
because of lack of co-ordination between state and Commonwealth, then the adjustment will be felt in the
manufacturing states - for example Victoria which most people would argue is the low cost end of the
industry - and it would allow producers in other states who have maybe a higher cost to not suffer adjustment
or not incur adjustment at the same rate ... (Public hearing transcript, p. 201)
Victoria is the major milk producing State. In addition, milk production throughout the year greatly exceeds that required for the fresh milk market in Victoria. Any action taken by Victoria will, therefore, have a significant influence over the sequence of implementing change to the marketing arrangements. If Victoria were to reduce gradually the administrative price for market milk (so that the margin above the price of milk produced in season reflects the incentive required to produce milk out of season), this would put pressure on neighbouring States, especially New South Wales, to do likewise. It would also help ensure that the adjustment pressures resulting from reducing the Commonwealth market support payments were not being borne disproportionately by the

152 AUSTRALIAN DAIRY INDUSTRY
manufacturing milk States. In addition, the gradual reduction in market milk prices so that they were more closely related to manufacturing milk prices should ensure that there is not a disruptive sharp decline in market milk prices.
Furthermore, provided the State governments reduce the differential between market and manufacturing milk prices whilst Commonwealth assistance to manufacturing milk is being reduced, the Commission considers that the ‘comfort clause’ will be effective in preventing a sharp decline in market milk prices. Should the States seek to maintain market milk prices, the ability of the ‘comfort clause’ to prevent market milk prices falling sharply will diminish as the Commonwealth assistance for manufacturing milk is phased down.
The South Australian Government considered that it was doubtful if the ‘comfort clause’ would afford sufficient protection of the market milk sector over the full period recommended by the Commission for phasing down the market support payments. There would come a time when the ‘comfort clause’ would be invoked resulting in interstate trade in fresh milk at manufacturing milk prices (Public hearing transcript, p. 152). Should it be invoked, the South Australian Government suggested that ‘the Commonwealth government should increase rural adjustment funding to allow for any adjustment that is required’ (Public hearing transcript, p. 154). The Commission considers that it may be appropriate to provide assistance in this manner, so long as the extent of the decline has not been increased by inaction on the part of the States in reducing gradually the differential between market and manufacturing milk prices. Any assistance provided in this way should be targeted to assist the dairy industry to adjust.
9.3 Effects of implementing the recommendations
The Commission's recommendations, if implemented, would remove the arbitrary boundaries which have developed around the market milk industries of each State, and between market and manufacturing milk. If the higher prices for market milk were reduced, and the restrictions on interstate trade were removed, it is unlikely that there would be significant interstate trade in market milk because of transport costs. Nevertheless, the potential to source milk from interstate will impose a necessary competitive discipline on farmers, processors and retailers to keep their costs down.
The major effects of implementing the Commission's recommendations would result from its recommendations to remove the involvement of State governments in the supply and pricing of fresh milk and to reduce the assistance to the industry from the Commonwealth marketing arrangements. In evaluating these effects through the modelling work undertaken for it and other analyses, no assessment has been made by the Commission of the dynamic gains to the Australian community that will be realised from reducing the involvement of government in the dairy industry. These gains will stem from the more competitive environment that will be created. This will place ongoing pressures on participants to seek further productivity improvements, to reduce costs, and to adjust products to meet consumer demands.
IMPLEMENTATION AND EFFECTS OF THE COMMISSION'S
153
The Commission considers that the processing, distribution and retailing segments of the fresh milk market have the greatest potential for dynamic gains. This is because of the extensive government regulations that have applied in these segments covering margins and prices, product development and promotion, and distribution zoning. Such government involvement has constrained businesses from finding lower-cost ways of meeting the needs of customers or undertaking product development.
By contrast, dairy farmers and product manufacturers (particularly under the Kerin Plan) have been exposed to movements in world prices, although their returns have been increased by the State pricing arrangements for market milk and the Commonwealth market support arrangements. In responding to world prices, farmers and manufacturers have not been constrained by government regulations in areas such as herd improvement, investment in new plant and equipment, or product development. The potential for dynamic gains in the farming and manufacturing segments of the industry, therefore, do not appear to be as great as for the market milk segment, post farm gate. Because of the way in which assistance has been provided, efficiency gains have continued to be realised in the farming and manufacturing segments. The Victorian Government said:
Unlike many other industries which receive assistance, the forms of protection provided to the dairy industry
have allowed significant improvements in efficiency in the dairy industry to occur. On Australian dairy farms,
productivity has increased by 1.9 per cent per year over the period 1967-68 to 1988-89. This has been partly
due to a reduction in the number of farms from 117,000 in 1960 to 15,300 in 1990 and partly because of
improvements in farm production and handling methods. (Submission 34, pp. 32-33)
Furthermore, in assessing the effects of implementing its recommendations, the Commission has not taken into account any future change in the relative profitability of dairying compared with other farming activities, such as beef production. Nor has it taken into account the potential for an improved international trading environment for dairy products as a result of, for example, the current Uruguay Round of multilateral trade negotiations. When and if such opportunities arise, an industry whose flexibility of response has been enhanced will be so much better able to reap the benefits.
Leaving aside these potential dynamic gains, changes in the relative profitability of dairy farming, and an improved international trading environment, some of the major effects of implementing the Commission's recommendations are as follows.
Farm gate prices for fresh milk
In the absence of administratively set prices, there would not be a separate farm gate price for fresh milk. Rather different prices would be paid for milk produced out of season to ensure year-round supplies compared with the price for milk produced in season. Taking into account the higher costs of producing milk out of season and reduced yield, the out-of-season price is likely to be in the

154 AUSTRALIAN DAIRY INDUSTRY
range of 10 to 20 per cent above the in-season price. The difference in farm gate prices for milk produced in and out of season will vary from region to region, and even from farm to farm in a region.
Currently the farm gate price of fresh milk is around 60 per cent on average above the manufacturing milk price. If this difference were reduced to 20 per cent to reflect only the additional costs of producing milk out of season, current farm gate prices for fresh milk would decline; based on 1989-90 prices, the decline could be in the range of 12 to 15 cents per litre. Such declines would effectively eliminate the value of quotas in New South Wales, Queensland and Western Australia.
Sourcing of fresh milk
The perishability of milk, and the seasonal nature of its production, suggest that, in the absence of government involvement, supplies of fresh milk would be sourced by commercial contracts between processors and individual farmers. The contracts would specify quality and quantities of milk to be produced, penalties for non-performance, and prices. Prices paid to individual farmers would be influenced directly by the costs incurred in producing milk out of season. This would avoid the adverse effects of pooling the higher returns from fresh milk sales between dairy farmers in each of Victoria, South Australia, and Tasmania.
To avoid potential disruption in fresh milk supplies, and to adjust supplies to the needs of consumers, the commercial contracts should be in place before the controls of the State Governments over supply are removed completely.
Consumer prices
Domestic prices of dairy products should fall by the extent of the decline in the market support payments on dairy product exports. With the removal of State government controls over supply and pricing, farm gate prices for fresh milk will decline. This decline would be expected to be reflected in a similar fall in the retail price of fresh milk to consumers. However, this may not occur in the short to medium term (that is, over two to five years). Consumer prices are also influenced by the prices charged by processors, distributors, vendors and retailers for their services. If current margins received by these service providers have been squeezed below sustainable long-term levels by regulation, the price of their services could increase once prices are no longer administratively set. This could offset, to some degree, the decline in the farm gate price for fresh milk in some markets.

IMPLEMENTATION AND EFFECTS OF THE COMMISSION'S
155
Such a potential outcome for consumer prices does not mean that consumers are going to be worse off in the long term with the removal of government supply and pricing controls for fresh milk for two main reasons. If margins for service providers have been squeezed, such that the providers have not been getting an adequate return on their management and capital, it would not be possible to sustain the administrative system in the long run. The service providers would not be able, for example, to maintain productive capacity (by investing in new plant and equipment) or undertake product development in response to changing tastes of consumers. It would only be a matter of time before the system started to break down, or the administrative margins were increased leading to higher consumer prices.
The second reason relates to consumer prices for fresh milk that would prevail with continuing administrative controls compared with their removal. The Commission considers that, in the long term (more than five years), consumer prices would be lower in the absence of government controls. Such an outcome would stem from, for example, processors being free to make their own decisions concerning investment in new plant and equipment in response to changing needs of consumers and pressure from competitors. No longer would processors be constrained in the way they responded to such pressures by their involvement in setting administrative margins and by the size of the margin granted.
Compared with the current situation of stable milk prices throughout the year, it is likely that retail prices will also be influenced by the cost of producing milk in different seasons and by changes in seasonal demand for milk. Retail prices may be higher in winter, for example, compared with prices during peak production in spring, because of higher production costs, reduced supply or increased demand. Price increases in winter may be constrained if consumers are prepared to switch to UHT milk; this milk is likely to have been processed from the ample supplies of milk produced in season.
The potential of importing UHT milk from New Zealand (under the free trade arrangements) may place a further limit on the increase in fresh milk prices with the removal of government controls over supply and pricing. However, the effectiveness of this limit will be influenced by the extent to which consumers regard UHT and fresh milk to be substitutes. The closer that they are substitutes, the greater the influence of UHT milk on the price of fresh milk.
Efficiency costs of current arrangements
The current marketing arrangements for milk and dairy products impose efficiency costs on the Australian community. These costs arise mainly from the higher prices that consumers have to pay and because the arrangements attract additional resources to the production of milk and dairy products.

156 AUSTRALIAN DAIRY INDUSTRY
The Commission has estimated these costs for 1989-90 in respect to the Commonwealth market support arrangements to be in the order of $13 million. This estimate has been calculated using an own price elasticity of demand for manufacturing milk of -0.25 and an elasticity of milk supply of 1.5; both elasticities are considered by the Commission to be reasonably likely values.
Further efficiency costs are imposed on consumers by the State arrangements for fresh milk. Using the most likely elasticities of -0.15 for demand for fresh milk, and 1.5 for milk supply, the Commission has estimated the total efficiency costs for 1989-90 associated with the State marketing arrangements to be in the order of $16 million. The efficiency costs of the arrangements in the States were: New South Wales, $3.1 million; Victoria, $4.1 million; Queensland, $2.1 million; Western Australia, $0.5 million; South Australia, $4.8 million; and Tasmania, $1.3 million.
Impact on size and structure of the dairy industry
The Commission has had the effects of its recommendations modelled using a special version of the ORANI model of the Australian economy called ORANI-F-MILK. The results of this modelling work undertaken for the Commission (which involved five scenarios), its limitations, and the results of alternative models are discussed in Appendix G.
Under one scenario (C), whereby market support payments are reduced from 20 per cent to 5 per cent, and prices for milk produced out of season are assumed to be 20 per cent higher than the price of milk produced in season (for modelling purposes, the in season price has been represented by manufacturing milk prices), the results indicate that the production of milk and dairy products would decline by around 4.6 per cent in the medium term. If instead, under another scenario (E), there were no difference in the price for milk produced out of season, the decline in production would be of the order of 5.4 per cent. This scenario represents the worst case situation under the Commission's recommendations and represents the unlikely event that no incentive would be required to produce milk out of season.
The greatest decline would occur in the States more orientated to the manufacture of bulk dairy products - Victoria, Tasmania and South Australia. The largest decline in the medium term would occur in Victoria, where production of milk under the first scenario (C) is projected to fall by some 8 per cent. The falls in Tasmania and South Australia would be around 5 per cent and 2 per cent respectively. The fall in milk production would be reflected mainly in reduced butter production of around 25 per cent and cheese production of around 5 per cent.
The impact of implementing the Commission's recommendations will be influenced by the relative profitability of dairy farming compared to other agricultural enterprises. It will also be influenced by the ease with which the use of land can change. These factors vary from region to region. In some areas, milk production may decline as resources are switched, for example, into beef
IMPLEMENTATION AND EFFECTS OF THE COMMISSION'S
157
production. For other areas, such a switch may not be possible and the production of milk may not decline as dairying still represents the most profitable use of the land. In these circumstances, the major impact of the Commission's recommendations will be reflected in declining land values for dairy farms.
Any decline in the production of milk and dairy products will impact on the number of dairy farmers and employment in the industry. This will be particularly so in the major dairy producing and manufacturing areas of Victoria, South Australia, and Tasmania. However, the potential impact on these regions from phasing down the market support payments to 5 per cent is not likely to be greater than that imposed under the Kerin Plan with the termination of the supplementary market support payments. The potential adverse effects of the loss of employment in these regions would be reduced by implementing the proposed changes, as recommended by the Commission, over a number of years. Implementing the Commission's recommendations should have no significant environmental consequences.
Currently, Australia exports some 25 per cent of milk production as dairy products. With a projected decline in milk production of about 5 per cent based on the modelling work undertaken for the Commission, Australia will remain a substantial net exporter of dairy products. The Australian Bureau of Agricultural and Resource Economics also is of the view that Australia would remain a net exporter with the removal of the market support payment arrangements (Submission 28, p. 32).
Modelling work undertaken by the Victorian Department of Agriculture also indicates that the Australian dairy industry would remain export orientated with the removal of government involvement in the industry. Compared with the contraction of around 5 per cent projected by ORANI-F-MILK in the medium term, the Department's model projects a decline in the order of 22 per cent in the long term. The Department's model also projects the greatest relative decline in milk production would occur in South Australia. The Commission agrees with this projected long-run result of the Department's model for South Australia (see Appendix G). Another guide that the adjustment is likely to be greatest in South Australia is provided by the estimated efficiency losses of the current State arrangements. Relative to milk production, these are estimated to be greater for South Australia than for any other State.
The modelling work undertaken for the Commission using ORANI-F-MILK has been based on the constraint that interstate trade in fresh milk does not occur. At present, the incentive for interstate trade is provided by the difference between the manufacturing milk price in one State and the potential to obtain the much higher market milk price in another State. Under the Commission's recommendations, this difference would largely be removed and so would the incentive for interstate trade.
The Commission agrees with the assessment of the Victorian Government that there would be very little interstate trade in fresh milk in the absence of government controls over supply and pricing, even with much lower transport costs (Submission 34, p. 30). This assessment is also

158 AUSTRALIAN DAIRY INDUSTRY
independently supported by research of the Australian Bureau of Agricultural and Resource Economics. Based on its model of the farm dairy sector, which explicitly incorporates seasonality in milk production and interstate trade in fresh milk, the Bureau found that such trade would remain limited after the removal of government controls mainly because of transport costs (ABARE 1991c, p. 4).
Adjustment Costs
If implemented, the Commission's recommendations would result in a contraction in milk production and impose adjustment costs on the industry. As indicated by the size of the efficiency losses, these adjustment costs are likely to be greatest in the milk producing regions of the manufacturing States of Victoria, South Australia, and Tasmania.
The Australian Dairy Corporation, Australian Dairy Industry Council, and the Australian Dairy Products Federation, considered that the Commission had not given sufficient attention to the costs of adjustment in the draft report. They considered the Commission had failed, for example, to take into account the full costs of unemployment (including the costs of relocation to find alternative employment), and losses associated with investments in plant and equipment and housing.
If the Commission had fully assessed these costs against the efficiency losses imposed by the current marketing arrangements, the Corporation considered that ‘the adjustment costs associated with removal of the current manufacturing arrangements may well exceed the costs which the Commission assumes are imposed on society’ (Submission 50, p. 18). This was said to be particularly so if a subsequent improvement in the international trading environment resulted in the resources, which would move out of the industry with a decline in assistance, moving back into the industry as a consequence of an improving international environment.
However, the efficiency gains from implementing the Commission's recommendations will benefit the community year after year. By contrast, the adjustment costs will only occur once. The cumulative efficiency gains are therefore likely to be greater than the additional adjustment costs stemming from the Commission's recommendations.
Furthermore, as stated in Section 3.6, the Commission considers that it would be inappropriate to delay changing the marketing arrangements of the dairy industry against the day that world dairy markets were liberalised. Through the free trade agreement with New Zealand, the Commonwealth Government has already indicated that the Australian dairy industry must respond, without protection, to the competitive pressures of international markets. This does not mean, however, that measures should not be taken to minimise the adjustment costs imposed on industries as they respond to these pressures. Thus, the Commission is proposing that its recommendations for the dairy industry should be implemented over a number of years.

IMPLEMENTATION AND EFFECTS OF THE COMMISSION'S
159
The Australian Dairy Industry Council said that it expected a significant improvement in the international trading environment within two years from July 1991 (Public hearing transcript, p. 9). If the Council's judgment proves correct, the resulting improvement in world prices could coincide with the start of the phasing down of the market support payments on 1 July 1993 as recommended by the Commission. There is, thus, a possibility that the improvement in world prices would offset the reduction in manufacturing milk prices as a result of reduced support payments. If this were to be the outcome, the net effect on total milk production could be negligible. In such circumstances, the effect of implementing the Commission's recommendations would be to prevent a wasteful expansion of the dairy industry that would occur if assistance to the industry was maintained at current levels.
Should the Council's judgment prove to be incorrect and there is no improvement in world prices by July 1993, the Commission considers that its adjustment program should continue unaltered. The dairy industry must start adjusting to prevailing world prices so that the efficiency costs of the current arrangements are not imposed on the Australian community indefinitely. The Commission has not included any judgment about world trade in formulating its recommendations or in discussing the likely outcome of their implementation.
9.4 Conclusion
Once fully implemented, the Commission's recommendations would greatly reduce the costs imposed on the Australian community by the current dairy arrangements. Provided the recommendations are implemented over a number of years, the resulting benefits would be achieved without imposing undue adjustment costs on the dairy industry.
By implementing the recommendations, clearer price signals would be provided to participants in the industry on which to base production, marketing, investment, and consumption decisions. Such signals should ensure that: milk is produced in least-cost locations relative to market outlets; the needs of consumers are met; the industry has the flexibility to adjust readily to changed market circumstances; and the industry remains competitive on the international market in order to take advantage of trade liberalisation should it occur.

APPENDICES 161
APPENDICES
PAGE
Appendix A: Public participation in the inquiry 163 Appendix B: Selected dairy industry statistics 167 Appendix C: Details of State marketing arrangements 181 Appendix D: Request for and advice from the Attorney-General's Department 211 Appendix E: Details of Commonwealth marketing arrangements 219 Appendix F: Assistance to the Australian dairy industry 229 Appendix G: Estimating the effects of implementing the Commission's recommendations 253
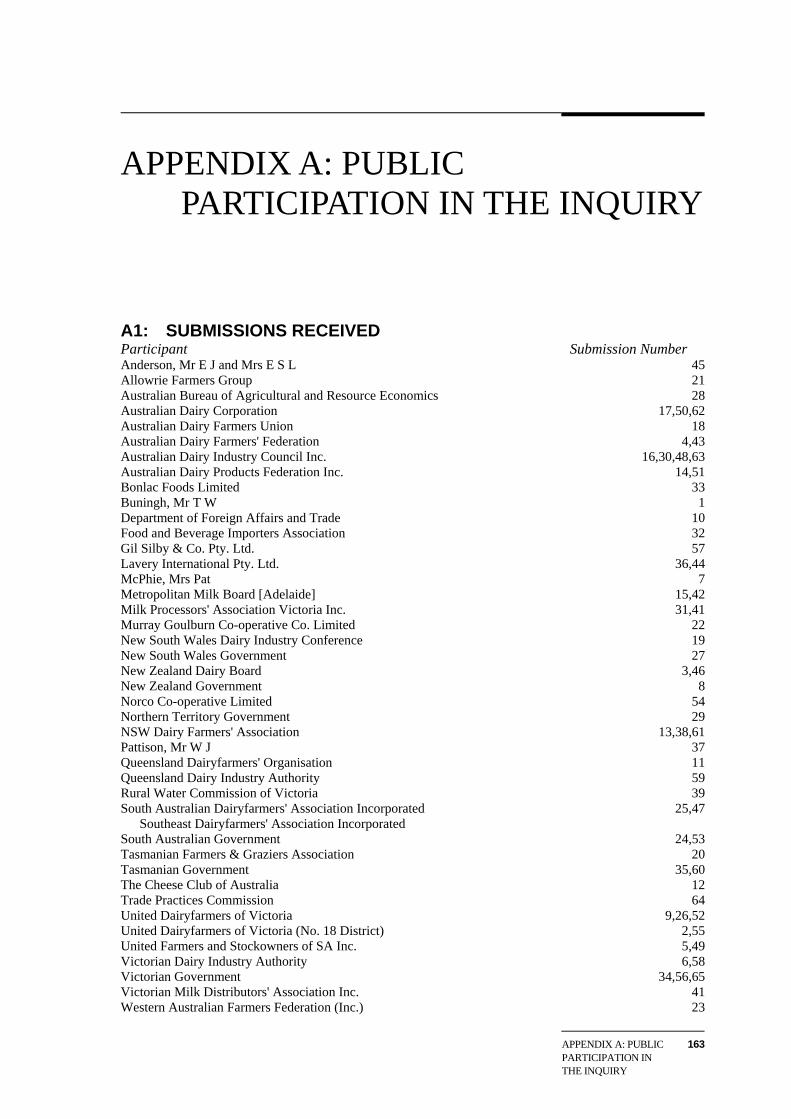
APPENDIX A: PUBLIC PARTICIPATION IN THE INQUIRY
163
APPENDIX A: PUBLIC PARTICIPATION IN THE INQUIRY
A1: SUBMISSIONS RECEIVED Participant Submission Number Anderson, Mr E J and Mrs E S L 45Allowrie Farmers Group 21Australian Bureau of Agricultural and Resource Economics 28Australian Dairy Corporation 17,50,62Australian Dairy Farmers Union 18Australian Dairy Farmers' Federation 4,43Australian Dairy Industry Council Inc. 16,30,48,63Australian Dairy Products Federation Inc. 14,51Bonlac Foods Limited 33Buningh, Mr T W 1Department of Foreign Affairs and Trade 10Food and Beverage Importers Association 32Gil Silby & Co. Pty. Ltd. 57Lavery International Pty. Ltd. 36,44McPhie, Mrs Pat 7Metropolitan Milk Board [Adelaide] 15,42Milk Processors' Association Victoria Inc. 31,41Murray Goulburn Co-operative Co. Limited 22New South Wales Dairy Industry Conference 19New South Wales Government 27New Zealand Dairy Board 3,46New Zealand Government 8Norco Co-operative Limited 54Northern Territory Government 29NSW Dairy Farmers' Association 13,38,61Pattison, Mr W J 37Queensland Dairyfarmers' Organisation 11Queensland Dairy Industry Authority 59Rural Water Commission of Victoria 39South Australian Dairyfarmers' Association Incorporated
Southeast Dairyfarmers' Association Incorporated 25,47
South Australian Government 24,53Tasmanian Farmers & Graziers Association 20Tasmanian Government 35,60The Cheese Club of Australia 12Trade Practices Commission 64United Dairyfarmers of Victoria 9,26,52United Dairyfarmers of Victoria (No. 18 District) 2,55United Farmers and Stockowners of SA Inc. 5,49Victorian Dairy Industry Authority 6,58Victorian Government 34,56,65Victorian Milk Distributors' Association Inc. 41Western Australian Farmers Federation (Inc.) 23
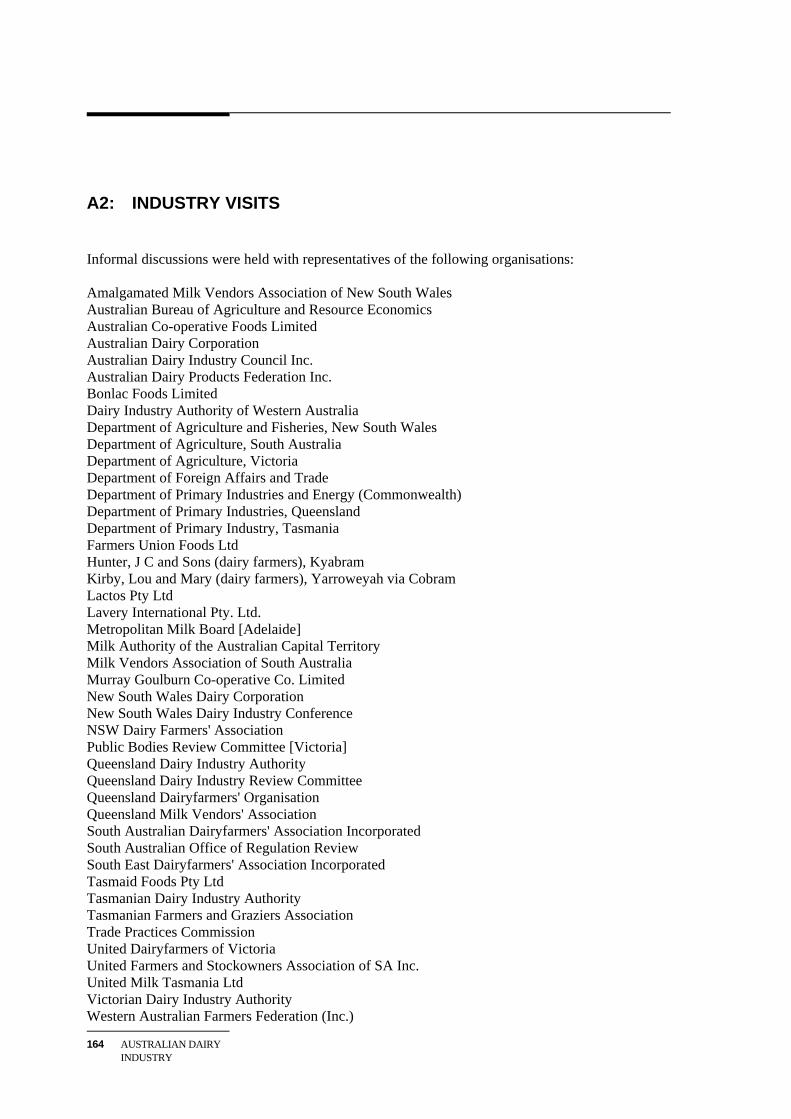
164 AUSTRALIAN DAIRY INDUSTRY
A2: INDUSTRY VISITS
Informal discussions were held with representatives of the following organisations: Amalgamated Milk Vendors Association of New South Wales Australian Bureau of Agriculture and Resource Economics Australian Co-operative Foods Limited Australian Dairy Corporation Australian Dairy Industry Council Inc. Australian Dairy Products Federation Inc. Bonlac Foods Limited Dairy Industry Authority of Western Australia Department of Agriculture and Fisheries, New South Wales Department of Agriculture, South Australia Department of Agriculture, Victoria Department of Foreign Affairs and Trade Department of Primary Industries and Energy (Commonwealth) Department of Primary Industries, Queensland Department of Primary Industry, Tasmania Farmers Union Foods Ltd Hunter, J C and Sons (dairy farmers), Kyabram Kirby, Lou and Mary (dairy farmers), Yarroweyah via Cobram Lactos Pty Ltd Lavery International Pty. Ltd. Metropolitan Milk Board [Adelaide] Milk Authority of the Australian Capital Territory Milk Vendors Association of South Australia Murray Goulburn Co-operative Co. Limited New South Wales Dairy Corporation New South Wales Dairy Industry Conference NSW Dairy Farmers' Association Public Bodies Review Committee [Victoria] Queensland Dairy Industry Authority Queensland Dairy Industry Review Committee Queensland Dairyfarmers' Organisation Queensland Milk Vendors' Association South Australian Dairyfarmers' Association Incorporated South Australian Office of Regulation Review South East Dairyfarmers' Association Incorporated Tasmaid Foods Pty Ltd Tasmanian Dairy Industry Authority Tasmanian Farmers and Graziers Association Trade Practices Commission United Dairyfarmers of Victoria United Farmers and Stockowners Association of SA Inc. United Milk Tasmania Ltd Victorian Dairy Industry Authority Western Australian Farmers Federation (Inc.)
APPENDIX A: PUBLIC PARTICIPATION IN THE INQUIRY
165
A3: ATTENDANCE AT ASSISTANCE MEASUREMENT WORKSHOP
The following organisations were represented at the assistance measurement workshop held on 10 April 1991 at the Commission's Canberra office. Allowrie Farmers Group Australian Dairy Corporation Australian Dairy Farmer's Federation Australian Dairy Industry Council Inc. Australian Dairy Products Federation Inc. Australian Financial Review Bonlac Foods Limited Cadbury Schweppes Pty Ltd Commission of the European Communities Coopers & Lybrand Dairy Industry Authority of Western Australia Department of Agriculture and Fisheries, New South Wales Department of Foreign Affairs and Trade Department of Industry, Technology, and Commerce (Commonwealth) Department of Manufacturing and Industry Development, (Victoria) Department of the Premier, Economic and Trade Development,(Queensland) Department of Primary Industries and Energy (Commonwealth) Department of Primary Industries, Queensland Department of Primary Industry, Tasmania Department of Prime Minister and Cabinet (Commonwealth) Metropolitan Milk Board [Adelaide] Milk Processors' Association of Victoria Inc Monash University National Farmers' Federation New Zealand Dairy Board New Zealand High Commission New South Wales Business Deregulation Unit New South Wales Dairy Corporation NSW Dairy Farmers' Association Price Waterhouse South Australian Office of Regulation Review South Australian Dairyfarmers' Association Incorporated State Bank of New South Wales Sugar Board, Queensland Sugar Consultants Australia Tasmaid Foods Pty Ltd Trade and Market Research United Dairyfarmers of Victoria United Dairyfarmers of Victoria (No. 18 District) Victorian Dairy Industry Authority

166 AUSTRALIAN DAIRY INDUSTRY
A4: Participants at the Public Hearings Public hearings for the inquiry were held in Melbourne on 30 July 1991 and 31 July 1991. The following organisations presented evidence at the hearings. Australian Dairy Corporation Australian Dairy Farmers' Federation Australian Dairy Industry Council Inc. Australian Dairy Products Federation Inc. Gil Silby & Co. Pty. Ltd. Lavery International Pty. Ltd. Metropolitan Milk Board [Adelaide] NSW Dairy Farmers' Association South Australia Government South Australian Dairyfarmers' Association Incorporated United Dairyfarmers' of Victoria United Dairyfarmers' of Victoria (No. 18 District) United Farmers and Stockowners of SA Inc. Victorian Government Victorian Milk Distributors' Association Inc.

APPENDIX B: SELECTED DAIRY INDUSTRY
167
APPENDIX B: SELECTED DAIRY INDUSTRY STATISTICS
TABLE B.1 Number of registered dairy farms, by region, State and Australia, years ended June 1971, 1980 to 1990
TABLE B.2 Average number of dairy cows per herd, by State and Australia, at 30 June 1971, 1980
to 1990 TABLE B.3 Average annual milk production per cow, by region, State and Australia, years ended
June 1971, 1980 to 1990 TABLE B.4 Wholemilk production, by region, State and Australia, years ended June 1971, 1980 to
1990 TABLE B.5.1 Value of farm milk production (current prices), by State and Australia, years ended
June 1980 to 1990 TABLE B.5.2 Value of farm milk production (constant prices), by State and Australia, years ended
June 1980 to 1990 TABLE B.6 Proportion of milk used for market and manufacturing purposes, by State and
Australia, years ended June 1980, 1985 and 1990 TABLE B.7.1 Manufacturing and market milk prices, annual averages, by State, years ended June
1984 to 1990 TABLE B.7.2 Manufacturing and market milk price indices, annual averages, by State, years ended
June 1973 to 1990 CHART B.1 Dairy products sub-group of the Consumer Price Index (CPI), all foods group and total
CPI, capital cities' weighted averages, 1980-81 to 1989-90 CHART B.2 Dairy products sub-group of the CPI and its components, capital cities' weighted
averages, comparisons 1980-81 to 1989-90 CHART B.3 Milk and cream CPI component, Sydney, Melbourne and Brisbane, 1980-81 to 1989-
90 CHART B.4 Milk and cream CPI component, Adelaide, Perth and Hobart, 1980-81 to 1989-90 TABLE B.8 Selected structural data, milk processors and manufacturers, by State and Australia,
1978-79, 1983-84 and 1988-89 TABLE B.9 Exports of dairy products, commodities by main countries of destination, 1984-85 to
1989-90 TABLE B.10 Imports of dairy products, commodities by main countries of source, 1984-85 to
1989-90
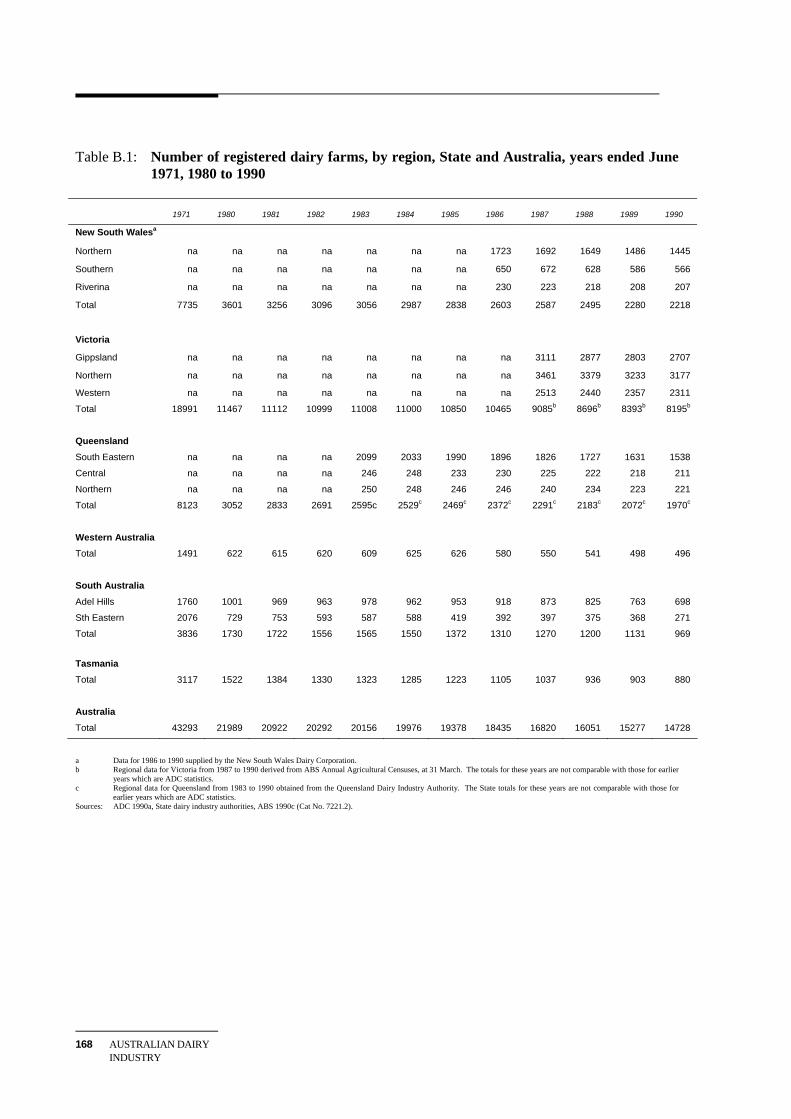
168 AUSTRALIAN DAIRY INDUSTRY
Table B.1: Number of registered dairy farms, by region, State and Australia, years ended June
1971, 1980 to 1990
1971 1980 1981 1982 1983 1984 1985 1986 1987 1988 1989 1990
New South Walesa
Northern na na na na na na na 1723 1692 1649 1486 1445
Southern na na na na na na na 650 672 628 586 566
Riverina na na na na na na na 230 223 218 208 207
Total 7735 3601 3256 3096 3056 2987 2838 2603 2587 2495 2280 2218
Victoria
Gippsland na na na na na na na na 3111 2877 2803 2707
Northern na na na na na na na na 3461 3379 3233 3177
Western na na na na na na na na 2513 2440 2357 2311
Total 18991 11467 11112 10999 11008 11000 10850 10465 9085b 8696b 8393b 8195b
Queensland
South Eastern na na na na 2099 2033 1990 1896 1826 1727 1631 1538
Central na na na na 246 248 233 230 225 222 218 211
Northern na na na na 250 248 246 246 240 234 223 221
Total 8123 3052 2833 2691 2595c 2529c 2469c 2372c 2291c 2183c 2072c 1970c
Western Australia
Total 1491 622 615 620 609 625 626 580 550 541 498 496
South Australia
Adel Hills 1760 1001 969 963 978 962 953 918 873 825 763 698
Sth Eastern 2076 729 753 593 587 588 419 392 397 375 368 271
Total 3836 1730 1722 1556 1565 1550 1372 1310 1270 1200 1131 969
Tasmania
Total 3117 1522 1384 1330 1323 1285 1223 1105 1037 936 903 880
Australia
Total 43293 21989 20922 20292 20156 19976 19378 18435 16820 16051 15277 14728
a Data for 1986 to 1990 supplied by the New South Wales Dairy Corporation. b Regional data for Victoria from 1987 to 1990 derived from ABS Annual Agricultural Censuses, at 31 March. The totals for these years are not comparable with those for earlier
years which are ADC statistics. c Regional data for Queensland from 1983 to 1990 obtained from the Queensland Dairy Industry Authority. The State totals for these years are not comparable with those for
earlier years which are ADC statistics. Sources: ADC 1990a, State dairy industry authorities, ABS 1990c (Cat No. 7221.2).

APPENDIX B: SELECTED DAIRY INDUSTRY
169
Table B.2: Average number of dairy cows per herd, by State and Australia, at 30 June 1971, 1980 to 1990
1971 1980 1981 1982 1983 1984 1985 1986 1987 1988 1989 1990
New South Wales
Northern na na na na na na na 87 89 91 93 94 Southern na na na na na na na 127 128 134 141 145 Riverina na na na na na na na 127 130 135 138 147 Total 97 97 99 99 101 88 85 92 93 92 100 99
Victoria
Gippsland na na na na na na na na 110 115 118 121 Northern na na na na na na na na 104 106 110 112 Western na na na na na na na na 111 112 117 122 Total 98 102 105 101 116 105 102 107 108a 110a 115a 118a
Queensland
South Eastern na na na na na na na na 86 86 89 89 Central na na na na na na na na 100 105 106 101 Northern na na na na na na na na 104 105 110 115 Total 73 82 83 92 95 87 86 82 87 89 92 92
Western Australia
Total 100 120 117 114 129 107 105 108 110 106 113 105
South Australia
Adel Hills 68 71 73 73 74 78 80 86 89 90 93 96 Sth Eastern
and other na na na na na na na na na na na na
Total 75 77 75 83 96 78 76 87 86 84 89 87
Tasmania
Total 73 79 85 86 98 81 88 99 102 103 105 105
Australia
Total 92 96 98 97 108 96 95 99 105 105 112 109
a Regional data for Victoria from 1987 to 1990 derived from ABS Annual Agricultural Censuses at 31 March. The totals for these years are not
comparable with those for previous years which are ADC statistics. Sources: ABARE 1990, State dairy industry authorities, ABS 1990c (Cat no. 7221.2).

170 AUSTRALIAN DAIRY INDUSTRY
Table B.3: Average annual milk production per cow, by region, State and Australia, years ended June 1971, 1980 to 1990
1971 1980 1981 1982 1983 1984 1985 1986 1987 1988 1989 1990
(litres)
New South Wales
Northern na na na na na na na 3194 3282 3504 3575 3435 Southern na na na na na na na 3907 3980 4091 4192 4175 Riverina na na na na na na na 3380 3519 3639 3780 3650 Total 2257 2870 2800 3059 3142 3253 3363 3361 3454 3619 3655 3636
Victoria
Gippsland na na na na na na na na 3836 3749 3891 3637 Northern na na na na na na na na 3985 4156 4330 4624 Western na na na na na na na na 3399 3467 3503 3361 Total 3263 3012 2963 2957 3130 3368 3419 3484 3766a 3820a 3834a 3912a
Queensland
South Eastern na na na na na na na na 2601 2773 2906 2957 Central na na na na na na na na 4290 4346 4222 4478 Northern na na na na na na na na 3446 3659 3696 3562 Total 1707 1977 2137 2365 2439 2688 2863 2643 2810 2970 3091 3132
Western Australia
Total 2586 3105 3014 2965 3180 3362 3522 3522 3610 3773 3828 4205
South Australia
Adel Hills 3085 3212 3228 3115 3407 3656 3592 3561 3696 3834 3865 3950 Sth Eastern
and other na na na na na na na na na na na na
Total 3406 3163 3143 3075 3542 3839 3665 3578 3658 3827 3915 4000
Tasmania
Total 2922 2958 2861 2955 3253 3452 3513 3619 3700 3344 3711 3791
Australia
Total 2609 2848 2810 2904 3069 3290 3337 3375 3502 3614 3772 3804
a Regional data for Victoria from 1987 to 1990 derived from ABS Annual Agricultural Censes at 31 March. The totals for these years are not
comparable with these for earlier years which are ADC statistics. Sources: ADC 1990a, State dairy industry authorities, ABS 1990c (Cat no. 7221.2), ABS 1990d (Cat no.7221.3).

APPENDIX B: SELECTED DAIRY INDUSTRY
171
Table B.4: Wholemilk production, by region, State and Australia, years ended June 1971, 1980 to 1990
1971 1980 1981 1982 1983 1984 1985 1986 1987 1988 1989 1990
(million litres)
New South Wales
Northern na na na na na na na 483 481 497 482 441 Southern na na na na na na na 337 338 346 351 346 Riverina na na na na na na na 85 87 89 90 92 Total 1237 907 840 875 905 940 940 904 906 932 923 878
Victoria
Gippsland na na na na na na na na 1316 1235 1288 1193 Northern na na na na na na na na 1429 1484 1537 1646 Western na na na na na na na na 947 930 967 948 Total 4062 3151 3065 3028 3164 3400 3516 3575 3692 3649 3792 3787
Queenslanda
South Eastern na 401 387 424 439 480 476 459 458 470 472 476 Central na 42 42 48 50 56 55 56 56 56 58 58 Northern na 65 68 74 75 84 84 85 88 58 96 95 Total 770 506 497 546 564 619 616 600 604 584 626 629
Western Australia
Total 256 222 214 209 221 232 243 243 248 249 245 267
South Australiab
Adel Hills 264 229 231 219 244 273 272 280 287 284 272 263 Sth Easternc
Other 206 100 88 87 96 109 100 85 67 20
67 26
6830
6627
Total 470 329 319 306 340 382 372 365 374 377 370 356
Tasmania
Total 450 315 289 294 322 340 346 351 352 306 334 345
Australia
Total 7245 5430 5224 5258 5516 5913 6026 6038 6173 6097 6290 6262
a Data for 1980 to 1990 supplied by the Queensland Dairy Industry Authority. b Adelaide Hills data from Metropolitan Milk Board, Other regions from ADC. c The available data did not allow a breakdown of production figures between the South Eastern region and other regions for the years 1971 to 1986. Sources: ADC 1990a, State dairy industry authorities.

172 AUSTRALIAN DAIRY INDUSTRY
Table B.5.1: Value of farm milk production (current prices), by State and Australia, years ended
June 1980 to 1990
1980 1981 1982 1983 1984 1985 1986 1987 1988 1989 1990
($ million, current prices)
New South Wales
Manufacturing 28 36 52 56 56 47 40 49 56 59 64 Market 137 151 184 195 181 195 179 200 197 231 239
Total 165 187 236 252 237 242 220 250 254 290 303
Victoria
Manufacturing 205 334 380 462 458 338 416 497 594 740 788 Market 102 121 140 152 130 135 141 146 153 163 169 Total 307 455 520 615 589 473 557 643 747 904 957
Queenslanda
Manufacturing 21 36 44 45 49 38 34 40 48 60 75 Market 58 60 76 90 98 105 109 119 123 136 146 Total 79 96 121 135 147 143 144 159 171 196 221
Western Australia
Manufacturing 19 23 27 34 36 32 32 35 39 39 40 Market 23 26 24 32 37 38 42 45 48 53 59 Total 42 49 52 67 74 70 74 80 87 93 99
South Australia
Manufacturing 4 19 14 13 15 14 13 15 16 15 23 Market 37 33 36 38 36 36 39 43 46 51 57 Total 41 52 50 51 52 51 53 58 62 66 80
Tasmania
Manufacturing 31 34 42 52 39 38 42 48 50 65 69 Market 11 9 10 12 12 16 14 15 16 18 20 Total 42 43 53 64 52 54 56 64 67 84 89
Australia
Manufacturing 309 482 560 664 655 509 580 687 805 981 1059 Market 369 402 473 521 497 525 526 570 585 654 690 Total 679 885 1033 1186 1153 1035 1106 1257 1391 1635 1749
Source: ABS 1990e (Cat No.7503.0).

APPENDIX B: SELECTED DAIRY INDUSTRY
173
Table B.5.2: Value of farm milk production (constant prices), by State and Australia, years ended June 1980 to 1990
1980 1981 1982 1983 1984 1985 1986 1987 1988 1989 1990
($ million, constant 1989-90 prices)
New South Wales
Manufacturing 62 72 95 93 86 69 55 60 65 63 64 Market 303 306 337 321 278 287 244 248 229 249 239
Total 366 379 432 414 365 356 299 310 294 313 303
Victoria
Manufacturing 455 675 696 759 704 498 567 618 688 800 788 Market 225 246 257 251 200 199 191 181 177 176 169 Total 681 921 953 1010 905 698 759 799 866 976 957
Queenslanda
Manufacturing 46 72 82 75 75 56 46 50 56 65 75 Market 130 122 140 148 151 154 149 148 142 147 146 Total 176 195 223 223 227 211 195 198 199 212 221
Western Australia
Manufacturing 42 46 49 56 56 47 44 43 45 42 40 Market 50 52 45 54 57 56 57 56 56 58 59 Total 93 99 95 110 113 103 101 100 101 101 99
South Australia
Manufacturing 9 38 26 22 24 21 18 19 18 16 23 Market 83 67 65 62 56 53 53 53 53 55 57 Total 92 106 92 84 80 75 72 73 72 72 80
Tasmania
Manufacturing 68 70 78 85 60 57 57 60 58 71 69 Market 24 18 19 20 19 23 20 19 19 19 20 Total 92 88 97 105 80 80 77 79 77 90 89
Australia
Manufacturing 685 976 1027 1092 1008 751 789 852 933 1059 1059 Market 818 814 866 857 764 775 716 708 679 706 690 Total 1503 1790 1894 1949 1772 1526 1505 1560 1612 1766 1749
Source: Commission estimates.

174 AUSTRALIAN DAIRY INDUSTRY
Table B6: Proportion of milk used for market and manufacturing purposes, by State and Australia, years ended June 1980 and 1990
1980 1985 1990
mkt mfg mkt mfg mkt mfg mkt mfg mkt mfg mkt mfg (litres million) (per cent) (litres million) (per cent) (litres million) (per cent) New South Wales 531 376 59 41 559 381 59 41 581 297 66 34 Victoria 437 2714 14 86 441 3075 13 87 452 3335 12 88 Queensland 249 257 49 51 280 341 45 55 316 313 50 50 Western Australia 119 103 54 46 129 114 53 47 149 118 56 44 South Australia 127 202 39 61 140 232 38 62 150 206 42 58 Tasmania 41 274 13 87 44 302 13 87 47 298 14 86 Australia 1504 3926 28 72 1593 4445 26 74 1696 4566 27 73
Source: ADC 1990a.
Table B.7.1: Manufacturing and market milk prices, annual averages, by State, years ended June 1984 to 1990
1984 1985 1986 1987 1988 1989 1990
(cents per litre) New South Wales Market 33.2 33.8 35.3 36.9 37.9 40.5 41.2 Manufacturing 13.8 12.4 15.3 16.2 18.9 20.0 22.8 Victoria Market 27.6 29.0 31.7 32.5 33.8 35.0 36.8 Manufacturing 15.8 13.8 14.7 18.1 19.7 23.7 25.1 Queensland Market 33.9 35.0 36.7 37.8 38.7 40.6 43.4 Manufacturing 13.7 10.6 15.6 15.5 18.2 20.3 23.4 Western Australia Market 28.7 29.4 30.8 32.6 34.2 35.9 37.3 Manufacturing 12.0 10.4 11.7 12.8 16.5 18.2 22.3 South Australia Market 27.6 28.5 30.0 30.8 36.0 32.8 37.4 Manufacturing 14.4 13.7 15.3 16.5 18.0 18.7 21.2 Tasmania Market 30.5 32.9 36.0 38.0 39.2 42.5 44.4 Manufacturing 16.6 12.9 13.7 16.5 18.7 22.1 22.7 Source: ABARE 1990a.

APPENDIX B: SELECTED DAIRY INDUSTRY
175
Table B.7.2: Manufacturing and market milk price indices, annual averages, by State, years ended June 1973 to 1990 1973 1975 1976 1977 1978 1979 1980 1981 1982 1983 1984 1985 1986 1987 1988 1989 1990 (index, 1980 - 81 = 100) New South Wales
Market 56 61 70 72 72 76 87 100 114 124 128 130 136 142 146 156 159 Manufacturing 53 56 55 54 60 76 79 100 118 118 110 99 108 107 134 141 161
Victoria
Market 48 60 64 70 77 78 83 100 116 121 134 141 154 158 164 170 177 Manufacturing 49 54 48 54 59 73 79 100 121 130 122 107 115 139 154 186 197
Queensland
Market 44 57 62 69 76 83 85 100 120 128 146 151 158 163 167 175 179 Manufacturing 44 51 50 56 57 67 77 100 123 141 122 95 120 112 140 156 176
Western Australia
Market 52 64 72 80 88 91 92 100 112 121 124 127 133 141 148 155 161 Manufacturing 50 63 55 61 69 81 85 100 130 149 145 126 124 135 175 192 217
South Australia
Market 44 53 61 64 73 79 86 100 120 125 129 133 140 143 149 159 171 Manufacturing 55 61 55 65 63 74 82 100 129 136 124 118 124 124 145 151 164
Tasmania
Market 49 61 68 71 74 84 87 100 120 123 127 137 150 158 163 177 184 Manufacturing 49 60 48 59 56 70 80 100 135 143 146 113 120 144 165 194 212
Source: ABARE unpublished statistics.

176 AUSTRALIAN DAIRY INDUSTRY
Chart B.1: Dairy products sub-group of the Consumer Price Index (CPI), all foods group and total CPI, capital cities weighted averages, 1980-81 to 1989-90
30
50
70
90
110
130
150
170
190
210
1980/81 1981/82 1982/83 1983/84 1984/85 1985/86 1986/87 1987/88 1988/89 1989/90
Food group cpiCPIDairy products cpi
Source: ABS Cat No. 6401.0.
Chart B.2: Dairy products sub-group of the CPI and its components, capital cities' weighted averages, comparisons 1980-81 to 1989-90
100
120
140
160
180
200
220
1980/81 1981/82 1982/83 1983/84 1984/85 1985/86 1986/87 1987/88 1988/89 1989/90
Milk & CreamOtherDairy ProductsCheeseButter
Source: ABS unpublished statistics.

APPENDIX B: SELECTED DAIRY INDUSTRY
177
Chart B.3: Milk and cream CPI component, Sydney, Melbourne and Brisbane, 1980-81 to
1989-90
100
110
120
130
140
150
160
170
1980/81 1981/82 1982/83 1983/84 1984/85 1985/86 1986/87 1987/88 1988/89 1989/90
SydneyMelbourneBrisbane
Source: ABS unpublished statistics.
Chart B.4: Milk and cream CPI component, Adelaide, Perth and Hobart, 1980-81 to 1989-90
100
110
120
130
140
150
160
170
180
190
1980/81 1981/82 1982/83 1983/84 1984/85 1985/86 1986/87 1987/88 1988/89 1989/90
HobartPerthAdelaide
Source: ABS unpublished statistics.

178 AUSTRALIAN DAIRY INDUSTRY
Table B.8: Selected structural data, milk processors and manufacturers, by State and
Australia, 1978-79, 1983-84 and 1988-89
1978-79 1983-84 1988-89
Processinga Manufacturingb Processing Manufacturing Processing Manufacturing
Number of establishments New South Wales 43 32 40 29 32 30 Victoria 45 66 45 60 21 52 Queensland 26 15 18 21 15 18 Western Australia 7 9 5 11 (17)c South Australia 7 16 7 16 5 Tasmania 5 10 3 9 3 Australia 133 148 118 146 (215)c Employment New South Wales 3085 2187 2444 2069 2132 1492 Victoria 2036 6786 1700 6200 2073 6339 Queensland 1554 796 (2146) 1472 644 Western Australia na na (95) (757) South Australia 573 655 398 817 299 446 Tasmania (652) (na) (664) Value added ($m) New South Wales 52.5 42.9 72.1 78.1 na na Victoria 39.7 139.6 88.0 281.5 na na Queensland 36.2 17.8 (100.8) na na Western Australia na na (38.8) na na South Australia 15.9 14.0 (42.4) na na Tasmania (18.3) na na na na Capital expenditure ($m) New South Wales 5.7 4.3 8.6 13.6 na na Victoria 5.4 22.6 4.4 21.8 na na Queensland 4.9 1.7 (6.7) na na Western Australia na na 1.5 na na na South Australia 1.9 2.7 (2.6) na na Tasmania (2.3) na na na na a includes establishments in ASIC class 2121 liquid milk and cream. Primary activities include testing, grading, chilling, processing and
distribution of liquid milk and cream and the manufacture of associated short shelf life products. b includes establishments in ASIC classes 2122 to 2125. Primary activities include the manufacture of butter, cheese, concentrated and evaporated
milk products and ice cream. c the bracketed numbers indicate that no breakdown is available between processors and manufacturers.
Sources: ABS 1985a, ABS 1985c, ABS 1985b, ABS 1990h, ABS 1990f, ABS 1990g.

APPENDIX B: SELECTED DAIRY INDUSTRY
179
Table B.9: Exports of dairy products, commodities by main countries of destination, 1984-85 to 1989-90 a
1984-85 1985-86 1986-87 1987-88 1988-89 1989-90
Kt $m Kt $m Kt $m Kt $m Kt $m Kt $m Cheese Japan 20.3 18.7 20.0 24.3 25.0 17.4 Saudi Arabia 13.4 10.8 11.0 11.6 8.7 7.0 Total 67.5 163.1 66.1 165.5 62.1 164.3 68.1 186.2 63.1 183.3 55.1 189.0 Butter Iran 2.4 5.8 0.0 10.5 0.0 4.0 Singapore 5.2 5.4 3.2 2.4 7.9 8.9 Total 47.4 76.3 49.1 77.6 33.2 58.2 40.9 66.9 38.0 65.2 51.3 116.4 Skim Milk Powder Phillipines 24.8 20.9 14.2 12.0 18.0 17.9 Thailand 11.8 11.5 16.3 12.2 4.1 12.7 Total 92.8 79.0 78.6 77.9 78.7 89.1 67.5 94.4 61.9 136.4 91.9 193.8 Casein Japan 2.2 2.0 1.8 2.7 1.7 0.6 USA 4.9 3.0 5.3 4.6 3.3 2.0 Total 7.4 16.0 5.3 13.7 7.5 23.0 7.7 31.4 5.4 33.7 3.2 18.0 Wholemilk Powder Taiwan 12.6 13.0 14.4 11.7 11.7 9.6 Singapore 4.8 5.3 13.8 10.4 14.8 5.7 Total 30.3 56.5 31.7 61.8 42.0 85.8 36.6 82.7 36.2 93.5 41.7 100.2 Other products na 36.3 na 44.3 na 63.7 na 71.2 na 80.6 na 96.1 Total na 427.2 na 440.8 na 484.1 na 532.8 na 592.7 na 713.5 a There are some differences between quantities exported in this table and those in Table 3.3 of the report which are based on data collected by the
ADC in the process of administering the market support payments scheme. Sources: ABARE 1990, ABS 1990a (Cat no. 5436.0).

180 AUSTRALIAN DAIRY INDUSTRY
Table B.10: Imports of dairy products, commodities by main countries of source, 1984-85 to 1989-90
1984-85 1985-86 1986-87 1987-88 1988-89 1989-90
Kt $m Kt $m Kt $m Kt $m Kt $m Kt $m Cheese New Zealand 8.0 16.4 9.9 16.3 7.0 17.1 4.5 11.5 8.4 22.6 8.9 29.8 Denmark 2.1 7.9 2.1 11.4 1.9 13.8 1.5 11.0 1.6 9.8 1.7 10.7 West Germany 2.3 7.6 1.6 7.4 1.3 7.6 1.3 7.3 1.1 4.8 1.3 7.2 Norway 1.5 4.8 1.3 5.3 1.6 5.4 1.7 6.1 1.4 5.8 1.4 5.6 Greece 1.4 4.8 1.3 5.2 1.2 5.6 1.2 6.3 1.1 5.6 0.6 3.5 Total 22.3 64.0 20.3 71.7 18.7 74.0 27.5 94.4 19.7 74.2 21.5 86.4 Butter New Zealand .. .. .. .. .. .. .. .. 0.3 0.7 1.0 2.5 Total .. .. .. .. .. .. .. .. 0.3 0.8 1.0 2.5 Milk & Cream including conc.
New Zealand 1.7 3.7 1.9 5.2 1.6 5.0 3.3 7.0 4.0 9.3 2.7 7.9 Total 1.7 3.7 2.4 6.6 2.6 5.1 3.5 8.0 5.3 11.6 2.7 7.9 Other products na 1.2 na 1.3 na 1.8 na 1.7 na 2.8 na 5.8 Total na 68.9 na 79.6 na 80.9 na 104.1 na 89.4 na 102.6 Source: ABS 1990b (Cat no. 5437.0).

APPENDIX C: DETAILS OF STATE MARKETING
181
APPENDIX C: DETAILS OF STATE MARKETING ARRANGEMENTS
This appendix provides a detailed description of the State regulation of dairy activity to support the analysis of these arrangements in Chapter 4. Taking one State at a time, the elements of regulation are described in the following order:
• the characteristics of the relevant statutory authority;
• regulation of the sourcing of market milk, such as production quotas or equitable sourcing;
• farm gate prices for market milk and the mechanisms for payment;
• processing, wholesale, and vending margins;
• retail prices; and
• quality assurance activities.
The major characteristics of State arrangements are summarised in Tables C.2 and C.3 at the conclusion of this appendix.
C.1 New South Wales
New South Wales dairy farms produced 878 million litres of milk in 1989-90 (about 14 per cent of Australian production). About 66 per cent was used for market milk, with the remaining 34 per cent used as manufacturing milk. Dairy farming is concentrated along the eastern seaboard, with most milk produced in the North Coast, the Hunter Valley and the South Coast regions. Some inland dairy farming takes place in the Riverina and in scattered pockets surrounding regional centres. Dairy industry regulation is administered by the New South Wales Dairy Corporation. The New South Wales Minister for Agriculture and Rural Affairs is advised on policy matters by the New South Wales Dairy Industry Conference.
The New South Wales Dairy Corporation and Dairy Industry Conference
The Corporation is a statutory body constituted in 1985 under the New South Wales Dairy Industry Act 1979 to administer State regulations. According to its statement of corporate objectives the Corporation is responsible for the production, quality, supply and distribution of milk, and the production, quality and storage of dairy products and margarine for the purposes of ensuring wholesomeness in the interests of public health and safety. The Corporation also seeks to ensure an

182 AUSTRALIAN DAIRY INDUSTRY
adequate supply of high quality milk at a reasonable price. The Corporation provides services to assist in the efficient management of the dairy industry in New South Wales.
The Corporation is accountable to the New South Wales Minister for Agriculture and Rural Affairs. The Corporation does not have a board of members �� the General Manager reports directly to the Minister.
In 1989-90 the total operating expenditure of the Corporation was $16.5 million, incurring an operating loss of $40 000. As at 30 June 1990 the Corporation employed 180 officers. The Corporation is funded by allocations within the price structure of milk and cream. For example, within the price structure of a one litre carton of milk the Corporation gets 1.23 cents for quality control services and 0.64 cents for administration services. The price structure also includes 0.55 cents per litre for promotion, which is transferred to Milk Marketing Pty Ltd. (The promotion allocation varies according to the product, and is as much as seven cents per litre for Shape, White Lite and HiLo.)
The New South Wales Dairy Industry Conference is a statutory authority also constituted under the Dairy Industry Act 1979 (NSW). The Conference has 39 members representing all sectors of the industry and is the body which advises the NSW Minister for Agriculture and Rural Affairs.
Milk Marketing (NSW) Pty Ltd is responsible for promoting milk and dairy products. Milk Marketing Pty Ltd operates as a private company and reports to the Conference. It is funded through its own commercial activity and a transfer of promotion funds from the Corporation ($4 million in 1989-90).
Supply quotas
Supply quotas are used to ensure adequate market milk supplies year round. Each quota holder supplies market milk in quantities determined by quota entitlements. Entitlements are expressed in daily litres of supply, and since 1 July 1990 they have been tradable in four-week blocks up to 12 months in advance. While there is no limit on the amount of quota a farmer can hold, a maximum of 104 000 litres can be purchased through the quota exchange in a year. To be eligible for an additional allocation, production in a corresponding period in one of the preceding three years must have been at least 125 per cent of the proposed total allocation for that period. It is usual for only 90 per cent of milk produced in-quota to be purchased at market milk prices. As a general rule, if a farmer supplies quantities below quota in any of the production periods then 75 per cent of the shortfall has to be disposed through the quota exchange. This penalty provides an incentive to produce over quota.

APPENDIX C: DETAILS OF STATE MARKETING
183
Payment for market milk
All milk produced in New South Wales is vested in the Corporation. The Corporation pays farmers on a four weekly basis and sells the milk to processors. Surplus milk is divested and is available to manufacturers of dairy products. Prices for market milk are determined by the Corporation. The prices are based on a cost recovery procedure.
There are six different farm gate prices set out in Milk Prices Order No. 121, which took effect on 11 January 1991. Each price relates to different end uses of milk that is identical in all other characteristics. The following minimum prices (in cents per litre) are stipulated in the Milk Prices Order:
• 43.18 for milk;
• 31.91 for provisional milk;
• 25.00 for milk accepted for separation for cream, rich cream or long-life cream;
• 35.221 for milk accepted for manufacture of long-life milk, long-life skim milk, long-life flavoured milk and/or flavoured skim milk;
• 43.93 for milk accepted for processing into Shape, Count Down, Lite White, HI-LO, Life, MAID-GLO, PRIMMA, or skim milk; and
• 42.75 for milk accepted for the manufacture of house brand milk.
These are gross prices and costs incurred by the Corporation in transporting milk, as specified in a schedule to the Prices Order, are deducted from farm gate price entitlements and an adjustment is made in payments to farmers. These deductions range from nil to 6.29 cents per litre. The schedule also indicates the milk distribution districts to which milk is permitted to be transferred from a particular receival factory.
Prices for manufacturing milk
Milk produced out of quota is paid for at manufacturing milk prices. Prices for manufacturing milk are determined through normal commercial negotiations between farmers and manufacturers.
Processing, wholesale and vending margins
Margins for all sectors of the industry are set for each quarter by the Corporation. Margins within each sector differ according to product, package size and packaging type. For example the vehicle vending margin for modified milk is 2.11 cents per litre higher than for plain milk. The per litre margin for a 600 ml bottle of milk is 0.92 cents less than for a one litre plastic bottle. The margin for a one litre plastic bottle of milk is 0.25 cents higher than for a one litre carton.

184 AUSTRALIAN DAIRY INDUSTRY
Margins are set through prices which are determined by the Corporation using an automatic cost-based formula. The price fixing mechanism is examined by the Price Structure Review Committee, which reports to the Minister for Agriculture and Rural Affairs. The Price Structure Review Committee is chaired by the General Manager of the Corporation and comprises representatives of the Conference and a consumer representative. Currently the Conference representatives are members of the Amalgamated Milk Vendors' Association and the NSW Dairy Farmers' Association.
Distribution
The distribution system is based on individual vendor monopolies, where the Corporation allocates a defined geographic area and/or list of retail outlets to a registered milk vendor. There are 160 distribution depots and 1763 registered vehicle vendors in New South Wales at present. The demand for household deliveries is reflected in the decline in vendor numbers by 30 per cent over the last decade.
Retail outlets must obtain their milk supplies from an officially appointed wholesale vendor, who is in turn bound to a specified processor. Vendors may change their source of supply under strict conditions.
Retail prices
Maximum retail prices apply for plain milk, sweet cream, modified milk such as Shape, White Lite, Hi-Lo and packaged skim. These maximum prices are set by the Corporation and are reviewed quarterly. Prices are determined by an automatic cost-based formula. However, since amendments to the regulations in March 1990 the Corporation has the power to take into consideration `prevailing market conditions'. Proposals to alter retail prices are gazetted. If there are sufficient objections to a proposal, the Minister for Business and Consumer Affairs may direct the NSW Prices Commissioner to investigate. There have not been any such investigations of pricing proposals to date (1 September 1991).
Supermarket prices are two cents per litre less than other retail prices, due to a decrease in the wholesale margin allowed on deliveries to supermarkets. Home delivery vending margins equal the sum of the wholesale and retail margins. Recent changes to pricing regulations allow home vendors to charge an additional fee of up to 10 cents per delivery. Retail prices of milk packaged in plastic bottles in certain country areas are 3 cents per litre higher than metropolitan prices due to the cost of transporting empty milk bottles to those areas.
Retail prices in the Murray Milk Distributing District are set in consultation with the Victorian Dairy Industry Authority and are presently aligned with retail prices in Victoria.

APPENDIX C: DETAILS OF STATE MARKETING
185
Quality control operations of the Corporation
A major objective of the Corporation is to enforce, review and implement quality standards to ensure the wholesomeness and purity of milk, dairy products and margarine in the interests of public health. Quality is monitored in raw milk, processed milk, dairy products and delivery and storage of milk. In 1989-90 quality monitoring accounted for 20 per cent of the expenditure of the Corporation ($3.1 million). The Corporation also conducts a number of research projects aimed at improving quality control procedures for milk and dairy products.
Raw milk
The Corporation tests bulk raw milk against bacteriological, chemical, and physical standards before it is accepted for either market milk or for manufacture into dairy products. Testing is aimed at detecting health risks such as pesticide residues, as well as detecting irregularities such as added water.
Processed milk
The Corporation tests processed milk and cream for compliance with regulatory standards for fat, solids non-fat, protein, phosphatase, iodine, coliform, antibiotics and micropipette count. There are specific programs to monitor listeria (for all dairy products) and yersinia (for processed milk).
The Corporation, in conjunction with the Commonwealth Department of Primary Industries and Energy, encourages the industry to adopt voluntarily the internationally recognised Hazard Analysis Critical Control Point concept of quality assurance. This enables the Corporation to deploy fewer resources to quality testing of processed milk.
Dairy products
The Corporation, in conjunction with the Department of Primary Industries and Energy, tests dairy products destined for export against standards set out in Commonwealth export controls, including inspections of dairy factories.
Dairy products for domestic markets are tested against the regulatory standards set out in the National Food Standards Code. These regulations are designed to ensure consistent standards and to protect public health and safety. Dairy products are also tested against `advisory' standards designed to detect irregularities such as the presence of micro-organisms that may reduce the shelf life of a product while not necessarily threatening public health and safety.
Distribution and storage
The Corporation inspects milk vendors' vehicles and retail outlets for compliance with refrigeration and insulation regulations. Shops selling packaged milk are inspected only if complaints are lodged, while shops selling unpackaged milk, such as milk shakes, are inspected twice a year.
186 AUSTRALIAN DAIRY INDUSTRY
C.2 Victoria
Victoria produced 3787 million litres of milk, or the equivalent of 60 per cent of Australia's total milk output in 1989-90. Approximately 12 per cent of this milk production was sold as market milk, which accounted for 25 per cent of gross receipts from milk. The remaining 88 per cent of milk production was used in the manufacture of dairy products; about half of the dairy products were exported.
Market milk in Victoria is defined as all milk available for human consumption in a liquid form. This includes whole milk, modified milks, cultured milk, flavoured milk and ultra heat treated milk. All milk that is sold as ultra heat treated milk in Victoria must be purchased from the Authority. The Authority makes bulk purchases of the ultra heat treated milk from processors at a market determined price. The milk is then sold to processors, at an Authority determined price, to be packaged into the various branded ultra heat treated products.
The Victorian dairy industry is regulated by the Victorian Dairy Industry Act 1984.
Victorian Dairy Industry Authority
The Victorian Dairy Industry Authority (VDIA) was established under the Dairy Industry Act 1984 (Vic) in 1985. The Authority sets a margin for its own operations based on costs incurred. The Authority's operations include marketing and promotion, supply and transport, product development and quality control, price determination, auditing of market milk operations, licensing, zoning and general administration.
An inquiry into the roles and functions of the Victorian Dairy Industry Authority was held by the Public Bodies Review Committee (PBRC) commencing in January 1988. The report of the Committee was tabled on 5 September 1989 and contained 48 recommendations concerning the objectives, structure, functions, powers and accountability of the Authority. The Committee recommended that controls over setting prices for market milk beyond the farm gate be removed. These recommendations were examined by the (then) Victorian Minister for Agriculture and Rural Affairs and preferred options were announced on 9 May 1990; proposed changes announced by the Minister in September 1991 did not eventuate. However, on 22 July 1991 the Victorian Government released a further discussion paper on the Victorian dairy industry. The paper outlined possible changes to the pricing and distribution of milk after it has been delivered in-store to processors.

APPENDIX C: DETAILS OF STATE MARKETING
187
Price and supply arrangements
Prices in all sectors of the Victorian market milk system are regulated by the Authority. The Authority has the statutory powers necessary to vest all milk produced in Victoria. Under the Dairy Industry Act 1984 (Vic), the Authority is required to consult with the Prices Commissioner who in turn is required to report to the Minister for Agriculture and Rural Affairs in respect of any price determination of the Authority. The Government can approve or reject the Authority's price determination but cannot alter or amend it.
In 1986 a system known as ‘benchmarking' was introduced as a means of determining margins in the majority of sectors of the Victorian dairy industry. Under benchmarking, cost questionnaires are distributed to all licence holders in the various industry sectors in May and November each year. The Authority reviews the cost questionnaires submitted by the industry and audits the industry participants to verify costs, to assess the operations of organisations and to discuss the accounting treatment of items reported. From this process an average unit cost of production is estimated for firms in the different sectors of the industry - farms, factories, milk transporters, processors, distributors (except retail).
The second step is to identify ‘benchmark' firms in a sector. Generally, three or four firms are chosen by the Authority to represent benchmark producers. The criteria for selection includes a consideration of a firms throughput, the activities undertaken by the firm within a sector and the reliability of the firms financial results. The average unit costs of production for these firms are then estimated to derive a benchmark unit cost of production. In general, the benchmark firms are the larger firms with lower unit costs than the sector average unit cost. Except for the farm sector, the margin is calculated as 75 per cent of the average unit cost of production for all firms and 25 per cent of the average unit cost for the benchmark firms. Under benchmarking, a margin is derived for each sector based on the cost of producing one litre of milk. These margins are then translated to a full price range of market milk products and sizes.
Benchmarking is not used to determine margins in the retail sector. The Authority assesses the retail margin by reference to a `basket' of items at the retail level for both milk bar and supermarket outlets, together with submissions from the Retail Confectionery and Mixed Business Association.
Market milk supply arrangements
Adequate supplies of market milk are facilitated by regulated prices for market milk. Should the price premium not be sufficient to attract the necessary supplies, the Authority has the power to vest all milk produced in Victoria.
The Authority determines the price to be paid to dairy farmers for market milk using benchmarking. However, benchmark farms only receive a weighting of 12.5 per cent compared to 25 per cent for benchmark firms in other sectors.
188 AUSTRALIAN DAIRY INDUSTRY
The provision of a lower weighting to bench mark farms has the effect of increasing the price to be received by dairy farmers and reducing the pressure to reduce costs compared to processors.
A winter milk incentive is paid by the Authority to dairy farmers who supply the market milk sector from April to July. The incentive ranges from 6 cents per litre to 12 cents per litre depending on the Authority's estimate of the incentive required to bring forth the supply needed in each month. Funds to finance the incentive are obtained by withholding some of the payments due to farmers during spring and summer.
In Victoria, it is deemed that every dairy farmer supplying milk to a factory (the initial receival depot of milk from farms) contributes the same proportion of their milk to the higher priced market milk sector. The share of each farmer's milk which is deemed to market milk is equal to the proportion of total milk supplies used for market milk at a particular point in time. This is known as ‘equitable sourcing'. As at 1 March 1991, the farm gate price of market milk was 38.31 cents per litre compared to an average of around 20 cents per litre for milk sold for manufacturing purposes.
Payment to farmers
The price farmers receive for market milk sales is divided into two returns. The first payment made to farmers for their market milk return coincides with the payment of the manufacturers return for market milk supplied. In the case of market milk, farmers are paid a base price payment for the milk taken by the Authority from all dairy companies throughout Victoria. The payment is made on the 15th of the month after the month in which the milk was supplied to the Authority, with the dairy companies acting as agents for the Authority. This price is set by the Authority as close as possible to the final manufacture milk price paid by the highest paying dairy company.
The second payment made to dairy farmers occurs on the 15th of the second month after the month in which milk was supplied to the Authority. This payment is the balance due to farmers from the sale of market milk by the Authority to processors.
Farm to factory cartage
Farm cartage involves the collection of whole milk from individual farms and its delivery to treatment factories. The milk tankers which are used for this task are operated by, or under contract to, dairy factories throughout the State. Dairy companies are reimbursed by the Authority for the farm to factory cartage of Authority milk. The margin is estimated as a fixed cost for every litre of milk delivered to the factory.
Factory costs
All milk to be accepted by the Authority for sale as market milk must be delivered to a licensed factory. The factory handling margin covers the cost of testing, collection and standardising milk

APPENDIX C: DETAILS OF STATE MARKETING
189
prior to being transported to a processing plant. The factory is responsible for quality testing of milk received. Benchmarking is used by the Authority to determine the margin paid to the factories.
Under section 38 of the Dairy Industry Act 1984 (Vic) all milk that is to be processed as market milk within Victoria must be purchased through the Authority. To enable this regulation to be meet, the Authority purchases all market milk from licensed factories. The price the factory receives for this milk is determined by the addition of the farm to factory cartage margin and the factory handling margin.
Factory to processor cartage
The Authority is responsible for arranging the transport of market milk from the factory to the processor. Historically, the Authority has employed 5 major companies to undertake this function. The Authority pays the companies a fixed rate per litre of milk delivered.
Processors must purchase all market milk supplies from the Authority. The price they pay is determined by the Authority and is the sum of the farm gate price, farm to factory cartage margin, factory handling margin, factory to processor cartage margin and the Authority administration margin.
Processing costs
The processing margin covers the costs of homogenisation, pasteurisation and packaging of milk prior to distribution to wholesalers. As with most other sectors, the processing margin is determined by benchmarking. The price increases of four benchmark firms are calculated for the period since the previous determination and are given a 25 per cent weighting. The benchmark companies comprise two city and two country processors that package about 30 per cent of the State's market milk output. The processor margin is the amount that processors can build into the price of processed market milk before it is sold to distributors.
Processors can distribute market milk directly to retail outlets. About 50 per cent of market milk is sold by supermarkets and the majority of this milk is sourced directly from processors.
Distribution sector
The distribution margin is made up of two components. The distributors coolroom margin covers the cost to distributors of storing milk prior to its distribution to retail outlets, and the distributors margin covers the cost of delivering milk to retail outlets. Four distributors are used as benchmark companies, which includes two metropolitan and two provincial city distributors.

190 AUSTRALIAN DAIRY INDUSTRY
Since July 1986 there have been 7 distribution zones. Prior to then there were 661 delivery zones in 24 milk districts. To be able to supply milk to retailers and home vendors within these zones, a distributor must be licensed and located in that zone. Beside quality restrictions there are no barriers to a distributor establishing operations within a zone. The price that distributors can charge retailers for market milk is calculated by the addition of the price processors pay for milk, the processor margin and the distributor margin.
Retail costs
To determine the margin to cover retail costs, the Authority surveys retail margins for other consumer products with similar characteristics to milk, such as bread, eggs and butter. The Authority also surveys retail margins for market milk in the other States. The retail margin is ultimately based on the Authority's judgement and in practice the historical percentage share of the retail price tends to be fairly stable. The price charged by retailers must be within the minimum/maximum price range designated by the Authority.
In Victoria, approximately 2 per cent of market milk is home delivered. The individual vendors determine the fee that they charge for this service.
Quality control
Quality assurance for all market milk and dairy products is carried out by the Authority with costs covered by the market milk system. The Authority assumed responsibility for the quality assurance of all Victorian dairy products from the (then) Victorian Department of Agriculture and Rural Affairs at the beginning of 1989.
C.3 Queensland
Queensland dairy farms produced 629 million litres of milk in 1989-90 (10 per cent of Australian production). Milk is shared evenly between market milk and manufactured dairy products. There are three distinct production zones within Queensland: the South East, Central and Northern. Each zone has a different set of arrangements for milk production, however, similar arrangements apply to the processing, transporting, wholesaling and retailing of market milk. These arrangements are the responsibility of the Queensland Dairy Industry Authority.
In December 1990, the Queensland Government announced a review of the Queensland dairy industry. The terms of reference for the review required an examination of arrangements that apply to prices, processors, distributors, franchises, vendors, licensees and producer entitlements. The Queensland Dairy Industry Review Committee completed the review in June 1991. As at 20 September 1991, the Committee's report had not been made public.

APPENDIX C: DETAILS OF STATE MARKETING
191
The Queensland Dairy Industry Authority
The Authority was established under the Queensland Dairy Industry Act 1989. In 1989-90 the Authority collected $4.1 million in revenue (predominantly licence fees) and outlayed $3.6 million. There are thirteen members on the Board of the Authority, with each sector of the market milk industry being represented to differing degrees. At the end of 1989-90 the Authority employed 23 permanent staff members. The Authority is accountable to the Queensland Minster for Primary Industries. The functions of the Authority are:
• to do all things and take all steps to ensure an adequate supply of high quality dairy products throughout the State;
• to secure compliance with quality assurance provisions of the Dairy Industry Act (including quality assurance of all dairy products);
• to regulate the collection, manufacture, carriage, supply, storage, distribution and sale of dairy produce;
• to promote the use of dairy products;
• to conduct and support research and education programs;
• to regulate access of processors to markets for market milk; and
• to ensure proper administration of milk producing entitlements.
Farm production and farm gate prices
South East zone
The South East zone accounts for 76 per cent of milk produced within the State. A system of supply quotas (entitlements) ensures adequate market milk supplies throughout the year. Quota holders supply market milk to designated processors in quantities determined by their quota entitlements.
The original distribution of quota was based on historical production performance. Quotas are now fully transferable and their transfer values reflect the higher price received for market milk and the costs of production throughout the year. Additional quota to account for market growth is allocated by the Authority in equal amounts to each quota holder irrespective of the size of their current quota entitlement.
The Authority fixes the price to be paid for market milk produced within quota. Prices are determined at Ministerial level with regard to costs and conditions in other markets.

192 AUSTRALIAN DAIRY INDUSTRY
The price paid for manufacture milk is determined through normal commercial negotiations between farmers and manufacturers.
Central zone
The Central zone accounts for 9 per cent of milk produced within the State. Milk production in the central zone is based on a system of quotas developed through negotiation between processing factories and the dairy farmers' co-operative. As of 1 January 1992 they will be fully transferable. Farmers are paid a farm gate price for market milk that is higher than for manufacturing milk. Manufacturing milk prices are determined by market forces.
Northern zone
The Northern zone accounts for 15 per cent of milk produced within the State. There are no supply entitlements in the Northern zone. Farmers supply all their milk to a single processor. Farmers are paid a pooled price that reflects the weighted average price of manufacturing and market milk.
Processor franchises
There are seven processing franchises defined by geographic and historical factors. A franchised processor has monopoly rights to the market milk market within a designated area. The system was developed to ensure milk supplies in World War II, and has remained in place ever since with very few instances of franchise transfers.
Processor, wholesale and home vendor margins
Margins for all sectors of the market milk industry are set by the Authority, which is required to have regard to the costs of farm production, the cost of processing and vending, and the effect upon consumption of any variation in price. Margins are determined by setting minimum and/or maximum prices to be paid at various stages in the supply chain. Prices and margins are higher in the Central and Northern zones, however, the relative shares of the retail price are similar for all sectors across each zone. Prices and margins for the South East zone are set out in Table C.3.
Retail prices for market milk
Retail prices for a range of dairy products are set by the Queensland Dairy Industry Authority with the approval of the Minister for Primary Industries. Retail prices for a litre of plain milk in the Central and Northern zones are two cents and three cents higher than in the South Eastern zone respectively.

APPENDIX C: DETAILS OF STATE MARKETING
193
Quality control and the Queensland Dairy Industry Authority
The Authority administers the quality provisions contained in the Dairy Industry Act 1989 (Qld) which relate to products, premises, vehicles and equipment. Much of the actual inspection and analysis activity is performed by either independent inspectors appointed by the Authority or officers of the Department of Primary Industries (Qld).
The Department of Primary Industries (Qld) provides quality assurance services to the Authority which include:
• microbiological and chemical analysis of dairy produce;
• pesticide monitoring;
• a comparative inter-laboratory testing program;
• standards for calibrating of equipment for payment purposes;
• inspections of dairy produce laboratories; and
• processing and reporting of dairy factory test results.
Anyone who pasteurises or grades milk at a dairy, depot or factory, or tests milk at a laboratory, must obtain a permit or certificate of competency from the Authority.
C.4 Western Australia
Milk production in Western Australia totalled 266.8 million litres during 1990; this represented approximately 4 per cent of all milk produced in Australia. In Western Australia, 56 per cent of milk is consumed as market milk with the remaining milk being used for manufacturing purposes.
From 1 January 1990, the only products defined as market milk were those white packaged milks sold for human consumption in the State. This includes milk for sale as whole milk, non-fat (skim milk), low-fat milk and milk used for shipping purposes (milk supplied to ships docked in WA ports). Since 1 January 1990, the manufacturing sector has included the special market milk products (flavoured milk, yogurt and cream) that were previously sourced from special product quota holders.
The Western Australia Dairy Industry Act 1973-83 provides the power to regulate supply and to control the sale of milk and dairy produce. These powers are administered by the Dairy Industry Authority of Western Australia. In addition, the Western Australia Health Act 1911 (as amended) establishes minimum requirements regarding product standards, description and packaging to protect the interests of consumers. These requirements are administered by the Public Health Department in conjunction with the Authority.
194 AUSTRALIAN DAIRY INDUSTRY
Dairy Industry Authority of Western Australia
The Dairy Industry Authority of Western Australia was established under the Dairy Industry Act 1973-83 (WA). Before 1 January 1990, the Authority was responsible for determining prices and margins for all sectors of the fresh milk market in the major population areas of the State. Since then, the roles and functions of the Authority have been reduced. It is now only responsible for determining the farm gate price for market milk, and the transport margin from the farm gate until the milk enters the factory/processor gate. Similar changes were previously implemented in the country regions under the Authority's control in April 1988.
During the period 1 January 1990 to 1 July 1991, the Authority was officially responsible for recommended margins for the processing, vending and retail sectors. However, on 5 November 1990, the Authority allowed its role in recommending margins and retail prices to lapse. Since then, the two major processors, Peters WA and Masters Dairy, have published recommended margins and retail prices.
In the exercise of its powers and performance of its functions, the Authority is subject to the control of the State Minister for Agriculture.
Western Australia is divided into three separate zones by the Authority.
1. Dairy area
This area covers the south west corner of the state in which most dairy farming occurs.
2. Area under Authority price control
This area contains in excess of 80 per cent of Western Australia's population.
3. The rest of the state
This area covers the northern half of the state and is not controlled by the Authority. The relatively few people who live in the area receive their milk supplies directly from milk processors.
Pricing and supply arrangements
Mechanism for setting prices
The Authority established an independent Prices Committee in August 1975 to provide advice to it on the appropriate level of prices and/or margins. The margins that are now determined by the Authority (market milk returns to dairy farmers and the farm to processor transport margins) are based on cost of production calculations.

APPENDIX C: DETAILS OF STATE MARKETING
195
Market milk supply arrangements
A transferable quota system introduced in November 1986 is used to obtain supplies of milk for the market milk sector. The amount of milk required for the State market is determined by the Authority as is the price the farmer is paid for that milk. Prices are determined on a cost-plus basis. Quotas are allocated for a period of twelve months, and farmers are required to supply their specified quota every day of the year.
The total quota issued in any one year is based on the amount of market milk likely to be required to meet the demand for market milk as estimated by the Authority. If the Authority expects a growth in consumer demand, the total quota will be increased and each quota holder will receive a flat increase in quota allocation.
Dairy farmers are licensed by the Authority so that milk supplies can be monitored to ensure that all milk sold is of a quality suitable for human consumption. In the case of a volume shortfall, the quota owner is penalised by a quota stand down, equivalent to the shortfall, for the subsequent twelve months.
Quotas are transferable and are most often sold at a quota auction held by the Authority. Quotas may also be transferred under approved principles of family transfer, or via a walk-in walk-out procedure whereby quota is transferred with the sale of an entire dairy business. The maximum quota that can be held by a farmer is 2300 litres per day.
From July 1989 to March 1990, three quota auctions were held by the Authority. A total 23ÿ163 litres of daily market milk quota were offered for sale, of which 48 per cent was sold at an average price of $244.40 a litre. Auction sales during November 1990 averaged $299 a litre.
For the period July 1986 to 31 July 1990, the Authority paid a 1 cent per litre transitional allowance on quota milk purchases to offset the impact of the national market support levy on quota milk income to dairy farmers.
Payment to farmers
The major processing companies act as Authority agents for the purpose of collecting milk from farms and payment to dairy farmers. Farmers are paid an interim payment (of about 40 per cent of anticipated returns) for quota milk and manufacturing milk on the first day of every month. The final payment for this milk is made on the 15th day of the following month. Farmers receive a combined payment for quota and manufacturing milk produced; itemised details of returns and deductions are provided.
On 1 July 1991 an insurance contract was arranged by the Authority to guarantee payment to dairy farmers. This followed the failure of one processor in 1990 to meet farmer payments when the company was placed in liquidation. The insurance premiums are financed by funds from the Authority and a pro rata levy on farmers and processors.

196 AUSTRALIAN DAIRY INDUSTRY
Farm to processor cartage
In Western Australia, milk is transported from farms to depots and then on to processors. Margins for these transport functions are determined by the Authority and deducted from payments to dairy farmers. The amount deducted is dependent on a number of variables including distances from the market and depot, and volumes of total milk production and quota. Deductions are made on a zonal basis within each of the 12 transport zones.
Processors are responsible for the transport of milk from the farm to the processor. In Western Australia some processors use company owned tankers to transport milk, whereas other processors employ transport companies under contract. The price that processors pay a dairy farmer for quota milk supplied is a gross price less the Authority's estimate of transport costs.
Processing costs
The Authority does not directly regulate the processing sector. However, the price the processor pays for milk is determined by the Authority. Processors must also obtain a licence to operate. Currently there are 23 licences held by processors and manufacturers of dairy products.
Distribution/vending margins
Parties involved in milk distribution are licensed by the Authority under a Milk Distributor/Vending licence. Such licences have conditions that limit the district the licensee may operate in and, in the case of retail distribution, the customers to whom delivery can be made. The Authority also restricts the hours milk can be delivered and the type of vehicle that can be used. Home deliveries account for 18 per cent of fresh milk sold to consumers.
The Authority is currently discussing plans with industry organisations to introduce its District Vendor Rationalisation Program. The program aims to reduce the number of districts that vendors operate in from 226 to 20. It is proposed that in three years the system of districts will be removed and the vending sector will operate in a commercial environment.
To offset the cost of cartage of packaged milk to country areas, a Country Freight Reduction Allowance is collected by the Authority on the sale of metropolitan milk and paid to country milk transporters. As a result of this cross subsidy the recommended price to consumers in country areas was no greater than 8 cents per litre above the recommended retail prices for the metropolitan markets during 1989-90.

APPENDIX C: DETAILS OF STATE MARKETING
197
Retail prices
The major processors publish recommended retail prices, although, retailers are free to charge prices above and below the suggested levels.
Prices for manufacturing milk
Pricing of manufacturing milk is subject to competition between four major manufacturers of dairy products. Prices for manufacturing milk are not regulated by the Authority.
Quality control
The Authority assumed full responsibility for the monitoring of milk and dairy product quality in 1987 from the Western Australian Department of Agriculture. However, farm milk is tested under contract to the Authority by the Department at its laboratories located in Bunbury.
C.5 South Australia
South Australian dairy farms produced 356 million litres of milk in 1989-90 (about 6 per cent of Australian production). About 42 per cent was used for market milk, with the remaining 58 per cent used as manufacturing milk.
The South Australian dairy industry is split into four areas - Metropolitan, South East, Mid-north and Riverland. The Metropolitan Milk Board controls the production and sale of market milk in the Metropolitan area under the Metropolitan Milk Supply Act 1946. This area extends roughly 100 km to the north, east and south of Adelaide, and accounts for about 80 per cent of milk production in South Australia.
The South Australian Department of Agriculture controls dairy activity in the other areas under the South Australian Dairy Industry Act 1928.
C.5.1 Metropolitan Milk Board
The Milk Board was established in 1947 under the Metropolitan Milk Supply Act 1946. The Board has three members and currently employs 13 staff. The Board is funded entirely by the dairy industry. The Metropolitan Milk Supply Act specifies the following functions of the Board:
• to regulate the production, treatment and storage of milk and cream
• to regulate the supply and delivery of milk to vendors and retail purchasers
• to conduct laboratory services

198 AUSTRALIAN DAIRY INDUSTRY
• to control and zone retail delivery vendors
• to fix prices to be paid to milk producers, wholesalers, retail delivery vendors and shops for milk and cream
• to promote milk and cream
The Board collects levies from farmers and processors. As at 30 June 1990 the levies were:
• Producer 0.699 cents per litre of milk
1.650 cents per litre of cream
• Processor 0.529 cents per litre of milk
1.650 cents per litre of cream
In 1989-90 the Board received revenue of $1.5 million and incurred expenditure totalling $1.25 million.
Farm production
Milk production in the metropolitan area of Adelaide is tightly controlled by the industry through the Milk Equalisation Committee. This Committee, which comprises farmers, processors and manufacturers, equalises the returns to farmers from market milk and manufacturing milk. A high farm gate price for market milk is used to bring forward adequate supplies of market milk throughout the year.
The farm gate price for market milk is set by the South Australian Government, which acts upon recommendations from the Board based on a cost of production survey. The current farm gate price for market milk is 41.14 cents per litre. The market milk price applies to white whole milk, white modified milk and white ultra heat treated milk only. Processors do not pay the market milk premium for milk for flavoured milk. The frequency of adjustment to the market milk price is arbitrary - in recent years it has occurred twice a year.
The farm gate price for manufacturing milk is determined annually by the Milk Equalisation Committee. The manufacturing milk price is expressed in cents per kilogram of butter fat and averages around 20 cents per litre.
Payment of farmers
Dairy farmers are paid by both processors and manufacturers at the manufacturing milk price determined by the Milk Equalisation Committee. Processors pay the Committee a premium for market milk, which is then distributed so that all farmers derive equal benefit from the higher price for market milk. For example, if 40 per cent of all milk produced in the Metropolitan area is used
APPENDIX C: DETAILS OF STATE MARKETING
199
for market milk, then all farmers will be paid the higher price for 40 per cent of their milk. For all other milk, dairy farmers receive the manufacturing milk price determined by the Committee.
Processor, wholesaler, retailer and home vendor margins
On the advice of the Board, the South Australian Government determines the prices to be paid for market milk. These prices and margins are shown in Table C.3.
Raw milk is transported from farm to factory by a haulage firm that is owned by the two milk processing companies. The margin for transport is built in to the processor margin.
Retail prices for market milk
Maximum and minimum retail prices are set by the South Australian Government (on the advice of the Board) for white whole milk, 1.5 per cent fat skim milk, and calcium enriched Take Care. Prices for other reduced fat and ultra heat treated white milk and flavoured milk are not set.
Prices are set for 300 ml, 600 ml, 1 litre, and 2 litre cartons and 20 litre bags in crates (see Table C.3). The Board recommends changes to these prices to the Minister for Agriculture based on submissions from the industry and cost investigations by the Board.
Quality control
The testing of farm milk for fat, protein and somatic cell count is carried out by the Milk Board at its Central Testing Laboratory. Farm milk from outside the metropolitan area is also tested by the Board on a fee for service basis. Samples of milk and cream are taken from shops for testing of handling procedures. When retail products fail testing the Board notifies the retail outlet and the local health authorities. The Board also carries out inspections of vending vehicles to enforce standards.
Promotion
Promotion of milk and cream is a function of the Board that is explicit in the Metropolitan Milk Supply Act. Since 1970 this function has been carried out by the Promotion Council which includes the Chairman and Secretary of the Board, and representatives of:
• the South Australia Dairyfarmers' Association;
• the Wholesale Milk Buyers and Distributors' Association;
• the Master Retail Milk Vendors' Association;
• the Australian Dairy Corporation; and
• the advertising agency, Charterhouse.

200 AUSTRALIAN DAIRY INDUSTRY
Funds are raised by a levy on milk producers and processors, and by voluntary contributions from the Master Retail Milk Vendors Association. Promotional activities include media advertising, competitions, milk vendor education, promotions within schools, and through doctors and dentists.
C.5.2 Outside the metropolitan area
Dairy activity outside the metropolitan area, as defined by the Metropolitan Milk Supply Act, is the responsibility of the South Australian Department of Agriculture under the Dairy Industry Act. The role of the Department is restricted to licensing of premises and quality analysis, with no involvement in the equalisation schemes that operate in each area. About 20 per cent of the State's milk is produced in the non-metropolitan areas.
The South East contains 192 farms, and only seven per cent of milk produced in this area is used for market milk. The South East Market Milk Equalisation Committee equalises market milk returns for dairy farmers supplying milk to the dairy companies in the region. The arrangement has no legislative support.
Since 1986, farmers in the South East region have received additional income from funds collected through a licence fee levied on dairy farmers in the metropolitan area. The fee, set in 1986 at 2.2 cents per litre of market milk sales in the metropolitan area, raised more than $2 million, and yielded a transfer of approximately $8000 per dairy farm in the South East region. The current fee is 2.04 cents per litre of market milk sales, and will yield a transfer of more than $9000 per farm in the South East in 1990-91. According to the recent discussion paper on the dairy industry prepared by the South Australian Government Adviser on Deregulation:
This levy is clearly intended to compensate dairy farmers in the South East for their exclusion from the
metropolitan market area. (Government Adviser on Deregulation, South Australia, 1991, p. 13)
In the Mid-north there are 75 farms and in the Riverland’s there are 7 farms. Production in these areas is entirely to supply market milk. For the Mid-north and Riverland the equalisation schemes are supported by the individual dairy companies. The farm gate price for market milk is determined by a collective bargaining process between farmer groups and the regional processors. The farm gate price approximates the regulated farm gate price paid to farmers within the metropolitan area. Milk is purchased from the metropolitan area to cover periods of market milk shortage.
Wholesale and retail prices
The Prices Act enables the Prices Commissioner to declare maximum wholesale and retail prices outside the metropolitan area. The most recent declaration on 6 December 1990 fixed maximum wholesale prices for 81 towns that ranged from between 69.05 cents per litre to 80.85 cents per litre.

APPENDIX C: DETAILS OF STATE MARKETING
201
Maximum retail prices were fixed for 250 towns, and ranged from between 94 cents per litre and 105 cents per litre. Retailers in a small number of designated areas are entitled to exceed the maximum retail price by amounts set out in a schedule to the pricing order (up to seven cents) to cover transport costs.
Prices to be paid to processors are not set, but wholesale prices effectively act as a processor price if retailers purchase directly from processing factories.
C.6 Tasmania
The market milk sector accounts for an average of 14 per cent of the total Tasmanian milk output; 345 million litres were produced in 1989-90. The Tasmanian dairy industry produces about 6 per cent of Australia's total milk output. The production of milk varies significantly throughout the year as seasonal conditions change. In the winter months, market milk requirements account for over 40 per cent of total milk output compared with less than 10 per cent in spring.
Market milk is defined as all milk and cream in fresh form that is sold for human consumption. The specific products classified as market milk include fresh cream, fresh plain milk, flavoured milk, reduced fat milk, skim milk and modified milk.
A pooling scheme currently operates in Tasmania that enables all dairy farmers to share in the returns from the higher priced fresh milk market. The pooling arrangements replaced a quota scheme which was phased out from between 1978 and 1985.
The Tasmanian dairy industry is regulated by the Tasmanian Dairy Industry Act 1976.
Tasmanian Dairy Industry Authority
The Tasmanian Dairy Industry Authority is established under the Dairy Industry Act 1976 (Tas). The Authority controls the supply of market milk through the determination of prices and margins in the market milk system. All margins that the Authority calculates must be approved by the Tasmanian Minister for Primary Industry. The Authority has no role in determining prices for manufactured dairy products.
On 1 January 1989, the Authority became responsible for the Herd Improvement Act 1977 and the functions carried out by the Tasmanian Herd Improvement Organisation. The herd testing services provided by the Authority are funded by users fees.
A review of the Tasmanian fresh milk marketing system was announced in July 1991. The review is to include an assessment of the effects of removing industry regulations beyond the farm-gate. In addition, the review is to advise on the implications of issuing additional milk processing licences. The final report of the review is expected by the end of September 1991.

202 AUSTRALIAN DAIRY INDUSTRY
Pricing and supply arrangements
Payment to farmers and market milk supply arrangements
Dairy farmers sell all milk produced to dairy companies which may be either milk processors or manufacturers. The companies pay farmers their manufacturing price for that milk. This price is known as the `base rate of payment' to dairy farmers.
In addition all dairy farmers receive a further payment direct from the Authority for the proportion of their milk sold into the higher priced market milk sector. The Authority pays farmers directly on a pro rata basis a premium from a pool of funds. The additional payment by the Authority is financed from the sale of market milk to processors. The price for market milk is based on cost of production calculations carried out by the Authority.
The Authority operates a winter premium scheme to encourage milk supply during May, June, July and August. Under this scheme, the Authority pays a sum of money (incentive) to four dairy companies (UMT, Lactos, Betta and Tasmaid) who use the funds to pay farmers a higher price to ensure that market milk needs are satisfied. The milk incentive payments are financed by funds withheld from farmers during spring and summer.
The Authority also operates a winter allocation scheme. Under this scheme a small group of southern farmers supply a specified amount of milk per day to a processor.
Farm to processor cartage
The cartage of raw milk from the farm to the processor is the responsibility of the processor. The two processors in Tasmania (Tasmaid and Betta milk) use a combination of company-owned tankers and private contractors to transport milk.
The Authority pays the processing companies for the transport of market milk only. The Authority estimates the cost of transport per litre of milk and pays the allowance to the processor on purchases of market milk. The Authority purchases the expected market milk requirements from the dairy companies at the manufacturing price for milk plus the cartage margin. The Authority then sells this raw milk to the processors at the gazetted price for market milk. The difference between the purchase price of raw milk by the Authority from the dairy companies, and the selling price to processors, constitutes the Authority's pool of funds out of which a higher price is paid to dairy farmers for market milk and the winter milk incentive.
At 30 June 1990, the gazetted price paid by processors for market milk was 45.46 cents per litre. At this time the average manufacturing price which dairy companies paid dairy farmers was 23.16 cents per litre.

APPENDIX C: DETAILS OF STATE MARKETING
203
Processing sector
Processors purchase milk from farmers to supply the fresh milk market. If milk purchases are below fresh milk requirements, the Authority will purchase milk from manufacturers and transfer this milk to the processors. In 1989-90, 26 per cent of the market milk requirement was transferred in this way from manufacturers.
When obtained by the processors, raw milk is processed and packaged into the range of fresh milk products. From this stage the Authority has responsibility for determining only the margins for plain white milk. Other fresh products such as table cream, fat reduced milk and flavoured milk, are processed, distributed and sold in a non-regulated market.
The Authority is responsible for estimating a processor handling margin for plain white milk. The maximum price that processors can charge vendors is the gazetted price for milk plus the processor handling margin. The Authority bases the calculation of the processor, vendor and shop margins on historical costs and relativities.
Distribution sector
Distribution of milk from the processor to the final consumer is by one of three methods. The first method is by processor owned and operated vehicles. This form of vertical integration enables the processor to control the processor and vendor margins for plain white milk.
The second method is by private vendors delivering milk to retail outlets. The vendors must deliver a minimum of 16 litres of milk to a retailer per delivery if the retailer is to obtain plain milk supplies.
The third way is vendor deliveries to homes. Approximately 25 per cent of Tasmanian market milk sales occur through licensed home vendors. Home vendors receive the vendor and shop margins for the service they provide. Home vendors are permitted to charge up to 3 cents per litre above the Authority determined margin for home delivery.
Since January 1988, vendors have been able to obtain supplies of milk from either of the two main processors. Before this time vendors were directed by the Authority, as part of their licence condition, to purchase their milk from specific processors. Sub-zones have now been established comprising approximately ten vendors in each zone. All household deliveries and shop supply within these zones are open to competition.
Retail sector
The maximum price a distributor can charge a retailer for plain milk, and the maximum price the retailer can charge consumers, are set by the Authority. In certain country areas, vendors and retailers may include an additional amount of up to 5 cents per litre to cover the cost of country freight.

204 AUSTRALIAN DAIRY INDUSTRY
Quality assurance
The Authority co-ordinates quality assurance for market milk. It works closely with processing companies, manufacturers and the Department of Primary Industry.
C.7 Australian Capital Territory
Over 30 million litres of fresh milk are consumed in the Territory each year. This amount represents around 1.5 per cent of Australia's total fresh milk consumption. Except for a relatively small quantity of cream, most manufactured dairy products are imported into the Territory. The market milk sector includes fresh milk for sale as whole milk, low fat milk and flavoured milk; over 96 per cent of supplies for this sector are sourced from interstate.
Prior to 1976, the responsibility for regulating the dairy industry in the ACT resided with the Commonwealth Department of Capital Territory. After 1976 the Milk Authority of the Australian Capital Territory was established, but remained under the ordinance of the Commonwealth Government. The Authority became autonomous in 1981, with legislative responsibility being transferred to the newly formed ACT Government on 11 May 1989.
The Milk Authority of the Australian Capital Territory
The Milk Authority of the Australian Capital Territory is responsible for servicing the ACT fresh milk market. The responsible Minister for the Authority is the Chief Minister and the enabling legislation is the Australian Capital Territory Milk Authority Act 1971.
The Authority regulates the returns to all participants in the ACT fresh milk market. The Authority's functions include arranging contracts for the supply of raw milk for processing, the determination and payment of margins to all sectors of the industry and the promotion of milk. Margins are paid by the Authority to participants in the processing, distribution and retailing sectors. Manufactured dairy products are not regulated by the Authority.
The Authority's administration and promotion costs are financed from a margin imposed on the sale of market milk. The Authority employs five staff and is directed by four Authority members.
Pricing and supply arrangements
Mechanisms for setting prices
The Authority determines prices and margins for the processing, distribution, retail and vendor sectors of the fresh milk market on a full cost of production basis. Margins are reviewed annually by the Authority, with changes implemented on 1 July of each year. Submissions from the various sectors, containing cost of production information, are assessed by the Authority and used as a basis for margin determination.

APPENDIX C: DETAILS OF STATE MARKETING
205
Market milk supply arrangements
There is one dairy farm in the Territory, Goldenholm Dairy Pty Ltd, which supplies around 3 per cent of market milk requirements. All other requirements are obtained from suppliers in New South Wales and Victoria. An open tender system operates whereby suppliers are contracted to supply a fixed percentage of market milk throughout the year at a predetermined price. The administrative and transport costs of the supplier are incorporated in the price. New contracts for the supply of raw milk for a period of two years were let with effect from 1 July 1991 and are shown in Table C.1. The weighted average supplier price at 1 July 1991 was 36.65 cents per litre.
Table C.1: Australian Capital Territory fresh milk supplier details, at 30 June 1990
Supplier Market share Supply price
(per cent) (cents per litre)
Murray Goulburn Co operative Co Ltd (Vic) 42 35.90
Bega Co-operative Society Limited (NSW) 35 38.50
Haberfields (NSW) 20 34.50
Goldenholm Dairy Pty Ltd (ACT) 3 39.75
The milk supplied by Bega Cooperative is milk that would otherwise be used as manufacturing milk. Murray Goulburn supplies raw milk that would normally receive the lower manufacturing price for milk in Victoria.
In 1989-90 the cost of transporting milk from Murray Goulburn's Kiewa factory to the Australian Co-operative Foods Ltd factory in Canberra was estimated at around 6 cents per litre. When handling and farm to depot cartage costs are included, the return to Murray Goulburn suppliers approximated the Victorian manufacturing milk price. The cost of transporting milk from Bega to the Australian Capital Territory is estimated at 3 cents per litre, with handling and cartage expenses adding a further 3.6 cent per litre to the overall cost. In 1989-90 suppliers to the Bega Cooperative received a net return of approximately 29 cents per litre for raw milk sold to the ACT market. This milk would normally have been sold for manufacturing purposes in NSW at a price close to 23 cents per litre. Goldenholm Dairy, located at Pialligo, owns a milk tanker which it uses to transport milk to the processor.

206 AUSTRALIAN DAIRY INDUSTRY
Processing sector
Australian Co-operative Foods Limited processes milk, under a 10 year contract with the Authority, for the entire ACT fresh milk market. Since December 1989 the processor has been paid a margin by the Authority for all market milk produced.
Distribution/vending margins
The distribution of milk is conducted under two licence groups. Home vendors constitute one group. At 30 June 1990 there were 76 licensed home delivery vendors, supplying 10.9 million litres of market milk (36 per cent of market). These vendors are paid a margin by the Authority for every litre of milk delivered to households in restricted zones. Licences guarantee each vendor exclusive access to a zone. Licences are allocated at the Authority's discretion, at no cost to vendors.
The second group are the wholesale distributors. The Authority has issued a single licence, to the Bega Cooperative Society Ltd, to distribute milk to retail outlets. The licensee then contracts drivers to distribute milk under that licence.
Retail prices
There are approximately 550 retailers licensed by the Authority to sell milk in the Territory. The Authority determines the price for all market milk and pays the retailer a margin for selling this milk.
Consumers of home delivered milk in the Territory pay the same price for a litre of milk as retail consumers. The home vendor margin of 29.14 cents per litre is greater than the wholesale/distributor to shop reseller margin of 25.64 cents per litre. The result is a cross subsidisation of home vendors by the retail outlets.
Quality control
The supervision of market milk and manufactured dairy product quality is the responsibility of the ACT Board of Health. Random samples and inspections are made throughout the Territory of vendors, retailers and the processor. The financial cost of supervising health standards is incurred by the Board of Health at no direct cost to milk consumers.
C.8 Northern Territory
Approximately 16 million litres of market milk are consumed in the Northern Territory each year. This represented about 1 per cent of Australia's fresh milk consumption in 1989-90. Apart from food standards and safety legislation, administered by the Northern Territory Department of Health

APPENDIX C: DETAILS OF STATE MARKETING
207
and Community Services, no other government regulations control milk production or consumption within the Territory.
The dairy industry in the Territory consists of two dairy farms which produce about 25 per cent of the Territory's market milk requirements. The remaining 75 per cent of market milk is supplied by interstate companies. Queensland processors supply most of the market with a variety of fresh, reconstituted and ultra heat treated milks. South Australian milk tends to be supplied only to centres as far north as Alice Springs.
In contrast to the other States, the Territory does not have a statutory authority responsible for ensuring a regular fresh milk supply. The Northern Territory Government said:
The deregulated NT dairy industry effectively means that milk producers and distributors in the States are free to
supply any area of the Territory with market milk with market forces being largely responsible for price
determination. The absence of government regulations appears not to have any adverse effects on maintaining a
satisfactory year-round supply of milk. Variations in price between locations are correlated with freight costs.
(Submission 29, p. 2)
All manufactured dairy products consumed in the Northern Territory are supplied by interstate manufacturers; no specific regulations apply to this activity.

208 AUSTRALIAN DAIRY INDUSTRY
Table C.2: Characteristics of State dairy industry regulations, 1989-90 NSW VIC QLD WA SA TAS ACT
Supply regulations
Milk Production (million litres) 878 3787 629 267 356 345 1
Market milk : manufacturing milk (per cent) 66:34 12:88 50:50 56:44 42:58 14:86 100:0
Fixed farm gate price for market milk Yes Yes Yes Yes Yes Yes Yes
Supply quotas Yes Yes Yes
Transferability Yes Yes Yes
Annual limits to quantities of quota that can be transferred
Yes Yes
Equitable sourcing Yes Yes Yes
Open tender sourcing Yes
State Dairy Industry Authorities
Expenditure ($m) Administration ($m) Promotion ($m) Quality programc ($m)
16.5 13.3 4.0b
3.1
23.9a 7.6 7.0
d
3.6 2.3 1.4
d
4.2 1.5 0.5 0.1
1.4 0.5 0.5 0.2
0.9 0.7 0.1
d
1.3 0.5 0.5
0
Authority allocation (cents per litre) 3.95 1.62 0.89 2.54 0.53 1.85 3.74
Staff numbers 180 119 23 19 13 16e 5
Authority members 1 11 13 7 3 5 4
a Includes expenditure of $6.1 million to purchase packed UHT milk and $1.9 million in interest distributed to dairy farmers.
b Allocation to Milk Marketing Pty Ltd.
c Refer to the text for information on the quality assurance programs of each State dairy industry authority.
d Cost of quality program included in administration expenditure.
e Includes 5 staff with responsibility for a herd management program.

APPENDIX C: DETAILS OF STATE MARKETING
209
Table C.3: Prices and margins for one litre of plain fresh milka NSW VIC QLDb WA SAc TAS ACT
Prices
Gross producer priced 40.12 38.31 44.82 42.84 41.14 40.33 36.25 Price to processor 48.98 46.29 48.16 49.76 46.01 47.02 39.99 Price to wholesale minimum 73.97 64.04 -
vendor maximum 73.97 65.73 74.99 - 69.05 72.20 63.09e Price to shop minimum 81.75 76.69 - 83.50 77.17 maximum 84.75 78.71 86.24 - 76.72 85.50 77.17 Retail price minimum 93.00 87.00 93.00 - 82.00 90.00 maximum 96.00 91.00 97.00 94.00f 94.00 97.00 90.00 Home delivery minimum 96.00 - 93.00 - 82.00 97.00 90.00
price maximum 106.00 - 97.00 - 94.00 100.00 90.00
Margins
Freight to processor 3.06 3.97 2.45 4.43 2.30 3.15 - Factory testing and handling 1.85 1.58 - 2.38 - 1.69 - Milk authority 3.95 2.43 0.89 2.54 0.53 1.85 3.74 South East Levy - - - - 2.04 - - Country freight - - - - - 0.93 - Processor margin minimum 24.99 17.75 - maximum 24.99 19.44 26.83 - 23.04 24.25 23.10g Wholesale vendor minimum 7.78 12.65 - 11.30 12.81
margin maximum 10.78 12.98 11.25 - 7.67 13.30 12.81 Shop margin minimum 11.25 10.31 6.76 - 5.28 12.83 maximum 11.25 12.29 10.76 - 17.28 11.50 12.83 Home vendor minimum 22.03 - -
margin maximum 32.03 h 22.01 - 24.95 24.80 29.14
a As at 5 August 1990 in Western Australia; 1 November 1990 in Victoria, South Australia, Tasmania, South East Queensland and the Australian Capital Territory; as at 11 January 1991 in New South Wales.
b South east distribution zone only.
c Metropolitan milk distribution zone only.
d Refer to appendix text for details of the price received by dairy farmers for fresh milk.
e Weighted average for wholesale (retail outlets) and home vendors
f As from 5 November 1990 the Western Australian Dairy Industry Authority ceased to have a role in setting recommended retail prices. However, the major WA processors continued to publish recommended retail price information.
g Weighted average margin paid to processors for sales made to retail vendors and home vendors.
h Return to vendor is determined by market forces.

APPENDIX D: REQUEST FOR AND ADVICE FROM THE
211
APPENDIX D: REQUEST FOR AND ADVICE FROM THE ATTORNEY-GENERAL'S DEPARTMENT
7 March 1991 Secretary Department of the Attorney-General Robert Garran Offices National Circuit Barton, ACT, 2600
Attention: Mr P. J. Clay
Dairy Marketing Legislation
The Industry Commission is currently undertaking an inquiry into the Australian dairy industry (details enclosed) and is writing to seek your advice in respect to section 38 of the Victorian Dairy Industry Act 1984 and section 6 of the Commonwealth's Dairy Produce Levy Act (No.1) 1986. Section 38 of the Victorian Act is designed to restrict interstate trade in market (fresh) milk at prices less than the Victorian administered price for such milk, and section 6 has the effect of limiting interstate trade in market milk.
By way of background, there is substantial involvement of both the State and Commonwealth governments in the marketing arrangements for the dairy industry. An effect of these arrangements is that the price of fresh milk sold for human consumption (market milk) is much higher than for manufacturing milk. At present the market milk price in Victoria is 38 cents per litre compared with around 20 cents per litre for manufacturing milk. The respective prices in New South Wales are about 41 and 20 cents per litre.
The higher price for market milk is maintained through state regulations by which the price of market milk is administratively determined. It is also maintained by limiting the extent of interstate trade in market milk where, for example, manufacturing milk from Victoria could be exported and sold at the higher market milk price in Sydney.

212 AUSTRALIAN DAIRY INDUSTRY
Some Victorian companies have exported to the Sydney market in order to obtain a higher price for milk which would otherwise be sold at the lower manufacturing price. The attempts of the companies to rely on section 92 of the Constitution have largely been unsuccessful. These are detailed in the attached internal information paper entitled "Dairy Marketing Arrangements and the Scope and Effect of Section 92 of the Constitution".
The Commonwealth's Dairy Produce Levy Act (No.1) 1986 imposes a market support levy on the milk fat content of all milk produced. Funds from this levy are used to make market support payments on the exports of dairy products. Section 6 of the Act (known as the comfort clause) allows any State to suspend the market support levy at a time of significant disruption or change in its market milk sector.
New South Wales has invoked section 6 twice when Victorian companies were exporting milk to Sydney and those exports were seen as a threat to its market milk sector. As Victoria is a major beneficiary of the market support payments, agreements were reached with New South Wales to limit the amount of Victorian milk entering the Sydney market and, in the event, the all milk levy was not suspended.
To help "stabilise" the situation, the Victorian Government amended its Dairy Industry Act 1984 by introducing section 38. (1) which states that:
A person who sells or distributes market milk in a milk district or manufactures market milk in a case where the milk used in the manufacture of that milk has not previously been accepted by the Authority under section 37 shall be guilty of an offence against this Act.
An effect of this amendment is that milk processed in Victoria for market milk purposes must be purchased at the prevailing prices for market milk as determined by the Victorian Dairy Industry Authority, irrespective of destination of final sale. The amendment has effectively stopped interstate trade in processed market milk. Its introduction has removed the need so far for New South Wales to invoke again section 6 of the Dairy Produce Levy (No.1) Act 1986.
It is understood, however, that section 38 does not apply to raw milk exported interstate for subsequent processing to be sold as market milk. This is the case in respect to milk sourced from Victoria by the ACT Milk Authority at prices around 5 cents per litre above the manufacturing price. Further details about the milk marketing arrangements in New South Wales and Victoria and section 38 of the Victorian Act are contained in the attached Final Report of the New South Wales - Victorian Milk Committee.
The dairy industries of the other States are asking their governments to introduce similar provisions to section 38 of the Victorian Act. An effect of such provisions would be to greatly restrict any interstate trade in market milk and to maintain the State pricing arrangements for such milk.

APPENDIX D: REQUEST FOR AND ADVICE FROM THE
213
The Commission is seeking your advice concerning the constitutional validity of section 38 type legislation by itself or in conjunction with section 6 of the Dairy Produce Levy (No. 1) Act 1986. A subsidiary question is how the purpose of section 6 relates to section 92 of the Constitution. Having regard to the time constraints on the Commission's reporting functions, your advice by 15 April 1991 would be appreciated.
If you should want further information about this request, please do not hesitate to contact me on 264 3304. A copy of this letter has been sent to Mr Ron Messer, Manager Dairy, Department of Primary Industries and Energy.
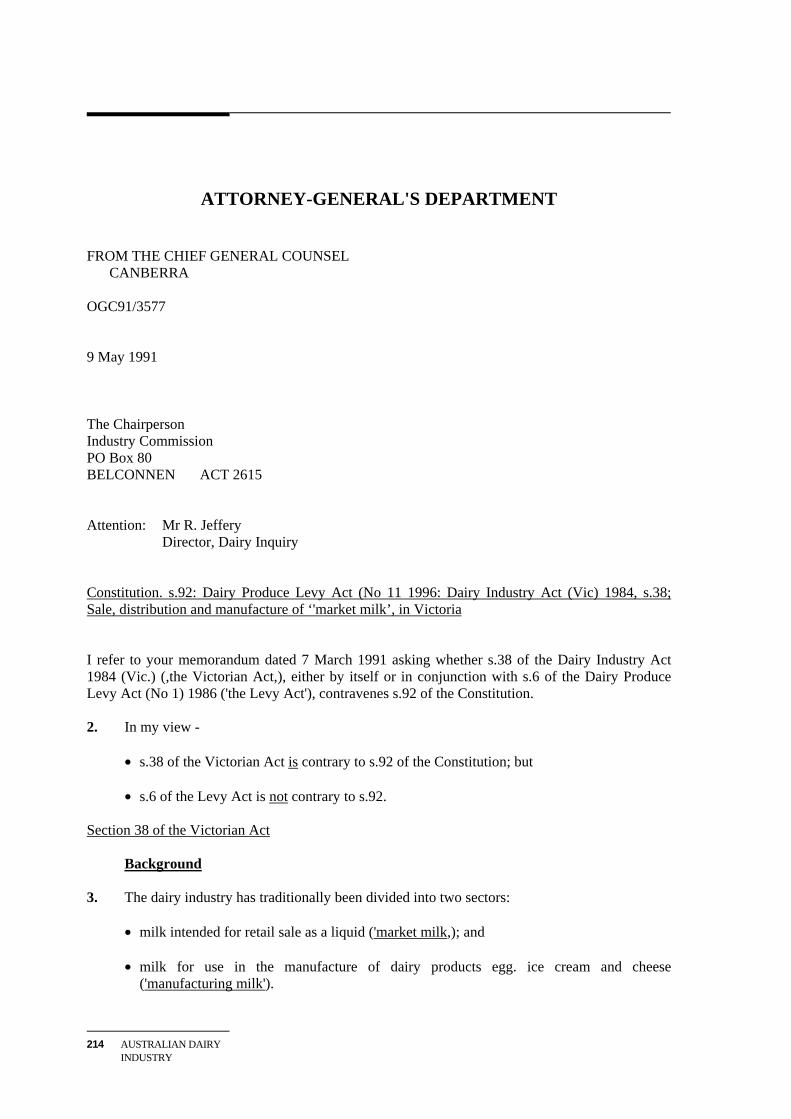
214 AUSTRALIAN DAIRY INDUSTRY
ATTORNEY-GENERAL'S DEPARTMENT
FROM THE CHIEF GENERAL COUNSEL CANBERRA OGC91/3577 9 May 1991 The Chairperson Industry Commission PO Box 80 BELCONNEN ACT 2615 Attention: Mr R. Jeffery Director, Dairy Inquiry Constitution. s.92: Dairy Produce Levy Act (No 11 1996: Dairy Industry Act (Vic) 1984, s.38; Sale, distribution and manufacture of ‘'market milk’, in Victoria I refer to your memorandum dated 7 March 1991 asking whether s.38 of the Dairy Industry Act 1984 (Vic.) (,the Victorian Act,), either by itself or in conjunction with s.6 of the Dairy Produce Levy Act (No 1) 1986 ('the Levy Act'), contravenes s.92 of the Constitution. 2. In my view -
• s.38 of the Victorian Act is contrary to s.92 of the Constitution; but
• s.6 of the Levy Act is not contrary to s.92. Section 38 of the Victorian Act Background 3. The dairy industry has traditionally been divided into two sectors:
• milk intended for retail sale as a liquid ('market milk,); and • milk for use in the manufacture of dairy products egg. ice cream and cheese ('manufacturing milk').

APPENDIX D: REQUEST FOR AND ADVICE FROM THE
215
4. Historically, each State has sought to maintain a self-sufficient market milk sector in
isolation, free from out-of-State influences. Current State schemes regulating market milk originated at a time when production and transport technologies precluded the development of interstate trade in that milk.
5. In recent years new technologies have made interstate trade in market milk viable. Price
differences between the various capital cities, and between market and manufacturing milk, have made it economically rewarding. In the 1980's the Midland Milk Company transported packaged pasteurised milk from Victoria to Sydney where it fetched a higher price than it would have in Victoria. New South Wales reacted by invoking s.6 of the Levy Act to suspend the Commonwealth market support levy. However, you say that, since Victoria was a major beneficiary of market support payments made under the Dairy Produce Act 1986 (Cwlth), agreements were reached between Victoria and New South Wales. Victorian producers were induced to cease interstate trading in market milk. At the same time, and by way of 'stabilising' the situation, the Victorian Parliament amended a.38 of the Victorian Act.
Section 38 and related provisions 6. Section 38 now reads as follows (underlining added):
'38. A person who sells or distributes market milk in a milk district, or manufactures market milk, In a case where the milk used in the manufacture of that milk has not previously been accepted by the Authority under section 37 shall be guilty of an offence against this Act.'
The 'Authority' is the Victorian Dairy Industry Authority. On general principles of interpretation, the reference to manufacture applies only to manufacture in Victoria.
7. Section 37 provides for the delivery of milk to, and its acceptance by, the Authority.
Upon acceptance, the milk (referred to below as 'raw milk') becomes the property of the Authority (s.37(5)) and is sold to milk processors who convert the raw milk into market milk. Milk not required by the Authority (and therefore surplus to market milk requirements) is not accepted and may be sold as manufacturing milk.

216 AUSTRALIAN DAIRY INDUSTRY
8. Payment for any milk accepted by the Authority under s.37 is made under s.37(6), i.e. 'in
accordance with section 53, section 54(3) or 54(4)'. (Section 53 appears to be no longer relevant: s.50(1)(c)). Section 54(3) and (4) provide only for payments to 'Victorian dairy farmers' licensed under the Act. The expression 'dairy farmer' is defined in the Victorian Act (s.3) to mean 'the owner of a dairy farm'. Clearly, in s.54(3) and (4) the expression 'Victorian dairy farmers' is limited to owners of dairy farms in Victoria. It follows that, if s.38 is valid, the only market milk that can be sold or distributed in a Victorian milk district, or manufactured in Victoria, is milk derived from dairy farms in Victoria. (I understand that raw milk produced in New South Wales is delivered to the Authority and is paid for in accordance with the New South Wales pricing structure, but this milk is not accepted 'under section 37' of the Victorian Act and therefore cannot meet the requirement of s.38. I am unaware of the basis (if any) in Victorian law under which the Authority accepts milk from sources outside Victoria.)
Section 92 of the Constitution 9. In my opinion, for the reasons given below, s.38 is wholly invalid: it is clearly contrary to
s.92 of the Constitution in regard to sale. distribution and manufacture of market milk. 10. In Cole v Whitfield (1988) 165 CLR 360, the High Court held that the immunity conferred
by s.92 is limited to immunity from discriminatory burdens (i.e. those discriminating between interstate and intrastate trade) that have a 'protectionist' purpose or effect (pp.394, 398 407-408). There is an exception where the purpose of the law is the protection of the public from a real danger or threat to its well-being (egg. to public health), or some other legitimate object of the State, and the law is appropriate and adapted to the achievement of that purpose (pp.382-384).
11. Given that s.38 purports to prohibit the sale, distribution or manufacture in Victoria of milk
produced outside Victoria, it is in clear breach of s.92. It imposes a discriminatory burden on the bringing of milk into Victoria. It is plainly protectionist in effect, if not in purpose (North Eastern Dairy Co Ltd v Dairy Industry Authority of NSW (1975) 134 CLR 559 per Mason J at p.607-608.) It clearly does not come within the exception mentioned above concerning' public health or the like.

APPENDIX D: REQUEST FOR AND ADVICE FROM THE
217
Section 6 of the Levy Act 12. The Levy Act imposes various levies on the milk fat content of relevant dairy produce (s.5).
The market support levy was intended to provide funds for market support payments on certain exportable dairy products which support the domestic price structure for these dairy products (see Part VII, Division 4 of the Dairy Produce Act 1986). The levy applies across all milk production, both market milk and manufacturing milk – but the benefit in the form of market support payments goes largely to the manufacturing sector.
13. Section 6 of the Levy Act provides for the suspension of the levy in certain circumstances:
'6.(1) where the Minister receives a notice in writing from a member of the Australian Agricultural Council asking the Minister to take action under this sub-section, the Minister shall, an soon as practicable after the end of a period of 60 days from the day an which the notice was received, cause a notice to be published in the Gazette suspending, with effect from a day specified in the notice, not being a day earlier than the day on which the notice is published, the operation of sub-section 5(1) so far as that sub-section provides for the imposition of the market support levy on the milk fat content of dairy produce that is produced on or after the specified day.'
14. Where the operation of s.5(1) is suspended in accordance with s.6, producers in all States are
relieved of liability to pay the levy. In the case of Victoria and New South Wales, the threat of such a suspension in the 1980's apparently led to the withdrawal of Victorian producers such as Midland from interstate trading (paragraph 5 above). It appears that the purpose of the New South Wales member in giving the notice under s.6 was to prevent the bringing of Victorian milk into New South Wales, and that the threatened suspension of the levy had protectionist effect of ending that trade.
15. It is arguable that s.6 cannot validly operate to suspend the levy where the notice is given for
a protectionist purpose and where the suspension would have protectionist effects.

218 AUSTRALIAN DAIRY INDUSTRY
However, s.6 is non-discriminatory as between interstate and intrastate trade and so does not come within the first part of the Cole v Whitfield test ('discriminatory in a protectionist sense'). Furthermore, it is not the operation of s.6 that is protectionist but rather the threat to use it. If the levy had been suspended, Victorian producers for export would have suffered, but that would itself not have directly resulted in protection of NSW producers or sellers. It was apparently only the consequential political arrangements that led to Victorian suppliers withdrawing from the NSW market. In my view, such effects would be too remote from the use of s.6 to make a suspension invalid under s.92.

APPENDIX E: DETAILS OF COMMONWEALTH MARKETING
219
APPENDIX E: DETAILS OF COMMONWEALTH MARKETING ARRANGEMENTS
E.1 Legislation
Dairy legislation The enabling legislation for the Commonwealth marketing arrangements – ‘the Kerin Plan' -consists of four acts of parliament. • Dairy Produce Act 1986
This Act establishes the arrangements that provide assistance to the industry for dairy produce. It provides for the collection of levies on milk and dairy products; the establishment of the market support fund, supplementary market support fund, promotion fund, and industry fund; the making of payments from the funds; and for controls over exports of Australian dairy produce. The Act also provides for the continued operation of the Australian Dairy Corporation to administer the Act's provisions.
• Dairy Produce Levy (No.1) Act 1986
This Act provides for the imposition of four levies (Corporation, Market Support, Promotion, and Research and Development) based on the fat content of milk. It further provides for a levy on domestic sales of butter and some cheese types which provided the funding for the supplementary market support payments of the Dairy Produce Act 1986. A provision to suspend the market support levy - the comfort clause - is contained in this Act.
• Dairy Produce Levy (No.2) Act 1986
This Act provides for levies on re-imports of Australian dairy produce. These levies are payable by the importer and are equivalent to the product levy imposed under the Dairy Produce (No.1) 1986 and the rates of market support payment and supplementary market support payment current at the time of importation.
• Dairy Legislation (Transitional Provisions and Consequential Amendments) Act 1986
This Act repeals several acts, most of which were inoperative, concerning marketing arrangements in the dairy industry. Where necessary the Act continues the provisions of the repealed legislation. For example, it continues financial provisions relating to dairy produce produced before 1 July 1986.
220 AUSTRALIAN DAIRY INDUSTRY
Other legislation • Trade Practices Act 1974
Part IV of this Act contains provisions that seek to regulate restrictive trade practices. The Act's provisions can apply to any discretionary activity of a statutory marketing authority. However, activities that are specifically endorsed by Commonwealth, State or Territory Law are exempt from the provisions of the Act. The activities involved in the administration of the Commonwealth marketing arrangements by the Australian Dairy Corporation are specifically established in the Dairy Produce Act 1986 and therefore exempt from the Trade Practices Act. The Australian Dairy Corporation is also unlikely to be subject to the provisions of the Act as its role in domestic markets is limited to promotion.
• Export Control Act 1982 This Act provides for the inspection of export dairy products by the Australian Quarantine and Inspection Service (AQIS). Standards for dairy exports are prescribed in Orders made under the Act; Prescribed Goods General Orders 1985, Dairy Produce Orders 1985, and Export Control (Quality Assured Food) Orders 1990. • Inspection for prescribed standards is currently conducted by either: • end product sampling (Product Monitoring System); or • firm based quality assurance programmes approved by the Service and subject to three audits per annum. In addition to ensuring compliance with product standards, the Service also provides the certification required by the Government of some importing countries (currently about 25 per cent of exports). AQIS charges for inspection services on the basis of full cost recovery.
• Customs Tariff (Anti-dumping) Act 1975 The Act provides the mechanism for the investigation of complaints by Australian industries of ‘unfair’ import competition and assistance - countervailing duties - if their case is proven.
• Customs Tariff Amendment Act (No. 3) 1986 This Act amended the tariff schedules for dairy imports to give effect to the cheese tariff quota.
• Primary Industries and Energy Research and Development Act 1989 The Australian Dairy Research and Development Corporation, established on 1 April 1990, is constituted under this Act. The Corporation manages industry research funds, provided equally by the research levy on milk and the Commonwealth government, so as to increase the productivity and competitiveness of the Australian dairy industry.

APPENDIX E: DETAILS OF COMMONWEALTH MARKETING
221
E.2 Milk levies The Commonwealth marketing arrangements provide for the imposition of the following levies on wholemilk or the wholemilk content of dairy products:
• the market support levy;
• the promotion levy;
• the corporation levy; and
• the research levy.
Levy rates are based on the fat content of the milk1. The Dairy Produce Levy (No.1) Act 1986 prescribes a maximum rate for each levy. Within the prescribed maximum, rates are set by regulation. The Minister for Primary Industries and Energy, in making regulations prescribing levy rates, is required by the Act to:
• take into consideration any recommendation made by the Australian Dairy Corporation with respect to the rate of market support levy; and
• take into consideration any recommendation made by the Australian Dairy Industry Council with respect to the rate of corporation, promotion, and research levy.
The market support levy - often referred to as the `all milk levy' - is the main source of funding for the assistance provided by the Kerin Plan. A levy of up to 45 cents per kilogram milk fat is imposed on total milk production. Table E.1 lists the levy rates and collections for recent years.
Table E.1: Dairy industry levies, 1986-87 to 1989-90 Market Support Levy Promotion Levy Corporation Levy Research Levy
Year rate total rate total rate total rate total cents/kg cents/kg cents/kg cents/kg milkfat $'000 milkfat $'000 milkfat $'000 milkfat $'000 1986-87 35 94 427 4.05 11 065 0.90 2 459 0.45 1 227 1987-88 40 106 622 3.82a 10 532 1.05 2 428 0.68b 1 637 1988-89 45 123 443 4.95 13 588 1.05 2 882 0.68 1 778 1989-90 45 122 082 4.65 12 495 1.05 2 822 1.30c 3 400 1990-91 43 na 4.65 na 1.05 na 1.80 na a The rate changed from 4.05 on 1 November 1987. b The rate changed from 0.45 on 1 September 1988. c The rate changed from 0.68 on 1 October 1989. Source: ADC 1990b; DRDC 1990; ADIC Submission 16, p.6.
1 Several factors influenced the decision to base the levy on milkfat content including reducing levy avoidance,
payments to farmers were based on milkfat content and, the need for a standard base for levies on all milk.

222 AUSTRALIAN DAIRY INDUSTRY
The promotion levy provides funding for the Corporation's activities in promoting the consumption of Australian dairy produce. The maximum levy is 5.5 cents per kilogram of milk fat. The Corporation's administration costs are funded by the corporation levy. The maximum levy rate is 2.5 cents per kilogram of milk fat.
Market Support levy revocation clause
Commonly known as the `comfort clause', Section 6 of the Dairy Produce Levy (No.1) Act 1986 allows any State minister responsible for dairying to make a written request to the Commonwealth Minister for Primary Industries and Energy (the Minister) for suspension of the market support levy. This provision was included in the Act to allay the concerns of some States about the impact of the market support levy on market milk producers at a time of ‘significant disruption or change in that sector' (Hansard, 7 May 1986, p. 3208). The wording of the legislation, however, does not prescribe that such conditions exist prior to the lodging of a suspension request.
Once a request is made, the Minister is obliged to give effect to it 60 days from its receipt, unless a majority of members of the Australian Agricultural Council vote against the suspension; the Council consists of State and Commonwealth Ministers responsible for Agriculture. Suspension of the market support levy would end the support payments on exports of dairy products. The Minister can reinstate the market support levy at any time without recourse to the Australian Agricultural Council.
There have been two requests to suspend the market support levy, each from the New South Wales Minister for Agriculture and Rural Affairs. Each request was in response to the supply of Victorian milk to the Sydney market at less than the prescribed retail price. Box 1 outlines the events surrounding the requests to invoke the comfort clause. Neither of the requests resulted in the suspension of the market support levy.
E.3 Market support payments
Market support payments to exporters of dairy products are made from the market support fund administered by the Australian Dairy Corporation. Funding is from:
• the market support levy;
• Commonwealth underwriting;
• trading profits from Corporation export sales;
• interest income; and
• levy penalties.

APPENDIX E: DETAILS OF COMMONWEALTH MARKETING
223
Box 1: Use of the ‘comfort clause'
The New South Wales Minister for Agriculture and Rural Affairs has invoked the comfort clause twice, once on 16 April 1987 and then on 14 August 1987. Both requests were in response to the sale of market milk in Sydney by a Victorian processor, Midland Milk, at prices below the prescribed retail price. Midland Milk had previously supplied milk to the Sydney market at less than prescribed prices in 1984. The New South Wales Dairy Corporation countered these sales by imposing minimum retail prices and different health standards for processed milk sourced from interstate. The setting of different health standards was declared invalid by the New South Wales Supreme Court. Midland resumed sales of milk to the Sydney market on 9 April 1987. The milk was sourced under contract from the Victorian Dairy Industry Authority and sold through Jewel Foodstores in 2 litre containers at 2 cents per litre less than the prescribed price. In response, the Corporation reduced its prices by 2 cents. Midland achieved around 1 per cent of the Sydney market. The request of 16 April was withdrawn on 5 May 1987 following negotiations between the Dairy Industry Authorities of New South Wales and Victoria and in recognition of the stabilizing value of the market support levy. The negotiations between the Authorities resulted in an agreement (announced 29 June 1987) which provided access for Victorian milk, on an authority to authority basis, to 1 per cent of the Sydney milk market for a three month period. A permanent sharing agreement was to be negotiated between the two States during this time. In the meantime, the Victorian Dairy Industry Authority had terminated its contract with Midland, citing failure to pay a surety as the reason for doing so. Midland Milk resumed its milk sales into Sydney on 4 August, but with milk sourced directly from dairyfarmers. The comfort clause was invoked for a second time on 14 August 1987. This request was withdrawn at the Australian Agricultural Council meeting convened on 2 October to discuss it. During the meeting the New South Wales and Victorian Ministers resolved to reach a co-operative solution. Contingent on Midland Milk ceasing its sales in the Sydney market at discounted prices, the following arrangements were to apply from 12 October 1987: • Victorian access to the New South Wales market would be increased to 3 per cent by 1 December 1987 and to 5
per cent by 1 December 1989, inclusive of traditional Victorian sales into New South Wales border districts (1 per cent of the NSW market);
• Except for border trade, the milk would be sold bulk on an authority to authority basis; and • The New South Wales Dairy Corporation would pay the Victorian Dairy Industry Authority the NSW price for
milk delivered to Sydney processors. The Victorian Dairy Industry Authority would meet all transport costs. Subsequently and effective from late November 1987, Section 38 of Dairy Industry Act 1984 was amended to require all milk processed into market milk within Victoria be purchased from the Victorian Dairy Industry Authority.
Sources: Wilcox (1988), Dave (1991), Australian Agricultural Council (1988).

224 AUSTRALIAN DAIRY INDUSTRY
Table E.2 shows that the market support levy is the major source of funds. To date, under the Karin Plan, the Commonwealth Government has not been required to make any underwriting payments.
Table E.2: Payments to the Market Support Fund, 1986-87 to 1989-90
Year Market support levy
Corporation trading Interest Other
($’000) 1986-87 94 427 1 119 815 61 1987-88 106 622 832 1 158 128 1988-89 123 443 1 755 1 525 19 1989-90 122 082 864 3 435 1 001
a. Consists of levy penalties except for 1990, when the balance of the supplementary market support fund was
transferred after its closure. Penalties for non-payment of the market support levy are provided for in S63 of the
Dairy Produce Act 1986.
Source: ADC Annual Reports.
Levy contributions are collected by milk processors and remitted to the Department of Primary Industries and Energy (DIE). The Department's costs are charged against levy collections. Table E3 details the expenditures from the market support fund, including DIE collection costs. An appropriation from the consolidated revenue fund is required to transfer the levy collections to the market support fund.
Table E.3: Expenditure from the Market Support Fund, 1986-87 to 1989-90
Year Market support payments DIE levy collection fee Administrative expenses
($’000) 1986-87 79 339 160 1561 1987-88 124 254 170 1549 1988-89 107 522 147 1535 1989-90 118 064 66 1 443
Source: ADC Annual Reports.
The Dairy Produce Act 1986 establishes the following categories of dairy products for the purposes of setting market support payments:
• prescribed dairy produce;
• non-prescribed dairy produce;

APPENDIX E: DETAILS OF COMMONWEALTH MARKETING
225
• dairy produce exported to quota markets;
• dairy produce exported to foreign countries prescribed under the Act; and
• underwritten dairy produce.
Prescribed dairy produce is declared as such in writing by the Corporation. All major dairy product lines - cheddar cheese, butter, skim milk powder, whole milk powder, buttermilk powder and casein - are currently prescribed products. Approximately seventy per cent of manufacturing milk is used in the production of prescribed products. Non-prescribed products include products such as ice cream, yoghurt, and milk protein concentrate.
Effectively all market support payments are established from the rates of market support calculated for prescribed products. The Corporation has a discretion to set different rates for quota markets and prescribed foreign countries. The Corporation currently exercises this discretion only for exports to New Zealand to take into account the trade agreement with Australia.
Market support payments on prescribed products have a legislated limit of 30 per cent of expected average export prices. The Corporation estimates these average prices each April for the following financial year. The actual rate of market support payment is limited by the expected size of the market support fund and the expected volume of export sales. The operative rate of the market support levy is set annually by the Minister based on the advice of the Corporation and subject to the 45 cents per kilogram milk fat statutory maximum.
Table E.4 lists the rates of market support payments, supplementary market support payments and the estimated average export price for the prescribed products since the commencement of the Karin Plan.
The rate of market support payment can be varied at any time by the Corporation provided that the Corporation's reasons are accepted by the Australian Dairy Industry Council. However, the approval of the Council is not required if the Corporation considers that the size of the fund in the following 12 month period would be insufficient to meet all claims at the prevailing rate of market support �� that is, the Corporation can lower the rate of support unilaterally. Moreover, when lowering the market support payments the Corporation has a discretion to either reduce support for all products or reduce rates for selected products.

226 AUSTRALIAN DAIRY INDUSTRY
Table E.4: Market support payments to prescribed dairy products, 1986-87 to 1990-91 Estimated
average export prices
Market support levy
Market support payment
Ratio of market support to export prices
Supplementary market support payment
Ratio of combined support to export prices
$ per tonne cents per kgmilk fat
$ per tonne
per cent $ per tonne per cent
1986-87 35 Butter 1289 387 30 191 45 Cheese (cheddar) 1516 455 30 225 45 Skim milk powder 975 292 30 145 45 Whole milk powder 1363 409 30 202 45 Casein 2440 732 30 362 45 1987-88 40 Butter 1332 400 30 146 41 Cheese (cheddar) 1771 531 30 194 41 Skim milk powder 1292 388 30 142 41 Whole milk powder 1370 411 30 150 41 Casein 3178 953 30 349 41 1988-89 45 Butter 1500 314 21 40 23 Cheese (cheddar) 2373 496 21 78 Skim milk powder 1929 403 21 49 23 Whole milk powder 2001 418 21 49 23 Casein 5017 1048 21 118 23 1989-90 45 Butter 2250 417 19 - 19 Cheese (cheddar) 2500 478 19 - 19 Skim milk powder 2375 441 19 - 19 Whole milk powder 2375 441 19 - 19 Casein 6250 1159 19 - 19 1990-91b 43 Butter 1867 433 23 - 23 Cheese (cheddar) 2333 517 22 - 22 Skim milk powder 2000 414 21 - 21 Whole milk powder 2000 438 22 - 22 Casein 5867 1234 21 - 21 a Market support rates were changed on 1 December 1990. The rates shown for 1990-91 are averages. b These prices typically are estimated prior to the start of each year. They differ from the figures in Chapter 5,
Table 5.2, which are average realised export prices. Source: Information provided by the ADC.

APPENDIX E: DETAILS OF COMMONWEALTH MARKETING
227
Until 30 June 1990 market support rates for each prescribed product were set by the Corporation to reflect a uniform percentage on estimated average export prices. The reason for this was to ensure that relative production incentives faced by producers were not distorted by the market support payments. For the financial year 1990-91 the Corporation, with the agreement of the Council, adopted a system that allows the percentage equivalent of the market support rate to vary between products. The variation results in equal support per unit of milk input to the end products of the four major product lines (butter/skim milk powder, butter/casein, cheese/whey and whole milk powder).
The change was made because world prices, under the influence of European Community export refunds, were influencing the returns per unit of milk input between different products. For instance, the subsidy per unit of milk input paid by the Community on whole milk products such as cheese was greater than that for joint products such as butter and skim milk powder. As a result, the world price for joint products was higher than for whole milk products. By calculating the market support payments in respect to average export prices (as influenced by Community subsidies), rather than returns to per unit milk inputs, the amount of support provided to whole milk products was less. This reinforced the lower price received for wholemilk products as a result of the increased Community subsidy on these products.
As mentioned above the Corporation sets different rates of market support payments for exports to New Zealand. The rate is set at a level which is intended to refund to manufacturers/farmers the market support levy paid on the milk used in manufacturing the exports. This means that exports to New Zealand are not subsidised.
E.4 Supplementary market support payments
Supplementary market support payments were implemented to provide additional assistance to products supported under the previous arrangements (1977-1986). The payments were to be phased out and made from levies on the domestic sales of butter (and butteroil) and leviable cheeses (cheddar, Colby, Monterey, stirred curd, shredded and processed cheese). Levies raised were paid into the supplementary market support fund. Table E.5 documents the reduction in product levies from 1 July 1986 until their termination on 30 June 1989.

228 AUSTRALIAN DAIRY INDUSTRY
Table E.5: Dairy product levies, 1986 to 1989 Period Butter Leviable cheese
($ per tonne) 1 Jul 86 - 30 Jun 87 668 234 1 Jul 87 - 31 Dec 87 601 187 1 Jan 88 - 30 Jun 88 534 140 1 Jul 88 - 31 Dec 88 468 93 1 Jan 89 - 30 Jun 89 234 47 1 Jul 89 0 0 Source: ADC Annual Reports.
The supplementary fund was closed on 30 June 1990 and its balance transferred to the market support fund. Details of product levy collections and supplementary market support payments are in Table E.6.
Table E.6: Product levies and supplementary market support payments, 1986-87 to 1989-90 Year Product levies collected Supplementary market
support payments ($ million) 1986-87 40.3 39.2 1987-88 39.1 45.4 1988-89 21.9 14.1 1989-90 nil nil
Source: ADC Annual Reports.

APPENDIX 229
APPENDIX F: ASSISTANCE TO THE AUSTRALIAN DAIRY INDUSTRY
The dairy industry encompasses many separate operations from the production of milk on dairy farms through to its delivery on door steps, to the sale of dairy products in stores and to overseas buyers, and to the purchase of dairy products by food processors and other manufacturers. Government interventions have a significant influence on the commercial operation of many of those activities.
The Commission's existing assistance measurement systems are used to monitor the Australia-wide effects of major interventions influencing the main sectors of the industry. The estimates cover the production of milk on dairy farms (which is sold either as market or manufacturing milk) and the processing and manufacture of dairy products from that milk. They do not examine the regional incidence of assistance provided by government intervention; nor do they examine assistance to the activities of the milk vendors which influences the price and availability of market milk to consumers.
Estimates of assistance for the major activities in the Australian dairy industry are set out in this appendix together with details of the methods and assumptions used in their derivation. The estimates reveal that the major industry-specific interventions providing assistance are the individual State government controls over the supply and pricing of market milk (see Chapter 4 and Appendix C) and the Commonwealth market support payments (see Chapter and Appendix E). Measuring assistance provided by these two sets of marketing arrangements is the subject of the next two sections of this appendix.
The influence of these marketing arrangements and other interventions on individual industry output returns in the dairy industry, and hence nominal rates of assistance, is the subject of the third section. This is followed by the fourth section covering other interventions, that influence industry costs and factor (land, labour and capital) returns, to determine net assistance and returns to value added in individual industries, and hence effective rates of assistance.
The workshop on assistance measurement held in April 1991 highlighted many of the difficulties in seeking to quantify the assistance effects of the many interventions that assist dairying. The workshop and the information provided by participants during the inquiry provided the catalyst for the Commission to revise the methods and data used to estimate the levels of assistance provided the different dairy activities. The changes are outlined in this appendix.

230 AUSTRALIAN DAIRY INDUSTRY
F.1 Assistance provided by the Kerin Plan
As outlined in Chapter 5, the Commonwealth market support payments (known generally as the Kerin Plan) assist the Australian dairy industry by taxing all milk received by processors and manufacturers and using the proceeds to subsidise exports of manufactured dairy products. The intended effect of these market support payments is to raise domestic prices for manufactured dairy products and provide extra revenue for the industry. This is achievable because competitive pressures cause products to be allocated between domestic and export markets until the prices of products sold domestically yield manufacturers net unit returns comparable to those obtained from subsidised export sales.
Price support provided to domestic sales is measured on a product basis from the market support payments on exports. Details of the market support payments made to the major dairy products in 1989-90 are given in column (3) of Table F.1.
The Australian Dairy Corporation has advised that the level of the support payment made to an individual product depends on its milk fat and/or milk solids non-fat content. The level is now set so as to provide each product with similar subsidies on a milk content basis; butter is used as the reference product for determining subsidies to other dairy products. As the proportion by weight of the product derived from milk varies, so does the per tonne level of support. Similarly, as the milk proportion by value of the product varies, so does the rate of support. Rates of support for the major dairy products - termed domestic price distortions - are given in column (6) of Table F.1. As indicated, price distortions have been derived from market support payments, column (3), and free-on-board (fob) export prices, column (2). The domestic price distortions are indicative of the higher prices paid by consumers and users of dairy products as a result of the Kerin Plan.
The extra returns received by dairy product manufacturers from the Kerin Plan are the sum of the subsidies received for export sales and the extra returns from domestic sales as a result of the export subsidies maintaining higher domestic prices. The extra returns from domestic sales - termed producer transfers - are given in column (7) of Table F.1. As indicated, the producer transfers have been derived directly by multiplying the quantity of domestic sales by the level of market support payments. As the subsidies received for export sales are financed from the tax on all milk - the market support levy - part of the extra returns received by dairy product manufacturers is financed from market milk sales.
The following is a brief explanation of Table F.1:
• Column (1) lists the products for which the Commission estimates assistance due to market support payments on exports.

APPENDIX 231
Table F.1: Levels and amounts of assistance provided major manufactured dairy products, 1989-90
Product Export price
fob Market support payment Domestic sales
quantity Price
distortion Producer
transfer $ per tonne $ per tonne $ million tonnes per cent $ million
(1) (2) (3) (4) (5) (6) (7)Butter 2 355 417 21 56 700 18 24
Cheese:a Group A 2 896 536 - 4 166 19 2 Group B 2 736 478 - 42 803 17 20 Group C 4 134 416 - 44 969 10 19 Group D 4 241 373 - 17 606 9 7 Group E 3 573 337 - 14 375 9 5 Group G 2 414 221 - 7 123 9 2
Total Cheese 3 434 436 23 131 042 13 57b
Skim milk powder 2 339 441 37 42 400 19 19
Whole milk powder 2 815 441 16 15 300 16 7
Casein 6 213 1 159 4 1 000 19 1
Other - - 17 - - - Total 118 Total 108
a The different groups of cheeses are determined by moisture content and are:
Group A: Hardgrating (Parmesan, Romano, Pecorino).
Group B: Cheddar/cheddar type.
Group C: Round eye (Edam, Gouda), processed cheddar, shredding type cheddars.
Group D: Shredding (mozzarella, pizza).
Group E: Cream cheese, mould ripened (blue vein, Camembert, Brie), and Neufchatel.
Group G: Fresh (cottage, ricotta, cream).
b The sum of the producer transfers for the cheese groups do not add to $57 million due to rounding.
Source: Australian Dairy Corporation data and Commission estimates.
• Column (2) lists the fob export prices, based on shipment data provided to the Australian Dairy Corporation, which have been taken as the benchmark prices for each of the products.
• Column (3) lists the rate of market support payments made on each of the products. It is assumed that domestic prices of the products are supported by this margin. Rates of payments are based on either the milk fat content or the solids non-fat content of the products.
• Column (4) lists the amount of market support payments made for export of each of the products.

232 AUSTRALIAN DAIRY INDUSTRY
• Column (5) lists the domestic sales quantity for each of the products.
• Column (6) the domestic price distortions, shows the rates of market support payments as a proportion of the respective export prices.
• Column (7), the producer transfer, lists the income transfer from domestic consumers and users to domestic producers as a result of the price support provided by the export subsidies for each of the products. It is taken as the market support payment times domestic sales of domestic production (that is, column (3) times column (5)).
There are limits to the degree to which export subsidies can raise domestic prices. If supported export prices (and hence prices for domestic consumption) are higher than the prices of comparable imports, domestic consumers and users will replace local product with imports and manufacturers will divert product to export markets to obtain the higher subsidised export prices. As outlined in Chapter 5, there is a ceiling on the rate of the market support levy and, hence, a limit on the total funds available for market support payments. Therefore, the extent to which local production can be exported at higher prices and replaced by imports is also limited.
An important assumption in measuring the assistance effects of the export subsidies is that domestic prices for dairy products are raised by the same extent as the subsidies raise returns from exports. The validity of this assumption depends on there being adequate supplies of comparable products available for export and there being sufficient competition between manufacturers for domestic and export sales to ensure that domestic prices reflect subsidised export returns.
While there was general acceptance of the competitive nature of dairy product manufacturing and marketing at the workshop held on assistance measurement, some participants questioned whether there would be adequate supplies of comparable products if the export subsidies were removed. On the basis that the industry would shrink to supply only the domestic market in competition from imports, they held that assistance to dairy products should be measured on an import-parity basis rather than the export-parity basis implicit in current measurements.
There are no protective barriers to the import of manufactured dairy products, apart from certain cheeses.1 If the cheese import barriers are ignored, then on the basis that there is no protection from imports, there is no assistance to production from domestic sales. Assistance to production from exports would depend on the amount of product exported and level of export subsidy.
For cheese, measured assistance on an import-parity basis would be small as the penalty provisions of the tariff quota are not currently operative; the ad valorem equivalent of the import cheese duty
1 Freely imported cheeses, not including New Zealand cheese, account for only 2 per cent, by weight, of the domestic
market for cheese.
APPENDIX 233
of $96 per tonne is around 2 per cent to 3 per cent; and not all domestic cheeses are protected by the cheese tariff.
The size of the industry in the absence of assistance is therefore an important issue in determining the assistance effects of the market support payments. While some industry participants were of the view that the industry would shrink to become import competing if the assistance were removed, others were of the view that current arrangements had little effect on resource use and, by implication, little effect on the size of the industry.
The results of modelling the effects of policy changes to both the Commonwealth market support and the States' control of market milk, based on the Commission's measurements of the assistance changes involved, are given in Appendix G. The results indicate that, with large reductions to the assistance provided by existing arrangements, there would still be significant exports of dairy products, albeit at lower levels than at present. Similar conclusions were reached independently by Australian Bureau of Agricultural and Resource Economics (ABARE) and the Victorian Department of Agriculture as a result of their modelling of the effects of removal of assistance (ABARE 1991, p. 32; Submission 65). Thus, the Commission can see no merit in changing the basis on which the assistance effects of the Commonwealth arrangements are measured from export parity to import parity.
Table F.1 includes the levels and amounts of assistance provided to the major manufactured dairy products during 1989-90. Similar data for the operation of the Kerin Plan from 1986-87 to 1988-89 are given in Table F.2.
From the data in Tables F.1 and F.2 it can be seen that, with the phasing out of the supplementary support payments, there has been a steady decline in the levels of assistance provided to the major manufactured dairy products and in the cost of the arrangements to domestic consumers and users of dairy products. These supplementary payments were financed by product levies imposed on domestic sales of butter and cheese.
F.2 Assistance provided by State government control of supply and pricing of market milk
State government arrangements covering the sourcing, pricing and distribution of market milk for all States, the Australian Capital Territory and the Northern Territory are discussed in Chapter 4 and Appendix C. In most States, the controls over supply and pricing extend from the milking shed to the doorstep. The existing measurements of assistance to market milk are limited to the assistance provided farmer returns and the processing of that milk.

234 AUSTRALIAN DAIRY INDUSTRY
Table F.2: Levels and amounts of assistance provided major manufactured dairy products, 1986-87 to 1988-89
Export sales Domestic sales
Dairy products
Market and supplementarysupport payments
Price distortion
Producertransfer
$ per tonne $ million per cent $ million (1) (2) (3) (4)1986-87 Butter 578 14 89 32Cheese 680 24 55 88Skim milk powder 437 34 37 18Casein 1094 8 41 1Whole milk powder 611 25 42 8Other - 15 - - Total 120 Total 1471987-88 Butter 546 28 67 28 Cheese 676 51 33 79 Skim milk powder 530 37 38 25 Casein 1302 10 33 1 Whole milk powder 561 34 25 8Other - 10 - - Total 170 Total 141 1988-89 Butter 355 18 40 18 Cheese 528 33 24 67 Skim milk powder 452 29 19 19 Casein 1166 7 19 1 Whole milk powder 467 20 17 6Other - 15 - - Total 122 Total 111
Note: The domestic price distortion, column (3), includes the added cost to consumers and users of butter and
cheese of the levies used to fund the supplementary support payments. The producer transfer, column (4), is
derived from domestic sales of locally produced products and the level of market and supplementary support
payments and is net of the levies charged consumers of butter and cheese.
Source: ADC and Commission estimates.
Estimates of assistance provided by the State arrangements depend on comparing realised farmer returns from market milk sales with those that would prevail if State controls were removed and there was an open and competitive market, as applies to most other farm products. In the absence of such a market, it is difficult to be precise as to how much assistance is provided by the current arrangements.

APPENDIX 235
Previous estimates
The information provided to this inquiry has convinced the Commission that it should change the method by which it has measured the assistance provided to dairy farmers by the current supply arrangements for market milk. Until this inquiry, the Commission has measured the assistance to market milk in Queensland, New South Wales and South Australia by comparing local prices paid for market milk with benchmark prices derived from the Victorian manufacturing milk price plus freight and an allowance for out-of-season supply based on Victorian winter incentive payments. For Victoria, Tasmania and Western Australia the comparison was between local market milk prices and benchmark prices derived from local manufacturing milk prices plus the Victorian winter incentive payments. No assistance was measured to market milk supplied to the Australian Capital Territory and the Northern Territory.
Adoption of that method followed from discussions with industry representatives and a review of Bureau of Agricultural Economics analyses at the 1983 Industries Assistance Commission Inquiry into the Dairy Industry (IAC 1983b, Chapter 3). It reflected the view that, in the absence of State controls, the pricing of market milk in Queensland, New South Wales, Victoria and South Australia would be determined by Victorian manufacturing milk prices plus appropriate margins for out-of-season supply and freight from Victoria.
Benchmark prices developed on this basis were compared with realised market milk prices as reported by Australian Bureau of Agriculture and Resource Economics. The resultant price margins, or transfers per litre, were then multiplied by the sales quantity of market milk, as reported by the Australian Dairy Corporation, to give estimates of the magnitude of the income transfers from consumers to producers (producer transfers) associated with State government controls of market milk. Details of estimates of producer transfers associated with these controls of market milk for 1989-90 are given in Table F.3. Estimates of the producer transfers and associated price distortions for market milk from 1986-87 to 1989-90 inclusive are given in Table F.4. The estimates labelled ‘old’ in Table F.4 were derived using the method described above.
At the April 1991 workshop on assistance measurement to the dairy industry, it was pointed out that the Australian Dairy Corporation sales quantity for market milk in New South Wales also included sales of market milk to the ACT Milk Authority, and sales of milk for the production of cream that was paid for at a manufacturing rather than a market milk price. Data from the New South Wales Dairy Corporation have been used to adjust the Australian Dairy Corporation data and the adjusted data are reported in Table F.3.
The data in Table F.4 indicate there has been a considerable decline in the producer transfer and associated price distortion over the period 1986-87 to 1989-90. The decline has been the result of ‘farm gate’ returns for market milk rising less rapidly than those for manufacturing milk.

236 AUSTRALIAN DAIRY INDUSTRY
Table F.3: Estimates of producer transfers to market milk by State, 1989-90 Winter months NSW Vic Qld WA SA Tas
Manuf. milk price (1) c/l 25.12 25.12 25.12 22.28 25.12 22.70 plus Vic winter incentive (2) c/l 9.30 9.30 9.30 9.30 9.30 9.30 plus transport from Vic (3) c/l 7.13 0.00 12.40 0.00 5.18 0.00 equals benchmark price (1)+(2)+(3) (4) c/l 41.55 34.42 46.82 31.58 39.60 32.00 market milk price (5) c/l 37.73 37.45 41.40 37.57 39.13 41.85 transfer per litre (5)-(4) (6) c/l -3.82 3.03 -5.42 5.99 -0.47 9.85 winter sales quantity (7) Ml 135.30 114.50 79.40 42.50 38.60 12.20 producer transfer (6)*(7) (8) $M -5.17 3.47 -4.30 2.55 -0.18 1.20
Summer months NSW Vic Qld WA SA Tas Manuf. milk price (1) c/l 25.12 25.12 25.12 22.28 25.12 22.70 plus transport from Vic (2) c/l 7.13 0.00 12.40 0.00 5.18 0.00 equals benchmark price (1)+(2) (3) c/l 32.25 25.12 37.52 22.28 30.30 22.70 market milk price (4) c/l 37.73 37.45 41.40 37.57 39.13 41.85 transfer per litre (4)-(3) (5) c/l 5.48 12.33 3.88 15.29 8.83 19.15 summer sales quantity (6) Ml 401.00 334.90 236.20 121.80 111.60 35.00 producer transfer (5)*(6) (7) $M 21.97 41.29 9.16 18.62 9.85 6.70 Total producer transfer (by State) 16.81 44.76 4.86 21.17 9.67 7.90 Total producer transfer - Australia: $105 million or 6.3 cents per litre Note: Figures have been rounded for presentation. Source: ABARE and ADC data, and Commission estimates. Table F.4: Producer transfers and price distortions for market milk, 1986-87 to 1989-90
1986-87 1987-88 1988-89 1989-90 1988-89 1989-90 Old Old New New a
Price distortion (per cent) 56 48 24 19 43 36Producer transfer ($ million) 205 192 121 105 187 176 a The new estimates refer to revised estimates for 1988-89 and 1989-90. Details of calculations for the new
estimates for 1989-90 are given in Table F.5. Source: Commission estimates.
During the workshop it was also pointed out that the ABARE price data for market milk sales in New South Wales and Tasmania were not compiled on the same basis as those for other States and for manufacturing milk. In particular, it was considered that the data included some of the costs of farm to factory freight, whereas the other data were net of freight. As a result, the estimated transfers per litre and producer transfers for New South Wales and Tasmania have been over-stated. Using information on freight costs provided by the New South Wales Dairy Corporation and the Tasmanian Dairy Industry Authority, the Commission adjusted the estimates for 1988-89 and 1989-90 to take into account farm to factory freight costs included in the market milk price data for New South Wales and Tasmania provided by ABARE.

APPENDIX 237
No adjustments have been made to the results for earlier years. The adjusted data for 1989-90 are reported in Table F.3.
The transport costs used in the Commission's estimates were based on data provided by the (then) Bureau of Agricultural Economics for the Commission's previous dairy inquiry and have been indexed forward to current values using an index of changes in freight rates. The Australian Dairy Corporation has provided estimates from a transport industry source of interstate transport rates for 1989-90 which are around 40 per cent higher for New South Wales, 50 per cent higher for South Australia, and around 60 per cent higher for Queensland, than those used in the Commission's estimates. Revised estimates for 1989-90, using the Australian Dairy Corporation transport costs to derive the producer transfers associated with State Government arrangements for market milk, would yield a lower estimate of $70 million (compared to $105 million) for the producer transfer.
Uncertainty must necessarily attach to any estimates of freight rates in the absence of a clear specification of the nature and extent of interstate trade in market milk and liquid milks. However, using the freight rates supplied by the Australian Dairy Corporation, a benchmark price for Queensland is derived that is on average some 13 per cent higher than current local market milk returns. This is clearly counter-intuitive, as alternative supplies of local milk are available at much lower prices and because quota restrictions on sales of market milk are required to maintain and ration access to the higher local market milk prices.
This highlights a difficulty of continuing to use Victorian market milk prices plus freight as a benchmark for measuring market milk assistance in other eastern States. Given the ex-Victorian transport costs involved and the alternative source of lower cost local milk used for manufacturing, Victorian milk is unlikely to be transported all the way to Queensland in the absence of market interventions. Instead it is more likely that, in the first instance, Victorian milk would place competitive pressures on New South Wales prices which, in turn, would place competitive pressures on Queensland milk prices. This view is strongly supported by the modelling work undertaken by the Victorian Government and ABARE. Indeed, in reporting results from its modelling work, the Victorian Government stated that:
When the model is run with no policies of any kind in place there is negligible trade between States,
suggesting that the only incentive for interstate trade in market milk is the difference in prices between
market milk and manufacturing milk, transport costs being high enough to make interstate trade unprofitable
otherwise. (Submission 34, p. 29)

238 AUSTRALIAN DAIRY INDUSTRY
Similarly, on the basis of its modelling work ABARE said:
Given free trade in market milk between the eastern states, it is likely that the dairy industries in each of the three
states [New South Wales, Victoria and Queensland] would continue to produce most of the fresh milk
requirements of their own consumers. Some trade would occur at certain times of year, such as autumn or winter,
when market prices could be insufficient to bring about the necessary response in New South Wales and
Queensland (ABARE 1991, p. 4)
Local manufacturing milk prices are determined by export prices received for dairy products, plus the market support provided by export subsidies under the Kerin Plan (see Section F.1). In a competitive market, arbitrage opportunities would tend to equate milk returns from market milk sales with returns from milk used in manufactured milk products. It is, however, expected that milk produced out of season mainly for market milk purposes would continue to command a margin over the manufacturing milk price; the margin would cover the added costs of providing milk out of season for the market milk sector of the market.
New estimates
The Commission, therefore, considers that it should change its method of measuring assistance to market milk for New South Wales, Queensland and South Australia. Rather than use an ex-Victorian manufacturing milk price plus transport, it would be more appropriate to use an Australian average manufacturing milk price plus an allowance for the cost of assurance of out-of-season supply. The assistance for market milk in those States would then be measured on the same basis as assistance has been measured for Victoria, Western Australia and Tasmania.
This raises the question of the appropriate allowance for the cost of assurance of out-of-season supply. As outlined in Chapter 4, an out-of-season supplier in Victoria in 1989-90 would have derived an average price for milk some 13 per cent higher than a seasonal supplier received for manufacturing milk alone. The 13 per cent included not only the specific winter incentive payments, but also the existing premiums received for market milk. The winter incentive payments contributed some 4.5 percentage points of the total of 13 per cent. Since 1985-86 the total margin for out-of-season supply relative to the price for manufacturing milk alone has varied from 13 per cent to 23 per cent. The winter incentive payments have contributed from 4.2 to 8.2 of those percentage points over the same period. Similarly, in Tasmania for the period from 1986-87 to 1989-90 the total margin for out-of-season supply relative to the price of manufacturing milk alone varied from 12 per cent to 20 per cent. Of these totals, winter incentive payments contributed from 3.0 to 7.3 percentage points. In South Australia, although there are no specific out-of-season payments, the margin for out-of-season supply relative to the price for manufacturing milk alone varied from 30 per cent to 34 per cent between 1986-87 and 1989-90.

APPENDIX 239
The specific winter incentives paid in Victoria and Tasmania may not be a good guide to the cost of assurance of out-of-season supply. The payments are made in addition to the higher prices already received as a result of monthly pooling of the additional returns from sales of milk for market milk purposes on the basis of total monthly milk production. Thus, the total margin is considered to be a better guide of the incentive to cover the additional costs of out-of-season supply. Research by ABARE also indicates that the costs of year-round production in New South Wales are some 20 per cent higher than those of normal seasonal production (Lembitt and Bhati 1987).
In the absence of a more open and competitive market for the supply of market milk and liquid milks, it is not possible to be precise as to the margins that would be established to cover the regional costs of assurance of out-of-season supply. The margin would, however, vary between major centres of population depending on their location relative to suitable land for dairying. It would be relatively low for Melbourne, Adelaide, Hobart and Perth, but higher for Sydney and Brisbane.
The Commission has chosen an average Australia-wide margin of 20 per cent of the assisted manufacturing milk price on which to calculate assistance to the market milk sector. While not representative of supply to a particular centre of population, overall it is believed to be an appropriate allowance for the costs of assurance of out-of-season supply. The revised method for measuring the assistance to market milk results in a higher overall estimate of that assistance as shown in Table F.5.
Table F.5: Revised estimates of producer transfers to market milk by State, 1989-90 NSW Vic Qld WA SA Tas
Manufacturing milk pricea (1) c/l 23.35 23.35 23.35 23.35 23.35 23.35 plus 20 per cent margin (2) c/l 4.67 4.67 4.67 4.67 4.67 4.67equals benchmark price (1)+(2) (3) c/l 28.02 28.02 28.02 28.02 28.02 28.02Market milk price (4) c/l 37.73 37.45 41.40 37.57 39.13 41.85transfer per litre (4)-(3) (5) c/l 9.71 9.43 13.38 9.55 11.11 13.83Annual sales quantity (6) Ml 536.30 449.40 315.60 164.30 150.20 47.20producer transfer (5)*(6) (7) $Ml 52.07 42.38 42.23 15.69 16.69 6.53 Total producer transfer - Australia $176 million or 10.6 cents per litre
a The manufacturing milk price is a weighted average of State manufacturing milk prices.
Source: Commission estimates.
A comparison of the revised estimates with those made under the previous methodology reveals higher estimates of assistance for Queensland, New South Wales and South Australia and lower estimates for Victoria, Tasmania and Western Australia. However, as noted above, the overall margin of 20 per cent is unlikely to accurately portray the situation of an individual State.

240 AUSTRALIAN DAIRY INDUSTRY
The variability of the overall estimate to different margins is illustrated in the sensitivity analysis reported in Table F.13.
It should be noted that the benchmark prices described above, do not make allowance for the assistance provided to manufacturing milk production by the Commonwealth market support payments. This assistance amount was in the order of 3 cents per litre for 1989-90 and means that the benchmark prices used for market milk may have been overstated by around 3 cents per litre. As a result, a further $50 million dollars could be added to the producer transfers reported for 1989-90.
Notwithstanding the difficulties of deriving appropriate benchmark prices for measuring the assistance provided market milk by current State marketing arrangements, the overwhelming conclusion is that they provide considerable assistance for the production of market milk.
Canberra milk market
The Australian Dairy Industry Council suggested that the public tender price for milk sold to the Canberra milk market should be used as the benchmark price for estimating assistance provided to market milk production by the State government arrangements (Submission 48, p.21). The major suppliers of milk to Canberra for the 1989-90 and 1990-91 period were Bega/Bodalla (46 per cent of total supplies) and Murray Goulburn (50 per cent). If the delivered prices are adjusted for the costs of collection, handling and transport, the farm-gate price for milk supplied by Murray Goulburn is similar to the average Victorian price paid for manufacturing milk; by making similar adjustments for milk supplied by Bega/Bodalla, the farm gate price is some 20 per cent above the average New South Wales price paid for manufacturing milk in 1989-90. This information is consistent with the new method the Commission has adopted for measuring assistance to market milk production, namely by reference to the cost of manufacturing milk plus an allowance for the cost of assurance of out-of-season supply.
The farm-gate price to Victorian producers embodied in the price tendered by Murray Goulburn suggests that the cost of assurance of out-of-season supply could be quite low for supply from areas favourable for dairy farming. The farm gate price to New South Wales producers embodied in the price tendered by Bega/Bodalla tends to support the Commission's choice of a margin of 20 per cent for the cost of assurance of out-of-season supply. Nevertheless, care would need to be exercised in extending the results of Canberra's experience in tendering for milk supply in view of the constraints imposed by current State arrangements on producers, processors, wholesalers and retailers to organise supply to consumers.

APPENDIX 241
F.3 Nominal rates of assistance to milk production and dairy manufacturing industries
The nominal rate of assistance measures the level of assistance provided to the products of an industry. It is the percentage by which producers' output returns are increased by assistance relative to the situation of no assistance.
Nominal rates of assistance to milk production
Estimates of nominal rates of assistance are made separately for the production of market and manufacturing milk. The nominal rates of assistance to market milk are derived directly from the producer transfers reported in Table F.4.
The nominal rates of assistance for manufacturing milk are derived from the assistance provided manufactured dairy products (see Section F.1). The estimate of assistance to manufacturing milk is made on the basis that dairy product manufacturers pay increased prices for milk for manufacture that reflect the assistance they derive from export subsidies (that is, market support payments received), plus the price support those export subsidies provide to domestic sales for the five main products (that is, producer transfers), less the cost of the market support levy paid on the milk received for manufacturing and used in part, to pay the export subsidies. In order to derive the cost to manufacturing milk producers of funding the export subsidies, the total subsidy payment made by the Australian Dairy Corporation is apportioned between manufacturing milk and market milk relative to their shares in total milk production. Details of the calculation of market support payments and producer transfers for recent years are given in Tables F.1 and F.2.
The net assistance to manufacturing milk production (described above) is used with the local value of manufacturing milk sales, as reported by the Australian Bureau of Statistics, and the market support levy to derive the nominal rate of assistance to manufacturing milk. Estimates of nominal rates of assistance to milk by end use are given in Table F.6, together with those for other agricultural activities and the sector as a whole.
The data in Table F.6 indicate that milk returns are very highly assisted relative to other agricultural activities and that market milk returns are more highly assisted than manufacturing milk returns. The level of assistance to both manufacturing and market milk returns declined sharply over the 1986-87 to 1989-90 period.
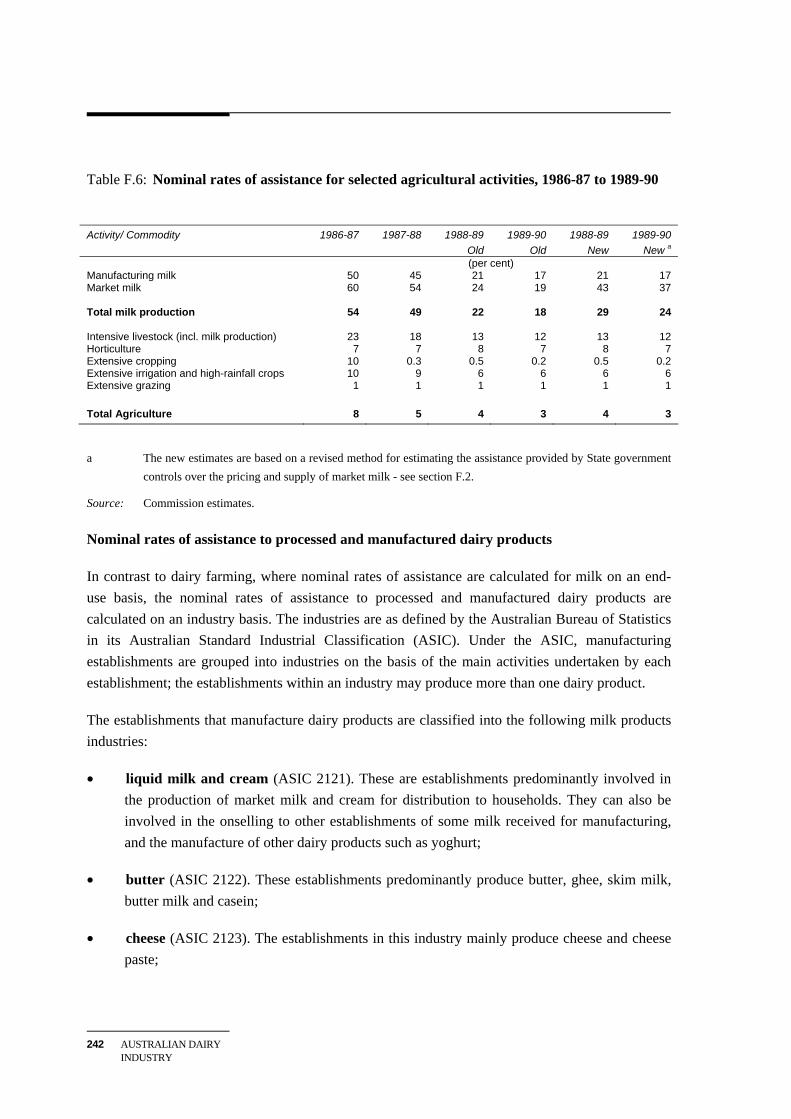
242 AUSTRALIAN DAIRY INDUSTRY
Table F.6: Nominal rates of assistance for selected agricultural activities, 1986-87 to 1989-90
Activity/ Commodity 1986-87 1987-88 1988-89 1989-90 1988-89 1989-90
Old Old New New a (per cent) Manufacturing milk 50 45 21 17 21 17 Market milk 60 54 24 19 43 37 Total milk production 54 49 22 18 29 24 Intensive livestock (incl. milk production) 23 18 13 12 13 12 Horticulture 7 7 8 7 8 7 Extensive cropping 10 0.3 0.5 0.2 0.5 0.2 Extensive irrigation and high-rainfall crops 10 9 6 6 6 6 Extensive grazing 1 1 1 1 1 1 Total Agriculture 8 5 4 3 4 3
a The new estimates are based on a revised method for estimating the assistance provided by State government controls over the pricing and supply of market milk - see section F.2.
Source: Commission estimates.
Nominal rates of assistance to processed and manufactured dairy products
In contrast to dairy farming, where nominal rates of assistance are calculated for milk on an end-use basis, the nominal rates of assistance to processed and manufactured dairy products are calculated on an industry basis. The industries are as defined by the Australian Bureau of Statistics in its Australian Standard Industrial Classification (ASIC). Under the ASIC, manufacturing establishments are grouped into industries on the basis of the main activities undertaken by each establishment; the establishments within an industry may produce more than one dairy product.
The establishments that manufacture dairy products are classified into the following milk products industries:
• liquid milk and cream (ASIC 2121). These are establishments predominantly involved in the production of market milk and cream for distribution to households. They can also be involved in the onselling to other establishments of some milk received for manufacturing, and the manufacture of other dairy products such as yoghurt;
• butter (ASIC 2122). These establishments predominantly produce butter, ghee, skim milk, butter milk and casein;
• cheese (ASIC 2123). The establishments in this industry mainly produce cheese and cheese paste;

APPENDIX 243
• ice cream and frozen confections (ASIC 2124). The establishments predominantly manufacture ice cream and water ice; and
• milk products not elsewhere classified (ASIC 2125). This industry includes establishments which mainly produce other dairy products, including wholemilk powder, infant milk powder and condensed milk.
The nominal rate of assistance for a particular manufacturing industry is an (unassisted output-weighted) average of the particular products produced by establishments in that industry, including both dairy and non-dairy products.
For the liquid milk and cream industry, the simplifying assumption was made that the added cost of market milk assistance is passed on in the sales value of the processed dairy products but does not change the processing margin. The nominal rate of assistance to the processed dairy products was thus derived from their sales value and the assistance provided market milk, details of which are set out in Section F.2.
The average nominal rates of assistance on outputs of the milk products industries are set out in Table F.7.
Table F.7: Average nominal rates of assistance to dairy manufacturing industries, 1986-87 to 1989-90
Industry Average nominal rate on outputs a
ASIC Description 1986-87 1987-88 1988-89 1989-90 1988-89 1989-90 code Old Old New New a (per cent) 2121 Liquid milk and cream 19 16 9 8 13 11 2122 Butter 35 30 18 17 18 17 2123 Cheese 25 18 13 9 13 9 2124 Ice cream and frozen confections 11 8 5 4 5 4 2125 Milk products nec 26 20 12 11 12 11 212 Milk products 23 18 11 9 13 11
Total manufacturing 12 11 10 9 10 9
a The nominal rate of assistance on outputs of an industry is an average of the nominal rates on products made by that industry, weighted by the unassisted value of output for each product. b The new estimates are based on a revised method for estimating the assistance provided by State government controls over the pricing and supply of market milk - see section F.2.
Source: Commission estimates.
For the other milk products industries, nominal rates of assistance are derived from the nominal rates of assistance to individual dairy and non-dairy products. The nominal rates of assistance to individual dairy products are derived directly from the levels of market and supplementary support payments made to export sales, which for the major dairy products are set out in Tables F.1 and F.2.

244 AUSTRALIAN DAIRY INDUSTRY
The data in Table F.7 indicate that the average nominal rate of assistance to the milk products industries was considerably higher than that for manufacturing as a whole during the first two years of the Kerin Plan. However, the average nominal rate of assistance halved over the period 1986-87 to 1989-90 to be similar to total manufacturing. While there are significant differences between milk product industries, the proportional declines in the nominal rates of assistance to the milk products industries were relatively uniform.
F.4 Effective rates of assistance to production of milk and manufacture of dairy products
The effective rate of assistance measures the net assistance to an activity or industry and relates it to the net contribution the activity or industry makes to the economy. Net assistance takes into account the subsidy effect of assistance to output, the tax effect of assistance on intermediate inputs, and the effect of any special measures that influence the use of land, labour or capital in the industry. The net contribution an industry makes to the economy is measured by value added �� the difference between the returns from outputs and the costs of the goods and services purchased from other industries and used to produce these outputs. Value added represents the returns to the use of the nation's resources of land, labour and capital in an industry. Formally, the effective rate of assistance is the percentage by which returns to value added in an industry are increased by net assistance relative to the situation of no assistance. By summarising the net assistance relative to the net contribution of an activity or industry to the economy, effective rates allow comparisons of the extent to which industries within a sector have been advantaged or disadvantaged relative to each other.
The subsidy effect of assistance on output is discussed in Section F.3. The taxing effect of assistance on intermediate inputs and special measures that influence the use of land, labour and capital in the dairy industry are set out below, prior to the derivation of effective rates of assistance.
Few of the interventions that alter the cost of intermediate inputs or directly alter the returns to the factors of production - land, labour and capital - are specific to an individual industry. Thus, to indicate their relative importance to a particular industry involves identifying the industry's use of a particular input or factor of production. It also involves identifying the tax or subsidy effect of their assistance on user industries. Information on the use of individual inputs and factors of production is obtainable from the industry cost structures.

APPENDIX 245
Cost structures
The Commission has used ABARE Dairy Farm Survey results to provide details of the costs of producing milk. The cost structure currently used is based on the Australia average dairy farm costs and returns for the five years 1979-80 to 1983-84. Individual value (or revenue) shares of total farm cash receipts of milk (total dairy receipts), livestock sales (including bobby calves and culled cows), and other livestock products and crop receipts are derived from the details of average farm returns. Similarly, individual cost shares for materials, services, fuel and depreciation are derived from details of average farm costs. The revenue and cost shares derived from the ABARE Dairy Farm Survey results are shown in Figure F1.
Figure F.1: Australian dairy farming cost and revenue share by type
The costs of producing individual products are derived by allocating total dairy farm costs and value added in proportion to individual revenue shares. In this manner milk, which comprises 78 per cent of dairy farm revenue, has been allocated 78 per cent of dairy farm costs; livestock sales which comprise 17 per cent, have been allocated 17 per cent; and so on. The derivation of the costs of producing manufacturing and market milk have been made on the same basis. Thus, in 1989-90 manufacturing milk returns comprised some three-fifths of total milk returns to farmers and three-fifths of the total costs of producing milk have been allocated as the costs of producing manufacturing milk (see Table F.10 below). In this way the costs and returns of other farm outputs, and the co-products and by-products of milk production, have been accounted for in a systematic manner.
Cost shares
A
B
CD
E
A Fuel 4 per cent B Other materials 28 per cent C Services 5 per cent D Depreciation 12 per cent E Value added 52 per cent
Revenue shares
F
GH
I
F Dairy products 78 per cent G Livestock sales 17 per cent H Other 1 per cent I Crop receipts 4 per cent

246 AUSTRALIAN DAIRY INDUSTRY
For the milk products industries, the Commission derived cost structures from the detailed results of the ABS Census of Manufacturing for 1983-84 - the latest detailed cost data available. Details of individual industry revenue and cost shares are confidential.
Input assistance for milk products industries
The taxing effect of assistance on the intermediate inputs of the milk products industries has been calculated in two parts. One part measures the cost of assistance to non-dairy inputs from the measures of the user cost of output assistance for their production. The other part measures the assistance to dairy input.
For the liquid milk and cream industry, the assistance to dairy inputs has been derived directly from the assistance provided market milk (see Section F.2). For the other milk products industries, the cost of assistance to manufacturing milk and other dairy product inputs has been derived from the assistance provided manufactured dairy product outputs and, for butter product inputs, the added cost of the butter levy on domestic sales that applied from 1986-87 to 1988-89 inclusive. As outlined in Section F.3 under ‘Nominal Rate of Assistance to Milk Production’, the cost of assistance to manufacturing milk and other dairy product inputs has been taken as equal to the output assistance derived from the milk products produced by each industry.
The estimates of the combined average nominal rates of assistance to material inputs for the milk product industries are given in Table F.8.
The data in Table F.8 indicate that the taxing effect of assistance to milk products industries is considerably higher than that for manufacturing industries generally. The magnitude of the taxing effect largely reflects dairy assistance. As indicated in Table F.8, the nominal rate of assistance to material inputs declined substantially, and relatively uniformly, across milk product industries between 1986-87 and 1989-90.

APPENDIX 247
Table F.8: Average nominal rates of assistance to material inputs for dairy manufacturing industries, 1986-87 to 1989-90
Industry Average nominal rate on outputs a
ASIC Description 1986-87 1987-88 1988-89 1989-90 1988-89 1989-90 code Old Old Newb Newb
(per cent) 2121 Liquid milk and cream 28 23 14 12 20 16 2122 Butter 41 35 21 19 21 19 2123 Cheese 37 26 20 14 20 14 2124 Ice cream and frozen confections 51 39 27 22 27 22 2125 Milk products nec 51 40 21 20 21 18 212 Milk products 36 28 18 15 20 17 Total manufacturing 7 7 6 6 6 6 a The nominal rate of assistance on materials used by an industry is an average of the nominal rates on materials used by that industry, weighted by the unassisted value of each material used. b The new estimates are based on a revised method for estimating the assistance provided by State government controls over the pricing and supply of market milk - see section F.2.
Source: Commission estimates.
Effective rates of assistance to milk products industries
Effective rates of assistance to the milk products industries have been calculated from the nominal rates of assistance to outputs of the industries, as outlined in Section F.3, industries' cost structures and the nominal rates of assistance to inputs, as outlined above.
The average effective rates of assistance to the milk products industries from 1986-87 to 1989-90 are given in Table F.9. There are no new estimates of effective rates of assistance for liquid milk and cream and for total milk products for 1988-89 and 1989-90 (as there were for the nominal rates of assistance reported in Table F.8) as the new method of estimating assistance to market milk does not influence the estimates of net assistance or value added in processing that milk.
The negative values indicate very low levels of effective assistance to the milk products industries. In large part, the values reflect the assumption, for the liquid milk and cream industry, that assistance to market milk is passed on without addition to the processing margin in the price of dairy output and, for the other milk products industries, that the assistance to the output of dairy products is passed back to dairy farmers without alteration to the manufacturing margin in the cost of assistance to manufacturing milk and other dairy product inputs. The lower effective rates for ice cream and frozen confections over the period 1986-87 to 1988-89, reflect the added costs of the levies on domestic sales of butter products that were used, with similar levies on cheese, to finance supplementary support payments.

248 AUSTRALIAN DAIRY INDUSTRY
Table F.9: Average effective rates of assistance to dairy manufacturing industries, 1986 - 87 to 1989-90 Industry ASIC code Description 1986-87 1987-88 1988-89 1989-90 (per cent) 2121 Liquid milk and cream -3.1 -2.9 -3.0 -3.2 2122 Butter 1.2 1.0 1.4 1.6 2123 Cheese -0.9 -1.2 -1.6 -1.6 2124 Ice cream and frozen confections -22 -17 -13 -10 2125 Milk products nec -21 -16 -4.0 -3.1 212 Milk products -7.6 -6.1 -4.2 -3.7 Total manufacturing 19 19 17 16
Source: Commission estimates.
Input assistance and effective rates of assistance for milk production
The taxing effect on dairy farmers of assistance to materials and tradeable capital input was measured from the user cost of that assistance in a similar manner to that for non-dairy inputs to the milk products industries. In addition, milk production has benefited from Commonwealth Government expenditure to assist Brucellosis/TB eradication, adjustment assistance, research, natural disaster relief and special income tax concessions for primary production. No allowance has been made for the assistance provided dairy farming from State government expenditures to fund such things as research and extension.
Commonwealth Government expenditure for 1989-90 has been allocated as follows:
• assistance provided under the Rural Adjustment Scheme was allocated between agricultural activities according to the enterprise breakup of loans made in 1987-88 (the latest year for which data are available);
• natural disaster relief assistance was allocated to activities according to the individual shares granted in 1989-90;
• taxation concessions are allocated to nine broad agricultural categories (including dairying and pig farming) on the basis of taxable income data provided by the Australian Taxation Office - allocations within a category are made on the basis of an activity's share of the category's value of output;

APPENDIX 249
Table F.10: Assistance to milk production, 1989-90 Manufacturing
milk Market
milk Total
milk production LOCAL VALUE OF OUTPUT ($M) 1058.5 690.5 1749.0Less market support levy a 86.2 31.9 118.1FARM GATE VALUE OF OUTPUT (1) 972.3 658.6 1630.9 Less INPUTS Materials / fuel ($M) 311.1 210.8 521.9 Depreciation ($M) 113.8 77.1 190.8 Services ($M) 52.5 35.6 88.1 VALUE ADDED ($M) 494.9 335.2 830.1 Plus ASSISTANCE TO VALUE ADDING FACTORS ($M) Adjustment assistance 5.3 3.6 8.9 Tax concessions 2.4 1.6 4.0 Research assistance 7.5 5.1 12.6 Natural disaster relief 1.3 0.9 2.2 TOTAL 16.5 11.2 27.7 ASSISTED VALUE ADDED (2) 511.4 346.4 857.8 Less ASSISTANCE TO OUTPUT ($M) Market & supplementary support less market support levy (mfg)b and producer transfers 139.2 175.6 314.8
Export incentives 1.5 0.5 2.1 TOTAL (3) 140.8 176.1 316.9 Less ASSISTANCE TO INPUTS ($M) Brucellosis/TB eradication 0.66 0.5 1.1 Tariffs on materials -7.6 -5.2 -12.8 Tariffs on capital -5.4 -3.7 -9.1 TOTAL -12.4 -8.4 -20.8 Less ASSISTANCE TO VALUE ADDING FACTORS 16.6 11.2 27.7 UNASSISTED VALUE ADDED ($M) (4) 366.5 167.5 534.0 NET SUBSIDY EQUIVALENT ($M) (5) = (2) - (4) 145.0 178.9 323.9
NOMINAL RATE (per cent) (3) /[(1) - (3)]*100 17 37 24
EFFECTIVE RATE (per cent) (5)/(4)*100 40 107 61
Note: Figures may not add due to rounding. a Total market support payments in 1989-90 from the market support levies (refer to Table F.1, column (4))
have been shared between manufacturing and market milk relative to shares in production in order to derive a farm gate value of output net of the levies.
b Output assistance to manufacturing milk includes the total producer transfer (Table F.1, column (7)), plus total market support payments (Table F.1, column (4)) less the contribution made to the market support payments by manufacturing milk. Output assistance to market milk includes the producer transfer as estimated in Table F.5.
Source: Commission estimates

250 AUSTRALIAN DAIRY INDUSTRY
• research assistance included in the estimates covers net government contributions to specified industry research trust funds, direct government funding of CSIRO agricultural research and the Commonwealth Special Research Grants scheme (assumed to cover only sheep, beef, dairying, wheat and sugar) - assistance is allocated between the activities on the basis of their value of output. In 1989-90 CSIRO research for dairying was estimated to be around $11 million; and
• Brucellosis/TB eradication expenditure is allocated between beef and dairying on the basis of cattle numbers.
Details of the contribution of the various forms of assistance to outputs, intermediate inputs and factors of production to milk production, together with the derivation of the nominal and effective rates of assistance are given in Table F.10 for 1989-90. The estimates include the results of the new methodology for determining the assistance provided market milk.
Table F.11: Effective rates of assistance for selected agricultural activities, 1986-87 to 1989-90
Activity/ Commodity 1986-87 1987-88 1988-89Old
1989-90Old
1988-89 New
1989-90New a
(per cent) Manufacturing milk 181 150 51 40 51 40 Market milk >250 205 61 45 137 107 Total milk production 213 171 55 42 77 61 Intensive livestock 71 58 38 30 38 30Horticulture 14 15 17 13 17 13 Extensive cropping 24 3 1 2 1 2 Extensive irrigation and high-rainfall crops 20 19 12 12 12 12
Extensive grazing 6 5 5 4 5 4 Total Agriculture 19 13 10 9 10 9 a The new estimates are based on a revised method for estimating the assistance provided by State government
controls over the pricing and supply of market milk - see Section F.2. Source: Commission estimates.
The effective rates of assistance to milk by end use, and to other agricultural activities and the sector as a whole, for the period 1986-87 and 1989-90 are given in Table F.11.

APPENDIX 251
The data in Table F.11 indicate that milk production is highly assisted relative to other agricultural activities and market milk production is more highly assisted than manufacturing milk production. The data also indicate that there was a considerable reduction in assistance levels over the 1986-87 to 1989-90 period.
Sensitivity analysis
An important assumption in determining the high levels of assistance for manufacturing milk was the assumption that assistance provided manufactured dairy products was fully reflected in the prices paid to farmers for milk used in manufacturing. To the extent that some of the assistance for manufactured dairy products accrues to manufacturing, the estimates of effective assistance to those industries are understated and that for manufacturing milk production is overstated. In order to test the sensitivity of the estimated values for nominal and effective rates of assistance to that assumption, a range of values for the proportion of the total producer transfer on manufactured dairy products that accrued to dairy farmers from between 50 per cent and 100 per cent was tried. A summary of the results is presented in Table F.12.
Table F.12: Sensitivity of estimates of assistance to milk production to different
assumptions regarding the producer transfer from the marketing arrangements for dairy products, 1989-90
Producer transfer
share for milkproduction
Nominal rate Effective rate
(per cent) Market milk - 37 107Manufacturing milk 100 17 40 90 14 31 70 8 18 50 3 7 Total milk production 100 24 61 90 22 54 70 18 43 50 14 33 Source: Commission estimates.
The results indicate that assistance to manufacturing milk production would only be comparable with the assistance provided some agricultural activities, under the extreme and unlikely assumption that half of the gross assistance provided manufactured dairy products accrues to manufacturers of those products. The conclusion remains that milk production is highly assisted.

252 AUSTRALIAN DAIRY INDUSTRY
An important assumption in determining the assistance to market milk was the assumption of an overall average cost of assurance of out-of-season supply of 20 per cent. In order to test the sensitivity of the estimated values of nominal and effective rates of assistance to that assumption, estimates have been made for costs of assurance of out-of-season supply of 10 per cent and 30 per cent. A summary of the results is presented in Table F.13.
Table F.13: Sensitivity of estimates of assistance to milk production to different assumptions regarding to cost of assurance of out-of-season supply for market milk, 1989-90
Cost of assurance
of out-of-season supply
Nominal rate Effective rate
(per cent) (per cent) (per cent) Manufacturing milk - 17 40 Market milk previous 19 45 10 48 169 20 37 107 30 26 69 Total milk production previous 18 42 10 28 73 20 24 61 30 21 50 Source: Commission estimates.
The results indicate that even at a cost of assurance for out-of-season supply of 30 per cent above manufacturing milk prices, production of market milk is highly assisted. Thus, the conclusion remains that market milk production is relatively more highly assisted than manufacturing milk and milk production in total is highly assisted under the current arrangements.

APPENDIX G: ESTIMATING THE EFFECTS OF
253
APPENDIX G: ESTIMATING THE EFFECTS OF IMPLEMENTING THE COMMISSION'S RECOMMENDATIONS
This appendix examines the impacts of the Commission's dairy assistance proposals on the dairy industry and on the Australian economy.1 The proposals which are modelled are the deregulation of farm-gate milk prices and the reduction in market support payments on dairy exports. The framework for analysis is a version of the ORANI model of the Australian economy - called ORANI-F-MILK - which includes considerable detail on the dairy sector. Compared to a similar application of ORANI-F-MILK as reported in the draft report, the present analysis has the advantages of a more accurate data base and more rigorous representation of the proposed reforms. The estimated effects of these reforms are thus more reliable than those reported previously.
Other models of the Australian dairy industry, beside ORANI-F-MILK, have also been used in related analyses. These models - developed by the Australian Bureau of Agricultural and Resource Economics (ABARE) and the Victorian Department of Agriculture - have both strengths and weaknesses compared with ORANI-F-MILK. The Victorian model allows for arbitrage of manufacturing milk prices across States; and the ABARE model incorporates both this feature and interstate trade in market milk. Neither of these linkages are included in ORANI-F-MILK. However, the farm and manufacturing segments of the dairy industry are better integrated in ORANI-F-MILK than in the other models. Moreover, as is explained in this appendix, the findings from the other models largely support the results from ORANI-F-MILK.
G.1 Analytical framework
The ORANI Model
ORANI is a large-scale multi-sectoral model of the Australian economy. It embodies considerable microeconomic detail on the nature of production and demand in the economy, with over 100 industries separately distinguished.2 The model endeavours to capture the links between industries
1 The analysis is based on a report to the Industry Commission prepared by Dr David Johnson of the Institute of Applied Economic and
Social Research.
2 A non-technical description of the model is contained in IAC (1987b). For details, see Dixon, Parmenter, Sutton and Vincent (1982).

254 AUSTRALIAN DAIRY INDUSTRY
which arise from the purchase of each other's outputs of goods and services; from competition for available resources such as labour and capital; and from other constraints that operate generally, such as the Government's fiscal policy settings and the trade balance.
The ORANI model has gained an international reputation as a valuable framework for applied economic analysis but, like any economic model, it has certain limitations and simplifications in its data base and underlying assumptions which must be taken into account when interpreting results. While precision cannot be claimed, the model provides useful indicators of the direction and magnitude of responses to specified economic changes. Qualitative insights from the model usually remain quite robust, even in the light of seemingly significant changes in data or assumptions.
The ORANI framework is especially suited to analysing shocks to the economy �� either policy changes or other developments such as changes in world prices. This type of analysis estimates the effects of the shock being considered in isolation from other influences. Estimates are provided for the outputs of individual industries, imports and exports of different commodities, employment patterns, commodity prices and so on.
ORANI-F-MILK
Many versions of ORANI have been developed for different applications. These include ORANI-F, which is the basis for ORANI-F-MILK. An important feature of ORANI-F is that it is geared toward analysing medium-term effects, after partial adjustment of industry capital stocks.3 This contrasts with standard versions of ORANI, which simulate either short-run effects, before capital stocks can respond, or long-run effects, after capital stocks have fully adjusted. It is possible to operate ORANI-F-MILK in forecasting mode, but the present analysis uses the comparative static version. The analysis conforms in this respect to most other applications of ORANI in Industry Commission reports. However, recent applications have generally examined effects over the long run rather than the medium term which is considered here.
In this appendix, the ‘medium-term’ may be interpreted as about five years after a reform occurs; this is midway toward the ten year period which, according to other Commission analyses with ORANI, is roughly the time required for long-run effects to be realised. To illustrate the concept of a medium-term effect, suppose that a reform scheduled for 1996 is projected to reduce cheese production in the medium term by ten per cent. This means that in 2001, five years after the reform occurs, cheese production will be ten per cent lower than it would be without the reform. For ease of exposition, this result could be described by saying that ‘cheese production decreases by 10 per cent’. However, this type of projection is not a forecast of the change in cheese production over time. The change over time will depend on many influences beside the particular reform being modelled.
3 The ORANI-F model is documented in Parmenter (1988). For a description of ORANI-F-MILK, see Johnson (1991).

APPENDIX G: ESTIMATING THE EFFECTS OF
255
The dairy sector is represented in much finer detail in ORANI-F-MILK than in other versions of ORANI. In the standard model, there is an agricultural industry which produces milk, meat cattle and pigs. The industry's meat cattle comes from culling of the dairy herd, while its pig production reflects an historical usage of skim milk as pig feed. ORANI also recognises a manufacturing industry which produces milk products. For simplicity, each of these industries is seen as producing a single notional commodity; hence, diversity in their products is not modelled. The industries also lack a geographical dimension, which precludes a State-level analysis of government interventions in dairying.
In ORANI-F-MILK, the industry ‘milk cattle and pigs’ is split into a national-level pig industry and State-level farm milk industries. Each of the farm milk industries is assumed to produce two commodities, milk and meat cattle, in fixed proportions. In the data base, milk accounts for about four-fifths of their combined output at the national level. Dairy manufacturing is represented by State-level fluid milk industries - which produce milk for consumption - and by separate national industries for another four products: butter; cheese; ice cream; and milk products nec. The ORANI-F-MILK industries are based on the Australian Standard Industry Classification, which groups establishments with the same product orientation. For convenience, the names of these industries are abbreviated here - for example, ‘fluid milk’ refers to the ASIC category ‘fluid milk and cream’. Apart from the farm-milk industries, each of these dairy industries is treated in the model as a single-commodity producer. The loss of detail is significant for the butter industry, which produces skim milk powder and casein as major co-products.
The activities and commodities representing dairying in the model correspond to different categories of milk in State marketing arrangements. Although it is not possible to establish an exact concordance, the following approximation is a useful guide: ‘market milk’ includes the output of the fluid milk industries and the input to these industries of farm milk; and the input of farm milk to other industries corresponds to ‘manufacturing milk’.
Limitations of ORANI-F-MILK
Apart from the State milk industries and three zonal industries for broadacre agriculture, there is no regional detail in ORANI-F-MILK. Hence, while the model can simulate the impacts of the Commission's proposals on State milk industries, it cannot describe their overall impact on State economies or the likely changes within each State.
There are several other limitations of the theory of ORANI-F-MILK which should be noted. First, it is assumed that land inputs to farm milk industries are fixed, precluding transfers of land input between dairying and other activities. This does not mean, however, that the outputs of these industries are fixed, since the model allows for substitution between land and other factors. Moreover, the assumption may be reasonable for regions with a strong comparative advantage in dairying, even though in other regions, a reduction in demand for dairy products may divert land to other uses.

256 AUSTRALIAN DAIRY INDUSTRY
Second, the model does not allow for interstate trade in market milk; that is, sales of farm milk to the fluid milk industry occur only within a State. While this approximates the current situation, interstate trade could expand somewhat if restrictions on such trade were removed.
Third, the model requires each dairy manufacturing industry to source its milk input from different States according to the proportions observed in recent years. For example, the butter industry is constrained to purchase 90 per cent of its milk input from Victoria, regardless of relative milk prices. Butter and other nonfluid dairy products tend to be manufactured close to the source of milk supply to minimize transport costs. Interstate trade in manufacturing milk is thus quite limited despite being unrestricted. Thus, the assumption on the sourcing of milk is nearly tantamount to a fixed geographic distribution for the processing of each product. In terms of the above example, this would mean that Victoria has a fixed 90 per cent share of butter production. Put this way, the assumption is clearly inappropriate to the long run, after sufficient time has elapsed for plants to relocate. Moreover, the assumption is questionable even for shorter time frames, since the utilisation of plants can vary and interstate trade in manufacturing milk occurs and could expand.
Fourth, being a purely annual model, ORANI-F-MILK does not address seasonality. Production costs are higher in months of low pasture growth, and this would influence interstate trade in market milk without current restrictions on such trade. However, while a rigorous treatment of seasonality in ORANI-F-MILK would require a major overhaul of the model, an ad hoc adjustment is possible. This would assign higher production costs to market milk, which must be supplied throughout the year, than to manufacturing milk which can be supplied seasonally.
Fifth, the model cannot easily represent import quotas on cheese, which are ignored in the present analysis. This limitation has some relevance to the analysis even though simulations for the Commission's tariff proposals are not conducted. This is because the demand for imports would be reduced by the proposed reforms to marketing arrangements. The price of domestically produced cheese would fall, encouraging a shift away from imports. If import quotas are biting, a fall in import demand may have a relatively small effect on the quantity imported. Hence, by ignoring the quotas, the effects of the reforms on import quantities and domestic production may be overstated. Nevertheless, if domestic and imported cheese are weak substitutes, as the model assumes, this particular bias is small. (Given weak substitution, a fall in the domestic price causes a relatively moderate drop in import demand.)
The data base
Data for the simulations in this appendix were obtained from the ORANI-F-MILK data base and from the Industry Commission's assistance measurement data base.

APPENDIX G: ESTIMATING THE EFFECTS OF
257
Data for ORANI are mainly sourced from input-output tables for a given year. Because these tables are not available until several years after the reference year, it is inevitable that the ORANI data base is not as recent as may be desirable. However, structural trends in the economy may be sufficiently slow in many cases to cause relatively small distortions to ORANI results. This is because, while the effects of inflation have led to major changes in price levels, cost and sales shares remain relatively stable in most cases. It is these shares which are used principally in the ORANI model. Apart from trends, transitory factors such as business cycle effects could make the input-output tables for a given year atypical of other years. It is not feasible to purge the ORANI data base of all transitory influences. However, some adjustments are made to impose typical year conditions in agriculture, where prices and weather conditions can vary greatly from year to year.
No such adjustments have been made to the additional data utilised for ORANI-F-MILK, which augment the ORANI data base for 1980-81. The findings which are reported here may be slightly biased as a result. Other limitations of the ORANI-F-MILK data base were noted by the Australian Dairy Corporation (Submission 62). One of these criticisms - the claim that the export share of dairy sales was too low - was found to be unsubstantiated. Others, while valid, have little significance in the present context. Nevertheless, several of the errors identified have been remedied in the version of ORANI-F-MILK used here. The import shares of domestic expenditure now vary between dairy products, being 10.4 per cent for cheese and under 1.0 per cent for each other product. In the version of ORANI-F-MILK used for the draft report, the same overall import share of 2.5 per cent was applied to each dairy commodity. From information provided by the Corporation (see Submission 62), revisions have also been made to the split of consumption expenditure by dairy commodity, and to intermediate sales of dairy commodities by purchasing industry.
Among refinements to the data base that could not be made is the incorporation of milk volume weights. In the model, the percentage change in State farm milk production is a weighted average of the percentage change in the volumes sold to different users. This equation uses appropriate value weights, rather than the volume weights, despite differences in these weights arising from the price premium for market milk. Moreover, for seasonality to be introduced in the way described above, it would also be necessary to include cost-based weights. This is because the inputs demanded for milk production would depend not only on the volume of milk, but on its composition between manufacturing milk and the higher cost market milk. The absence of these cost-based weights in ORANI-F-MILK has thus precluded this approach. However, neither this problem, nor the lack of volume weights, poses a major bias for the present analysis.
Elasticities used
Apart from data on revenue and expenditure flows, the data base for ORANI-F-MILK contains numerous elasticity parameters which describe, for each commodity, the production technology and the demands for household and export use.

258 AUSTRALIAN DAIRY INDUSTRY
In the original ORANI-F-MILK used in the draft report, these elasticities were assigned the same value as for the corresponding commodity in the ORANI data base. Thus, for each manufactured dairy product, the demand elasticities had the same value as for ‘milk products’ in ORANI. The own-price elasticity of consumer demand for these products was -0.06, which implies that changes in price have negligible effects on demand. It means, for example, that a 20 per cent increase in the price of butter would reduce the quantity of butter demanded by consumers by only 1.1 per cent. The same quantitative relationship applied to other milk products such as fluid milk. In addition, it was assumed that changes in the price of any one dairy product have no effect on consumer demand for other dairy products.
The latter assumption (of zero cross-price effects) has been retained in the version of ORANI-F-MILK used here. However, the own-price elasticities have been changed to -0.15 for fluid milk and to -0.25 for other dairy products. These are best-guesses based on various econometric studies, reviewed in Davidson et al (1989). Note that the implied responses to changes in price are inelastic, but less so than was assumed previously.
For dairy exports, the demand elasticity with respect to the export price is assumed to be -20, which means that even small changes in the export price cause proportionately large changes in quantity demanded. For example, a 5 per cent increase in the export price would see a reduction in the quantity demanded of 62 per cent. Note that the export price in ORANI-F-MILK depends on production costs and on taxes or subsidies for dairy exports. Thus, the model does not strictly enforce the ‘small country assumption’, under which prices for Australian dairy exports are not influenced by Australian conditions. However, because the export demand elasticity is so high, the small country assumption is largely approximated. Specifically, simulations with the model tend to show small effects on the export price arising from shifts in dairy assistance arrangements.4
In both ORANI and ORANI-F-MILK, the import substitution elasticity for dairy products is 2.0. This parameter describes the response of consumers to a change in the price of the domestic product relative to imports. With a value of 2.0, a one per cent decrease in the relative price of the domestic product causes a two per cent increase in the relative quantity of the domestic product demanded. This fairly modest substitution response is plausible, since imports of dairy products consist mainly of cheese, and many imported cheeses are distinctive varieties not produced in Australia.
The output supply elasticities in ORANI are implied by other parameters which describe technology and production costs. For the agricultural commodity, ‘milk cattle and pigs’, the supply elasticities are 1.1 for the short run and 4.7 for the long run.
4 Other models of the Australia dairy industry have similar treatments of exports. Export prices are assumed fixed at world prices in
Beare et al. (1989), while an elasticity of -100 is assumed for export-derived demand for milk in Wilcox and Bardsley (1990).

APPENDIX G: ESTIMATING THE EFFECTS OF
259
Thus, in the model, a one per cent increase in the price of this commodity stimulates a long-run increase in its supply of 4.7 per cent (Higgs 1986). This increase is possible despite the assumption of fixed land input, since the model allows for considerable substitution in the long run between land and other primary factors (capital and labour). In the short run, both land and capital inputs are assumed fixed, so that the scope for substitution is more limited and the supply elasticity is correspondingly lower. It is also to be noted that the parameter governing possibilities for factor substitution is assigned the same synthetic value for each industry in the model. Thus, the value for the dairy industry is not based on evidence specific to that industry, and the associated supply elasticity is highly conjectural.
In the ORANI-F-MILK model used for the draft report, the input substitution parameters were the same as in ORANI, resulting in identical supply elasticities for a given industry and time frame. However, the supply elasticities for the farm milk industries were lower than those for the milk cattle and pig industry in ORANI. The reason for this is that pig production is treated in ORANI-F-MILK as non-land using; hence, land constraints are more important for the farm milk industry than for the broader ORANI industry which produces pigs and farm milk. For the long run, the supply elasticity for farm milk industries was 3.2 (with minor variation between States); this compares with a value of 3.0 obtained by Topp et al (1989) in their programming model of the Victorian dairy industry. By contrast, the Australian Dairy Corporation suggested estimates in the order of 0.1 to one, based on a survey of international studies. The Commission judges that the true elasticity could well exceed the upper bound of this range, but is unlikely to be as large as three. For the simulations in this appendix, the Commission's preferred long-run elasticity of farm milk supply is 1.5. This elasticity has also been used to determine the supply response over the medium term.
Assistance levels in the data base
Data on government assistance to dairying are largely absent in the ORANI-F-MILK data base. (The only form of assistance which is clearly measured is tariff protection.) For the present analysis, data on assistance from State and Commonwealth marketing arrangements have been obtained from the Industry Commission's assistance measurement data base for 1989-90.
Rates of market support payments on exports were estimated for industry categories in ORANI-F-MILK as production-weighted averages of rates on individual products. For milk products nec., for example, rates were averaged over products such as whole milk powder and condensed milk powder. For some products, such as infant milk powder, estimates were inferred from support provided other products. For the products which together account for most export sales, the data used were from the Australian Dairy Corporation (see Appendix F).

260 AUSTRALIAN DAIRY INDUSTRY
It should be emphasized that no adjustments were made to the ORANI-F-MILK data base to achieve consistency with the Industry Commission data and that, because of this, the findings in this appendix understate the overall gains to the economy from eliminating price distortions in the dairy industry.5 That said, it should also be noted that such gains are necessarily small, due to the small size of the dairy sector. Moreover, the inconsistencies between the two data sets should not significantly affect the findings for the dairy sector itself.
G.2 The simulations
ORANI-F-MILK is used in this analysis to simulate the impacts of the following reforms:
• phasing down market support payments under the Kerin Plan to 5 per cent of average export returns by 1996;
• the above reform together with complete deregulation of farm gate prices for market milk by 1999.
The marketing arrangements are described in detail elsewhere in this report (Appendices C and E). Briefly, the Kerin Plan provides subsidies on dairy product exports which are financed by a levy on all milk. The rate of export subsidy, expressed as a per cent of fob export returns realised, varies between categories of dairy exports. For the industry categories in ORANI-F-MILK, 1989-90 estimates are 18.3 per cent for butter, 11.4 per cent for milk products nec., and 10.7 per cent for cheese.6 Farm gate prices for market milk are regulated in each State and are set well above the unregulated prices for manufacturing milk. In 1989-90, the price premium for market milk was about 60 per cent on average. In New South Wales, Queensland and Western Australia, farmers hold quota entitlements to sell market milk. Trade in these entitlements is largely unrestricted and farmers can also sell manufacturing milk at the lower unregulated price. For the other States, Victoria, South Australia and Tasmania, the authorities operate a revenue pool, into which all revenue from farm milk sales is received and from which farmers are paid a uniform price on all milk produced.
5 This problem can be expressed in somewhat simplified terms as follows. Since the rate of government assistance to the dairy industry
exceeds the average rate of assistance for the economy overall, there are currently incentives for over-production in dairying. Hence, reduction in dairy assistance should benefit the economy through an improved allocation of resources. The ORANI-F-MILK date base is not sufficiently detailed to represent the extent of assistance to the dairy industry. Although it is possible to use Industry Commission data to calculate the reduction in assistance due to a reform, and to feed this figure into ORANI-F-MILK, the simulation results will understate the true welfare gains.
6 The estimate for milk products nec. Has been revised from 14.4 per cent in the draft report. Partly because of this change, the
estimated impacts of the proposed reforms on output of these products differs from the estimates in the draft report.

APPENDIX G: ESTIMATING THE EFFECTS OF
261
The uniform, or ‘pooled’, price is equal to total revenue per unit of milk, and is thus a weighted average of the prices to different customers - the market milk price to fluid milk industries and the manufacturing milk price to other purchasers.
The analysis in this appendix does not use ORANI-F-MILK to consider other recommendations in this report, apart from the two mentioned above. (Recall that deregulation of interstate trade in market milk cannot be represented in ORANI-F-MILK as currently structured.) Note as well that, in the more extensive reform examined, farm gate prices are completely deregulated in all States. The impacts of any one State acting independently are not modelled.
The impacts of the Commission's recommendations were examined with the ORANI-F-MILK model using five reform simulations or scenarios. The scenarios modelled are as follows:
Scenario A: Reduction in the rate of market support on exports under the Kerin Plan to 5 per cent in 1996; purchasers farm gate price for market milk stays the same in each State.
Scenario B: Same as A, except that each State maintains a constant ratio between purchasers farm gate prices for manufacturing and market milk (with prices measured gross of the market support levy).
Scenario C: Reduction in the rate of market support on exports under the Kerin Plan to 5 per cent in 1996; complete deregulation of farm gate prices for market milk in all States; farm gate price of market milk remains 20 per cent above the manufacturing milk price after deregulation.
Scenario D: Same as C, except that farm gate prices for market milk are only 10 per cent above the manufacturing milk price after deregulation.
Scenario E: Same as C, except that farm gate prices of market and manufacturing milk are the same after deregulation.
For the reform to the Kerin Plan only (scenarios A and B), allowance is made for possible adjustments to the price of market milk by State authorities. The effects of this reform are independent of the party which formally pays the market support levy which, in the simulations, is assumed to be the buyer. In scenario A, the purchasers price of market milk (inclusive of the levy) is held fixed, whereas, in scenario B, it is held in nearly fixed proportion to corresponding price for manufacturing milk. (A constant ratio is assumed between the purchasers prices gross of the levy.) The difference in scenarios is significant, since it can be anticipated that a cut in market support payments will reduce the purchasers price for manufacturing milk.

262 AUSTRALIAN DAIRY INDUSTRY
Another important issue is whether deregulation of farm gate prices for market milk would eliminate the current differential between market and manufacturing milk prices (scenario E). Because of the additional costs involved (see Section 4.7.1), the price of milk produced out of season is likely to be higher than the price of milk produced in season. As most milk produced in season is used for manufacturing purposes and most produced out of season is for market milk, seasonal differences in milk prices have been represented, for illustrative purposes, by setting the market milk price at 20 per cent above the manufacturing milk prices in scenario C and at 10 per cent in scenario D. In the simulations for these scenarios, no adjustments have been made to capture the underlying difference in production costs due to the weighting problem mentioned before. However, as was previously noted, this does not appear to be a major source of bias.
It is assumed for each of the scenarios that certain elements of the economy are unaffected by the reforms considered. The following assumptions apply:
• real wages adjust with occupational wage relativities held fixed, to maintain constant aggregate employment;
• the real exchange rate adjusts to maintain a constant balance of trade;
• the real government budget deficit does not vary; and
• the ratio of investment to the capital stock in each industry stays the same.
It is also assumed that, in the absence of the reforms considered, assistance to the dairy sector would remain at 1989-90 levels; that is, that there would be no changes in the price differentials between market and manufacturing milk, in market support payments as a proportion of export returns, or in the ad valorem equivalent of the milk levy. As world prices for dairy products were neither particularly depressed nor buoyant in that year, this assumption is fairly reasonable.
Before turning to the findings, there is another aspect of the simulations which must be addressed. This concerns the milk price which determines farm milk supply. For States which operate pooling arrangements - namely, Victoria, South Australia and Tasmania - it is assumed to be the average or pooled price, while for the other States, where quotas operate, it is assumed to be the manufacturing milk price. In each case, it is the return to an individual producer from an additional litre of milk. With tradable quotas on market milk, the price of a quota entitlement is the price premium for market over manufacturing milk. (For ease of exposition, it is assumed here and in the rest of this section that there is no seasonal price differential for market milk.) Thus, the return to a litre of market milk, net of the cost of the entitlement, is simply the manufacturing price. In other words, the farmer's marginal return under quota schemes is the manufacturing milk price, regardless of the purchasing industry.
The significance of this point is that deregulation of farm gate prices for market milk will have opposite impacts on milk production, depending on whether pooling or quota arrangements apply. With no seasonal price differential, the effect of deregulation is to reduce the market milk price to

APPENDIX G: ESTIMATING THE EFFECTS OF
263
the manufacturing milk price. Note, however, that the manufacturing milk price will also be affected. To see this, consider what happens in a State eliminating quotas if the price of market milk price declines whilst the manufacturing milk price stays the same. In this hypothetical case, there will be no change in total milk supply or in the demand for manufacturing milk. However, with the cut in the price of market milk, demand for market milk increases. With an unchanged total supply of milk, this means that less manufacturing milk is available. With demand for manufacturing milk unchanged, the result would be a shortage. In reality, a rise in the price of manufacturing milk would prevent such an outcome, and this would stimulate total milk supply. Hence, elimination of quota arrangements tends to increase total milk production.
For the case where pooling arrangements are abolished, suppose again that the manufacturing milk price does not change. Under these circumstances the demand for market milk rises, while the total supply of milk decreases due to a fall in the pooled price. As before, manufacturing milk would be in short supply, which is why its price would actually increase. The higher price of manufacturing milk would moderate the fall in the pooled price. But the net effect on the pooled price would be negative, so that total production would decrease.
An important observation in this context is that the bulk of Australian milk production occurs in States with pooling (72 per cent in 1989-90). Hence, if all States were to deregulate farm gate prices for market milk, total Australian production could be expected to decrease. Further, under the assumptions of ORANI-F-MILK - which exclude interstate trade in market milk - there would be significant cross-State effects. Deregulation in any one State would reduce the supply of manufacturing milk, thus reducing total output of manufactured dairy products (excluding fluid milk). Given the assumption in ORANI-F-MILK that each of these products uses milk from different States in fixed proportions, this means that demand for manufacturing milk would fall in all States. As a consequence, universal deregulation could be projected to reduce farm milk production in a quota State, even though similar reform in that State alone would be estimated to have the opposite effect.
G.3 Estimated impacts of the proposed reforms
Impacts on the dairy sector of reform to the Kerin Plan
Scenario A
The proposed phase-down of the Kerin Plan, taken on its own, is estimated to cause modest declines in farm milk production (Table G.1). Without any adjustment to purchasers prices for market milk, demand for market milk stays unchanged. However, the cut to the export subsidy would lead to an estimated 13 per cent fall in dairy exports. The consequent decline in the output of manufactured milk products would not be offset by the reduction in the market support levy.

264 AUSTRALIAN DAIRY INDUSTRY
Essentially, the levy is a tax on domestic sales of milk products. As domestic demand is price inelastic, the reduction in the levy does relatively little to stimulate domestic demand. The proposed reform to the Kerin Plan would thus reduce output of manufactured dairy products (excluding fluid milk) on average by an estimated 3.5 per cent. Farm milk production would decline in consequence by an estimated 2.1 per cent (Table G.1).
Table G.1: Estimated medium-term effects of proposed reforms to dairy assistance on outputs of dairy-related industries
Scenario
A B C D E (per cent changes)
NSW farm milk 0.2 0.1 0.3 0.4 0.4VIC farm milk -4.1 -5.2 -7.9 -8.6 -9.3QLD farm milk 0.3 -0.5 -0.7 -0.8 -0.8WA farm milk 0.3 0.2 0.3 0.3 0.3SA farm milk 1.8 1.1 -1.7 -2.2 -2.7TAS farm milk -0.4 -1.6 -5.3 -6.1 -7.0Total farm milk -2.1 -2.8 -4.6 -5.0 -5.4Total agriculture and forestry 0.2 -0.2 -0.2 -0.2 -0.3 NSW fluid milk .. 0.2 1.4 1.7 2.0VIC fluid milk .. 0.4 1.2 1.5 1.8QLD fluid milk .. 0.2 1.9 2.2 2.6WA fluid milk .. 0.2 1.7 2.0 2.3SA fluid milk .. 0.2 1.5 1.7 2.0TAS fluid milk .. 0.3 1.8 2.1 2.4 Butter -22.3 -23.7 -25.4 -26.1 -26.9Cheese 3.8 2.1 -4.9 -6.3 -7.7Ice cream 0.5 0.5 0.4 0.4 0.4Other dairy products nec 5.6 4.1 2.3 1.5 0.7 Total dairy manufacturing 0.2 -0.5 -2.5 -3.0 -3.5 Total food manufacturing 0.1 .. .. -0.1 -0.1
.. Between - 0.05 and 0.05 per cent.
Source: Commission estimates.
With total demand for manufacturing milk thus lower, its farm gate price to the producer is estimated to fall by 1.0 per cent nation-wide (see Table G.2). In States with pooling arrangements, the producers price for milk is simply the pooled price, received for both manufacturing and market milk.

APPENDIX G: ESTIMATING THE EFFECTS OF
265
Hence, the estimated effects of reform on producers prices for manufacturing milk in these States are shown under ‘producers price’ in Table G.2. For States with quota arrangements, the ‘producers price’ is again used to refer to the producers price for manufacturing milk, which differs in this case from the producers price for market milk. The reason for this usage is that in these States the marginal return from milk production, net of quota costs, is the manufacturing milk price (see above).
Table G.2: Estimated medium-term effects of proposed reforms to dairy assistance on farm gate milk prices
Scenario
A B C D E (per cent changes)
New South Wales Producers price 1.2 1.2 1.5 1.5 1.6 Purchasers price-market 0.0 -3.2 -27.6 -33.1 -38.6 Purchasers price-manufacturing -5.3 -5.3 -5.0 -5.0 -4.9 Victoria Producers price -2.7 -.5 -.5 -6.0 -6.6 Purchasers price market 0.0 -7.4 -24.4 -30.2 -36.7 Purchasers price manufacturing -9.5 -9.0 -8.0 -7.4 -6.7 Queensland Producers price 1.4 1.2 1.2 1.2 1.1 Purchasers price-market 0.0 -3.4 -32.3 -37.6 -42.7 Purchasers price-manufacturing -5.5 -5.7 -5.7 -5.7 -5.8 Western Australia Producers price 1.6 1.5 1.7 1.7 1.8 Purchasers price-market 0.0 -3.2 -29.1 -34.4 -39.5 Purchasers price-manufacturing -5.3 -5.4 -5.2 -5.2 -5.1 South Australia Producers price 1.7 1.1 -0.9 -1.3 -1.6 Purchasers price-market 0.0 -2.3 -21.3 -25.2 -29.0 Purchasers price-manufacturing -6.7 -5.0 15.8 20.1 24.3 Tasmania Producers price 0.2 -0.7 -3.6 -4.2 -4.9 Purchasers price-market 0.0 -4.2 -33.5 -38.4 -43.9 Purchasers price-manufacturing -6.8 -6.7 -1.7 -1.1 -0.3 Australiaa Producers price -1.0 -1.6 -2.9 -3.3 -3.5 Purchasers price-market 0.0 -4.3 -27.5 -32.2 -38.4 Purchasers price-manufacturing -8.6 -8.2 -6.3 -5.6 -4.9
a Calculated as weighted averages of the State-level effects, with weights equal to the value of milk production in 1989-90 (total milk value for producers price; market milk value for purchasers price of market milk; and manufacturing milk value for purchasers price of manufacturing milk).
Source: Commission estimates.

266 AUSTRALIAN DAIRY INDUSTRY
Owing to the reduction in the levy, purchasers prices of manufacturing milk are projected to decline by more than producers prices - on average, by 8.6 per cent at the farm gate. (Recall that the purchasers price is inclusive of the levy.) By the same token, the producers price for market milk is projected to increase, though the purchasers price is assumed constant.
The projected fall in cost of milk input provides a stimulus to the manufacture of dairy products other than fluid milk, which partly offsets the reduction in the export subsidy. This explains the small projected increase in production of ice cream, for which exports are too minor to be recorded in the data base. For cheese and milk products nec., the loss of export subsidy is outweighed by the decline in input cost, resulting in increased exports - accordingly, output of these commodities is expected to expand by 3.8 per cent and 5.6 per cent, respectively. At 1989-90 assistance levels, butter receives the highest rate of export subsidy, so that the proposed cut in the subsidy rates to a uniform 5 per cent would discourage butter production in particular. Indeed, the butter industry is the only segment of dairy manufacturing for which this reform is estimated to curtail production. The estimated contraction of the industry is appreciable (22 per cent), due to its heavy reliance on export sales. In the ORANI-F-MILK data base, exports as a share of sales are 42 per cent for butter industry, compared with under 25 per cent for cheese and milk products nec.
As one would expect, scaling down the market support payments is projected to have uneven impacts across States. The butter industry is a major user of milk produced in Victoria and, to a lesser extent, in Tasmania. In the data base, its share of farm milk sales in these States is 25 per cent and 12 per cent, respectively. This compares with under 4 per cent elsewhere. Thus, reform to the market support payments is projected to reduce farm milk production in Victoria (4.1 per cent) and less so in Tasmania (0.4 per cent). For other States, increases in farm milk output are projected.
Scenario B
In scenario B, reform to the market support payments leads to a reduction in the purchasers price of market milk. However, since consumer demand for market milk is assumed weakly responsive to changes in price, it is projected to increase only slightly. Hence, little change is indicated in the output of fluid milk industries. For other industries as well, the output projections are only slightly changed from scenario A, where the purchasers price of market milk was assumed to remain unchanged. The fall in the price of market milk (B versus A) contributes to a decline in the producers price in States with pooling arrangements. Accordingly, the drop in the average producers price is marginally greater than in scenario B (1.6 versus 1.0 per cent), as is the contraction of farm milk output (2.8 versus 2.1 per cent).

APPENDIX G: ESTIMATING THE EFFECTS OF
267
Impacts on the dairy sector of more extensive reform
Scenarios C, D and E
When the proposed reform to the market support payments (reduction to 5 per cent) is coupled with deregulation of farm gate prices for market milk (scenarios C, D and E), the estimated shrinkage of the dairy sector is increased. Comparison of the estimates for these scenarios with those for A and B reveals the effect of deregulation on its own. As expected, the added effects of deregulation increase as the assumed seasonal difference in milk prices diminishes. Thus, largest estimates are for scenario E, which assumes no seasonal price differential. In respect of farm milk production Australia-wide, this scenario indicates a decline of some 3 per cent (E versus A) from deregulation, rising to 5.4 per cent when deregulation occurs with reform of the market support payments.
The effects of deregulation on farm milk production are negative in States with pooling arrangements. The largest declines are estimated for the States most dependent on manufacturing milk sales, Victoria and Tasmania. Declines in farm milk production of up to 9.3 per cent and 7.0 per cent, respectively, are projected for these States (compare E versus A). South Australia also operates a pooling system but does not specialize in manufacturing milk, so its milk production is estimated to decline by less (2.7 per cent at most). In line with the theoretical discussion in Section G.1, the marginal effects on farm milk production are less adverse in States with quota arrangements. They are slightly negative in Queensland, due to cross-State effects, and slightly positive in New South Wales and Western Australia. For Australia, it is estimated that the additional loss in farm milk production from deregulation is between 2.5 and 3.3 per cent.
Deregulation is projected to reduce the cost of market milk by up to 38 per cent on average. However, with demand being price-inelastic, the consequent increase in consumption of fluid milk is estimated at under 3 per cent. This increase, combined with a fall in total milk production, reduces the quantity of manufacturing milk. Accordingly, deregulation of farm gate prices is estimated to reduce the output of nonfluid milk products by as much as 3.7 per cent overall (E versus A). Among individual commodities, the largest loss is some 12 per cent for cheese. However, deregulation combined with the reform to the market support payments would reduce production of butter by a much larger proportion than that of cheese - in scenario E, for example, by 27 per cent and 8 per cent, respectively. For the other nonfluid milk commodities - ice cream and milk products nec. - small increases in output are projected under the reform package.
The fall in the output of nonfluid milk products from deregulation is prompted by a rise in the price of manufacturing milk (compare C, D and E with A and B in Table G.2). In the quota States, the manufacturing milk price is the price which governs supply decisions for farm milk. Hence, since output of farm milk in these States is projected to be little affected by deregulation, so is the manufacturing milk price. Elsewhere, the manufacturing milk price is expected to increase by as much as 2.8 per cent in Victoria and 6.5 per cent in Tasmania.

268 AUSTRALIAN DAIRY INDUSTRY
These figures contrast with a much larger increase projected for South Australia (up to 29 per cent). As was noted by the South Australian Government, such a large increase in its local manufacturing price relative to prices elsewhere is unlikely to occur. Not only are there opportunities for interstate trade in manufacturing milk, but the processing of nonfluid milk products can be relocated over the longer run. These pressures toward price uniformity are not captured in ORANI-F-MILK. By assumption each industry sources its milk input in fixed proportions from different States, so that prices for manufacturing milk can vary widely without demand for this input falling sharply where prices are high.7 Findings from another model which is not limited by this restrictive assumption are examined below, and largely corroborate the ranking of State impacts implied by ORANI-F-MILK.
Beside the absence of such arbitrage, there are several other limitations of the current analysis which deserve comment. Land inputs to the farm milk industry have been assumed fixed, though the reforms under scrutiny could be expected to divert land to other uses. The losses in dairy production could thus be larger than estimated here. But this does not imply a larger welfare loss to farmers. On the contrary, opportunities for land diversion could cushion the fall in land values, thereby reducing the farmers' welfare loss. In the simulations reported here for Scenario E, the value of dairy farm land declines by 25 per cent in Victoria and by 19 per cent in Tasmania.
It should also be kept in mind that the analysis concerns the medium-term effects of reform, before capital stocks fully adjust. Because the proposed reforms to the dairy sector would lower the returns to dairy production for a given investment, they would reduce the dairy sector's demand for capital inputs. In the simulations with ORANI-F-MILK, the estimated declines in dairy capital stocks are substantial - for the Victorian farm milk industry, they are as high as 10 per cent (scenario E, Table G.3). Real rates of return on dairy capital are projected to fall sharply below the competitive levels needed to attract capital in the long run. This point is illustrated by the results for the Victorian farm milk industry in scenario E (Table G.3). These imply that if the competitive rate of return is, say, ten per cent, the return to the industry would decline to five per cent.
7 The anomalous price result for South Australia can be explained with reference to Scenarios A and E. According to the findings for
these scenarios in Table G.1. deregulation reduces the supply of farm milk from South Australia by 4.5 per cent (E versus A). Consistent with this modest supply response, the local producers price is estimated to fall by only 3.3 per cent (Table G.2). In turn, for the producer price to decline no more than this, the large fall in the market milk price which is the outcome of deregulation must be offset by a large rise in the price of manufacturing milk. This mechanism is far less operative in other States with pooling arrangements, owing to their specialisation in manufacturing milk. In these States – Victoria and Tasmania – even a large fall in the market milk price occasions only a modest decline in the producers price. In addition, the producer’s price is estimated to decline by a larger percentage in these States than in South Australia, in line with the differential output effects.
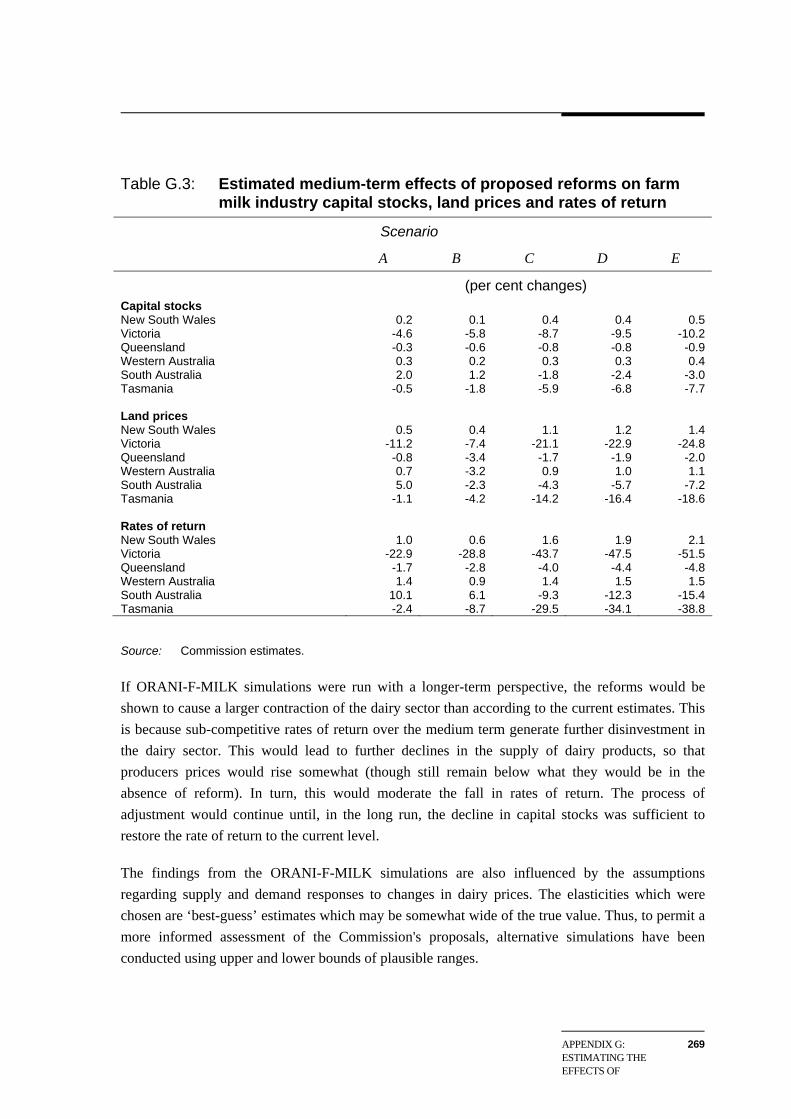
APPENDIX G: ESTIMATING THE EFFECTS OF
269
Table G.3: Estimated medium-term effects of proposed reforms on farm milk industry capital stocks, land prices and rates of return
Scenario
A B C D E (per cent changes)
Capital stocks New South Wales 0.2 0.1 0.4 0.4 0.5 Victoria -4.6 -5.8 -8.7 -9.5 -10.2 Queensland -0.3 -0.6 -0.8 -0.8 -0.9 Western Australia 0.3 0.2 0.3 0.3 0.4 South Australia 2.0 1.2 -1.8 -2.4 -3.0 Tasmania -0.5 -1.8 -5.9 -6.8 -7.7 Land prices New South Wales 0.5 0.4 1.1 1.2 1.4 Victoria -11.2 -7.4 -21.1 -22.9 -24.8 Queensland -0.8 -3.4 -1.7 -1.9 -2.0 Western Australia 0.7 -3.2 0.9 1.0 1.1 South Australia 5.0 -2.3 -4.3 -5.7 -7.2 Tasmania -1.1 -4.2 -14.2 -16.4 -18.6 Rates of return New South Wales 1.0 0.6 1.6 1.9 2.1 Victoria -22.9 -28.8 -43.7 -47.5 -51.5 Queensland -1.7 -2.8 -4.0 -4.4 -4.8 Western Australia 1.4 0.9 1.4 1.5 1.5 South Australia 10.1 6.1 -9.3 -12.3 -15.4 Tasmania -2.4 -8.7 -29.5 -34.1 -38.8 Source: Commission estimates.
If ORANI-F-MILK simulations were run with a longer-term perspective, the reforms would be shown to cause a larger contraction of the dairy sector than according to the current estimates. This is because sub-competitive rates of return over the medium term generate further disinvestment in the dairy sector. This would lead to further declines in the supply of dairy products, so that producers prices would rise somewhat (though still remain below what they would be in the absence of reform). In turn, this would moderate the fall in rates of return. The process of adjustment would continue until, in the long run, the decline in capital stocks was sufficient to restore the rate of return to the current level.
The findings from the ORANI-F-MILK simulations are also influenced by the assumptions regarding supply and demand responses to changes in dairy prices. The elasticities which were chosen are ‘best-guess’ estimates which may be somewhat wide of the true value. Thus, to permit a more informed assessment of the Commission's proposals, alternative simulations have been conducted using upper and lower bounds of plausible ranges.
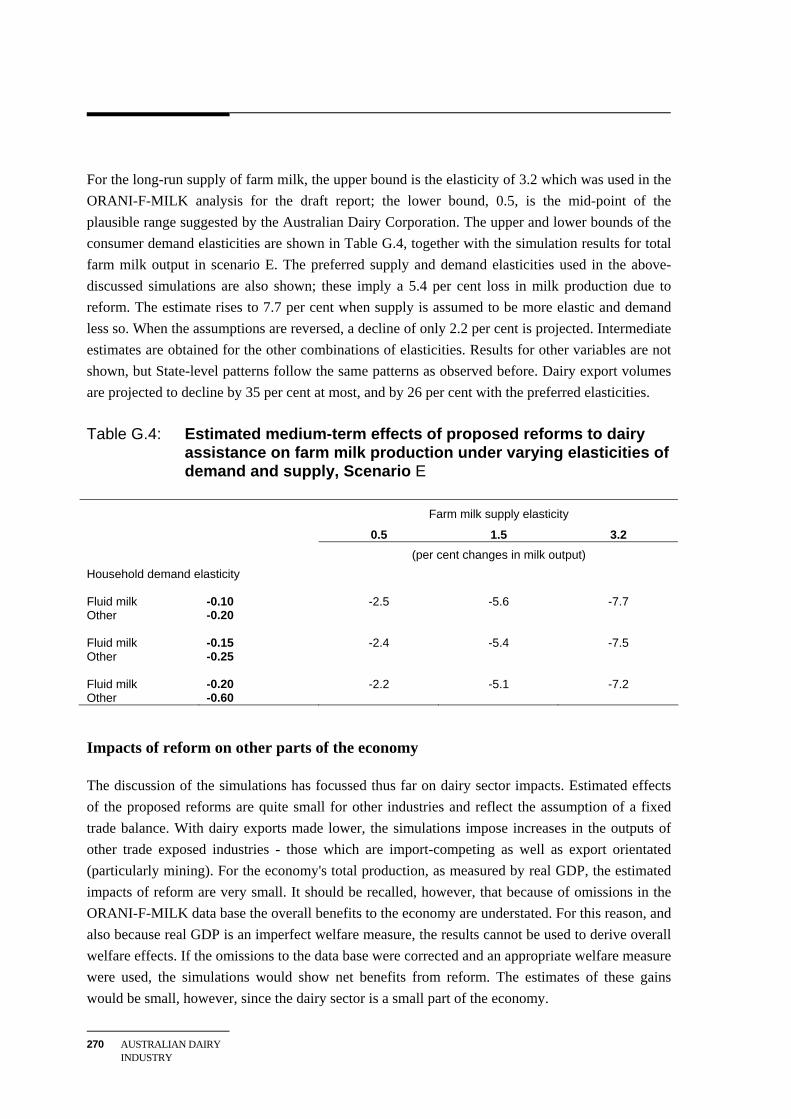
270 AUSTRALIAN DAIRY INDUSTRY
For the long-run supply of farm milk, the upper bound is the elasticity of 3.2 which was used in the ORANI-F-MILK analysis for the draft report; the lower bound, 0.5, is the mid-point of the plausible range suggested by the Australian Dairy Corporation. The upper and lower bounds of the consumer demand elasticities are shown in Table G.4, together with the simulation results for total farm milk output in scenario E. The preferred supply and demand elasticities used in the above-discussed simulations are also shown; these imply a 5.4 per cent loss in milk production due to reform. The estimate rises to 7.7 per cent when supply is assumed to be more elastic and demand less so. When the assumptions are reversed, a decline of only 2.2 per cent is projected. Intermediate estimates are obtained for the other combinations of elasticities. Results for other variables are not shown, but State-level patterns follow the same patterns as observed before. Dairy export volumes are projected to decline by 35 per cent at most, and by 26 per cent with the preferred elasticities.
Table G.4: Estimated medium-term effects of proposed reforms to dairy assistance on farm milk production under varying elasticities of demand and supply, Scenario E
Farm milk supply elasticity
0.5 1.5 3.2 (per cent changes in milk output) Household demand elasticity Fluid milk -0.10 -2.5 -5.6 -7.7 Other -0.20 Fluid milk -0.15 -2.4 -5.4 -7.5 Other -0.25 Fluid milk -0.20 -2.2 -5.1 -7.2 Other -0.60
Impacts of reform on other parts of the economy
The discussion of the simulations has focussed thus far on dairy sector impacts. Estimated effects of the proposed reforms are quite small for other industries and reflect the assumption of a fixed trade balance. With dairy exports made lower, the simulations impose increases in the outputs of other trade exposed industries - those which are import-competing as well as export orientated (particularly mining). For the economy's total production, as measured by real GDP, the estimated impacts of reform are very small. It should be recalled, however, that because of omissions in the ORANI-F-MILK data base the overall benefits to the economy are understated. For this reason, and also because real GDP is an imperfect welfare measure, the results cannot be used to derive overall welfare effects. If the omissions to the data base were corrected and an appropriate welfare measure were used, the simulations would show net benefits from reform. The estimates of these gains would be small, however, since the dairy sector is a small part of the economy.

APPENDIX G: ESTIMATING THE EFFECTS OF
271
Evidence from other models
The model of the Victorian Department of Agriculture
Alternative estimates of the effects of the proposed reforms were provided by the Victorian Department of Agriculture (Submission 65). The framework for analysis was the Department's model of the Australian dairy industry which, in contrast to ORANI-F-MILK, assumes that manufacturing milk prices are uniform across States. This outcome is dependent on processing activities being able to relocate, otherwise transport costs might permit price differentials to occur. Because the location of plants changes only gradually, simulation results should therefore be seen as long run. Unlike ORANI-F-MILK, the model does not distinguish among nonfluid milk products such as cheese and butter, being mainly concerned with agricultural rather than processing activities.
The reforms which were simulated with the Department's model include the removal of restrictions on interstate trade and those analysed with ORANI-F-MILK; that is, deregulation of farm gate prices for market milk and reducing the rate of market support to 5 per cent. Although the model excludes many of the natural incentives for interstate trade by omitting seasonality and regional detail at the sub-State level, it does provide some insights into the potential for interstate trade in market milk in a deregulated environment; the simulations of the model indicate that transport costs would largely preclude interstate trade in such an environment. Thus, comparisons can be made to the ORANI-F-MILK results for scenario E, which excludes both interstate trade and seasonality. Comparability of the analyses is enhanced by the use of the same benchmarks on assistance levels (1989-90 data), and of essentially identical supply and demand elasticities for dairy commodities (the Commission's best-guess estimates).
At the national level, the Victorian model indicates a 22 per cent decline in farm milk production in the long-run (Table G.5). This compares with a medium-term loss of around 5 per cent implied by ORANI-F-MILK. Both analyses suggest that States with pooling arrangements will experience above-average percentage contractions. Yet they do not agree on the relative outcome for South Australia among these States. In the Department's projections, production of farm milk declines by 39 per cent in South Australia and in much smaller proportions in Tasmania and Victoria. In ORANI-F- MILK results, the ranking is reversed, with South Australian production declining 2.7 per cent, as against 7 per cent in Tasmania, and 9.3 per cent in Victoria. Another point of interest is that the Department's analysis foreshadows output declines of around 20 per cent in each of the quota States, only slightly less than the estimate for Victoria.

272 AUSTRALIAN DAIRY INDUSTRY
Table G.5: Long-run effects of proposed reforms on farm milk production and use; simulation results from the dairy model of the Victorian Department of Agriculturea
Volume of milk input to:
Milk production Fluid milk Non fluid milk products (per cent changes)
New South Wales -18.0 4.1 -67.8
Victoria -21.9 3.1 -25.4 Queensland -19.0 5.4 -46.1 Western Australia -19.2 4.0 -51.9 South Australia -39.1 3.7 -67.2 Tasmania -28.1 4.3 -33.4 Australia -22.3 4.0 -32.4
a For deregulation of farm gate prices for market milk and reducing the rate of market support under the Kerin
Plan to 5 per cent.
Source: Victorian Department of Agriculture (Submission 65).
The strikingly different results for South Australia arise from the relative dependence of that State on market milk, as compared with Tasmania and Victoria (see Table 2.5). With market and manufacturing milk prices each being similar across States, the highest pooled price is therefore paid in South Australia (Table 2.9). In the Department's analysis, retail prices for manufacturing milk are uniform across States, and deregulated prices of market and manufacturing milk are equal at the farm gate. Under these assumptions, deregulation fosters a nationally uniform producers price, so that the largest decline occurs where the producers price was formerly the highest. This is why the largest reduction in milk supply is projected for South Australia. In line with this finding, a decline is also projected for South Australia's share of manufacturing milk sales.
In ORANI-F-MILK, each State has a fixed share of milk sold to a processing industry and manufacturing milk prices are not arbitraged. Farm milk production is projected to decline due to lower demand for manufacturing milk, but South Australia is less dependent on such demand than are Tasmania and Victoria. In addition, a smaller share of its manufacturing milk is sold to the butter industry, for which the largest fall in output is foreshadowed. For these reasons, the projected decline in farm milk production is smaller in South Australia than in other States which pool.

APPENDIX G: ESTIMATING THE EFFECTS OF
273
The implications of the analyses regarding South Australia are not contradictory, once the difference in time frame is recognised. The message of the Victorian Department's analysis is that in the long-run, the reform package would reduce farm milk production by the largest percentage in South Australia. The more optimistic result for South Australia in the ORANI-F-MILK analysis describes the impact over the medium term. However, even for this time frame, the restriction in ORANI-F-MILK regarding the sourcing of milk input has limited justification. The long-run prediction from the Victorian Department's analysis is consequently more likely to be realistic than the medium-term result from ORANI-F-MILK.
The model of the Australian Bureau of Agricultural and Resource Economics
The ABARE model of the farm dairy sector is limited in coverage to New South Wales, Victoria and Queensland - States which collectively produce over 80 per cent of the nation's farm milk. As against this drawback, it has the major advantages of incorporating seasonality and regional detail at the sub-State level, and of being able to analyse interstate trade in market milk. The price of manufacturing milk is assumed to be uniform across regions and is an exogenous input to the model. The effects of deregulating interstate trade in market milk and its farm gate price were simulated in ABARE (1991), under various manufacturing milk prices. The finding which is of special interest here is that interstate trade would remain quite limited due to transport costs. Such trade as would occur would be from Victoria to New South Wales, and, in lesser amounts, from New South Wales to Queensland.
G.4 Conclusions
Although quantitatively not precise, the key findings in this appendix can be expected to reflect the direction of change resulting from the reforms simulated. The reforms which have been modelled can be expected to reduce farm milk production over the medium term. In dairy manufacturing, an overall contraction will mask differential impacts across products and activities. Butter production will decline significantly, while output of other nonfluid milk products will decline by much smaller proportions (for example cheese) or slightly increase (for example ice cream). Exports will continue to be a major outlet for Australian dairy products, though less so than under current assistance levels. Domestic consumption of dairy products should increase as their price to consumers falls. Based on the ORANI-F-MILK simulations, the overall decline in dairy production in the medium term could be up to 4 per cent in manufactured dairy products and slightly more in total farm milk output. The Victorian Department of Agriculture's model suggests larger declines over the long run, with farm milk production falling by 22 per cent.
The reforms would cause larger percentage declines in farm milk production in States with pooling arrangements - Victoria, South Australia and Tasmania - than in States with quota schemes.
274 AUSTRALIAN DAIRY INDUSTRY
This pattern is upheld by analyses with both ORANI-F-MILK and the model of the Victorian Department of Agriculture. In the long run, the largest percentage contraction is likely to occur in South Australia, where the producers price is more highly supported under current assistance arrangements than elsewhere. This pattern would emerge after the location of the processing activities has fully adjusted to the post-reform environment. For the nearer term, before such adjustments have proceeded far, the relative impacts among pooling States are ambiguous. Possibly, the worst-faring States would be those which are currently most dependent on nonfluid dairy processing - Victoria and Tasmania - rather than South Australia.
Some of the welfare effects of the reform package are suggested by the findings in this appendix. Australian consumers would benefit as the price of dairy products fell, but producers in the dairy sector would typically suffer a welfare loss. Australia would export a smaller volume of dairy products, but other industries - particularly those which are trade-competing - would expand their output, as labour and other resources are released from dairying. The analysis has not attempted to estimate the overall welfare effect by netting out these various impacts. However, the partial equilibrium calculations summarised in Chapter 9 indicate positive overall effects which, notwithstanding the simplicity of analysis, capture the essential point - that current assistance to the dairy industry causes a misallocation of resources. This occurs in two principal ways: from the overuse of resources in milk production as a result of increased farm gate prices for milk; and from the increased consumer prices for milk and dairy products.

REFERENCES 275
REFERENCES
ABARE (Australian Bureau of Agricultural and Resource Economics) 1990, Commodity Statistical Bulletin, AGPS, Canberra.
_____ 1991a, Agriculture and Resources Quarterly, Volume 3, Number 1, March 1991.
_____ 1991b and previous issues, Farm Surveys Report, AGPS, Canberra
_____ 1991c, Dairy Industry Policy and Free Trade with New Zealand, Discussion Paper 91.8, AGPS, Canberra.
ABS (Australian Bureau of Statistics) 1984-85a and previous issues, Census of Manufacturing Establishments: Summary of Operations by Industry Class, New South Wales, Cat No. 8201.1.
_____1984-85b and previous issues, Manufacturing Establishments: Summary of Operations, Queensland, Cat No. 8202.3.
_____ 1984-85c and previous issues, Manufacturing Establishments: Details of Operations, Victoria, Cat No. 8201.2.
_____ 1990a and previous issues, Australian Exports, Country by Commodity, Cat. no. 5436.0.
_____ 1990b and previous issues, Australian Imports, Country by Commodity, Cat. no. 5437.0.
_____ 1990c and previous issues, Livestock and Livestock Products, Victoria, Cat No. 7221.2.
_____ 1990d and previous issues, Livestock and Livestock Products, Queensland, Cat No. 7221.3.
_____ 1990e and previous issues, Value of Agricultural Commodities Produced, Australia, Cat No. 7503.0.
_____ 1990f and previous issues, Census of Manufacturing Establishments: Summary of Statistics, Western Australia, Cat No. 8202.5.
_____ 1990g and previous issues, Census of Manufacturing Establishments: Summary of Operations by Industry Class, Tasmania, Cat No. 8201.6.
_____ 1990h and previous issues, Manufacturing Establishments: Details of Operations by Industry, South Australia, Cat No. 8202.4.

276 AUSTRALIAN DAIRY INDUSTRY
ADC (Australian Dairy Corporation) 1987, Annual Report 1986-1987.
_____ 1988, Annual Report 1987-1988.
_____ 1990a, Dairy Compendium 1990, November.
_____ 1990b, Annual Report 1989-90.
_____ 1990c, Market Support Payments, Circular no. A39/90, 30 November 1990.
ADIC (Australian Dairy Industry Conference) 1990, Annual Report 1990
ADPF (Australian Dairy Products Federation) 1990, ‘Dairy Industry Perspective: A Dairy Product Manufacturer's Point of View’, paper presented at environmental seminar, Melbourne, 3 May 1990.
Australian Agricultural Council, 1988, Resolution, ‘Milk Marketing Arrangements’, Freemantle.
Beare, S., Domine, L., and Lembit, M., 1989, ‘Trans-Tasman trade in manufactured dairy products: a mathematical programming model of imperfect sectoral competition’, paper presented at the 33rd Annual Agricultural Economics Society, Christchurch, New Zealand, 7-9 February 1989.
Commonwealth of Australia 1986, Reform of Commonwealth Primary Industry Statutory Marketing Authorities, AGPS, Canberra.
_____ 1987, Resolving the World Agricultural Crisis: An Australian Proposal, an address by the Prime Minister to an international forum at Davos in Switzerland, AGPS, Canberra, January 1987.
_____ 1988, Economic Statement May 1988, AGPS, Canberra.
_____ 1990, Review of the Commonwealth Primary Industry Statutory Marketing Authorities, AGPS, Canberra.
CSIRO (Commonwealth Scientific and Industrial Research Organisation) 1990, Division of Water Resources, Seeking Solutions, ‘Waste Management in Intensive Rural Industries in Australia’, August 1990.
Davey, G.R. 1991, ‘Responding to challenges in the fresh milk market’, paper presented at the National Agricultural and Resources Outlook Conference, Canberra, 30 January 1991.
Davidson, B., MacAulay, G., and Powell, R., 1989, ‘The Estimation of the Demand for Market Milk, Cheese and Butter in New South Wales, Victoria and Queensland’, Dairy Economics Research Report No. 2, Department of Agricultural Economics and Business Management, University of New England.
Davis Committee Report 1990 (see Commonwealth of Australia 1990).

REFERENCES 277
Department of Foreign Affairs and Trade 1988, Australia New Zealand Close Economic Relations Trade Agreement, Documents arising from the 1988 Review, Canberra, August 1988.
Department of Primary Industry 1986, ‘New Dairy Industry Marketing and Assistance Arrangements’, Canberra, July 1986.
Department of Water Resources NSW 1989, Annual Report 1988-89.
Department of Water Resources Victoria 1989, Fifth Annual Report 1988-89.
DRDC (Dairy Research and Development Corporation) 1990, 1990 Annual Report.
Dixon, P.B., Parmenter, B.R., Sutton, J., and Vincent, D.P., 1982, ORANI: A multisectoral model of the Australian economy, North Holland, Amsterdam.
Fearson, J.C. 1990, (Australian Dairy Corporation) Chairman's Report to the 1990 Annual General Meeting of the Australian Dairy Industry Conference, Melbourne, 16 November 1990.
GATT (General Agreement on Tariffs and Trade) 1973, ‘The Tokyo Round Agreements - International Dairy Arrangement’, Geneva, pp. 155-179.
_____ 1990, International Dairy Arrangement, Committee of the Protocol Regarding Milk Fat, 12 December 1990.
Government Adviser on Deregulation 1991, South Australia, Dairy Industry Review Green Paper, March 1991.
Government of Victoria 1987, ‘Salt Action - Victoria's strategy for managing the salinity of land and water resources’, February 1987.
Higgs, P. 1986, Adaption and Survival in Australian Agriculture, Oxford University Press, Melbourne.
Horridge, M., Pearce, D. and Walker, A. 1990, ‘World Agricultural Trade Reform: Implications for Australia’, The Economic Record, September 1990, pp.235-247.
House of Representatives 1986, Hansard, Dairy Produce Bill 1986, Second Reading Speech, 7 May 1986, p. 3201.
IAC (Industries Assistance Commission) 1983, The Dairy Industry, Report No. 333, AGPS, Canberra, 23 November 1983.
_____ 1987, Assistance to Agricultural and Manufacturing Industries, Information Paper, AGPS, Canberra, June 1987.
278 AUSTRALIAN DAIRY INDUSTRY
_____ 1989a, The Dried Vine Fruits Industry, Report No. 420, AGPS, Canberra, 1 September 1989.
_____ 1989b, Food Processing and Beverages Industries, Report No. 424, AGPS, Canberra, 15 December 1989.
_____ 1990, Apples and Pears (Export Underwriting), Report No. 425, AGPS, Canberra 19 January 1990.
IC (Industry Commission) 1990, Annual Report 1989-90, AGPS, Canberra.
_____ 1991a, Recycling, Report No. 6, Volumes I and II, AGPS, Canberra, 22 February.
_____ 1991b, Australian Dairy Industry Inquiry - Why and How Assistance is Measured, Background Paper No. 1 prepared for the Workshop on Assistance Measurement, Canberra, 10 April 1991.
_____ 1991c, Australian Dairy Industry Inquiry - Measuring Assistance to the Australian Dairy Industry, Background Paper No. 2 prepared for the Workshop on Assistance Measurement, Canberra, 10 April 1991.
______ 1991d, Statutory Marketing Arrangements for Primary Products, Report No. 10, AGPS, Canberra, 26 March 1991.
Johnson, D. 1991, ‘Construction of ORANI-F-MILK and Forecasts for the Milk Industries, 1989-90 to 1995-96,’ Institute of Applied Economic and Social Research, 25 February 1991.
Joint - Australian and New Zealand - Ministerial Statement 1991, Joint Statement by the Australian Minister for Shipping and Aviation Support, Senator Bob Collins, and the New Zealand Minister for Transport, Mr Rob Storey, 4 April.
Jones, B. 1986, ‘Customs Tariff Amendment Bill (No. 3) 1986’, House of Representatives, 22 October pp. 2564-6.
Lembit, M.J. and Bhati, U.N. 1987, ‘Farm cost effects of dairy policies’, Review of Marketing and Agricultural Economics, vol. 55, no. 4, pp. 201-212.
Lyons B J, Wong L P and Skerry G P, 1989, ‘Anaerobic Treatment of Dairy Wastes’, paper presented to the Australian Water and Waste Water Association, 13th Federal Convention, Canberra, 6-10 March 1989.
Minister for Primary Industries and Energy 1990a, Hon John Kerin MP, Second Reading Speech, Dried Vine Fruits Legislation Amendment Bill 1990, House of Representatives, 15 November 1990.

REFERENCES 279
_____ 1990b, Hon. John Kerin MP, Dairy Underwriting Arrangements, Media Release, 19 November.
_____ 1990c, Hon John Kerin MP, ‘Davis’ Review of Statutory Marketing Authorities, Media Release, 18 October 1990.
Minister for Science, Customs and Small Business 1988, Second Reading Speech, Anti-Dumping Authority Bill 1988. House of Representatives, Weekly Hansard, No. 7, 26-28 April 1988, p. 2311.
Minister for Trade and Overseas Development 1991, ‘Uruguay Round’, Press Release, 27 February 1991.
New South Wales Dairy Industry Conference 1990, Report to New South Wales Government on Reform Proposals, September 1990.
New South Wales - Victorian Milk Committee 1990, Final Report, July 1990.
OECD (Organisation for Economic Co-operation and Development) 1991, ‘Changes in the level of support for OECD dairy producers: an analysis based on the MTM model’, Joint Working Party of the Committee for Agriculture and the Trade Committee, 4 April 1991.
Parameter, B.R., 1988, ORANI-F User's Manual, Institute of Applied Economic and Social Research Working Paper no. 7/1988.
PM & C (Department of Prime Minister and Cabinet) 1991, Building a Competitive Australia, AGPS, Canberra, 12 March 1991.
Prpic, J.K. and Davey, R.B. 1990, ‘The Great Milk Container Debate’, Today's Life Science, Vol 2, No. 12, pages 4 - 13.
Public Bodies Review Committee 1989, Parliament of Victoria, Report on the Victorian Dairy Industry Authority, Government Printer, Melbourne, August 1989.
Rural Water Commission of Victoria 1990, Sixth Annual Report 1989-90.
Rural Water Commission of Victoria 1991, ‘Some developments in State water policies’, paper presented by David Dole to the National Agricultural and Resources Outlook Conference, Canberra, 29-31 January 1991.
Senate Standing Committee on Industry, Science and Technology, 1991, Inquiry into Australia's Anti-Dumping and Countervailing Legislation, AGPS, Canberra.
Tasmanian Dairy Industry Authority 1991, Media Release, Launceston, 2 July 1991.

280 AUSTRALIAN DAIRY INDUSTRY
Topp, V., Williamson, G., Lembit, M. and Beare, S. 1989, ‘The resource costs of blended milk pricing in Victoria’, ABARE paper presented at the 33rd Annual Conference of the Australian Agricultural Society, Christchurch, New Zealand, 7-9 February 1989.
TPC (Trade Practices Commission) 1989, Rural Guideline, Canberra.
_____ 1990, Annual Report 1989-90, AGPS, Canberra.
USDA (United States Department of Agriculture) 1991, US Trade Prospects: Dairy, Livestock and Poultry Products, Washington DC, April 1991.
Victorian Department of Agriculture 1991, ‘New Proposals for Changes to the Dairy Industry Act 1984’, Discussion Paper, Melbourne, 22 July 1991.
WA Dairy Industry Authority 1990, Annual Report 1989-90.
Wilcox, C.J. 1988, ‘Policy formulation in the Australian dairy industry’, paper presented at the 32nd Annual Conference of the Australian Agricultural Economics Society, La Trobe University, 8-11 February 1988.
Wilcox, C. and Bardsley P., 1990, ‘Assessing policy options for the Australian Dairy Industry’, paper presented at the 34th Annual Conference of the Australian Agricultural Economics Society, University of Queensland, 12-15 February 1990.

REFERENCES 281