Embed Size (px)
Citation preview

Please refer to the important disclosures and analyst certification on inside back cover of this document, or on our website www.macquarie.com/disclosures.
Australia & NZ
Macquarie Marquee Ideas (MMIs) represent our best alpha-generating ideas. MMIs represent a collection of Macquarie Research's best ideas derived from our coverage universe. The time frame for each idea is typically three months, with the list reviewed every two weeks. Stocks may be removed from the list earlier than the three month typical duration if the particular MMI has played out and expected outperformance of the idea has materialised. Similarly MMIs may remain on the list for longer than three months if significant alpha is still to be generated. Selection criteria reflect high levels of analyst conviction and near term catalysts The MMI list is selected by a group of Macquarie Research Senior Analysts, Strategists, the Quant Team and by Heads of Research. MMI's are typically in line with the analysts' fundamental view. However emphasis is on level of conviction and the existence of catalysts over the next quarter. In order for institutional investors to realistically invest in MMIs, minimum stock turnover requirements have also been considered. Overleaf are Macquarie’s valuations on all the stocks we cover.
13 July 2012 Macquarie Securities (Australia) Limited
Macquarie Marquee Ideas Still signs of a pulse… What a month for our Macquarie Marquee Ideas. We engaged Dr Craig Collie
to check the pulse of our MMI list yesterday and he assures us that there are
signs of life. Our MMI list isn't a portfolio, but a list of stocks we believe will
both outperform and benefit from a short to medium term catalyst. Clearly the
market is currently separated into two camps - 1) Telcos, REITs, banks,
consumer staples and 2) The rest. Stock selection has been rendered
challenging by the current macro environment. Most stocks/sectors in any
way associated with Resources / Materials have been punished.
We add a counter-consensus gaming sector pairs trade – Long TAH / Short
TTS (TAH, $2.91, Outperform, TP: $3.20, TSR: 16.7%, TTS, $2.64,
Underperform, TP: $2.40, TSR: -3.9%). We add a Sell idea in Primary
Healthcare (PRY, $3.16, Underperform, TP: $2.60, TSR: -12.9%).
Origin - APLNG has taken FID on train two. As such our catalyst has passed.
While we continue to be positive on ORG, we remove it from our MMI list after
an excess return of -5.2% since its inception on 20 February 2012. We have
also removed Wotif after recent outperformance and no immediate catalyst; it
has produced an excess return of 3.7% since its addition to the MMI list on 14
May 2012.
We have removed Whitehaven Coal, which has produced an excess return of
-14.3% since its inception on 20 June 2012. Thermal coal dynamics have
deteriorated significantly such that incremental demand from China is
currently extremely weak. We believe in the short term this has changed
potential M&A dynamics for the stock. Financing for any bid has become
incrementally more difficult. Similarly any bidder may also be looking for a
bottom that is not evident at this point.
Macquarie Marquee Ideas
Rec Code/Stock Start Date
Last price
FY12 PER TP TSR % Analyst
LEADERS
O/P AMC – Amcor 05/07/12 7.22 13.8 7.70 12.7 John Purtell
O/P DJS – David Jones 23/03/12 2.35 11.1 3.12 41.7 Rob Blythe
O/P IPL – Incitec Pivot 01/06/12 2.93 11.0 3.45 21.9 John Purtell
O/P NCM – Newcrest 03/02/12 22.49 16.0 32.00 44.1 Mitch Ryan
U/P PRY – Primary Healthcare 13/07/12 3.16 13.7 2.60 -12.9 Craig Collie
O/P QRN – QR National 05/06/12 3.30 21.8 4.30 34.1 Ian Myles
O/P RIO – Rio Tinto 01/04/11 55.65 9.3 88.00 60.7 Adrian Wood
EMERGING LEADERS
O/P AQG – Alacer Gold 22/05/12 4.98 8.8 10.00 100.8 Mitch Ryan
O/P MRM – Mermaid Marine 22/05/12 2.64 11.5 3.47 35.4 Andrew Wackett
O/P RCR – RCR Tomlinson 23/03/12 1.75 8.4 2.62 54.9 Andrew Wackett
O/P SVW – Seven Group 09/09/11 7.05 8.4 11.78 72.2 Andrew Wackett
PAIR TRADE
O/P GPT – GPT Group (Long) 29/06/12 3.31 14.0 3.50 11.5 Rob Freeman
U/P SGP – Stockland (Short) 29/06/12 3.16 10.6 3.22 9.6 Paul Checchin
O/P NAB – NAB (Long) 05/07/12 23.59 9.4 27.66 25.3 Michael Wiblin
U/P CBA – CBA (Short) 05/07/12 53.60 12.7 48.52 -3.2 Michael Wiblin
O/P TAH – TAB Holdings (Long) 13/07/12 2.91 6.1 3.20 16.7 Lachlan Fitt
U/P TTS – Tatts Group (Short) 13/07/12 2.64 11.4 2.40 -3.9 Lachlan Fitt
Source: Macquarie Research, FactSet pricing, July 2012

Macquarie Private Wealth Macquarie Marquee Ideas
13 July 2012 2
Macquarie Marquee Ideas
PRY AU – Primary Healthcare
We have added Primary Healthcare to our MMI list
Date became MMI: 12/07/2012 PRY AU vs ASX 100, & rec history
Note: Recommendation timeline - if not a continuous line, then there was no Macquarie coverage at the time or there was an embargo period.
Source: FactSet, Macquarie Research, July 2012
(all figures in AUD unless noted)
Recommendation: Underperform
Last Price: AUD 3.16
Price Target: AUD 2.60
TSR %: - 12.9
Catalyst:
Full year results in August
We believe if a more conventional accounting policy were applied to PRY, its profit would be 50%
lower this year, and as such view the stock as materially over-valued. However, perhaps more
concerning for shareholders is that the current treatment of upfront GP payments seemingly
results in the forfeiting of a $17m tax shield, suggesting ~20% of shareholder cash is
unnecessarily being paid to the tax office each year.
By choosing not to expense upfront GP payments, PRY is essentially electing to divert cash away
from shareholders to the tax office. Although this creates a potential value-play if management do
decide to change the policy, we see it as unlikely due to: (i) the detrimental effect on key valuation
metrics (ie PER, EV/EBIT, dividend payout ratio); and (ii) the hesitancy normally exhibited by
management to restate historical accounts.
PAIR TRADE – TAH AU – TABCorp Holdings (LONG) / TTS AU – Tatts Group (SHORT)
We have added a pair trade to our MMI list.
Date became MMI: 12/07/12 TAH AU vs ASX 100, & rec history
Note: Recommendation timeline - if not a continuous line, then there was no Macquarie coverage at the time or there was an embargo period.
Source: FactSet, Macquarie Research, July 2012
(all figures in AUD unless noted)
Recommendation: Outperform (Long)
Last Price: AUD 2.91
Price Target: AUD 3.20
TSR %: 16.7
Catalyst:
FY12 Result. Commencement of
legal action vs Vic Govt. Final
report from DBCDE re the review
of the Interactive Gambling act.
Agreement between TVN and
Tabcorp re media rights.

Macquarie Private Wealth Macquarie Marquee Ideas
13 July 2012 3
Date became MMI: 12/07/12 TTS AU vs ASX 100, & rec history
Note: Recommendation timeline - if not a continuous line, then there was no Macquarie coverage at the time or there was an embargo period.
Source: FactSet, Macquarie Research, July 2012
(all figures in AUD unless noted)
Recommendation: Underperform (Short)
Last Price: AUD 2.64
Price Target: AUD 2.40
TSR %: - 3.9
Catalyst:
FY12 result
Fig 1 Tatts trades at a 44% premium to TAH based on FY14 FCF yield
Fig 2 Tatts dividend yield is 120bps+ lower than Tabcorp
Source: Company data, Macquarie Research, February 2012 Source: Company data, Macquarie Research, February 2012
Long TAH:
Despite the weak economic environment, Tabcorp's 3Q trading update was positive. Strong
momentum in the core Wagering business offset softness in Pokies and Keno. Channel feedback
suggests the strong 3Q momentum has continued into 4Q, with Tabcorp benefitting from a refocus
on the Victorian retail network and the removal of Tote Tasmania from the premium rebate market.
In addition, the Euro 2012 soccer tournament in June will have helped boost 4Q growth rates in
the wagering business relative to 3Q. We expect these trends will flow through to a robust FY12
result, and anticipate consensus upgrades heading into Tabcorp's result on 9 August (MRE are
currently ~1% ahead of consensus NPAT forecasts for FY12).
As well as a robust FY12 result, we see a number of other positive catalysts for Tabcorp in coming
months. We expect these catalysts will remove investor concerns around a number of risks that
have lingered over previous years. The catalysts include:
Increased comfort on Tabcorp's ability to cover its minimum performance obligation
(MPO) under the new Victorian wagering licence. We note this has been a concern of the
market since Tabcorp was awarded the new Vic wagering licence last July; however, based
on our estimates, we believe Tabcorp has 8-10% headroom under their MPOs in both FY13
and FY14. We expect strong trends from Tabcorp's Victorian business to be evident at the
FY12 result, which should allay these concerns and remove the current overhang we believe
exists from this issue.
8.7%
9.5%
11.3%
8.3%
6.6%7.0%
0%
2%
4%
6%
8%
10%
12%
FY13e FY14e FY15e
FCF Yield (%)
Tabcorp Tatts
6.9%6.5%
7.2%
5.3% 5.3%5.7%
0%
1%
2%
3%
4%
5%
6%
7%
8%
FY13e FY14e FY15e
Div Yield (%)
Tabcorp Tatts

Macquarie Private Wealth Macquarie Marquee Ideas
13 July 2012 4
Final report from the DBCDE in coming weeks on the Interactive Gambling Act and
proposed removal of restrictions on in-play betting online. The draft report recommended
that in-play betting could be liberalised if approved by the relevant state/territory regulatory
authority and the relevant sports controlling body (where one exists), but also recommended a
blanket ban of "micro-betting" (ie. next ball in cricket, next point in tennis). We have previously
estimated that full liberalisation of online live betting could generate an additional $180m in
annual wagering industry revenues by FY16, of which Tabcorp's share could be $45m. This
would increase NPAT by ~7% and valuation by 20cps. Excluding "micro-betting", we estimate
the benefits reduce by ~25%. We continue to incorporate 10cps in our target price for in-play
betting, which is consistent with the outcomes of the draft report.
Completion of agreement between Tabcorp and TVN regarding media rights, where we
believe the market has become overly negative on the potential increase in rights fees
Tabcorp will be required to make. Our current expectation is that Tabcorp will need to pay
an additional $10m per annum to extend the rebroadcast agreement for NSW and Victorian
racing with TVN. This would see annual rights fees of $37.5m paid by Tabcorp to the racing
industry-owned broadcaster. Following the recent proposal by TVN to aggregate NSW
regional and provincial rights into the existing vehicle, we would anticipate a final agreement
will be struck with Tabcorp in coming months.
Compensation claim can commence against the Victorian Government from mid-
August. While we acknowledge any challenge is likely to be lengthy and could potentially
involve several court appeal processes, we see further newsflow on the matter as an
incremental positive for the stock price. Tabcorp believes it is entitled to up to $687m (~93cps)
in compensation for the change in licence structure for Victorian gaming operators. On a post-
tax basis, we see compensation in the range of $481-549m, which equates to 63-72cps on a
discounted basis. We currently allocate a 30% risk-weighted amount (23cps) in our $3.20/sh
valuation.
These catalysts would follow a string of newsflow that has increased certainty for investors.
Previous announcements include the renewal of its Victorian wagering licence, and the
positive resolution for the racing industry of the Race Field Fee dispute via a High Court ruling.
Short TTS:
Our short TTS call is a valuation argument and not based on an expectation that earnings will
disappoint at the FY12 result in late August. Tatts‟ portfolio of businesses continues to trade well,
with the jackpot run in lotteries over the past few months no doubt boosting growth rates during
2H12; however, this will make growth rates tougher to achieve through FY13. In addition, Tatts‟
wagering business is likely to have continued to receive a margin boost as the shift from tote
betting to fixed odds continues. While this is positive for short-term earnings, we remain
concerned that this may reverse over the medium/long term (the same concern is applicable to
Tabcorp).
Over the next 2-3 months, several of the positive catalysts that exist for Tabcorp are less relevant
for Tatts. Firstly, Tatts exposure to online sports betting is relatively low, and therefore we see
limited upside to the TattsBet business from a liberalisation of online in-play betting. Secondly,
while Tatts are also likely to commence legal proceedings against the Victorian government for
compensation from the loss of their gaming licence, we note the upside leverage from a positive
outcome is less significant for Tatts than it is for Tabcorp (Tatts 41cps or ~15% of current price,
Tabcorp 93cps or ~30% of current price).
In saying this, Tatts is likely to receive a valuation boost should it acquire SA Lotteries when the
sale process is completed later this year or early next year. We estimate Tatts will pay no more
than $300m for the licence, which would be value-accretive; however, we see the majority of this
upside already being priced in at current levels.
On a longer-term view, we see some risks to the high margin revenue that Tatts generates from its
NSW monitoring licence that expires in 2016. We don't currently factor in any requirement for Tatts
to make an upfront payment to extend this licence and note there may be competitive tension that
could reduce the margins Tatts are able to renew the contract at, or it could lose the monitoring
contract altogether.

Macquarie Private Wealth Macquarie Marquee Ideas
13 July 2012 5
ORG AU – Origin Energy
We have removed Origin Energy from our MMI list.
Origin Energy has produced an excess return of -5.2% since its addition to the MMI list on 20
February 2012.
While the second train has been sanctioned, ORG is yet to resolve funding concerns. We had
expected that a second train FID would also come with a sell-down in APLNG equity. While ORG
has committed to reducing its exposure from 37.5% to 30%, we expect that this process will take
several months, particularly given a dataroom is yet to be open. Nonetheless, given the favourable
market for Australian LNG assets highlighted by recent transactions, we remain confident that
APLNG can secure a partner in the fullness of time which will drive a re-rating.
WTF AU – Wotif.com
We have removed Wotif.com from our MMI list.
Wotif.com has produced an excess return of 3.7% since its addition to the MMI list on 14 May
2012.
We retain our Outperform recommendation, which is not based on a return to previous rates of
growth or rerating but rather on the stock offering a circa 6.5% yield, delivering modest earnings
growth in the current environment with potential for acceleration if market conditions improve
WHC AU – Whitehaven Coal
We have removed Whitehaven Coal from our MMI list.
Whitehaven has produced an excess return of -14.3% since its addition to the MMI list on 20 June
2012.
We remain positive on Whitehaven from a fundamental point of view in the medium and long term;
however note the current weakness in the thermal coal market is likely to drag on the stock in the
near term, and as such we are removing it from the MMI.
IPL AU – Incitec Pivot
Date became MMI: 01/06/12 IPL AU vs ASX 100, & rec history
Note: Recommendation timeline - if not a continuous line, then there was no Macquarie coverage at the time or there was an embargo period.
Source: FactSet, Macquarie Research, July 2012
(all figures in AUD unless noted)
Recommendation: Outperform
Last Price: AUD 2.93
Price Target: AUD 3.45
TSR %: 21.9
Catalyst:
Expected DAP price strength over
coming weeks, Moranbah start-
up in July
IPL is hosting an Investor day on 7 August. Key focus will be on IPL‟s Australian business,
including presentations on Moranbah, IPF and Dyno Asia Pacific. We expect these to provide
greater confidence that 1) Moranbah start-up is on track following first AN this month and 2) IPL
has made changes within its IPF business that should prevent a recurrence of the extent of
inventory losses that saw disappointing IPF 1H EBIT of $2m.

Macquarie Private Wealth Macquarie Marquee Ideas
13 July 2012 6
Soft commodity prices (corn, wheat) are +30% over the last three months. Given the correlation
with fertiliser prices, this should be positive but is yet to play out. Global urea prices have fallen
over the last month to US$435/t (FOB, Middle East), which is negative directionally for IPL.
However, US urea prices have started to rally, with NOLA back up at US$460/t. We currently
assume US$500/t 2H urea – if we assumed US$450/t 2H urea (similar to current local prices), this
would have a -3% impact on our FY12eps.
We estimate fair value DAP based on historic corn and wheat price relationships is currently
US$720t (+27% on spot US$565/t) and fair value urea US$568/t (+23% vs US spot US$460/t).
This is positive for the affordability equation. Of course, other demand/supply drivers are also
important. At present, the Indian monsoon is not as favourable, which may impact Q3 Indian DAP
imports whilst additional Middle East urea supply is expected in 2H. Higher wheat prices are
positive for sentiment for Australian broadacre farmers, which should in turn encourage urea
demand for top-dress application. Recent rainfall in NSW and Victoria has come at a good time to
boost the moisture profile and should stimulate top-dress urea demand in 2H.
US coal not as bad as feared so far. The other issue is US coal demand weakness and impact on
Dyno Americas. We understand that Dyno has had a reasonable May / June and demand into
coal, as yet, has not fallen by the -10% plus predicted in May (this is consistent with US coal
production, which is down 6% YTD vs down 8% YTD back in May). Dyno is also less exposed to
Appalachian (30% of US coal volume) than other regions (PRB, Illinois) and AN pricing has held
up well, in part due to EDC plant closure (1-3 months before start-up). There are also some
tentative signs of Q&C improvement, as housing has bottomed and infrastructure spend is starting
to filter through.
AQG AU – Alacer Gold
Date became MMI: 22/05/12 AQG AU vs Small Ordinaries, & rec history
Note: Recommendation timeline - if not a continuous line, then there was no Macquarie coverage at the time or there was an embargo period.
Source: FactSet, Macquarie Research, July 2012
(all figures in AUD unless noted)
Recommendation: Outperform
Last Price: AUD 4.98
Price Target: AUD 10.00
TSR %: 100.8
Catalyst:
Updated Çöpler resource due in
September.
In light of the current market conditions where investors are pulling away from commodities in
general and risk appetite has dwindled, there has been indiscriminate selling of the gold sector.
While this has created a lot of value in the market, theoretical upside needs to be tempered
against the risks inherent in the stock. As such we think those stocks with a higher degree of risk,
the explorers and unfunded developers, will be on the sideline for at least six months and that the
strongest medium term returns will be provided by low-cost producers, with tier one assets. Alacer
fits our target profile and has been oversold on poor communication to the market and the recent
management change.
With cash costs of ~US$600/oz, we forecast Alacer to generate US$200m of cash flow this year
(after capex and exploration of US$210m). For the cash flow to be eroded to zero, the gold price
would have to fall to US$950/oz. As such, we believe that Alacer is a stand-out gold stock for its
ability to generate strong cash flow, which when coupled with the ever-growing resource at Çöpler
provides a fully funded growth.
The feasibility study for the Çöpler sulphide project was initiated in January 2012 and is expected
to be complete by the end of 2012. We have recently revised up our capex estimate for the project
to US$550m (from US$425m). We value the Çöpler sulphide project at US$852m. Our production
forecast remains unchanged at 155koz attributable gold, with production to commence in late
2014.

Macquarie Private Wealth Macquarie Marquee Ideas
13 July 2012 7
MRM AU – Mermaid Marine
Date became MMI: 22/05/12 MRM AU vs Small Ordinaries, & rec history
Note: Recommendation timeline - if not a continuous line, then there was no Macquarie coverage at the time or there was an embargo period.
Source: FactSet, Macquarie Research, July 2012
(all figures in AUD unless noted)
Recommendation: Outperform
Last Price: AUD 2.64
Price Target: AUD 3.47
TSR %: 35.4
Catalyst:
Contract wins on Gorgon,
Wheatstone and Inpex.
Mermaid has been unfairly sold off in the mining services sector from $3.44 in February to current
levels of $2.64. This is despite the company having no exposure to coal or base metals. We
continue to believe that all committed Western Australian based LNG projects will be built. We
see WA/NT LNG plants going from two in number in 2011 to seven by 2015/2016, with obvious
ramifications for the size of MRM's core market. MRM remains in a strong competitive position to
benefit from this growth.
In our view, Mermaid is a strong play on the high levels of oil and gas activity in Western Australia
over the medium term. We believe Mermaid‟s strong market position is likely to lead to further
earnings upgrades.
DJS AU – David Jones
Date became MMI: 23/03/2012 DJS AU vs ASX 100, & rec history
Note: Recommendation timeline - if not a continuous line, then there was no Macquarie coverage at the time or there was an embargo period.
Source: FactSet, Macquarie Research, July 2012
(all figures in AUD unless noted)
Recommendation: Outperform
Last Price: AUD 2.35
Price Target: AUD 3.12
TSR %: 41.7
Catalyst:
FY12 result and update on online
Please refer to Essentials article 23 March 2012, “Zebra loses its $tripe$”.
We have upgraded our recommendation on DJS to Outperform. Why not? We have had the
massive downgrade - while guidance for FY12 NPAT is for a 35-40% fall, DJS expect growth in
FY13 & 14. Further the financial services earnings have been exposed, and DJS are spending a
fortune to acquire/develop an online business model which will allow the social customer to
engage with the brand at all levels. DJS is fast tracking the development of its brand as a social
object, not to lead the market but merely to catch-up. While it might be late, it has engaged
credible business partners (IBM) to build out a capability, and, if the brand is relevant and the
online piece well executed, DJS may just manage to accelerate sales growth.
The share price has not been this low since 2006, and while earnings expectations have tumbled,
so has the price. We are looking for a relief rally and a “what-if” proposition regarding sales. This
isn‟t a macro call or even an interest rate cut call: DJS is undervalued and its transformation
initiatives could improve perception and ability to compete with the various pure-play online and
established Omni Channel Retailers.

Macquarie Private Wealth Macquarie Marquee Ideas
13 July 2012 8
NCM AU – Newcrest
Date became MMI: 03/02/2012 NCM AU vs ASX 100, & rec history
Note: Recommendation timeline - if not a continuous line, then there was no Macquarie coverage at the time or there was an embargo period.
Source: FactSet, Macquarie Research, July 2012
(all figures in AUD unless noted)
Recommendation: Outperform
Last Price: AUD 22.49
Price Target: AUD 32.00
TSR %: 44.1
Catalyst:
Wafi-Golpu PFS due September
2012.
Precious metals prices are curiously weak at the moment, particularly given that real interest rates
continue to drift lower and lower. Part of the sluggish performance seems related to confusion in
FX markets, with the Euro being strangely stable despite expectations it would shift lower. This
uncertainty has weighed on gold stocks over the first quarter of the year, but has been further
compounded by the current environment affecting gold producers where the majority of stocks
have missed production guidance and experienced increasing operating costs and capital
expenditure.
Newcrest has not been immune to these pressures, clearly struggling to deliver on operational
guidance throughout the course of 2012. That said, we believe the market has temporarily lost
focus on the quality of Newcrest's asset base relative to its global peers and the longer-term value
inherent in the projects. By way of example we note CVO's 0.8moz per annum production for a
+30 year mine life and Lihir's 1.2moz per annum production for a +25 year mine life both at sub
$500/oz cash costs.
Although it is important to acknowledge that the operational underperformance has created
downside sentiment towards the stock which will not be abated easily, we believe over the coming
six months the production outlook is positive. With near-term growth projects (Lihir MOPU and
Cadia East) providing upward momentum to the production profile, we believe the risk is to the
upside from current levels.
Newcrest has historically traded at an average P/NPV (Macquarie price deck) multiple of 1.6x
since 2008. It is currently trading at ~1.0x a level not seen since 2002. As such, we believe that
the low risk of further operational disappointment is significantly offset by the long-term upside
represented by tier one, long-life assets trading at the cheapest level in 10 years.
RIO AU – Rio Tinto
Date became MMI: 01/04/11 RIO AU vs ASX 100, & rec history
Note: Recommendation timeline - if not a continuous line, then there was no Macquarie coverage at the time or there was an embargo period.
Source: FactSet, Macquarie Research, June 2012
(all figures in AUD unless noted)
Recommendation: Outperform
Last Price: AUD 55.65
Price Target: AUD 88.00
TSR %: 60.7
Catalyst:
Easing in Chinese inflation data
and/or material loosening of policy.
The equity sell-off of the past few months has meant that, other than briefly in the height of the
global turmoil of 2008, long-term valuation metrics (DCF and mid-cycle earnings) in the last ten
years have never been more supportive for Rio Tinto than right now.
Macquarie Private Wealth Macquarie Marquee Ideas
13 July 2012 9
Rio Tinto is trading almost 15% below what we term our "zero option" valuation. What that means
is that if we utilise our long run price estimates from today in perpetuity and a 95c A$/US$, we
arrive at a ~A$65ps DCF valuation for Rio Tinto. Note that this includes no change to our
aggressive operating and capital cost inflation assumptions over coming years.
Even taking a particularly conservative (prudent) view on the timing and cost of Rio Tinto's flagship
Pilbara expansions, Rio Tinto appears comfortably inexpensive on almost all valuation metrics,
given our view on a potential multi-year shelf in iron ore prices. Outperform.
RCR AU – RCR Tomlinson
Date became MMI: 23/03/2012 RCR AU vs Small Ordinaries, & rec history
Note: Recommendation timeline - if not a continuous line, then there was no Macquarie coverage at the time or there was an embargo period.
Source: FactSet, Macquarie Research, July 2012
(all figures in AUD unless noted)
Recommendation: Outperform
Last Price: AUD 1.75
Price Target: AUD 2.62
TSR %: 54.9
Catalyst:
Stepping up to Tier 1 status
New management team kicking goals. The appointment of an experienced, incentivised
management team is likely to see RCR realise its earnings potential over the medium term, in our
view. The new team is simplifying RCR‟s operating structure and procedures following a number
of acquisitions from 2001 to 2008.
More strong EBIT growth expected, quality improving. FY11 EBIT growth was 77.7%, mainly
due to improvement in the resources division and cost savings. We expect further strong growth of
40% in FY12, driven by improved utilisation and revenue growth. All divisions are expected to
report growth, with the early phase of the Fortescue contract to benefit the Resources and Power
divisions in particular.
RCR is cheap. Trading on a FY13 EV/EBITA ratio of 5.0x and a PER of 7.5x, we believe RCR
offers value.
Stepping up to Tier 1 status. The recent $600m Fortescue contract is a large focus of the
company and an opportunity to step up to tier 1 status in the SMP and E&I spaces. We see a
large opportunity for a new player in this space, which could lead to substantial earnings upgrades
over the medium term for RCR.
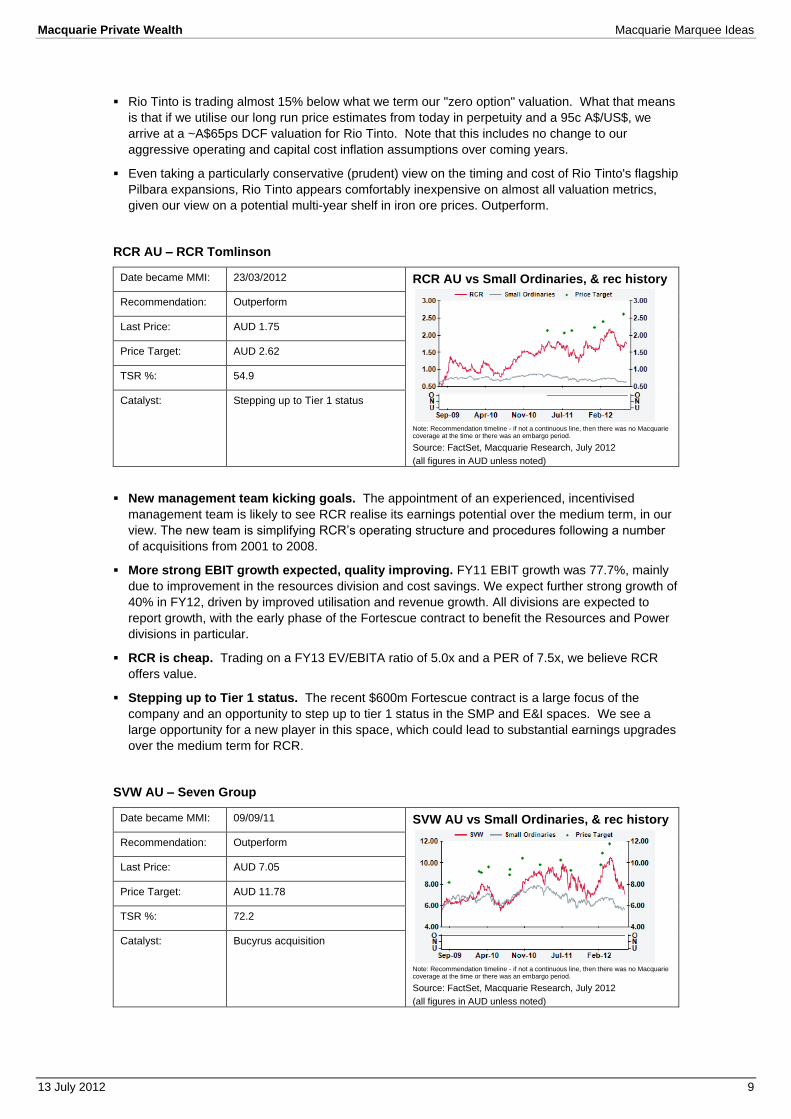
SVW AU – Seven Group
Date became MMI: 09/09/11 SVW AU vs Small Ordinaries, & rec history
Note: Recommendation timeline - if not a continuous line, then there was no Macquarie coverage at the time or there was an embargo period.
Source: FactSet, Macquarie Research, July 2012
(all figures in AUD unless noted)
Recommendation: Outperform
Last Price: AUD 7.05
Price Target: AUD 11.78
TSR %: 72.2
Catalyst:
Bucyrus acquisition

Macquarie Private Wealth Macquarie Marquee Ideas
13 July 2012 10
While our SVW call hasn‟t worked of late, we are maintaining our faith in the name. SVW is not
materially impacted by recent thermal coal weakness. WesTrac is performing strongly, with key
customer Fortescue spending $1.6bn on equipment. Revenue growth for both WesTrac Australia
and China was over 20% in H1. EBIT of $181.2m was well ahead of our $148.5m expectation and
up 67% on pcp. While gearing is high, it should reduce significantly post up to $1bn of planned
asset sales.
Outperform. We believe WesTrac is a quality business with substantial growth opportunities that
is being undervalued by the market.
QRN AU – QR National
Date became MMI: 05/06/12 QRN AU vs ASX 100, & rec history
Note: Recommendation timeline - if not a continuous line, then there was no Macquarie coverage at the time or there was an embargo period.
Source: FactSet, Macquarie Research, July 2012
(all figures in AUD unless noted)
Recommendation: Outperform
Last Price: AUD 3.30
Price Target: AUD 4.30
TSR %: 34.1
Catalyst:
QRN‟s share price performance
has been flat since the late March
profit warning, yet more than 50%
of its business is a regulated
asset.
QRN is semi defensive. 50% of the business is regulated, but importantly the income from the
asset is revenue-protected and thus offers a higher level of certainty versus peers. Moreover it
offers ~12%pa RAB growth over the next four years, nearly 50% above its closest rival. The
inherent value in the RAB is under appreciated. A RAB multiple of 1.20-1.25 is already being
reflected in comparable assets in this space. On this basis, 2/3rds of QRN‟s EV is supported by
the below rail business, irrespective of flooding or coal outlook.
QRN leverage remains too low. The regulated business can support debt of $2.9-3.5bn and
should still be able to maintain its BBB+ credit rating. This is before any consideration of
leveraging the above rail (AIO is ~2.7x ND: EBITDA in FY13). QRN FY13 debt is forecast at
$1.5bn; thus QRN we believe has at least $1.4-2.0bn of spare debt capacity, which would only
optimise the regulated assets. This is necessary to minimise the impact from any unfavourable
bond movements. Fear over QRN ability is unfounded, as growth in the RAB will support
additional leverage. A step change in debt adds 6-7% to eps, and 5% to the valuation.
PAIR TRADE – GPT AU – GPT Group (LONG) / SGP AU – Stockland (SHORT)
Date became MMI: 29/06/12 GPT AU vs ASX 200 Prop, & rec history
Note: Recommendation timeline - if not a continuous line, then there was no Macquarie coverage at the time or there was an embargo period.
Source: FactSet, Macquarie Research, July 2012
(all figures in AUD unless noted)
Recommendation: Outperform (Long)
Last Price: AUD 3.31
Price Target: AUD 3.50
TSR %: 11.5
Catalyst:
We believe GPT may provide a
positive refinement to guidance at
their 1H12 result in August.

Macquarie Private Wealth Macquarie Marquee Ideas
13 July 2012 11
Date became MMI: 29/06/12 SGP AU vs ASX 200 Prop, & rec history
Note: Recommendation timeline - if not a continuous line, then there was no Macquarie coverage at the time or there was an embargo period.
Source: FactSet, Macquarie Research, July 2012
(all figures in AUD unless noted)
Recommendation: Underperform (Short)
Last Price: AUD 3.16
Price Target: AUD 3.22
TSR %: 9.6
Catalyst:
Below-market FY13 guidance at
the result in August and continued
dilutive non-core asset sales.
Long GPT:
Current FY12 guidance appears conservative. We are of the view that GPT is able to achieve
FY12 EPS growth of 5.6%. This comprises operating income growth of 1.0%, supplemented by a
4.5% reduction in the share count due to the current on-market share buyback. This estimate
compares favourably to current operating EPS growth guidance of „at least CPI + 1%‟. We
therefore believe a positive mid-year earnings refinement could be delivered by the group. This
will be an attractive outcome for such a low risk proposition.
Key delta remains retail landscape but immediate impact low. GPT experienced a difficult
1Q12 on the retail leasing front, reporting an overall leasing spread of -6.0% (FY11: +2.0%). This
comprised flat on renewal deals (~50% of activity) and -10% on new deals (~50% of activity). As
highlighted in prior research, we continue to anticipate re-leasing spreads to remain negative and
incorporate this in our earnings estimates. Despite this, we note that the nearer-term impact on
earnings is more modest, as only 13.6% of specialties expire this year. Assuming a negative 10%
spread on these deals would still equate to +2.5% specialty rental growth overall.
Valuation metrics remain attractive. With the stock currently offering a TSR of ~11% on our
estimates, including a 6% dividend yield with earnings risk to the upside, we note GPT remains an
attractive investment proposition, particularly in light of its defensive, low risk nature.
Short SGP:
Risk to FY13 guidance with downside to market forecasts. In contrast to GPT, we believe
market earnings forecasts are too high and reflect an operating profit margin assumption that is
too optimistic. While we suspect many analysts have assumed the midpoint of SGP's operating
profit margin guidance (22.5%), we expect actual near-term margins will be ~20.0% at best due to
the drag from the roll-off of ~$580m of impaired inventory. We are ~3% below consensus in FY13
and ~5% below in FY14.
Retirement - the other negative delta. SGP own a 14.3% stake in FKP, who may look to
demerge its retirement assets from the main business. Should this demerger come to fruition, it is
likely to trigger a capital raising to both repay $125m in convertible bonds and de-gear the
respective balance sheets. Not only would this place further capital demands on SGP, but the
market is likely to view negatively either decision by SGP to participate or not.
Looking fairly valued and buyback running out of steam. With the stock hovering close to our
$3.22ps price target, SGP appears to be relatively fairly valued. The stock price has been
supported by the group's on-market buyback, which is now ~75% complete. We anticipate
downward pressure on the stock price as the buyback runs out of steam.

Macquarie Private Wealth Macquarie Marquee Ideas
13 July 2012 12
AMC AU – Amcor
Date became MMI: 05/07/12 AMC AU vs ASX 100, & rec history
Note: Recommendation timeline - if not a continuous line, then there was no Macquarie coverage at the time or there was an embargo period. Source: FactSet, Macquarie Research, July 2012
(all figures in AUD unless noted)
Recommendation: Outperform
Last Price: AUD 7.22
Price Target: AUD 7.70
TSR %: 12.7
Catalyst:
Result 21 Aug. We believe
earnings guidance for growth next
year will be a positive given the
current environment.
Refresh of views post the recent North American analyst tour. The trip highlighted the clear
potential for organic and acquisitive growth in a number of categories, including Diversified
Products (DPs), tobacco in LatAm and Medical Flexibles.
We expect a solid FY12 result of $634m on August 21 and forecast 8% earnings growth in FY13
driven by Alcan and Ball synergies, Aperio and Botany start-up coupled with defensive end-
markets. This is in the context of a tough broader earnings environment. Attributes of relative
earnings certainty, a management team which is delivering and a solid dividend yield are highly
desirable at present.
PAIR TRADE – NAB AU – National Australia Bank (LONG) / CBA AU – Commonwealth Bank (SHORT)
Date became MMI: 05/07/12 NAB AU vs ASX 100, & rec history
Note: Recommendation timeline - if not a continuous line, then there was no Macquarie coverage at the time or there was an embargo period.
Source: FactSet, Macquarie Research, July 2012
(all figures in AUD unless noted)
Recommendation: Outperform (Long)
Last Price: AUD 23.59
Price Target: AUD 27.66
TSR %: 25.3
Catalyst:
3Q update in August
Date became MMI: 05/07/12 CBA AU vs ASX 100, & rec history
Note: Recommendation timeline - if not a continuous line, then there was no Macquarie coverage at the time or there was an embargo period.
Source: FactSet, Macquarie Research, July 2012
(all figures in AUD unless noted)
Recommendation: Underperform (Short)
Last Price: AUD 53.60
Price Target: AUD 48.52
TSR %: - 3.2
Catalyst:
Full year results in August
Long NAB:
NAB appear to have come clean on their exposure to the UK region – Whilst there is downside
risk, we have captured this in our valuation, with effective write-downs on UK CRE book of 15%,
being higher than local banks.

Macquarie Private Wealth Macquarie Marquee Ideas
13 July 2012 13
Margins – NAB has been the most aggressive on repricing and will have more levers heading in to
an election year – NAB has been the most aggressive in repricing to date across both mortgages
(31bp since March) and business lending (18bp liquidity margin) offsetting rising funding costs.
Credit growth – Business looking better than housing; APRA data showed business lending
outperforming mortgage credit, benefiting NAB being the dominant banker to businesses.
Provisioning – Cumulative write-off analysis shows NAB is covered at similar levels to the other
majors except WBC.
On P/E basis, NAB is the cheapest across the majors at ~9x
Short CBA:
RoE likely to be under pressure from competitive intensity, regulatory changes, balance sheet
quality drive and incremental investment. We see the retail business coming under pressure as
growth slows, pro-cyclicality increasing capital intensity, wealth flows continuing to weaken and
regulatory changes all putting downward pressure on RoE
Questions over capital generation – 3Q update showed Tier 1 capital generation for the sector
was +1 to 27bp on a Basel 2.5 basis, compared to CBA‟s 15bp decline in 3Q (-12bp, move to
Basel 2.5; -10bp IRRB; and hence 7bp underlying capital generation). Normalising out previous
paper losses could suggest that capital generation for the quarter may have been negative.
Domestic asset quality outlook not as good as 18bp BDD charge suggests – The 3Q12 BDD
charge of $232m (18bp) is exceptionally low given the macro environment in our view. Specific
provision coverage was flat at (47%), whilst housing NPLs increased 5% QoQ. Non-housing NPLs
declined 5% QoQ. While CBA has the cleanest book of the majors, we continue to believe that the
bad debt charge is unsustainably low at this point.
Limited PPoP growth raises questions about revenue trajectory – The 3Q pre-provision profit
(c$2.73b) is similar to 1Q12 ($2.76b) and 2Q12 ($2.75b), indicating limited PPoP momentum. We
have questions over near-term revenue momentum, particularly given CBA appears to be losing
market share based on recent APRA data.
On a valuation basis, CBA is above our 12-month target price and estimated to return a -3.2%
TSR over the year. While CBA is a quality bank and has always traded at a premium to the
sector, it is now trading on a record PE+PBV premium to peers. Decomposition of CBA‟s two-year
sector outperformance shows performance has been driven exclusively by PE expansion. Without
better-than-peer earnings delivery soon, a de-rating is a distinct possibility. (see Dividend
expectations too high, 6/7/12)
Macquarie Marquee Ideas – Performance
Code/Stock Type Start Date
Excess return since
inception %* Excess return over last
week %*
RIO – Rio Tinto Buy 01/04/11 -22.3 -2.2
SVW – Seven Group Buy 09/09/11 -16.6 -4.7
NCM – Newcrest Buy 03/02/12 -32.7 -5.3
DJS – David Jones Buy 22/03/12 5.7 -3.0
RCR – RCR Tomlinson Buy 23/03/12 -13.5 -0.5
MRM – Mermaid Marine Buy 22/05/12 -9.8 -2.9
AQG – Alacer Gold Buy 22/05/12 -21.2 -7.8
IPL – Incitec Pivot Buy 01/06/12 4.4 -0.5
QRN – QR National Buy 05/06/12 -6.4 0.6
Long GPT/Short SGP Pairs 29/06/12 -2.1
Long NAB/Short CBA Pairs 05/07/12 1.0
AMC – Amcor Buy 05/07/12 3.9 -0.8
Source: Macquarie Research, FactSet pricing, July 2012 *Not annualised

Macquarie Private Wealth Macquarie Marquee Ideas
13 July 2012 14
Macquarie Research earnings revisions
The table below highlights all earnings revisions during the past week. Earnings revisions are classified as either upwards or
downwards according to their overall % change in EPS for FY1, FY2 and FY3. Earnings forecasts are adjusted earnings.
Note: All figures are in the currency in which the company reports.
Adjusted Profit EPS
Ccy From To % Chg. From To % Chg. Reason
Upward Revisions
Austal AUD 06/12 5.40 10.65 97.2% 2.87 5.66 97.2% Updated for revised Australian assumptions. See Essentials 5
(ASB.AU)
06/13 44.09 44.17 0.2% 23.44 23.49 0.2% July.
06/14 70.59 70.21 -0.5% 37.54 37.33 -0.5%
Ausdrill AUD 06/12 114.64 114.64 0.0% 37.38 37.38 0.0% Updated FY13 assumptions. See Essentials 3 July.
(ASL.AU)
06/13 121.26 129.55 6.8% 39.21 41.86 6.7%
06/14 148.13 149.79 1.1% 47.42 47.85 0.9%
BT Investment Management AUD 09/12 43.40 44.15 1.7% 15.18 15.44 1.7% Minor revisions following release of June FUM balances and
(BTT.AU)
09/13 48.73 46.28 -5.0% 17.04 16.19 -5.0% performance fees. FY12 Performance fee of $8.1m slightly ahead
09/14 53.74 51.98 -3.3% 18.79 18.18 -3.3% of our $7m forecast. See Essentials 2 July.
Caltex Australia AUD 12/12 342.61 369.64 7.9% 126.89 136.90 7.9% Adjusted forecasts for 1H12 interim guidance. See Essentials 29
(CTX.AU)
12/13 364.39 363.69 -0.2% 134.96 134.70 -0.2% June
12/14 288.63 287.74 -0.3% 106.90 106.57 -0.3%
Crown AUD 06/12 409.27 434.65 6.2% 55.60 59.09 6.3% We have reviewed our earnings forecasts for Crown to reflect
(CWN.AU)
06/13 497.39 479.05 -3.7% 68.29 65.77 -3.7% softness in the consumer environment, as well as incorporating
06/14 601.17 559.72 -6.9% 82.53 76.84 -6.9% See Essentials 27 June.
Domino's Pizza Enterprises AUD 06/12 25.57 26.35 3.0% 35.81 36.83 2.9% Earnings revisions prior to FY12 result announcement. See
(DMP.AU)
06/13 29.90 31.39 5.0% 41.69 43.74 4.9% Essentials 12 July.
06/14 33.57 35.36 5.4% 46.81 49.20 5.1%
Rialto Energy AUD 06/12 -8.77 -8.77 0.0% -1.95 -1.95 0.0% Adjusted production profile. See Essentials 27 June
(RIA.AU)
06/13 -19.57 -18.54 5.3% -1.67 -1.59 5.2%
06/14 81.00 44.44 -45.1% 5.51 2.79 -49.4%
Reckon AUD 12/12 19.19 19.59 2.1% 14.43 14.81 2.6% Upgraded FY12 and FY13 EPS to take into account Linden House
(RKN.AU)
12/13 20.53 21.26 3.5% 15.44 16.32 5.8% acquisition and further price rises in the Business Division.
12/14 20.68 22.19 7.3% 15.54 17.04 9.6% See Essentials 11 July.
UGL AUD 06/12 169.16 169.86 0.4% 102.34 102.76 0.4% We reduce our FY13 and 14 eps by 5% and 7% respectively to
(UGL.AU)
06/13 195.42 185.61 -5.0% 118.22 112.29 -5.0% reflect a flatter outlook for UGL's Resources and Infrastructure
06/14 217.34 202.43 -6.9% 131.49 122.47 -6.9% divisions. See Essentials 11 July.
Whitehaven Coal AUD 06/12 72.29 76.33 5.6% 7.44 7.53 1.3% Rebuilt model following merger with Aston and acquisition of
(WHC.AU)
06/13 70.02 114.57 63.6% 7.21 11.31 56.9% Boardwalk. See Essentials 20 June.
06/14 145.06 228.27 57.4% 14.93 22.53 50.9%
Downward Revisions
Automotive Holdings Group AUD 06/12 63.50 62.47 -1.6% 24.41 24.01 -1.6% Updated for acquisitions. See Essentials 6 July.
(AHE.AU)
06/13 69.51 72.77 4.7% 26.72 27.97 4.7%
06/14 76.65 80.70 5.3% 29.47 31.02 5.3%
Auckland International Airport NZD 06/12 138.60 138.60 0.0% 10.52 10.48 -0.3% Revised following latest price reset on aeronautical charges.
(AIA.NZ)
06/13 148.96 153.51 3.1% 11.30 11.61 2.7% See Essentials 22 June.
06/14 156.34 169.71 8.6% 11.86 12.83 8.2%
Aust Infrastructure Fund AUD 06/12 27.01 22.48 -16.8% 4.35 3.62 -16.8% Updated for internalisation. See Essentials 2 July.
(AIX.AU)
06/13 44.28 15.06 -66.0% 7.13 2.43 -66.0%
06/14 51.96 79.45 52.9% 8.37 12.80 52.9%
Aristocrat Leisure AUD 12/12 105.69 88.04 -16.7% 19.16 15.97 -16.7% Update re 1H12 profit expectations. See Essentials 3 July.
(ALL.AU)
12/13 132.74 115.17 -13.2% 23.54 20.54 -12.7%
12/14 141.07 134.87 -4.4% 24.65 23.74 -3.7%
Ansell USD 06/12 134.81 134.81 0.0% 102.70 102.70 0.0% Revised forecasts for Industrial and New Verticals divisions,
(ANN.AU)
06/13 154.64 145.02 -6.2% 118.35 110.99 -6.2% post US ISM and EU PMI monthly data showing decline. See
06/14 168.14 159.59 -5.1% 128.69 122.14 -5.1% Essentials 4 July.
APN News & Media AUD 12/12 86.40 73.58 -14.8% 13.35 11.39 -14.7% Updated for Brands Exclusive transaction, outdoor JV transaction
(APN.AU)
12/13 88.87 76.36 -14.1% 13.16 11.43 -13.2% and difficult trading conditions. See Essentials 22 June.
12/14 94.30 82.82 -12.2% 13.38 11.98 -10.5%

Macquarie Private Wealth Macquarie Marquee Ideas
13 July 2012 15
Adjusted Profit EPS
Ccy From To % Chg. From To % Chg. Reason
Bradken AUD 06/12 99.34 95.37 -4.0% 59.72 57.33 -4.0% Revision to earnings reflects a softening in the outlook for OEM
(BKN.AU)
06/13 132.09 118.06 -10.6% 76.32 68.94 -9.7% demand. See Essentials 11 July.
06/14 146.04 134.19 -8.1% 81.96 76.54 -6.6%
Boral AUD 06/12 132.86 97.76 -26.4% 17.93 13.14 -26.7% Boral downgrade to FY12 guidance. See Essentials 28 June.
(BLD.AU)
06/13 213.32 148.53 -30.4% 28.64 19.58 -31.6%
06/14 302.14 218.57 -27.7% 40.57 28.81 -29.0%
Bank of Queensland AUD 08/12 45.00 45.00 0.0% 7.70 7.70 0.0% Earnings downgrade - see following note on no sale of loan
(BOQ.AU)
08/13 236.79 221.66 -6.4% 75.25 70.44 -6.4% portfolio. See Essentials 28 June.
08/14 242.40 242.40 0.0% 74.20 74.20 0.0%
Energy Resources of Australia AUD 12/12 -67.53 -138.08
-104.5% -13.04 -26.67 -104.5% Q2 Production report. See Essentials 12 July.
(ERA.AU)
12/13 -118.54 -178.59 -50.7% -22.90 -34.49 -50.7%
12/14 -76.52 -139.92 -82.8% -14.78 -27.03 -82.8%
Iluka Resources AUD 12/12 725.36 342.94 -52.7% 173.22 81.90 -52.7% 1H12 sales reported. Material downgrades. FY12EPPs downgraded
(ILU.AU)
12/13 1184.54 468.80 -60.4% 282.88 111.95 -60.4% 53%, FY13EPS down 60%, FY14EPS down 59%. See Essentials 11 July.
12/14 1246.61 514.98 -58.7% 297.70 122.98 -58.7%
Oakton AUD 06/12 10.66 9.99 -6.3% 11.45 10.75 -6.1% We have reduced FY12/FY13 EPS by -6.1% and -15.4% due to a
(OKN.AU)
06/13 12.63 10.65 -15.7% 13.53 11.44 -15.4% weaker macro and hence lower revenue assumptions. See Essentials
06/14 14.20 12.05 -15.1% 15.18 12.92 -14.9% 9 July.
Perpetual AUD 06/12 65.00 63.84 -1.8% 147.58 144.94 -1.8% Update for strategy update. Changes to earnings following sale of
(PPT.AU)
06/13 61.33 57.28 -6.6% 138.78 129.30 -6.8% mortgage servicing business and cost outs across the business. See
06/14 75.36 80.09 6.3% 170.54 180.81 6.0% Essentials 26 June.
Restaurant Brands NZD 02/13 21.69 19.62 -9.5% 22.17 20.06 -9.5% FY13 EPS lowered due primarily to higher depreciation and G&A
(RBD.NZ)
02/14 25.28 23.56 -6.8% 25.84 24.09 -6.8% costs. See Essentials 12 July.
02/15 28.06 28.29 0.8% 28.69 28.92 0.8%
SAI Global AUD 06/12 52.72 52.72 0.0% 26.07 26.07 0.0% Reduced FY13 EPS by 6% due to softer assumptions for Compliance
(SAI.AU)
06/13 65.24 61.33 -6.0% 32.27 30.33 -6.0% Services. See Essentials 6 July.
06/14 72.07 67.75 -6.0% 35.64 33.51 -6.0%
Skilled Group AUD 06/12 49.48 49.00 -1.0% 21.20 21.00 -1.0% Reduced FY13 EPS by 2% to reflect softer OMS expectations. See
(SKE.AU)
06/13 55.05 54.22 -1.5% 23.57 23.22 -1.5% Essentials 6 July.
06/14 57.83 61.51 6.4% 24.76 26.34 6.4%
Source: Macquarie Research, Factset pricing, July 2012

Macquarie Private Wealth Macquarie Marquee Ideas
13 July 2012 16
Macquarie Research recommendation changes
Note: All figures are in the currency in which the company reports.
Recommendation
Company From To Comment
Upward Revisions
Aristocrat Leisure UNDERPERFORM NEUTRAL Upgrade to Neutral following the recent stock price correction and the 1H12 profit outlook. See
(ALL.AU)
Essentials 3 July.
National Australia Bank NEUTRAL OUTPERFORM Move to Outperform. We adjust our margin forecasts up slightly to reflect recent repricing.
(NAB.AU)
Earnings move up 1-2%. See Essentials 4 July.
Downward Revisions
Aust Infrastructure Fund OUTPERFORM NEUTRAL AIX is trading similar to SYD in terms of discount to NAV. AIX multiple has expanded and the
(AIX.AU)
internalisation has been factored in. See Essentials 2 July.
Ansell OUTPERFORM NEUTRAL Downgrade to Neutral. With a market-leading position in each product area, we remain positive
(ANN.AU)
on ANN for the longer-term. In the near-term however we do see risk to the stock given the challenges each Division faces in FY13. See Essentials 4 July.
Boral NEUTRAL UNDERPERFORM We moved to an Underperform recommendation from Neutral. Weather impacts, a tough
(BLD.AU)
domestic housing outlook in CY12 together with a slow recovery in the non-residential market is likely to see trading conditions remain challenging for BLD. See Essentials 28 June.
Cochlear OUTPERFORM NEUTRAL Downgrade to Neutral. With COH outperforming the market by 16% over the past 6 months and
(COH.AU)
now trading in line with our valuation, we believe the stock is currently fairly valued. See Essentials 27 June.
Domino's Pizza Enterprises OUTPERFORM NEUTRAL DMP is a high quality business with strong and growing free cashflow, an undergeared balance
(DMP.AU)
sheet and a strong medium term growth outlook. However, current multiples are demanding. Recommendation reduced to Neutral. See Essentials 12 July.
UGL OUTPERFORM NEUTRAL UGL's share price has held up well in recent months. We have pulled back our recommendation
(UGL.AU)
to Neutral from Outperform on valuation grounds. See Essentials 11 July.
Source: Macquarie Research, Factset pricing, July 2012
Ma
cq
ua
rie P
rivate
Wealth
M
acqu
arie
Marq
ue
e Id
eas
13 J
uly
20
12
17
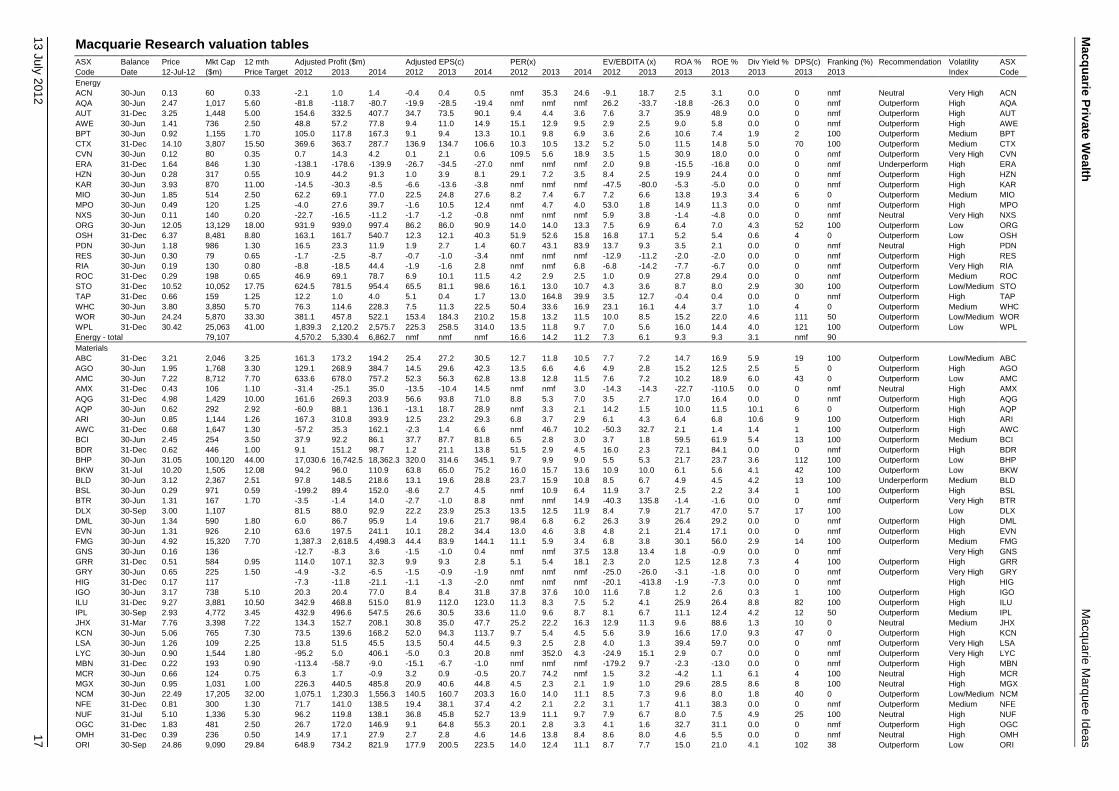
Macquarie Research valuation tables
ASX Balance Price Mkt Cap 12 mth Adjusted Profit ($m) Adjusted EPS(c) PER(x) EV/EBDITA (x) ROA % ROE % Div Yield % DPS(c) Franking (%) Recommendation Volatility ASX
Code Date 12-Jul-12 ($m) Price Target 2012 2013 2014 2012 2013 2014 2012 2013 2014 2012 2013 2013 2013 2013 2013 2013 Index Code
Energy ACN 30-Jun 0.13 60 0.33 -2.1 1.0 1.4 -0.4 0.4 0.5 nmf 35.3 24.6 -9.1 18.7 2.5 3.1 0.0 0 nmf Neutral Very High ACN
AQA 30-Jun 2.47 1,017 5.60 -81.8 -118.7 -80.7 -19.9 -28.5 -19.4 nmf nmf nmf 26.2 -33.7 -18.8 -26.3 0.0 0 nmf Outperform High AQA
AUT 31-Dec 3.25 1,448 5.00 154.6 332.5 407.7 34.7 73.5 90.1 9.4 4.4 3.6 7.6 3.7 35.9 48.9 0.0 0 nmf Outperform High AUT
AWE 30-Jun 1.41 736 2.50 48.8 57.2 77.8 9.4 11.0 14.9 15.1 12.9 9.5 2.9 2.5 9.0 5.8 0.0 0 nmf Outperform High AWE
BPT 30-Jun 0.92 1,155 1.70 105.0 117.8 167.3 9.1 9.4 13.3 10.1 9.8 6.9 3.6 2.6 10.6 7.4 1.9 2 100 Outperform Medium BPT
CTX 31-Dec 14.10 3,807 15.50 369.6 363.7 287.7 136.9 134.7 106.6 10.3 10.5 13.2 5.2 5.0 11.5 14.8 5.0 70 100 Outperform Medium CTX
CVN 30-Jun 0.12 80 0.35 0.7 14.3 4.2 0.1 2.1 0.6 109.5 5.6 18.9 3.5 1.5 30.9 18.0 0.0 0 nmf Outperform Very High CVN
ERA 31-Dec 1.64 846 1.30 -138.1 -178.6 -139.9 -26.7 -34.5 -27.0 nmf nmf nmf 2.0 9.8 -15.5 -16.8 0.0 0 nmf Underperform High ERA
HZN 30-Jun 0.28 317 0.55 10.9 44.2 91.3 1.0 3.9 8.1 29.1 7.2 3.5 8.4 2.5 19.9 24.4 0.0 0 nmf Outperform High HZN
KAR 30-Jun 3.93 870 11.00 -14.5 -30.3 -8.5 -6.6 -13.6 -3.8 nmf nmf nmf -47.5 -80.0 -5.3 -5.0 0.0 0 nmf Outperform High KAR
MIO 30-Jun 1.85 514 2.50 62.2 69.1 77.0 22.5 24.8 27.6 8.2 7.4 6.7 7.2 6.6 13.8 19.3 3.4 6 0 Outperform Medium MIO
MPO 30-Jun 0.49 120 1.25 -4.0 27.6 39.7 -1.6 10.5 12.4 nmf 4.7 4.0 53.0 1.8 14.9 11.3 0.0 0 nmf Outperform High MPO
NXS 30-Jun 0.11 140 0.20 -22.7 -16.5 -11.2 -1.7 -1.2 -0.8 nmf nmf nmf 5.9 3.8 -1.4 -4.8 0.0 0 nmf Neutral Very High NXS
ORG 30-Jun 12.05 13,129 18.00 931.9 939.0 997.4 86.2 86.0 90.9 14.0 14.0 13.3 7.5 6.9 6.4 7.0 4.3 52 100 Outperform Low ORG
OSH 31-Dec 6.37 8,481 8.80 163.1 161.7 540.7 12.3 12.1 40.3 51.9 52.6 15.8 16.8 17.1 5.2 5.4 0.6 4 0 Outperform Low OSH
PDN 30-Jun 1.18 986 1.30 16.5 23.3 11.9 1.9 2.7 1.4 60.7 43.1 83.9 13.7 9.3 3.5 2.1 0.0 0 nmf Neutral High PDN
RES 30-Jun 0.30 79 0.65 -1.7 -2.5 -8.7 -0.7 -1.0 -3.4 nmf nmf nmf -12.9 -11.2 -2.0 -2.0 0.0 0 nmf Outperform High RES
RIA 30-Jun 0.19 130 0.80 -8.8 -18.5 44.4 -1.9 -1.6 2.8 nmf nmf 6.8 -6.8 -14.2 -7.7 -6.7 0.0 0 nmf Outperform Very High RIA
ROC 31-Dec 0.29 198 0.65 46.9 69.1 78.7 6.9 10.1 11.5 4.2 2.9 2.5 1.0 0.9 27.8 29.4 0.0 0 nmf Outperform Medium ROC
STO 31-Dec 10.52 10,052 17.75 624.5 781.5 954.4 65.5 81.1 98.6 16.1 13.0 10.7 4.3 3.6 8.7 8.0 2.9 30 100 Outperform Low/Medium STO
TAP 31-Dec 0.66 159 1.25 12.2 1.0 4.0 5.1 0.4 1.7 13.0 164.8 39.9 3.5 12.7 -0.4 0.4 0.0 0 nmf Outperform High TAP
WHC 30-Jun 3.80 3,850 5.70 76.3 114.6 228.3 7.5 11.3 22.5 50.4 33.6 16.9 23.1 16.1 4.4 3.7 1.0 4 0 Outperform Medium WHC
WOR 30-Jun 24.24 5,870 33.30 381.1 457.8 522.1 153.4 184.3 210.2 15.8 13.2 11.5 10.0 8.5 15.2 22.0 4.6 111 50 Outperform Low/Medium WOR
WPL 31-Dec 30.42 25,063 41.00 1,839.3 2,120.2 2,575.7 225.3 258.5 314.0 13.5 11.8 9.7 7.0 5.6 16.0 14.4 4.0 121 100 Outperform Low WPL
Energy - total 79,107 4,570.2 5,330.4 6,862.7 nmf nmf nmf 16.6 14.2 11.2 7.3 6.1 9.3 9.3 3.1 nmf 90
Materials ABC 31-Dec 3.21 2,046 3.25 161.3 173.2 194.2 25.4 27.2 30.5 12.7 11.8 10.5 7.7 7.2 14.7 16.9 5.9 19 100 Outperform Low/Medium ABC
AGO 30-Jun 1.95 1,768 3.30 129.1 268.9 384.7 14.5 29.6 42.3 13.5 6.6 4.6 4.9 2.8 15.2 12.5 2.5 5 0 Outperform High AGO
AMC 30-Jun 7.22 8,712 7.70 633.6 678.0 757.2 52.3 56.3 62.8 13.8 12.8 11.5 7.6 7.2 10.2 18.9 6.0 43 0 Outperform Low AMC
AMX 31-Dec 0.43 106 1.10 -31.4 -25.1 35.0 -13.5 -10.4 14.5 nmf nmf 3.0 -14.3 -14.3 -22.7 -110.5 0.0 0 nmf Neutral High AMX
AQG 31-Dec 4.98 1,429 10.00 161.6 269.3 203.9 56.6 93.8 71.0 8.8 5.3 7.0 3.5 2.7 17.0 16.4 0.0 0 nmf Outperform High AQG
AQP 30-Jun 0.62 292 2.92 -60.9 88.1 136.1 -13.1 18.7 28.9 nmf 3.3 2.1 14.2 1.5 10.0 11.5 10.1 6 0 Outperform High AQP
ARI 30-Jun 0.85 1,144 1.26 167.3 310.8 393.9 12.5 23.2 29.3 6.8 3.7 2.9 6.1 4.3 6.4 6.8 10.6 9 100 Outperform High ARI
AWC 31-Dec 0.68 1,647 1.30 -57.2 35.3 162.1 -2.3 1.4 6.6 nmf 46.7 10.2 -50.3 32.7 2.1 1.4 1.4 1 100 Outperform High AWC
BCI 30-Jun 2.45 254 3.50 37.9 92.2 86.1 37.7 87.7 81.8 6.5 2.8 3.0 3.7 1.8 59.5 61.9 5.4 13 100 Outperform Medium BCI
BDR 31-Dec 0.62 446 1.00 9.1 151.2 98.7 1.2 21.1 13.8 51.5 2.9 4.5 16.0 2.3 72.1 84.1 0.0 0 nmf Outperform High BDR
BHP 30-Jun 31.05 100,120 44.00 17,030.6 16,742.5 18,362.3 320.0 314.6 345.1 9.7 9.9 9.0 5.5 5.3 21.7 23.7 3.6 112 100 Outperform Low BHP
BKW 31-Jul 10.20 1,505 12.08 94.2 96.0 110.9 63.8 65.0 75.2 16.0 15.7 13.6 10.9 10.0 6.1 5.6 4.1 42 100 Outperform Low BKW
BLD 30-Jun 3.12 2,367 2.51 97.8 148.5 218.6 13.1 19.6 28.8 23.7 15.9 10.8 8.5 6.7 4.9 4.5 4.2 13 100 Underperform Medium BLD
BSL 30-Jun 0.29 971 0.59 -199.2 89.4 152.0 -8.6 2.7 4.5 nmf 10.9 6.4 11.9 3.7 2.5 2.2 3.4 1 100 Outperform High BSL
BTR 30-Jun 1.31 167 1.70 -3.5 -1.4 14.0 -2.7 -1.0 8.8 nmf nmf 14.9 -40.3 135.8 -1.4 -1.6 0.0 0 nmf Outperform Very High BTR
DLX 30-Sep 3.00 1,107
81.5 88.0 92.9 22.2 23.9 25.3 13.5 12.5 11.9 8.4 7.9 21.7 47.0 5.7 17 100
Low DLX
DML 30-Jun 1.34 590 1.80 6.0 86.7 95.9 1.4 19.6 21.7 98.4 6.8 6.2 26.3 3.9 26.4 29.2 0.0 0 nmf Outperform High DML
EVN 30-Jun 1.31 926 2.10 63.6 197.5 241.1 10.1 28.2 34.4 13.0 4.6 3.8 4.8 2.1 21.4 17.1 0.0 0 nmf Outperform High EVN
FMG 30-Jun 4.92 15,320 7.70 1,387.3 2,618.5 4,498.3 44.4 83.9 144.1 11.1 5.9 3.4 6.8 3.8 30.1 56.0 2.9 14 100 Outperform Medium FMG
GNS 30-Jun 0.16 136
-12.7 -8.3 3.6 -1.5 -1.0 0.4 nmf nmf 37.5 13.8 13.4 1.8 -0.9 0.0 0 nmf
Very High GNS
GRR 31-Dec 0.51 584 0.95 114.0 107.1 32.3 9.9 9.3 2.8 5.1 5.4 18.1 2.3 2.0 12.5 12.8 7.3 4 100 Outperform High GRR
GRY 30-Jun 0.65 225 1.50 -4.9 -3.2 -6.5 -1.5 -0.9 -1.9 nmf nmf nmf -25.0 -26.0 -3.1 -1.8 0.0 0 nmf Outperform Very High GRY
HIG 31-Dec 0.17 117
-7.3 -11.8 -21.1 -1.1 -1.3 -2.0 nmf nmf nmf -20.1 -413.8 -1.9 -7.3 0.0 0 nmf
High HIG
IGO 30-Jun 3.17 738 5.10 20.3 20.4 77.0 8.4 8.4 31.8 37.8 37.6 10.0 11.6 7.8 1.2 2.6 0.3 1 100 Outperform High IGO
ILU 31-Dec 9.27 3,881 10.50 342.9 468.8 515.0 81.9 112.0 123.0 11.3 8.3 7.5 5.2 4.1 25.9 26.4 8.8 82 100 Outperform High ILU
IPL 30-Sep 2.93 4,772 3.45 432.9 496.6 547.5 26.6 30.5 33.6 11.0 9.6 8.7 8.1 6.7 11.1 12.4 4.2 12 50 Outperform Medium IPL
JHX 31-Mar 7.76 3,398 7.22 134.3 152.7 208.1 30.8 35.0 47.7 25.2 22.2 16.3 12.9 11.3 9.6 88.6 1.3 10 0 Neutral Medium JHX
KCN 30-Jun 5.06 765 7.30 73.5 139.6 168.2 52.0 94.3 113.7 9.7 5.4 4.5 5.6 3.9 16.6 17.0 9.3 47 0 Outperform High KCN
LSA 30-Jun 1.26 109 2.25 13.8 51.5 45.5 13.5 50.4 44.5 9.3 2.5 2.8 4.0 1.3 39.4 59.7 0.0 0 nmf Outperform Very High LSA
LYC 30-Jun 0.90 1,544 1.80 -95.2 5.0 406.1 -5.0 0.3 20.8 nmf 352.0 4.3 -24.9 15.1 2.9 0.7 0.0 0 nmf Outperform Very High LYC
MBN 31-Dec 0.22 193 0.90 -113.4 -58.7 -9.0 -15.1 -6.7 -1.0 nmf nmf nmf -179.2 9.7 -2.3 -13.0 0.0 0 nmf Outperform High MBN
MCR 30-Jun 0.66 124 0.75 6.3 1.7 -0.9 3.2 0.9 -0.5 20.7 74.2 nmf 1.5 3.2 -4.2 1.1 6.1 4 100 Neutral High MCR
MGX 30-Jun 0.95 1,031 1.00 226.3 440.5 485.8 20.9 40.6 44.8 4.5 2.3 2.1 1.9 1.0 29.6 28.5 8.6 8 100 Neutral High MGX
NCM 30-Jun 22.49 17,205 32.00 1,075.1 1,230.3 1,556.3 140.5 160.7 203.3 16.0 14.0 11.1 8.5 7.3 9.6 8.0 1.8 40 0 Outperform Low/Medium NCM
NFE 31-Dec 0.81 300 1.30 71.7 141.0 138.5 19.4 38.1 37.4 4.2 2.1 2.2 3.1 1.7 41.1 38.3 0.0 0 nmf Outperform Medium NFE
NUF 31-Jul 5.10 1,336 5.30 96.2 119.8 138.1 36.8 45.8 52.7 13.9 11.1 9.7 7.9 6.7 8.0 7.5 4.9 25 100 Neutral High NUF
OGC 31-Dec 1.83 481 2.50 26.7 172.0 146.9 9.1 64.8 55.3 20.1 2.8 3.3 4.1 1.6 32.7 31.1 0.0 0 nmf Outperform High OGC
OMH 31-Dec 0.39 236 0.50 14.9 17.1 27.9 2.7 2.8 4.6 14.6 13.8 8.4 8.6 8.0 4.6 5.5 0.0 0 nmf Neutral High OMH
ORI 30-Sep 24.86 9,090 29.84 648.9 734.2 821.9 177.9 200.5 223.5 14.0 12.4 11.1 8.7 7.7 15.0 21.0 4.1 102 38 Outperform Low ORI

Ma
cq
ua
rie P
rivate
Wealth
M
acqu
arie
Marq
ue
e Id
eas
13 J
uly
20
12
18
ASX Balance Price Mkt Cap 12 mth Adjusted Profit ($m) Adjusted EPS(c) PER(x) EV/EBDITA (x) ROA % ROE % Div Yield % DPS(c) Franking (%) Recommendation Volatility ASX
Code Date 12-Jul-12 ($m) Price Target 2012 2013 2014 2012 2013 2014 2012 2013 2014 2012 2013 2013 2013 2013 2013 2013 Index Code
OZL 31-Dec 7.55 2,293 12.33 172.2 211.8 177.9 55.9 69.4 58.3 13.5 10.9 13.0 2.9 3.1 8.3 7.6 4.6 35 50 Outperform Medium OZL
PAN 30-Jun 0.62 149
8.8 8.0 5.1 4.2 3.8 2.4 14.7 16.3 25.5 1.2 1.4 0.2 2.6 2.5 2 100
High PAN
PEM 31-Dec 0.27 208 0.50 40.5 66.1 73.5 5.1 8.3 9.3 5.3 3.2 2.9 3.2 2.3 14.1 15.4 0.0 0 nmf Outperform High PEM
PNA 31-Dec 2.53 1,530 3.70 197.7 300.9 242.9 33.3 50.7 40.9 7.6 5.0 6.2 4.1 2.9 29.1 28.6 0.0 0 nmf Outperform High PNA
PRU 30-Jun 2.45 1,122 3.30 47.7 125.4 193.6 11.3 29.7 45.8 21.7 8.3 5.3 22.6 5.2 30.9 30.2 0.0 0 nmf Outperform High PRU
RIO 31-Dec 55.65 24,250 88.00 11,357.2 13,276.8 12,641.9 596.1 698.7 665.3 9.3 8.0 8.4 5.2 4.6 17.8 21.9 2.7 148 100 Outperform Low/Medium RIO
SBM 30-Jun 1.44 466 2.30 116.9 162.7 104.6 39.9 55.5 35.7 3.6 2.6 4.0 1.7 1.5 21.8 26.1 0.0 0 nmf Neutral High SBM
SFR 30-Jun 6.96 1,055 7.00 -41.1 326.0 284.6 -27.3 215.7 188.3 nmf 3.2 3.7 -23.7 2.4 66.5 124.9 0.0 0 nmf Neutral High SFR
SGM 30-Jun 8.95 1,833 11.21 90.2 149.3 237.5 43.8 72.5 115.4 20.4 12.3 7.8 7.6 5.8 6.3 6.1 6.6 59 43 Underperform Medium SGM
TRY 30-Jun 3.95 353 6.50 59.7 122.5 101.5 67.1 137.6 114.1 5.9 2.9 3.5 2.6 1.4 75.0 54.2 0.8 3 0 Outperform Medium TRY
WSA 30-Jun 3.90 701 5.90 55.7 58.4 78.4 31.0 32.5 43.6 12.6 12.0 8.9 6.9 5.8 14.5 18.0 4.4 17 0 Outperform Medium WSA
YAL 30-Jun 1.02 1,009 1.80 86.1 60.0 215.8 16.0 6.0 21.7 6.3 16.9 4.7 18.3 8.2 5.4 2.4 0.0 0 nmf Neutral Very High YAL
Materials - total 222,149 34,964.7 41,191.7 45,876.6 nmf nmf nmf 11.3 9.5 8.3 5.9 5.1 16.6 19.1 3.4 nmf 80
Industrials AAX 31-Dec 3.42 424 4.12 39.9 48.5 53.1 32.0 38.7 42.3 10.7 8.8 8.1 6.4 5.5 14.2 17.2 5.6 19 35 Outperform High AAX
AIO 30-Jun 4.26 4,155 6.55 239.7 373.8 416.3 24.6 38.3 42.7 17.3 11.1 10.0 7.8 6.4 10.1 10.7 2.7 12 100 Outperform Low AIO
AIX 30-Jun 2.40 1,490 2.42 22.5 15.1 79.5 3.6 2.4 12.8 66.3 98.9 18.8 -15.4 -6.2 12.7 0.8 4.4 11 47 Neutral Low AIX
ALS 31-May 1.96 185
14.1 20.4 23.1 15.0 21.6 24.5 13.1 9.1 8.0 7.2 5.9 6.1 5.1 6.6 13 100
High ALS
ASB 30-Jun 1.62 305 1.63 10.6 44.2 70.2 5.7 23.5 37.3 28.6 6.9 4.3 13.2 5.4 7.9 15.5 7.4 12 100 Neutral Low/Medium ASB
ASL 30-Jun 3.35 1,020 4.55 114.6 129.5 149.8 37.4 41.9 47.8 9.0 8.0 7.0 4.3 3.8 14.4 16.7 4.9 17 100 Outperform Medium ASL
BKN 30-Jun 5.14 867 6.21 95.4 118.1 134.2 57.3 68.9 76.5 9.0 7.5 6.7 6.3 5.3 12.4 15.6 8.4 43 100 Neutral Low/Medium BKN
BLY 31-Dec 2.81 1,296 4.87 218.7 238.0 265.4 48.0 52.2 58.2 5.9 5.4 4.8 3.3 2.9 16.7 18.6 5.6 16 15 Outperform High BLY
BXB 30-Jun 6.05 9,409 6.95 603.8 663.6 734.5 40.2 42.7 47.3 15.1 14.2 12.8 8.1 7.6 14.1 22.9 5.1 31 20 Neutral Low BXB
CAB 30-Jun 5.05 608 4.90 67.6 71.3 75.5 56.2 59.2 62.7 9.0 8.5 8.1 8.3 7.9 20.5 23.5 7.8 39 100 Underperform Low/Medium CAB
CDD 30-Jun 7.86 1,089 7.91 76.8 95.7 100.7 63.5 68.0 71.2 12.4 11.6 11.0 9.1 7.6 14.7 18.0 5.3 42 70 Outperform Low CDD
CLO 30-Jun 0.72 558 0.91 54.2 63.1 66.8 7.0 8.1 8.6 10.3 8.9 8.4 7.0 5.8 12.9 17.3 4.2 3 100 Outperform Medium CLO
CPB 31-Mar 52.74 3,592 62.70 222.4 256.7 279.3 329.4 380.2 413.5 16.0 13.9 12.8 10.5 9.2 22.9 26.5 4.8 255 50 Neutral Low CPB
CSR 31-Mar 1.23 622 1.98 90.3 79.7 111.2 17.8 15.7 22.0 6.9 7.8 5.6 2.3 2.3 6.6 6.4 11.4 14 0 Neutral Low CSR
DOW 30-Jun 3.07 1,317 4.20 168.1 179.8 192.6 39.2 41.9 44.7 7.8 7.3 6.9 3.2 3.0 8.8 10.7 3.3 10 75 Outperform Medium DOW
EHL 30-Jun 0.84 527 0.94 68.2 77.8 83.9 10.8 12.3 13.3 7.7 6.8 6.3 3.3 2.9 12.1 11.8 6.6 6 100 Neutral Low/Medium EHL
GNG 30-Jun 0.97 146 1.44 13.8 21.0 23.1 9.2 13.9 15.3 10.6 7.0 6.3 5.0 3.2 36.3 44.6 8.2 8 100 Neutral High GNG
GWA 30-Jun 2.05 619 2.07 41.3 48.3 52.6 13.7 16.0 17.4 15.0 12.8 11.8 8.7 7.9 10.9 11.6 8.8 18 100 Neutral Low/Medium GWA
KSC 30-Jun 1.30 116 1.46 14.8 15.9 18.3 16.9 17.9 20.3 7.7 7.2 6.4 3.4 3.2 7.5 7.0 8.5 11 100 Outperform Low/Medium KSC
LEI 31-Dec 15.39 5,188 19.50 413.8 661.9 777.2 123.0 196.7 230.9 12.5 7.8 6.7 3.1 2.6 11.2 22.2 7.7 118 50 Underperform Medium LEI
LYL 30-Jun 7.06 273 8.25 22.3 25.6 28.3 57.6 66.2 73.2 12.3 10.7 9.6 7.5 6.6 33.1 41.5 6.1 43 100 Outperform Low/Medium LYL
MAH 30-Jun 0.53 391 1.01 56.9 65.3 72.6 7.5 8.5 9.3 7.0 6.2 5.7 1.9 1.6 12.2 16.6 6.6 4 100 Outperform High MAH
MIN 30-Jun 8.72 1,612 12.12 169.4 206.7 259.3 91.8 111.2 139.5 9.5 7.8 6.3 5.2 4.2 21.9 25.6 6.3 55 100 Outperform Low/Medium MIN
MND 30-Jun 21.64 1,919 24.97 120.3 140.1 156.3 132.2 153.1 170.5 16.4 14.1 12.7 9.3 7.9 27.6 59.8 5.8 125 100 Outperform Low/Medium MND
MQA 31-Dec 1.39 665 1.82 150.0 169.4 210.4 31.8 35.0 43.0 4.4 4.0 3.2 13.5 12.5 5.4 -96.5 8.3 12 0 Neutral Medium MQA
MRM 30-Jun 2.64 579 3.47 51.8 57.0 62.6 23.0 24.8 26.8 11.5 10.6 9.8 6.3 5.9 16.2 17.2 4.0 11 100 Outperform Low/Medium MRM
NWH 30-Jun 3.15 878 4.78 93.2 107.0 118.3 33.4 38.4 42.4 9.4 8.2 7.4 4.5 3.9 21.0 46.7 6.3 20 100 Outperform High NWH
PPX 30-Jun 0.05 33 0.17 -37.7 -56.8 -53.1 -6.2 -9.3 -8.7 nmf nmf nmf 33.9 -303.8 -1.3 -9.6 0.0 0 nmf Neutral Very High PPX
PRG 31-Mar 2.24 265 2.60 30.2 33.9 35.4 25.4 28.4 29.7 8.8 7.9 7.5 5.3 5.0 7.7 8.9 5.8 13 100 Outperform High PRG
QAN 30-Jun 1.05 2,367 1.21 61.0 327.4 313.0 2.7 14.5 13.8 38.8 7.2 7.6 3.3 2.7 3.4 5.3 0.0 0 nmf Neutral High QAN
QRN 30-Jun 3.30 8,052 4.30 369.3 556.0 562.2 15.1 22.8 23.0 21.8 14.5 14.3 9.0 6.7 8.3 7.6 3.8 13 63 Outperform Low QRN
QUB 30-Jun 1.50 1,382 1.65 62.5 65.3 74.1 7.8 7.2 8.1 19.3 20.8 18.5 24.8 9.3 8.3 6.1 2.9 4 100 Neutral Medium QUB
RCR 30-Jun 1.75 230 2.62 27.9 36.9 41.2 20.9 27.6 30.9 8.4 6.3 5.7 4.3 3.4 12.6 15.8 5.1 9 100 Outperform Medium RCR
RQL 30-Jun 0.37 91 0.54 11.7 12.0 13.0 4.7 4.8 5.2 7.9 7.7 7.1 4.6 3.7 14.4 12.0 2.7 1 100 Outperform High RQL
RWH 30-Jun 2.13 214 2.30 16.3 19.9 22.0 16.2 19.9 21.9 13.2 10.7 9.7 7.6 6.5 11.4 14.1 3.7 8 100 Outperform Low RWH
SAI 30-Jun 4.61 942 5.02 52.7 61.3 67.8 26.1 30.3 33.5 17.7 15.2 13.8 10.9 9.5 11.4 17.5 3.5 16 100 Outperform Low SAI
SEK 30-Jun 6.00 2,023 6.77 128.4 153.3 170.7 38.1 45.5 50.7 15.7 13.2 11.8 11.8 9.5 23.6 35.8 3.8 23 100 Neutral Low/Medium SEK
SKE 30-Jun 2.28 532 2.66 49.0 54.2 61.5 21.0 23.2 26.3 10.9 9.8 8.7 6.7 6.3 12.0 11.9 4.8 11 100 Outperform Medium SKE
SLM 30-Jun 2.22 355
38.9 38.5 41.8 24.4 24.1 26.2 9.1 9.2 8.5 6.2 6.2 8.8 14.1 8.8 20 100
Low/Medium SLM
SPT 30-Jun 2.61 694 1.68 40.8 42.4 46.9 15.4 16.0 17.7 17.0 16.4 14.8 5.8 5.6 6.9 9.2 4.0 11 100 Neutral Medium SPT
SVW 30-Jun 7.05 2,167 11.78 259.7 321.6 343.5 83.9 103.7 110.7 8.4 6.8 6.4 7.6 6.2 9.4 13.6 5.1 36 100 Outperform Medium SVW
SYD 31-Dec 2.90 5,398 2.96 66.6 103.2 122.5 3.6 5.5 6.6 81.1 52.3 44.1 13.5 12.6 5.0 5.7 7.9 23 0 Neutral Low SYD
TCL 30-Jun 5.68 8,283 6.80 68.1 137.3 163.8 4.7 9.4 11.1 120.5 60.6 51.2 24.9 18.2 3.7 4.4 5.7 33 22 Outperform Low TCL
TOL 30-Jun 3.87 2,775 5.12 253.4 287.1 328.3 35.4 40.0 45.8 10.9 9.7 8.5 5.8 5.5 7.4 10.3 6.5 25 100 Outperform Medium TOL
TPI 30-Jun 0.74 1,168 0.88 67.1 96.5 122.8 5.2 6.1 7.8 14.3 12.1 9.5 5.4 5.1 7.5 4.5 0.0 0 nmf Outperform Medium TPI
TSE 30-Jun 1.74 909 2.45 121.0 134.2 150.3 22.1 24.6 27.5 7.8 7.1 6.3 5.5 4.9 7.6 12.0 8.9 16 50 Neutral Medium TSE
UGL 30-Jun 12.39 2,061 13.50 169.9 185.6 202.4 102.8 112.3 122.5 12.1 11.0 10.1 8.0 7.2 9.5 15.5 6.1 76 100 Neutral Low UGL
VAH 30-Jun 0.39 851 0.50 63.0 156.8 218.0 2.9 7.2 10.0 13.4 5.4 3.9 4.5 3.3 6.4 15.1 0.0 0 nmf Outperform High VAH
WDS 30-Jun 0.42 61 0.70 9.0 12.8 13.9 6.1 8.6 9.2 6.9 4.9 4.6 2.0 1.7 8.3 7.2 9.5 4 100 Neutral High WDS
WHG 30-Jun 0.86 228 0.90 23.8 26.6 28.6 8.9 9.9 10.7 9.7 8.6 8.0 6.0 5.5 9.9 9.6 9.3 8 100 Neutral Low WHG
Industrials - total 80,929 5,206.9 6,799.2 7,705.7 nmf nmf nmf 15.6 12.3 10.9 7.2 6.2 8.4 11.8 5.2 nmf 55
Consumer Discretionary AAD 30-Jun 1.27 423 1.10 33.1 36.2 40.3 10.2 11.0 11.9 12.4 11.5 10.6 7.9 7.6 7.4 8.4 10.3 13 0 Neutral Medium AAD
AHE 30-Jun 2.60 678 2.58 62.5 72.8 80.7 24.0 28.0 31.0 10.8 9.3 8.4 7.5 6.7 11.1 15.4 7.7 20 100 Neutral Low/Medium AHE

Ma
cq
ua
rie P
rivate
Wealth
M
acqu
arie
Marq
ue
e Id
eas
13 J
uly
20
12
19
ASX Balance Price Mkt Cap 12 mth Adjusted Profit ($m) Adjusted EPS(c) PER(x) EV/EBDITA (x) ROA % ROE % Div Yield % DPS(c) Franking (%) Recommendation Volatility ASX
Code Date 12-Jul-12 ($m) Price Target 2012 2013 2014 2012 2013 2014 2012 2013 2014 2012 2013 2013 2013 2013 2013 2013 Index Code
ALL 31-Dec 2.56 1,409 2.60 88.0 115.2 134.9 16.0 20.5 23.7 16.0 12.5 10.8 9.7 8.1 21.5 30.3 4.8 12 0 Neutral Medium ALL
APN 31-Dec 0.61 393 0.70 73.6 76.4 82.8 11.4 11.4 12.0 5.3 5.3 5.0 5.6 5.9 7.6 8.0 11.6 7 100 Underperform Medium APN
ARP 30-Jun 9.02 654 9.50 38.1 43.3 48.5 52.6 59.7 67.0 17.1 15.1 13.5 10.8 9.7 26.4 27.0 3.3 30 100 Outperform Low ARP
BBG 30-Jun 1.05 432
39.4 60.6 66.2 12.2 16.5 13.9 8.6 6.4 7.6 5.7 2.1 4.0 4.5 0.0 0 nmf
Very High BBG
BRG 30-Jun 4.46 580 4.80 45.1 49.9 54.3 34.2 37.8 41.1 13.0 11.8 10.8 8.0 7.5 23.0 27.3 4.9 22 100 Outperform Medium BRG
CMJ 30-Jun 3.38 1,899 3.27 92.5 96.1 111.3 16.5 17.1 19.8 20.5 19.8 17.1 -226.6 -314.5 15.6 27.1 4.9 17 0 Neutral Low CMJ
CTD 30-Jun 2.08 156 2.30 11.8 13.3 14.2 16.3 17.7 19.0 12.7 11.7 10.9 8.6 7.6 21.6 25.0 4.3 9 100 Outperform Medium CTD
CWN 30-Jun 8.56 6,235 10.00 434.6 479.1 559.7 59.1 65.8 76.8 14.5 13.0 11.1 10.3 9.5 12.2 14.7 4.3 37 50 Outperform Low CWN
DJS 31-Jul 2.35 1,242 3.12 111.2 124.9 124.6 21.2 23.8 23.7 11.1 9.9 9.9 6.0 5.5 15.3 16.1 8.9 21 100 Outperform Medium DJS
DMP 30-Jun 10.30 720 10.14 26.3 31.4 35.4 36.8 43.7 49.2 28.0 23.5 20.9 15.0 12.9 23.9 26.5 3.1 32 100 Neutral Low DMP
EGG 30-Jun 0.61 52 0.50 -1.2 1.1 2.8 -1.4 1.3 3.3 nmf 48.3 18.4 1.1 1.7 2.8 0.7 0.0 0 nmf Underperform Very High EGG
EGP 30-Jun 4.25 3,509
119.8 179.2 222.3 16.9 21.7 26.7 25.1 19.6 15.9 11.4 9.9 7.8 6.3 2.6 11 100
Low/Medium EGP
FAN 30-Jun 2.25 231 2.60 23.9 26.8 28.9 23.3 26.1 28.2 9.7 8.6 8.0 5.9 5.3 20.5 22.9 6.7 15 100 Outperform Low/Medium FAN
FLT 30-Jun 20.63 2,064 22.97 200.4 213.7 229.0 198.9 211.8 226.6 10.4 9.7 9.1 5.9 5.6 13.4 23.9 5.1 106 100 Neutral Medium FLT
FWD 30-Jun 12.20 722 14.11 53.2 60.2 66.0 88.0 97.9 105.8 13.9 12.5 11.5 7.6 7.0 26.9 25.1 6.6 81 100 Outperform Low FWD
FXJ 30-Jun 0.57 1,329 0.60 200.0 157.5 149.6 8.5 6.7 6.4 6.6 8.4 8.9 4.6 5.0 5.1 3.4 4.1 2 100 Underperform Medium FXJ
GUD 30-Jun 8.82 624 8.30 44.3 47.0 51.1 63.7 67.4 73.3 13.8 13.1 12.0 8.7 8.3 15.2 15.4 10.2 90 100 Neutral Low GUD
HVN 30-Jun 1.92 2,034 1.90 181.0 199.0 184.5 17.1 18.8 17.4 11.2 10.2 11.0 7.1 6.7 7.4 8.0 4.7 9 100 Underperform Low/Medium HVN
IVC 31-Dec 8.02 882 8.40 44.5 48.7 51.6 40.8 44.6 47.3 19.7 18.0 17.0 11.4 10.8 10.3 31.5 4.5 36 100 Outperform Low IVC
JBH 30-Jun 8.82 872 15.04 105.8 109.3 118.2 104.3 106.8 115.4 8.5 8.3 7.6 4.7 4.6 20.1 52.8 7.4 65 100 Outperform Medium JBH
KMD 31-Jul 1.13 226 1.45 26.2 31.4 37.3 13.1 15.7 18.6 8.6 7.2 6.1 5.9 4.9 17.4 14.1 8.4 10 100 Outperform High KMD
MYR 31-Jul 1.68 977 2.17 136.6 141.9 144.0 22.7 23.6 23.9 7.4 7.1 7.0 4.2 4.2 11.4 16.2 11.4 19 100 Neutral Medium MYR
NVT 30-Jun 4.28 1,606 4.05 73.9 85.6 96.2 19.7 22.8 25.6 21.7 18.8 16.7 13.9 12.2 18.8 35.0 5.1 22 100 Neutral Low/Medium NVT
NWS 30-Jun 21.62 17,264 21.95 3,336.1 3,315.0 3,644.3 133.6 149.1 178.0 16.2 14.5 12.1 8.6 7.7 10.9 13.4 0.7 16 0 Neutral Low NWS
PBG 30-Jun 0.48 438 0.75 72.5 82.1 89.4 7.5 9.8 10.6 6.4 4.9 4.5 4.3 4.0 10.8 10.7 10.6 5 100 Neutral Medium PBG
PMV 31-Jul 4.73 734 5.70 57.3 66.2 71.2 36.6 42.2 45.4 12.9 11.2 10.4 5.8 5.1 6.1 5.5 7.6 36 100 Neutral Low PMV
PRT 30-Jun 0.67 244 0.81 27.7 29.5 31.3 7.5 8.0 8.5 8.9 8.3 7.8 6.2 6.0 14.0 18.0 9.0 6 100 Outperform Low/Medium PRT
REA 30-Jun 13.45 1,772 14.68 84.3 96.9 109.2 64.3 73.6 82.9 20.9 18.3 16.2 12.9 11.0 40.2 37.0 2.7 37 100 Outperform Low REA
SFH 30-Jun 0.52 100 0.40 3.0 9.8 12.4 1.6 5.1 6.4 32.9 10.1 8.1 3.5 2.8 9.6 17.4 3.8 2 100 Underperform High SFH
SGH 30-Jun 1.92 324 1.83 30.0 39.3 42.1 19.2 22.4 23.6 10.0 8.6 8.1 7.6 5.9 11.0 17.8 3.5 7 100 Neutral Low/Medium SGH
SGN 31-Dec 0.94 339 1.05 43.4 45.7 46.8 11.9 12.6 12.9 7.8 7.4 7.2 4.9 4.7 10.6 12.0 9.4 9 100 Neutral Medium SGN
SUL 30-Jun 7.27 1,426 7.70 92.0 122.4 137.2 53.7 62.2 69.8 13.5 11.7 10.4 7.8 7.4 14.7 19.2 4.8 35 100 Outperform Low/Medium SUL
SWM 30-Jun 1.60 1,062 3.54 235.0 248.9 253.7 33.4 35.1 34.6 4.8 4.5 4.6 5.7 5.9 9.2 9.2 12.4 20 100 Outperform High SWM
SXL 30-Jun 1.14 800 1.48 106.0 115.8 128.0 15.0 16.4 18.2 7.5 6.9 6.2 6.1 5.9 8.7 7.0 8.7 10 100 Outperform Medium SXL
TAH 30-Jun 2.91 2,125 3.20 343.9 181.4 183.0 48.0 24.5 24.3 6.1 11.9 12.0 4.0 5.6 11.4 12.5 6.9 20 100 Outperform Low TAH
TEN 31-Aug 0.48 646 0.52 13.6 26.2 42.8 1.2 1.9 3.0 38.6 25.7 15.9 7.8 9.9 4.7 3.0 0.0 0 nmf Neutral Medium TEN
TGA 31-Mar 1.54 225 1.51 29.1 29.9 30.3 20.7 20.4 20.7 7.4 7.5 7.4 5.3 5.3 21.6 20.3 6.3 10 100 Neutral Low/Medium TGA
TRS 30-Jun 9.13 238 13.00 20.9 23.1 26.7 79.5 87.9 101.7 11.5 10.4 9.0 5.5 5.1 21.9 32.2 6.0 55 100 Outperform Low/Medium TRS
TTS 30-Jun 2.64 3,598 2.40 308.9 224.7 223.6 23.1 16.4 16.0 11.4 16.1 16.5 7.1 9.1 8.6 8.4 5.3 14 100 Underperform Low TTS
WTF 30-Jun 4.18 885 4.70 57.1 61.3 66.4 26.7 28.5 30.9 15.7 14.6 13.5 8.4 7.9 31.0 63.9 6.5 27 100 Outperform Medium WTF
Consumer Discretionary - total 62,170 7,125.3 7,218.4 7,873.2 nmf nmf nmf 12.1 12.0 11.0 7.9 7.3 10.5 12.0 4.2 nmf 82
Consumer Staples CCL 31-Dec 13.35 10,164 13.84 570.2 618.0 668.9 75.3 81.2 87.5 17.7 16.4 15.3 10.3 9.7 16.1 27.2 4.8 64 100 Neutral Low CCL
ELD 30-Sep 0.22 99 0.23 14.2 24.9 27.8 3.2 5.5 6.2 6.9 4.0 3.6 9.0 8.9 3.1 4.9 0.0 0 nmf Neutral High ELD
GFF 30-Jun 0.53 1,036 0.62 108.9 131.1 141.0 6.2 5.8 7.2 8.6 9.1 7.4 5.9 5.5 9.6 8.6 10.4 6 38 Outperform High GFF
MTS 30-Apr 3.19 2,757 3.94 252.8 265.1 283.8 32.9 31.2 32.8 9.7 10.2 9.7 10.7 7.0 11.6 18.3 8.2 26 100 Neutral Low MTS
TGR 30-Jun 1.30 190 1.32 23.9 26.2 27.8 16.3 17.9 19.0 8.0 7.3 6.8 5.1 4.7 9.0 8.9 6.9 9 50 Neutral Low/Medium TGR
TWE 30-Jun 4.45 2,880 3.11 109.7 117.3 123.5 16.9 18.1 19.0 26.3 24.6 23.4 11.7 11.4 4.8 4.0 2.4 11 50 Underperform Low TWE
WES 30-Jun 30.28 30,477 30.53 2,153.0 2,238.9 2,426.9 185.8 191.6 206.3 16.3 15.8 14.7 8.9 8.6 8.4 8.6 5.8 175 100 Neutral Low WES
WOW 30-Jun 27.00 33,262 30.67 2,207.9 2,400.8 2,577.2 180.5 197.1 211.6 15.0 13.7 12.8 9.0 7.8 16.4 28.0 5.1 139 100 Outperform Low WOW
Consumer Staples - total 80,865 5,440.5 5,822.2 6,277.0 nmf nmf nmf 15.5 14.6 13.6 9.1 8.3 11.0 13.3 5.4 nmf 98
Health Care ACR 30-Jun 4.14 689 4.74 5.7 26.8 53.9 3.4 16.0 32.2 120.9 25.9 12.9 407.6 17.4 56.3 45.5 7.2 30 0 Outperform Medium ACR
ANN 30-Jun 13.18 1,722 14.46 130.8 135.0 149.1 99.6 103.3 114.2 13.2 12.8 11.5 10.5 10.1 12.0 19.6 2.9 38 0 Neutral Low ANN
API 31-Aug 0.34 166 0.43 21.8 22.7 24.0 4.5 4.6 4.9 7.6 7.3 6.9 4.1 4.0 4.2 3.9 6.5 2 100 Outperform High API
COH 30-Jun 64.74 3,686 68.50 161.1 168.4 180.3 283.5 296.0 316.8 22.8 21.9 20.4 15.2 14.5 30.1 40.3 4.2 270 60 Neutral Medium COH
CSL 30-Jun 38.50 19,505 39.00 989.5 1,121.1 1,212.0 190.1 225.3 244.8 20.3 17.1 15.7 13.8 11.9 23.4 30.3 2.7 105 3 Outperform Low CSL
MSB 30-Jun 5.86 1,667 5.40 -20.9 -14.3 -24.2 -7.4 -5.0 -8.5 nmf nmf nmf -47.5 -63.5 -3.1 -2.8 0.0 0 nmf Underperform High MSB
PRY 30-Jun 3.16 1,585 2.60 115.4 138.9 145.4 23.1 27.5 28.4 13.7 11.5 11.1 7.7 7.4 6.9 5.3 4.7 15 100 Underperform Low/Medium PRY
RHC 30-Jun 23.26 4,700 24.00 239.1 270.3 307.9 118.6 133.6 152.2 19.6 17.4 15.3 9.7 8.8 13.0 18.3 2.9 69 100 Outperform Low RHC
RMD 30-Jun 3.02 4,354 3.45 242.7 263.8 284.3 16.7 19.1 21.3 18.1 15.8 14.2 10.4 9.2 14.1 15.5 2.1 6 0 Neutral Low RMD
SHL 30-Jun 12.66 4,950 13.80 314.0 336.6 370.5 80.6 86.3 95.0 15.7 14.7 13.3 10.5 9.8 10.7 12.8 5.5 70 35 Outperform Low SHL
SIP 31-Jan 0.59 694 0.53 50.3 53.0 54.4 4.3 4.6 4.7 13.7 12.8 12.5 7.5 7.2 6.6 7.7 6.4 4 100 Underperform High SIP
Health Care - total 43,718 2,249.4 2,522.3 2,757.7 nmf nmf nmf 19.3 16.8 15.3 12.0 10.8 13.5 16.8 3.2 nmf 33
Financials AMP 31-Dec 3.76 10,885 4.22 933.2 1,021.7 1,110.3 32.1 34.3 36.4 11.7 11.0 10.3 5.8 5.3 0.8 13.9 8.2 31 50 Neutral Low AMP
ANZ 30-Sep 22.44 60,941 25.92 6,008.7 6,188.0 6,479.2 216.4 217.8 224.6 10.4 10.3 10.0 1.8 1.8 1.0 14.2 6.6 148 100 Outperform Low ANZ
ASX 30-Jun 30.19 5,287 30.19 342.5 356.2 376.0 195.6 203.4 214.7 15.4 14.8 14.1 10.0 9.6 6.5 11.5 6.1 183 100 Underperform Low ASX

Ma
cq
ua
rie P
rivate
Wealth
M
acqu
arie
Marq
ue
e Id
eas
13 J
uly
20
12
20
ASX Balance Price Mkt Cap 12 mth Adjusted Profit ($m) Adjusted EPS(c) PER(x) EV/EBDITA (x) ROA % ROE % Div Yield % DPS(c) Franking (%) Recommendation Volatility ASX
Code Date 12-Jul-12 ($m) Price Target 2012 2013 2014 2012 2013 2014 2012 2013 2014 2012 2013 2013 2013 2013 2013 2013 Index Code
AUB 30-Jun 6.92 388 7.29 27.0 29.9 32.1 48.8 52.9 56.0 14.2 13.1 12.4 9.8 9.2 10.0 18.2 4.6 32 100 Outperform Low AUB
BEN 30-Jun 7.78 3,086 9.58 322.7 374.6 438.0 84.7 94.3 108.6 9.2 8.2 7.2 5.5 4.9 0.6 8.9 7.8 61 100 Outperform Low BEN
BOQ 31-Aug 6.58 2,032 6.85 45.0 221.7 242.4 7.7 70.4 74.2 85.5 9.3 8.9 -55.3 -11.0 0.5 7.7 8.5 56 100 Underperform Low/Medium BOQ
BTT 30-Sep 1.69 453 2.18 44.2 46.3 52.0 15.4 16.2 18.2 10.9 10.4 9.3 8.0 7.6 8.4 8.7 8.3 14 100 Neutral Low/Medium BTT
CBA 30-Jun 53.60 85,339 48.52 6,948.3 7,108.4 7,565.5 422.2 421.8 439.8 12.7 12.7 12.2 5.9 6.0 1.0 17.3 6.3 335 100 Underperform Low CBA
CGF 30-Jun 3.27 1,781 4.49 298.1 315.2 303.7 54.9 55.7 53.6 6.0 5.9 6.1 4.8 4.5 3.1 16.3 4.9 16 0 Outperform Low CGF
FKP 30-Jun 0.38 455 0.40 85.0 116.1 116.5 7.1 9.6 9.5 5.3 3.9 3.9 11.1 8.1 4.1 8.1 9.1 3 0 Neutral Medium FKP
FXL 30-Jun 2.62 739 2.63 60.2 70.0 74.3 21.8 25.1 26.7 12.0 10.4 9.8 9.1 8.4 14.3 29.8 5.2 14 100 Outperform Medium FXL
HGG 31-Dec 1.49 1,649 2.12 190.6 209.4 232.1 18.5 20.1 22.3 8.0 7.4 6.7 5.6 5.3 7.7 17.8 7.7 11 0 Neutral Medium HGG
IAG 30-Jun 3.56 7,401 3.84 505.7 652.7 689.4 24.2 31.2 33.0 14.7 11.4 10.8 10.0 7.7 3.1 14.0 5.6 20 100 Outperform Low IAG
IFL 30-Jun 5.90 1,356 6.80 97.6 103.0 112.4 42.0 44.4 48.5 14.0 13.3 12.2 9.9 9.3 6.1 11.9 6.8 40 100 Outperform Low/Medium IFL
LLC 30-Jun 7.56 4,330 8.82 499.8 513.1 555.7 87.4 89.3 96.7 8.6 8.5 7.8 6.6 5.7 4.8 12.9 5.3 40 0 Outperform Low LLC
NAB 30-Sep 23.59 52,839 27.66 5,729.2 5,938.6 6,470.4 251.9 255.7 273.4 9.4 9.2 8.6 -3.0 -2.7 0.8 13.3 8.1 192 100 Outperform Low NAB
NHF 30-Jun 1.47 643 1.69 57.8 57.8 60.7 12.5 13.2 13.8 11.7 11.1 10.6 5.5 5.5 10.8 19.9 5.1 7 100 Outperform Low NHF
PPC 30-Jun 0.66 211 0.82 19.7 31.6 36.7 6.2 9.9 11.4 10.7 6.7 5.8 15.2 9.1 7.2 10.9 9.0 6 100 Neutral High PPC
PPT 30-Jun 22.79 957 25.54 63.8 57.3 80.1 144.9 129.3 180.8 15.7 17.6 12.6 8.1 7.9 5.6 20.4 4.4 101 100 Neutral Medium PPT
PTM 30-Jun 3.69 2,071 3.79 126.3 132.1 149.6 22.5 23.4 26.5 16.4 15.7 13.9 11.0 10.7 50.3 49.9 5.7 21 100 Underperform Low/Medium PTM
QBE 31-Dec 13.33 15,752 14.00 1,628.6 1,606.7 1,697.8 133.1 128.7 133.3 10.0 10.4 10.0 8.1 8.5 3.5 13.9 6.3 83 25 Outperform Medium QBE
SRV 30-Jun 2.90 285 3.05 13.1 26.2 31.5 13.3 26.6 32.0 21.8 10.9 9.1 5.7 3.3 11.4 13.5 6.9 20 50 Neutral Low SRV
SUN 30-Jun 8.03 10,331 8.54 884.0 938.0 1,117.6 64.7 68.7 81.9 12.4 11.7 9.8 7.4 6.9 1.0 6.5 6.0 48 100 Neutral Low SUN
WBC 30-Sep 21.82 67,205 24.02 6,469.7 6,790.6 7,358.3 205.0 212.4 227.2 10.6 10.3 9.6 5.2 5.0 1.0 15.0 7.7 169 100 Neutral Low WBC
Financials - total 336,417 31,400.7 32,905.0 35,382.3 nmf nmf nmf 11.0 10.7 10.1 8.2 7.3 1.4 14.0 7.0 nmf 93
Information Technology CPU 30-Jun 7.34 4,079 9.73 261.6 326.1 411.6 46.9 58.4 73.7 15.7 12.6 10.0 12.1 9.6 14.1 27.2 5.0 37 60 Outperform Low CPU
CRZ 30-Jun 6.10 1,426 5.03 66.8 72.8 78.2 28.6 31.2 33.5 21.3 19.5 18.2 14.4 13.4 63.3 57.1 4.1 25 100 Underperform Low CRZ
CSV 30-Jun 0.74 208
24.2 27.6 30.2 8.6 9.8 10.7 8.6 7.5 6.9 4.8 4.5 7.9 9.4 7.5 6 100
High CSV
IRE 31-Dec 6.23 800 6.25 49.7 52.7 57.5 38.0 40.3 44.0 16.4 15.5 14.2 10.4 9.7 31.7 42.5 5.5 34 90 Neutral Low IRE
OKN 30-Jun 1.09 100 1.08 10.0 10.7 12.1 10.7 11.4 12.9 10.1 9.5 8.4 6.1 5.9 10.1 9.8 10.6 12 100 Neutral Medium OKN
RDF 30-Jun 2.04 225
15.1 27.5 30.7 13.6 24.6 27.5 15.0 8.3 7.4 4.7 3.5 19.0 22.6 2.5 5 100
Medium RDF
RKN 31-Dec 2.16 281 1.74 19.6 21.3 22.2 14.8 16.3 17.0 14.6 13.2 12.7 8.4 8.5 28.1 33.3 4.4 9 90 Underperform Low RKN
SMX 30-Jun 5.13 351 5.55 31.0 33.4 36.0 44.4 47.8 51.5 11.6 10.7 10.0 7.7 7.2 27.4 27.4 6.4 33 100 Outperform Low SMX
TNE 30-Sep 1.18 360 1.23 23.0 26.0 28.2 7.4 8.4 9.1 15.9 14.1 13.0 9.7 8.8 27.2 35.1 6.8 8 100 Outperform Low TNE
Information Technology - total 7,828 500.8 598.0 706.7 nmf nmf nmf 15.8 13.2 11.2 10.7 9.0 16.6 26.8 5.1 nmf 78
Telecommunication Services HTA 31-Dec 0.03 421 0.08 63.5 77.5 113.4 0.5 0.6 0.8 6.6 5.4 3.7 nmf nmf 4.2 5.2 0.0 0 nmf Neutral Medium HTA
IIN 30-Jun 3.24 522 3.35 41.0 56.5 56.1 26.8 35.7 35.6 12.1 9.1 9.1 4.9 3.9 14.1 19.8 9.0 29 100 Outperform Low/Medium IIN
SGT 31-Mar 2.64 42,090 2.80 3,012.8 2,967.7 3,202.7 18.9 18.6 20.1 14.0 14.2 13.1 12.0 11.9 11.9 16.0 4.5 12 0 Outperform Low SGT
TLS 30-Jun 3.86 48,030 3.65 3,557.2 4,012.9 3,757.9 28.6 32.6 31.6 13.5 11.8 12.2 5.8 5.3 17.4 35.6 7.3 28 100 Outperform Low TLS
TPM 31-Jul 1.71 1,361 1.90 107.1 123.8 142.4 13.5 15.6 17.9 12.7 11.0 9.6 6.0 5.9 19.7 19.9 4.1 7 100 Outperform Medium TPM
Telecommunication Services - total 92,424 6,781.6 7,238.3 7,272.5 nmf nmf nmf 13.4 11.7 11.9 7.5 7.1 14.7 22.5 5.8 nmf 65
Utilities AGK 30-Jun 14.81 8,084 16.43 488.8 687.5 737.2 102.2 126.1 135.2 14.5 11.7 11.0 9.9 6.2 9.2 9.2 4.3 64 100 Outperform Low AGK
APA 30-Jun 4.94 3,184
144.1 152.1 198.5 23.3 23.4 30.1 21.2 21.1 16.4 10.3 10.4 8.3 9.3 7.2 36 0
Low APA
DUE 30-Jun 1.87 2,075 1.88 109.7 112.5 172.3 10.4 9.9 14.7 18.1 18.9 12.7 8.9 9.0 6.8 7.2 8.8 17 0 Neutral Low DUE
ENV 30-Jun 0.79 1,242 0.82 69.4 74.3 110.1 4.5 4.7 6.7 17.4 17.0 11.9 9.7 9.6 9.1 12.7 8.1 6 0 Neutral Low ENV
EPW 30-Jun 1.95 328 2.10 20.3 24.0 33.5 12.4 14.3 18.9 15.7 13.6 10.3 5.3 5.6 8.5 12.2 4.8 9 100 Outperform Medium EPW
IFN 30-Jun 0.22 168 1.00 -35.1 3.1 24.8 -4.6 0.4 3.3 nmf 54.5 6.8 9.4 7.7 2.2 0.6 0.0 0 nmf Outperform Very High IFN
SKI 31-Dec 1.53 2,030 1.52 131.5 146.2 153.0 9.9 11.0 11.5 15.4 13.9 13.3 7.8 7.2 11.5 6.3 7.2 11 0 Neutral Low SKI
SPN 31-Mar 1.04 3,473 1.16 255.0 276.6 303.0 8.8 8.6 9.0 11.8 12.1 11.5 8.3 8.2 7.4 8.7 7.9 8 35 Outperform Low SPN
Source: Macquarie Research, Factset pricing, July 2012

Ma
cq
ua
rie P
rivate
Wealth
M
acqu
arie
Marq
ue
e Id
eas
13 J
uly
20
12
21
Macquarie Research valuation tables (property)
ASX Balance Price Mkt Cap 12 mth NPV Price/NPV DPS(c) Dividend Yield (%) NTA($) Price/NTA (x) Recommendation Volatility ASX
Code Date 12-Jul-12 ($m) Price Target ($) 2012 2013 2014 2012 2013 2014 2012 2013 2014 2012 2013 2014 Index Code
ABP 30-Jun 1.94 844 1.94 1.98 -1.8% 16.50 16.50 16.50 8.51 8.51 8.51 2.41 2.65 2.72 0.81 0.73 0.71 Underperform Low ABP
ALZ 31-Dec 2.51 1,448 2.92 3.00 -16.2% 21.50 22.04 22.59 8.57 8.78 9.00 3.58 3.58 3.59 0.70 0.70 0.70 Outperform Low ALZ
APZ 30-Jun 0.40 236 0.44 0.60 -34.2% 3.15 4.11 5.08 7.97 10.42 12.85 0.71 0.72 0.74 0.55 0.55 0.53 Underperform Low APZ
CFX 30-Jun 1.94 5,488 2.00 2.03 -4.4% 13.05 13.60 14.07 6.73 7.01 7.25 1.93 1.97 2.05 1.00 0.99 0.95 Outperform Low CFX
CHC 30-Jun 2.29 684 2.52 2.53 -9.3% 18.20 18.06 18.70 7.95 7.89 8.16 2.23 2.16 2.23 1.03 1.06 1.03 Outperform Low/Medium CHC
CPA 30-Jun 1.02 2,394 1.04 1.11 -7.7% 6.09 6.26 6.28 5.97 6.14 6.15 1.15 1.20 1.26 0.89 0.85 0.81 Underperform Low CPA
CQR 30-Jun 3.34 1,001 3.24 3.18 5.2% 26.10 27.05 27.27 7.81 8.10 8.17 3.35 3.52 3.71 1.00 0.95 0.90 Underperform Low CQR
CRF 30-Jun 1.96 2,628 2.10 2.14 -8.2% 6.50 12.29 12.80 3.32 6.27 6.53 2.42 2.29 2.37 0.81 0.86 0.83 Outperform Medium CRF
DXS 30-Jun 0.93 4,500 0.95 0.97 -4.1% 5.35 5.84 5.89 5.75 6.28 6.33 0.88 1.00 1.02 1.06 0.93 0.91 Neutral Low DXS
GMG 30-Jun 3.83 6,148 3.88 3.89 -1.4% 18.00 19.41 20.91 4.70 5.07 5.46 2.72 2.91 3.22 1.41 1.32 1.19 Outperform Low/Medium GMG
GOZ 30-Jun 2.09 793 1.92 1.96 6.6% 17.60 18.75 18.73 8.42 8.97 8.96 1.49 1.64 1.77 1.40 1.28 1.18 Underperform Low GOZ
GPT 31-Dec 3.31 5,854 3.50 3.45 -3.9% 18.88 19.52 20.00 5.70 5.90 6.04 3.96 4.09 4.15 0.84 0.81 0.80 Outperform Low GPT
IOF 30-Jun 2.72 1,670 2.91 2.96 -8.1% 15.60 15.68 15.99 5.74 5.76 5.88 3.32 3.40 3.49 0.82 0.80 0.78 Outperform Low IOF
LEP 30-Jun 2.19 350 1.90 1.97 11.2% 16.00 15.87 15.72 7.31 7.24 7.18 2.01 2.08 2.14 1.09 1.05 1.02 Neutral Low LEP
MGR 30-Jun 1.27 4,346 1.41 1.46 -12.7% 8.40 8.61 8.83 6.61 6.78 6.95 1.55 1.65 1.69 0.82 0.77 0.75 Outperform Low MGR
SGP 30-Jun 3.16 6,963 3.22 3.50 -9.6% 24.00 24.20 24.73 7.59 7.66 7.83 3.67 4.02 4.30 0.86 0.79 0.73 Underperform Low SGP
WDC 31-Dec 9.57 21,633 9.20 9.35 2.4% 49.50 50.74 52.01 5.17 5.30 5.43 6.24 7.15 8.03 1.53 1.34 1.19 Underperform Low WDC
WRT 31-Dec 2.90 8,857 2.90 3.36 -13.7% 18.92 19.63 20.38 6.52 6.77 7.03 3.25 3.41 3.53 0.89 0.85 0.82 Outperform Low WRT
Source: Macquarie Research, Factset pricing, July 2012

Ma
cq
ua
rie P
rivate
Wealth
M
acqu
arie
Marq
ue
e Id
eas
13 J
uly
20
12
22
Macquarie Research valuation tables (New Zealand)
Code Balance Price Mkt Cap 12 mth Adjusted Profit ($m) EPS(c) PER(x) EV/EBDITA (x) ROA % ROE % Div Yield % DPS(c) Franking (%) Recommendation Volatility ASX
Date 12-Jul-12 ($m) Price Target 2012 2013 2014 2012 2013 2014 2012 2013 2014 2012 2013 2013 2013 2013 2013 2013 Index Code
AIA 30-Jun 2.47 3,267 2.66 138.6 153.5 169.7 10.5 11.6 12.8 23.6 21.3 19.2 13.5 12.8 7.2 6.2 4.2 10.4 100.0 Neutral Low AIA
AIR 30-Jun 0.91 1,001 1.00 41.5 119.7 154.0 3.8 10.9 14.0 23.9 8.3 6.5 3.6 2.6 4.4 7.4 5.5 5.0 100.0 Outperform Low AIR
ANO 30-Jun 0.95 947 0.91 51.4 56.4 62.5 5.2 5.7 6.3 18.4 16.8 15.1 14.9 13.0 6.7 6.4 5.5 5.3 43.1 Neutral Low ANO
ARG 31-Mar 0.89 500 0.76 33.4 33.4 30.3 6.1 6.0 5.4 14.7 14.8 16.4 13.6 13.5 7.0 6.9 6.8 6.0 8.5 Underperform Low ARG
ATM 30-Jun 0.47 278 0.54 4.6 4.7 9.0 0.8 0.8 1.5 60.5 59.2 30.8 50.9 43.3 12.0 11.4 0.0 0.0 nmf Outperform Very High ATM
BGR 31-Jan 1.74 372 1.60 27.5 29.0 31.0 13.0 13.7 14.6 13.4 12.7 11.9 6.4 6.2 17.0 20.0 6.0 10.4 100.0 Neutral Low BGR
CEN 30-Jun 4.79 3,442 5.28 159.2 151.1 152.6 23.5 21.4 21.6 20.4 22.4 22.2 10.0 9.8 4.8 4.6 5.0 24.0 100.0 Outperform Low CEN
CNU 30-Jun 3.27 1,259 2.95 79.7 153.5 158.6 20.7 39.9 41.2 15.8 8.2 7.9 8.6 4.3 12.0 24.0 7.6 25.0 100.0 Underperform Low CNU
DNZ 31-Mar 1.48 366 1.33 28.1 24.4 24.0 11.3 9.9 9.7 13.0 15.0 15.3 13.6 13.5 6.9 6.4 6.1 9.0 21.5 Underperform Low DNZ
FBU 30-Jun 6.09 4,159 6.30 309.7 301.2 371.3 45.6 44.3 54.5 13.4 13.8 11.2 7.8 7.3 7.8 8.0 6.0 36.5 50.7 Neutral Low FBU
FPA 31-Mar 0.57 413 0.54 26.3 36.1 45.1 3.6 5.0 6.2 15.7 11.4 9.2 10.5 9.4 3.8 5.8 2.6 1.5 100.0 Underperform Medium FPA
FPH 31-Mar 2.02 1,086 2.41 62.7 70.2 77.3 11.9 13.0 13.9 17.0 15.6 14.5 10.4 9.6 16.9 18.8 6.1 12.4 100.0 Neutral Low/Medium FPH
FRE 30-Jun 3.93 604 3.95 36.1 41.7 47.5 23.5 27.1 30.9 16.7 14.5 12.7 10.7 9.4 15.8 23.1 5.2 20.3 100.0 Neutral Low FRE
GMT 31-Mar 1.01 1,025 0.97 74.8 81.6 87.8 7.7 7.7 7.7 13.1 13.0 13.2 15.6 14.6 6.8 8.2 6.2 6.3 8.5 Neutral Low GMT
GPG 31-Dec 0.45 730 0.63 -101.6 47.3 60.8 -6.2 2.9 3.7 nmf 15.5 12.1 13.8 5.0 4.7 3.8 4.2 1.9 0.0 Outperform Low GPG
HLG 31-Jul 4.09 244 4.05 20.5 23.0 24.9 34.3 38.6 41.7 11.9 10.6 9.8 6.4 5.8 35.5 34.5 9.0 36.7 100.0 Neutral Low HLG
IFT 31-Mar 2.06 1,204 2.11 73.0 59.3 58.6 12.8 10.0 10.0 16.1 20.6 20.6 6.7 6.3 7.8 5.8 4.0 8.2 100.0 Neutral Low IFT
KIP 31-Mar 1.08 1,063 1.08 71.7 65.1 68.1 7.4 6.6 6.8 14.6 16.3 15.8 13.2 14.6 5.6 5.3 6.1 6.6 33.0 Outperform Low KIP
MFT 31-Mar 9.54 945 10.50 65.7 71.1 84.2 66.4 71.8 85.0 14.4 13.3 11.2 8.6 7.9 12.6 19.2 3.2 30.5 100.0 Outperform Low MFT
MHI 30-Jun 0.99 379 1.13 34.0 42.6 52.3 8.9 11.1 13.7 11.1 8.9 7.2 6.9 6.0 17.0 21.2 6.9 6.8 0.0 Outperform Low MHI
MVN 31-Mar 1.28 85 1.43 6.3 7.6 8.7 9.5 11.4 13.0 13.4 11.2 9.8 7.0 6.1 12.9 15.6 7.8 10.0 100.0 Outperform Low MVN
NPX 30-Jun 2.53 498 2.45 64.9 78.2 79.7 33.0 39.7 40.5 7.7 6.4 6.2 5.4 4.7 9.8 13.2 9.5 24.0 6.2 Neutral Low/Medium NPX
NZO 30-Jun 0.84 330 1.13 27.4 28.2 25.1 6.9 7.1 6.4 12.1 11.8 13.2 2.6 2.5 7.2 7.5 2.4 2.0 100.0 Outperform Medium NZO
NZR 31-Dec 2.25 630 4.26 21.1 13.5 16.1 7.5 4.8 5.8 29.8 46.7 39.0 5.7 6.3 2.1 2.4 1.8 4.0 100.0 Outperform Medium NZR
NZS 30-Jun 0.57 139 0.66 -16.6 -11.6 3.9 -6.8 -4.8 1.6 nmf nmf 35.8 25.4 25.6 -0.6 -6.0 0.0 0.0 nmf Neutral High NZS
OIC 31-Dec 2.11 313 2.40 25.6 25.6 26.5 17.3 17.3 17.9 12.2 12.2 11.8 6.5 6.4 14.7 21.9 4.2 8.9 100.0 Outperform Low OIC
PFI 31-Dec 1.19 262 1.13 16.6 17.8 18.5 7.6 8.0 8.2 15.7 14.9 14.5 12.8 12.3 8.4 7.5 6.6 7.9 19.5 Underperform Low PFI
PGW 30-Jun 0.31 235 0.40 27.9 30.9 35.0 3.7 4.1 4.6 8.4 7.6 6.7 7.5 6.8 5.1 5.2 6.5 2.0 100.0 Underperform Medium PGW
POT 30-Jun 11.24 1,507 10.80 71.0 73.8 72.5 53.0 55.1 54.1 21.2 20.4 20.8 15.2 14.3 11.0 10.1 3.1 35.0 100.0 Underperform Low POT
PPL 31-Jul 0.88 148 1.10 9.4 15.6 20.2 5.6 9.2 12.0 15.7 9.5 7.3 7.6 5.7 17.2 39.1 6.3 5.5 100.0 Outperform Medium PPL
RAK 31-Mar 0.47 89 0.66 0.0 3.8 8.4 0.0 2.0 4.4 nmf 23.9 10.7 11.5 6.8 2.6 2.0 0.0 0.0 nmf Outperform High RAK
RBD 28-Feb 2.15 210 2.20 18.4 19.6 23.6 18.8 20.1 24.1 11.5 10.7 8.9 5.4 5.2 26.3 31.9 7.7 16.5 100.0 Outperform Low RBD
RYM 31-Mar 3.54 1,770 4.00 84.1 98.8 112.1 16.8 19.8 22.4 21.1 17.9 15.8 13.8 11.6 5.3 14.4 2.8 9.9 0.0 Outperform Low RYM
SAN 30-Sep 3.88 363 5.00 31.1 37.4 42.3 33.2 39.9 45.2 11.7 9.7 8.6 8.0 7.1 7.7 6.6 5.9 23.0 100.0 Outperform Low SAN
SKC 30-Jun 3.44 1,985 3.81 145.3 147.5 163.2 25.2 25.6 28.3 13.6 13.4 12.1 7.9 7.8 14.0 17.5 5.5 19.0 100.0 Outperform Low SKC
SKL 30-Jun 1.44 278 1.60 24.0 26.8 28.8 12.5 13.9 15.0 11.6 10.4 9.6 6.7 6.3 22.2 21.0 5.8 8.3 100.0 Outperform Low/Medium SKL
SKT 30-Jun 4.99 1,942 5.95 120.7 137.2 150.8 31.0 35.3 38.7 16.1 14.2 12.9 6.6 6.1 11.2 10.9 4.6 22.9 100.0 Outperform Low SKT
STU 30-Jun 2.11 186 2.00 13.0 15.1 16.1 14.7 17.1 18.2 14.4 12.4 11.6 8.7 7.8 10.6 10.0 7.6 16.0 100.0 Underperform Low STU
TEL 30-Jun 2.53 4,688 2.45 287.0 351.4 374.5 15.0 19.3 20.7 16.8 13.1 12.2 5.2 4.7 14.4 20.6 6.7 17.0 100.0 Neutral Low TEL
THL 30-Jun 0.57 56 0.66 5.1 9.2 11.6 5.2 9.4 11.8 11.0 6.1 4.8 2.5 2.3 7.1 5.7 9.8 5.6 100.0 Neutral Medium THL
TME 30-Jun 3.70 1,464 4.13 69.4 77.1 88.3 17.5 19.5 22.3 21.1 19.0 16.6 15.3 13.3 14.5 12.6 4.2 15.6 100.0 Outperform Low TME
TPW 31-Mar 7.68 2,425 7.05 136.8 128.6 136.9 43.5 40.9 43.6 17.7 18.8 17.6 10.6 10.2 8.7 8.2 5.2 40.0 75.0 Underperform Low TPW
VCT 30-Jun 2.63 2,619 2.98 188.4 182.9 153.4 18.8 18.3 15.3 14.0 14.4 17.1 7.8 7.8 8.0 8.7 5.8 15.3 100.0 Outperform Low VCT
VHP 30-Jun 1.24 362 1.13 22.6 23.8 23.1 7.8 8.1 7.8 15.9 15.2 15.8 14.1 12.8 7.6 7.6 6.2 7.7 30.7 Underperform Low VHP
WHS 31-Jul 2.51 781 2.65 63.7 70.6 78.1 20.5 22.7 25.1 12.3 11.1 10.0 6.9 6.1 15.0 22.8 8.1 20.4 100.0 Neutral Low WHS
Source: Macquarie Research, Factset pricing, July 2012

Macquarie Private Wealth Macquarie Marquee Ideas
13 July 2012 23
Important disclosures:
Recommendation definitions
Macquarie - Australia/New Zealand Outperform – return >3% in excess of benchmark return Neutral – return within 3% of benchmark return Underperform – return >3% below benchmark return Benchmark return is determined by long term nominal GDP growth plus 12 month forward market dividend yield
Macquarie – Asia/Europe Outperform – expected return >+10% Neutral – expected return from -10% to +10% Underperform – expected return <-10%
Macquarie First South - South Africa Outperform – expected return >+10% Neutral – expected return from -10% to +10% Underperform – expected return <-10%
Macquarie - Canada Outperform – return >5% in excess of benchmark return Neutral – return within 5% of benchmark return Underperform – return >5% below benchmark return
Macquarie - USA Outperform (Buy) – return >5% in excess of Russell 3000 index return Neutral (Hold) – return within 5% of Russell 3000 index return Underperform (Sell)– return >5% below Russell 3000 index return
Volatility index definition*
This is calculated from the volatility of historical price movements. Very high–highest risk – Stock should be expected to move up or down 60–100% in a year – investors should be aware this stock is highly speculative. High – stock should be expected to move up or down at least 40–60% in a year – investors should be aware this stock could be speculative. Medium – stock should be expected to move up or down at least 30–40% in a year. Low–medium – stock should be expected to move up or down at least 25–30% in a year. Low – stock should be expected to move up or down at least 15–25% in a year. * Applicable to Australian/NZ/Canada stocks only
Recommendations – 12 months Note: Quant recommendations may differ from Fundamental Analyst recommendations
Financial definitions
All "Adjusted" data items have had the following adjustments made: Added back: goodwill amortisation, provision for catastrophe reserves, IFRS derivatives & hedging, IFRS impairments & IFRS interest expense Excluded: non recurring items, asset revals, property revals, appraisal value uplift, preference dividends & minority interests EPS = adjusted net profit / efpowa* ROA = adjusted ebit / average total assets ROA Banks/Insurance = adjusted net profit /average total assets ROE = adjusted net profit / average shareholders funds Gross cashflow = adjusted net profit + depreciation *equivalent fully paid ordinary weighted average number of shares All Reported numbers for Australian/NZ listed stocks are modelled under IFRS (International Financial Reporting Standards).
Recommendation proportions – For quarter ending 30 June 2012
AU/NZ Asia RSA USA CA EUR Outperform 55.67% 61.00% 53.43% 42.58% 69.23% 46.60% (for US coverage by MCUSA, 9.05% of stocks followed are investment banking clients)
Neutral 30.50% 22.11% 36.99% 52.41% 28.02% 33.69% (for US coverage by MCUSA, 8.14% of stocks followed are investment banking clients)
Underperform 13.83% 16.89% 9.59% 5.01% 2.75% 19.71% (for US coverage by MCUSA, 0.45% of stocks covered are investment banking clients)
Company Specific Disclosures: Important disclosure information regarding the subject companies covered in this report is available at www.macquarie.com/disclosures.
Analyst Certification: The views expressed in this research reflect the personal views of the analyst(s) about the subject securities or issuers and no part of the compensation of the analyst(s) was, is, or will be directly or indirectly related to the inclusion of specific recommendations or views in this research. The analyst principally responsible for the preparation of this research receives compensation based on overall revenues of Macquarie Group Ltd (ABN 94 122 169 279, AFSL No. 318062) (“MGL”) and its related entities (the “Macquarie Group”) and has taken reasonable care to achieve and maintain independence and objectivity in making any recommendations. General Disclosure: This research has been issued by Macquarie Securities (Australia) Limited (ABN 58 002 832 126, AFSL No. 238947) a Participant of the Australian Securities Exchange (ASX) and Chi-X Australia Pty Limited. This research is distributed in Australia by Macquarie Equities Limited (ABN 41 002 574 923, AFSL No. 237504) ("MEL"), a Participant of the ASX, and in New Zealand by Macquarie Equities New Zealand Limited (“MENZ”) an NZX Firm. Macquarie Private Wealth‟s services in New Zealand are provided by MENZ. Macquarie Bank Limited (ABN 46 008 583 542, AFSL No. 237502) (“MBL”) is a company incorporated in Australia and authorised under the Banking Act 1959 (Australia) to conduct banking business in Australia. None of MBL, MGL or MENZ is registered as a bank in New Zealand by the Reserve Bank of New Zealand under the Reserve Bank of New Zealand Act 1989. Any MGL subsidiary noted in this research, apart from MBL, is not an authorised deposit-taking institution for the purposes of the Banking Act 1959 (Australia) and that subsidiary‟s obligations do not represent deposits or other liabilities of MBL. MBL does not guarantee or otherwise provide assurance in respect of the obligations of that subsidiary, unless noted otherwise. This research is general advice and does not take account of your objectives, financial situation or needs. Before acting on this general advice, you should consider the appropriateness of the advice having regard to your situation. We recommend you obtain financial, legal and taxation advice before making any financial investment decision. This research has been prepared for the use of the clients of the Macquarie Group and must not be copied, either in whole or in part, or distributed to any other person. If you are not the intended recipient, you must not use or disclose this research in any way. If you received it in error, please tell us immediately by return e-mail and delete the document. We do not guarantee the integrity of any e-mails or attached files and are not responsible for any changes made to them by any other person. Nothing in this research shall be construed as a solicitation to buy or sell any security or product, or to engage in or refrain from engaging in any transaction. This research is based on information obtained from sources believed to be reliable, but the Macquarie Group does not make any representation or warranty that it is accurate, complete or up to date. We accept no obligation to correct or update the information or opinions in it. Opinions expressed are subject to change without notice. The Macquarie Group accepts no liability whatsoever for any direct, indirect, consequential or other loss arising from any use of this research and/or further communication in relation to this research. The Macquarie Group produces a variety of research products, recommendations contained in one type of research product may differ from recommendations contained in other types of research. The Macquarie Group has established and implemented a conflicts policy at group level, which may be revised and updated from time to time, pursuant to regulatory requirements; which sets out how we must seek to identify and manage all material conflicts of interest. The Macquarie Group, its officers and employees may have conflicting roles in the financial products referred to in this research and, as such, may effect transactions which are not consistent with the recommendations (if any) in this research. The Macquarie Group may receive fees, brokerage or commissions for acting in those capacities and the reader should assume that this is the case. The Macquarie Group„s employees or officers may provide oral or written opinions to its clients which are contrary to the opinions expressed in this research. Important disclosure information regarding the subject companies covered in this report is available at www.macquarie.com/disclosures.