Embed Size (px)
Citation preview
Citation: Khutle Nilesh M, Pawar Harshal A and Vijaya C. “Zero-Crossing” First-order Derivative Spectroscopy Method for Analysis of Sertraline Hydrochloride in Novel Self Micro Emulsifying Drug Delivery System. Austin J Anal Pharm Chem. 2014;1(3): 1013.
Austin J Anal Pharm Chem - Volume 1 Issue 3 - 2014ISSN : 2381-8913 | www.austinpublishinggroup.comHarshal et al. © All rights are reserved
Austin Journal of Analytical and Pharmaceutical Chemistry
Open Access Full Text Article
AbstractNovel Self-Micro Emulsifying Drug Delivery System (SMEDDS) of
Sertraline hydrochloride was developed. SMEDD System of Sertraline hydrochloride consists of Capmul MCM C8 EP as oily phase, Cremophore RH 40 as surfactant and Labrafil M 2125 as co surfactant. These self-emulsifying additives interfere significantly with the estimation of Sertraline hydrochloride by UV spectrophotometry method. In the present study “Zero crossing” first-order derivative spectroscopy method was developed and validated to estimate the Sertraline hydrochloride in presence of self emulsifying additives and compared with simple UV-Visible spectrophotometry method. The obtained results noticeably recommended that, in comparison with the UV-spectrophotometry method; the first-order derivative UV-spectrophotometry is a simple method to estimate Sertraline hydrochloride with sufficient accuracy, specificity and precision. The proposed methods were applied successfully to estimate the drug content and in vitro drug release of newly formulated Self emulsifying drug delivery system of Sertraline hydrochloride.
Keywords: Sertraline hydrochloride; Self Emulsifying Drug Delivery; First order derivative spectrophotometry
to GIT fluids to form oil in water microemulsion with droplet size, in the range of 20–200 nm [12].
A novel Self micro emulsifying drug delivery system (SMEDDS) of Sertraline hydrochloride was successfully developed to enhance the water solubility and dissolution profile. Based on solubility profile of drug, study of emulsification efficiency and ternary phase diagram SMEDDS of Sertraline hydrochloride was produced. An optimized SMEDD System of Sertraline hydrochloride consists of Capmul MCM C8 EP as oily phase, Cremophore RH 40 as surfactant and Labrafil M 2125 as co surfactant. The optimized formulation was thermodynamically stable; efficiently produce fine microemulsion on
AbbreviationsSRT: Sertraline Hydrochloride; SMEDDS: Self-microemulsifying
Drug Delivery System; RSD: Relative Standard Deviation; LOD: Limit of Detection; LOQ: Limit of Quantitation; SAB: 0.05 M Sodium Acetate Buffer, pH 4.5; SGF: Simulated Gastric Fluid; 0.1 N HCl; SIF: Simulated Intestinal Fluid; Phosphate Buffer pH 6.8
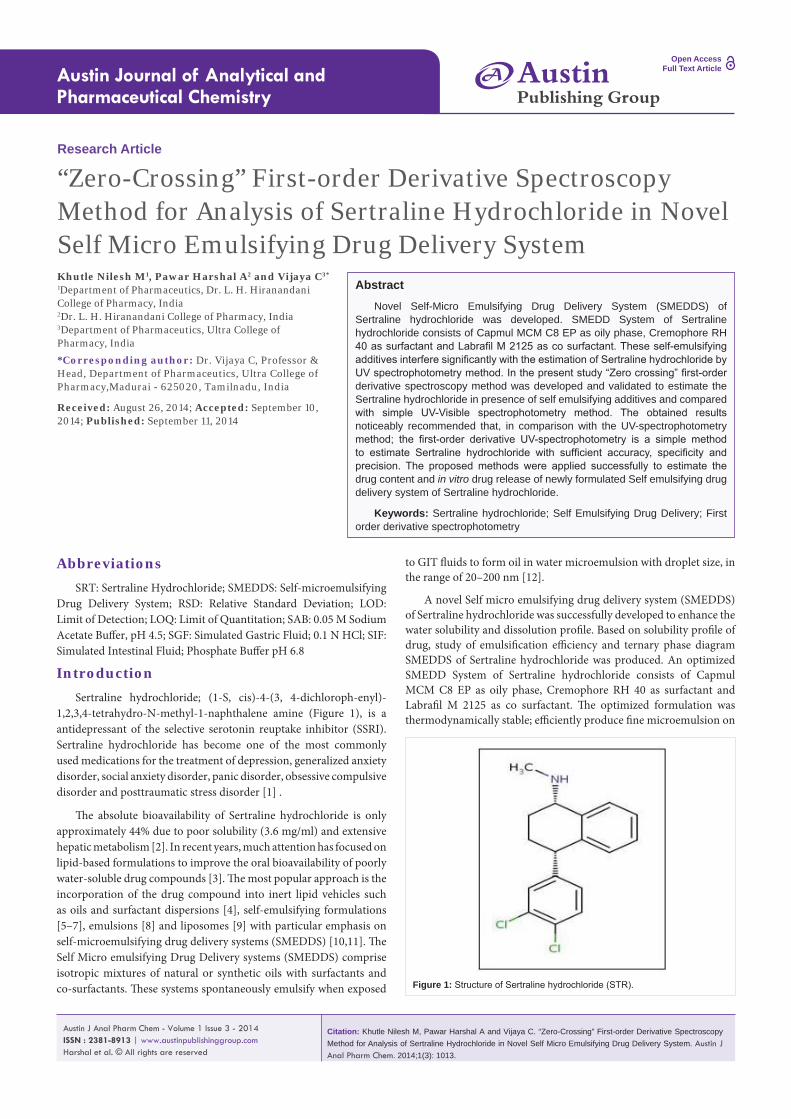
IntroductionSertraline hydrochloride; (1-S, cis)-4-(3, 4-dichloroph-enyl)-
1,2,3,4-tetrahydro-N-methyl-1-naphthalene amine (Figure 1), is a antidepressant of the selective serotonin reuptake inhibitor (SSRI). Sertraline hydrochloride has become one of the most commonly used medications for the treatment of depression, generalized anxiety disorder, social anxiety disorder, panic disorder, obsessive compulsive disorder and posttraumatic stress disorder [1] .
The absolute bioavailability of Sertraline hydrochloride is only approximately 44% due to poor solubility (3.6 mg/ml) and extensive hepatic metabolism [2]. In recent years, much attention has focused on lipid-based formulations to improve the oral bioavailability of poorly water-soluble drug compounds [3]. The most popular approach is the incorporation of the drug compound into inert lipid vehicles such as oils and surfactant dispersions [4], self-emulsifying formulations [5–7], emulsions [8] and liposomes [9] with particular emphasis on self-microemulsifying drug delivery systems (SMEDDS) [10,11]. The Self Micro emulsifying Drug Delivery systems (SMEDDS) comprise isotropic mixtures of natural or synthetic oils with surfactants and co-surfactants. These systems spontaneously emulsify when exposed
Research Article
“Zero-Crossing” First-order Derivative Spectroscopy Method for Analysis of Sertraline Hydrochloride in Novel Self Micro Emulsifying Drug Delivery SystemKhutle Nilesh M1, Pawar Harshal A2 and Vijaya C3*
1Department of Pharmaceutics, Dr. L. H. Hiranandani College of Pharmacy, India2Dr. L. H. Hiranandani College of Pharmacy, India3Department of Pharmaceutics, Ultra College of Pharmacy, India
*Corresponding author: Dr. Vijaya C, Professor & Head, Department of Pharmaceutics, Ultra College of Pharmacy,Madurai - 625020, Tamilnadu, India
Received: August 26, 2014; Accepted: September 10, 2014; Published: September 11, 2014
AustinPublishing Group
A
Figure 1: Structure of Sertraline hydrochloride (STR).
Austin J Anal Pharm Chem 1(3): id1013 (2014) - Page - 02
Khutle Nilesh M. et al Austin Publishing Group
Submit your Manuscript | www.austinpublishinggroup.com
aqueous dilution with globule size of 62.19 nm and Zeta potential of +13.12 mV.
However, it was observed that these Self emulsifying additives exhibit considerable absorbance at the wavelength of maximum absorbance (λ max-273nm) of Sertraline hydrochloride, UV-spectrophotometry method cannot be used to estimate Sertraline hydrochloride accurately in their presence.
Many researchers worked on SMEDDS formulation developed HPLC method for estimation of drug [13-15], even though the Chromatography method is accurate enough to estimate the drugs in such formulation but it is time consuming and non-economical method. While researchers reported the use of UV-Spectrophotometry method for estimating the drug release in dissolution study of SMEDDS formulation by using placebo SMEDDS as an appropriate blank [16] but the detailed explanation about preparation of appropriate blank at different time interval of dissolution study was not mentioned precisely.
Derivative spectra can be used to enhance differences among spectra, to resolve overlapping bands in qualitative analysis and most importantly, to reduce the effects of interference from scattering, matrix or other absorbing compounds in quantitative analysis [17].
Biswanath Sa, reported the successful development of First-Order derivative UV-Spectrophotometry method for estimation of Diazepam in presence UV absorption interfering excipients like Surfactant: Tween-80 and co-surfactant: propylene glycol in micro emulsion formulation [18]. Furthermore, no literature was found mentioning the application and use of First order derivative spectrophotometric method for estimation of drugs in presence of self emulsifying additives [19].
The objective of the work was to develop simple, accurate, precise and economic First order derivative Spectroscopic method and comparing it with Zero order UV spectroscopic method to estimate the Sertraline hydrochloride in presence of self-emulsifying additives.
Materials and MethodsMaterials
Sertraline hydrochloride was obtained as gift sample from Cadila pharmaceuticals, Gujarat, India. Capmul MCM C8 EP was obtained as gift sample from Abitech USA, Cremophore RH 40 Was generous gift sample from BASF, Mumbai, India and Labrafil M 2125 was obtained as gift sample from Gattefosse, India , Methanol AR and all other reagents were obtained commercially and used as received. Distilled water was used to prepare 0.05 M Sodium acetate buffer pH 4.5 (SAB), standard solution of drug and other reagents.
Apparatus
Spectrophotometric measurements were performed on a Shimadzu UV-1800 Spectrophotometer under the following optimized working settings-scan range, 200 to 400 nm; slit width, 1.0 nm; average time interval, 0.5 s; data interval, 0.2 nm; scan speed, Fast. Derivative spectra were obtained mathematically from the absorbance spectrum with UV Probe, Version 2.34.
MethodsPreparation of Sertraline hydrochloride SMEDDS and Placebo
SMEDDS formulation
A novel optimized SMEDDS formulation of Sertraline hydrochloride was prepared by dissolving 28 mg of Sertraline hydrochloride (Equivalent to 25 mg of Sertraline) in 350 mg of isotropic SMEDDS mixture consisting of Capmul MCM C8 EP, Cremophore RH 40 and Labrafil M 2125 by heating the mixture at 50-60OC for 5-10 min. Vortex mixer was used to facilitate the solubilization. Placebo formulation was prepared with the same excipients and method without the addition of drug.
Construction of absorbance spectrum of Sertraline hydrochloride (SRT) in 0.05 M Sodium acetate buffer pH 4.5 (SAB)
Accurately weighed 50 mg Sertraline hydrochloride (SRT) was dissolved in 10 ml methanol and 1 ml of this solution was diluted to 100 ml with 0.05 M Sodium acetate buffer pH 4.5 (SAB) to get a stock solution having concentration of 50μg/ml. Aliquots from this stock solution were further diluted to 10 ml with SAB to get working standard solutions having concentrations from 5 to 50μg/ml. Each of these solutions was scanned from 200 to 400 nm against SAB as blank. Working standard solutions were prepared three times a day from the same stock solution (50μg/ml) and subsequently scanned in the range of 200 nm to 400 nm against SAB as blank to get the absorbance value (A) at 0.2-nm interval. The entire experiment was replicated for three consecutive days.
Construction of first-order derivative spectrum of SRT in SAB
The absorbance values (A) at various wavelengths (λ; ranging from 200 to 400 nm) of each standard solution was used to calculate the slope of the tangent at each data point and plot of dA/dλ against λ, generated the corresponding first-order derivative spectra [18].
Construction of absorbance spectrum of placebo SMEDDS in SAB
Accurately weighed 350 mg Placebo SMEDDS was dissolved in 900 ml SAB to get a placebo matrix stock solution, mimicking the final concentration of self-emulsifying components in an in vitro dissolution basket. This solution was scanned 3 times a day from 200 to 400 nm against SAB as blank to get the absorbance value (A) at 0.2-nm interval. The entire experiment was replicated for three consecutive days.
Construction of first-order derivative spectrum of placebo SMEDDS in SAB
The absorbance values (A) at various wavelengths (λ; ranging from 200 to 400 nm) of placebo microemulsion was used to calculate the slope of the tangent at each data point and plot of dA/dλ against λ, generated the corresponding first-order derivative spectra [18].
“Zero-crossing” first derivative spectrophotometry
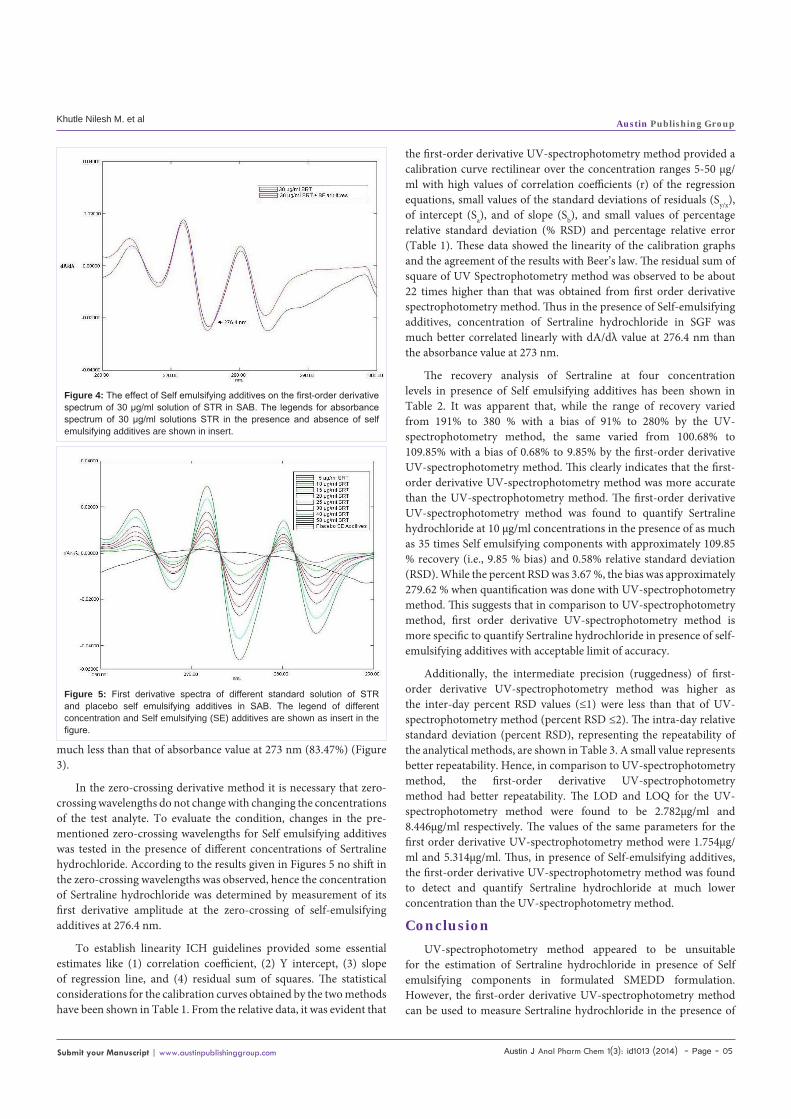
Because the derivative spectrophotometric technique enhances the detectability of the minor features of the UV absorption spectrum, the first derivative spectra of both Sertraline hydrochloride and self-emulsifying additives (Figure 4) displays features which may permit more specific and selective determination of the Sertraline hydrochloride in the presence of self-emulsifying additives. The zero-crossing method is the most common procedure for conducting analytical calibration in derivative spectrophotometry, so Sertraline hydrochloride was determined by measurement of its first derivative
Austin J Anal Pharm Chem 1(3): id1013 (2014) - Page - 03
Khutle Nilesh M. et al Austin Publishing Group
Submit your Manuscript | www.austinpublishinggroup.com
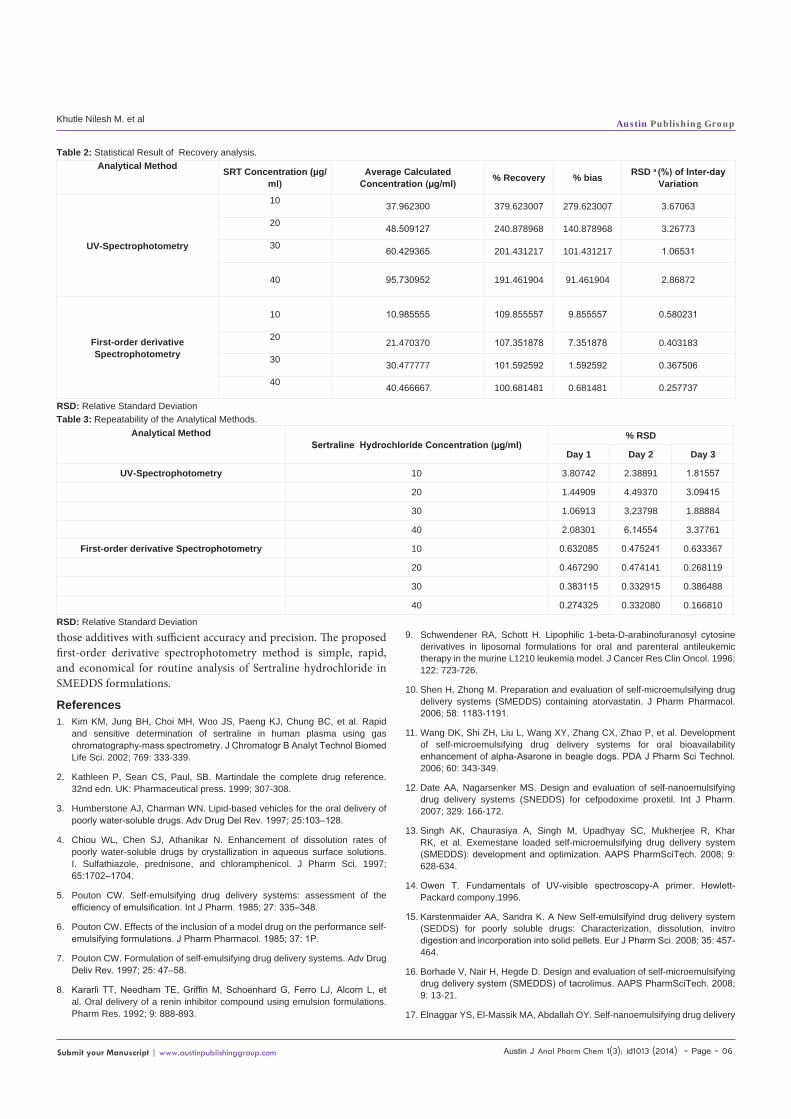
amplitude at the zero-crossing of self-emulsifying additives at 276.4 nm. Figure 5 shows the first derivative spectra of Sertraline hydrochloride in concentration range of 5-50 μg/ml in presence of self-emulsifying additives.
Construction of calibration graphs
Calibration curves were constructed by linear regression analysis, using the method of least square. Eight working standards solutions of Sertraline hydrochloride were used to construct the calibration curves. The absorbance values (A) were measured at 273 nm and the absolute values dA/dλ was measured at 276.4 nm for UV-spectrophotometry and first-order derivative UV-spectrophotometry methods, respectively.
Recovery analysis
2ml, 3ml and 4ml of the stock solution of SRT were transferred in separate 100ml volumetric flasks and diluted with stock solution of placebo matrix to give 100ml. The nominal concentration of SRT in the resulting solution was 20 µg/ml, 30 µg/ml and 40µg/ml. Each solution was scanned in the range of 200 to 400 nm. The absorbance values (A) at 273 nm and dA/dλ values at 276.4 nm were used to calculate the concentration of Sertraline hydrochloride in presence of Self emulsifying components from the respective calibration curves. The recovery analysis was done in triplicate each day for three consecutive days. The experimentally found concentrations of SRT were compared with the nominal values of 20µg/ml, 30µg/ml and 40µg/ml. % recovery was calculated as follows
% Recovery = (Concentration found/Nominal concentration) X 100
The % recovery was taken as indicative of the accuracy of the methods.
Further, at each concentration level, the standard deviation of the experimentally found values was calculated. The % relative standard deviation calculated as
%RSD = (Standard deviation/Mean) X 100,
The % RSD was taken as measure of the precision.
Linearity and range
Acceptable accuracy and precision at 20µg/ml, 30µg/ml and 40µg/ml was used as indicative of range of the method. 1ml, 2ml, 3ml and 4ml of stock solution of SRT were diluted to 100ml with stock solution of blank matrix and resulting solution were analyzed for content of SRT. The experimentally obtained concentrations were plotted in Y axis against nominal concentrations of SRT on X axis and subjected to linear regression analysis. Slope close to 1 and intercept close to zero was taken as indicative of linearity of the method.
Limit of detection (LOD) and limit of quantitation (LOQ)
The limit of quantitation (LOQ) was determined by establishing the lowest concentration that can be measured according to ICH Q2) R1) recommendation [20] below which the calibration graph is nonlinear while the limit of detection (LOD) was determined by evaluating the lowest concentration of the analyte that can be readily detected.
The results are shown in Table 1. LOQ and LOD were calculated according to the following equations [21]:
Parameter
Values
UV Spectroscopic Method First-order Derivative Spectroscopic Method
Lambda maximum (λ Max.) 273 nm 276.4 nm
Regression Equation Absorbance[A] = 0.006 * Concentration(µg/ml)+ 0.002
D1 = -0.0007 * Concentration(µg/ml)-0.0003
Intercept (a) 0.002 -0.0003
Slope (b) 0.006 -0.0007
Standard deviation of intercept (Sa) 0.006843 0.001201
Standard deviation of slope (Sb) 0.0000242 0.0000425
Correlation coefficient (R2) 0.999 0.999
99% Confidence interval of intercept (± t Sa ) -0.014092 to 0.029291 -0.0053 to 0.005827
99% Confidence interval of slope (± t Sb ) 0.0020315 to 0.003568 0.0001188 to 0.0002064
Standard error of correlation coefficient (S y.x) 0.001498529 0.000371999
Residual Sum of Squares (RSQ) 0.0004104 0.0000187
L O D 2.782 (µg/ml) 1.754 (µg/ml)
L O Q 8.446 (µg/ml) 5.314 (µg/ml)
Table 1: Comparative spectral data of Sertraline Hydrochloride in SAB.
LOD: Limit of Detection; LOQ: Limit of Quantification
Austin J Anal Pharm Chem 1(3): id1013 (2014) - Page - 04
Khutle Nilesh M. et al Austin Publishing Group
Submit your Manuscript | www.austinpublishinggroup.com
LOQ = 10 Sa/b and LOD = 3.3 Sa/b
Where Sa is the standard deviation of the intercept of regression line, and b is the slope of the calibration curve.
Development of the method in alternate dissolution media
The USP recommends 0.05 M sodium acetate buffer pH 4.5 (SAB) as a dissolution medium for SRT. But since any oral dosage form would be first exposed to acidic conditions followed by alkaline pH in GI tract [22], therefore, the in vitro release of SRT is required to assessed in 0.1N HCl [Simulated gastric fluid (SGF)] and in Phosphate buffer pH 6.8 [Simulated intestinal fluid (SIF)] to examine the effect of pH on drug release. The proposed first order derivative spectrophotometric method was also developed in another two different dissolution media differencing in pH i.e. SGF and SIF, by following the same procedure mentioned above and replacing the SAB by SGF and SIF as the dilution media.
Results and DiscussionWhen 5 µg/ml, 10 µg/ml, 15 µg/ml, 20 µg/ml, 25 µg/ml, 30 µg/
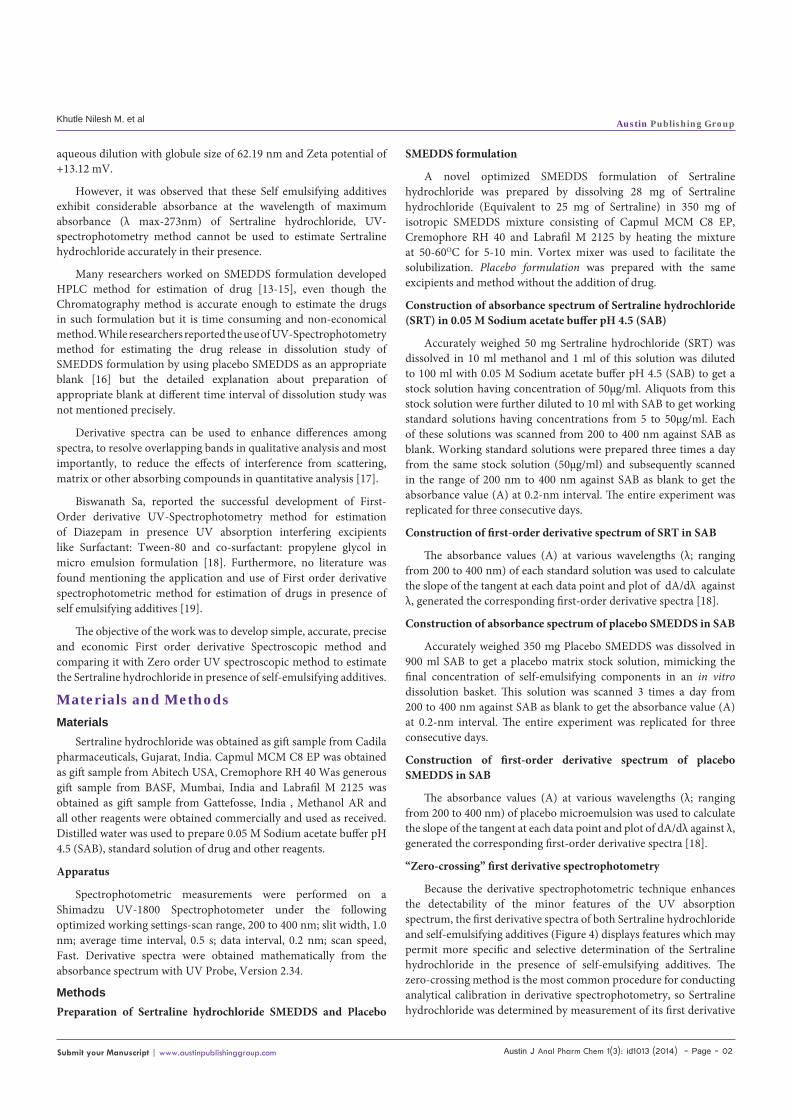
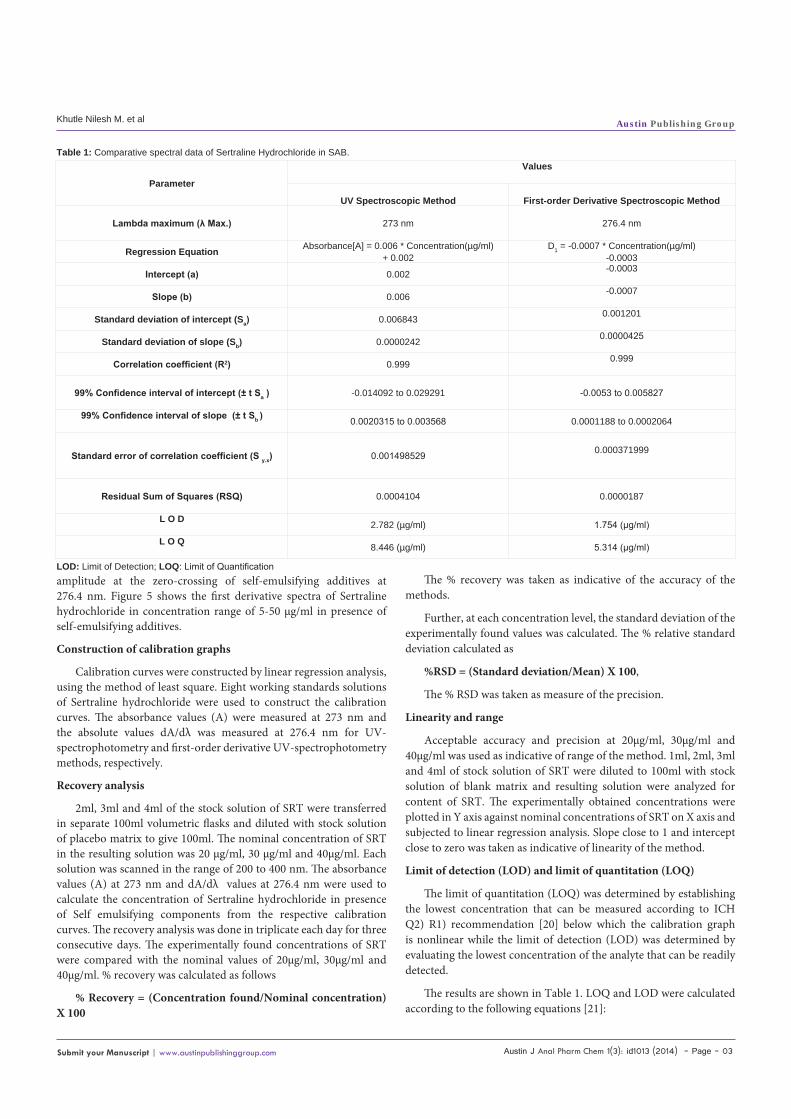
ml, 40 µg/ml and 50µg/ml solutions of SRT and placebo SMEDDS matrix in SAB were scanned from 200nm to 400nm, it was found that although SRT has substantial absorbance in this range, the other components of SMEDDS also absorbed significantly throughout the UV region. Figure 2 is a representative spectrum of different concentrations SRT and stock solution of placebo SMEDDS matrix (Self emulsifying additives) in SAB. The wavelength of maximum absorbance (λ max) of Sertraline hydrochloride in SAB was found to be 273 nm (Figure 2). Presence of SMEDDS components in standard solution of SRT (10 μg/ml) shows no change in λ max but the absorbance value was increased by 274.76% Such interference was observed throughout the total range of drug concentration studied, although the level of interference decreased with increase in drug concentration (Figure 3). Thus, a specific wavelength for SRT could not be identified. Further, since it was observed that, though the SMEDDS components absorbed throughout the UV region, the absorptivity remained constant displaying no change in slope of the absorption spectrum over the range. SRT, however, displayed substantial changes in slope i.e. dA/dλ in this region. Thus, it was felt necessary to evaluate the first order derivative spectra for SRT and SMEDDS blank matrix in the three buffers.
The first order derivative spectra of SRT consist of three instance positive peaks at 263.8, 271.6 nm and 280nm and three negative peaks at 268 nm, 275.2 nm and 283.8nm (Figure 4). While the first order derivative spectrum of placebo SMEDDS had several zero crossing points i.e. wavelengths at which the slope of the absorption curve or dA/dλ was zero. At these wavelengths, the first order derivative spectrum of SRT, however, showed appreciable positive or negative slope i.e. dA/dλ. Any of these wavelengths, thus would be capable of giving analytical variable dA/dλ for SRT without interference from the blank SMEDDS matrix. Figure 5 is a representative first order derivative spectrum for stock solution of placebo SMEDDS matrix and varying concentrations of SRT in SAB. At one of the zero crossing wavelengths, 276.4nm, SRT exhibits a strong negative slope which changes appreciably with concentration, due to which the first order derivative spectrum of Sertraline hydrochloride in the presence and absence of self-emulsifying additives were superimposed at 276.4
nm (Figure 4); hence 276.4nm was selected as analytical wavelength. Different concentrations of Self-emulsifying components in SAB were scanned in the wavelength range from 200 to 400 nm and its zero and first order derivative spectra were obtained, the significant difference in A value at 273 nm was observed as increase in the concentration of self-emulsifying components, while dA/dλ value at 276.4 nm was near to zero at various concentration of self-emulsifying components; this result indicate that solutions shows zero crossing and no interference in dA/dλ value at 276.4 nm irrespective of the concentration of self-emulsifying components which is likely to be happened while estimating the drug concentration in dissolution study.
In presence and absence of Self-emulsifying components, the change in dA/dλ values of Sertraline hydrochloride at 276.4 nm was negligible than the corresponding change in A value at 273 nm, for example dA/dλ values at 276.4 nm of 30 μg/ml Sertraline hydrochloride solution was increased by about 2.7 % due to presence of Self emulsifying components (Figure 4). This deviation (2.7 %) was
Figure 2: Absorbance spectra of 8 standard solution of Sertraline hydrochloride (STR) and placebo Self-emulsifying components in SAB. The legends for different concentrations of Sertraline hydrochloride and placebo Self-emulsifying components were shown as insert in the figure.
Figure 3: The effect of presence and absence of Self emulsifying components on the absorbance spectra of standard solution of SRT in SAB. The legends for absorbance spectrum of different standard solution of STR in the presence and absence of Self emulsifying additives are shown in insert.
Austin J Anal Pharm Chem 1(3): id1013 (2014) - Page - 05
Khutle Nilesh M. et al Austin Publishing Group
Submit your Manuscript | www.austinpublishinggroup.com
much less than that of absorbance value at 273 nm (83.47%) (Figure 3).
In the zero-crossing derivative method it is necessary that zero-crossing wavelengths do not change with changing the concentrations of the test analyte. To evaluate the condition, changes in the pre-mentioned zero-crossing wavelengths for Self emulsifying additives was tested in the presence of different concentrations of Sertraline hydrochloride. According to the results given in Figures 5 no shift in the zero-crossing wavelengths was observed, hence the concentration of Sertraline hydrochloride was determined by measurement of its first derivative amplitude at the zero-crossing of self-emulsifying additives at 276.4 nm.
To establish linearity ICH guidelines provided some essential estimates like (1) correlation coefficient, (2) Y intercept, (3) slope of regression line, and (4) residual sum of squares. The statistical considerations for the calibration curves obtained by the two methods have been shown in Table 1. From the relative data, it was evident that
Figure 4: The effect of Self emulsifying additives on the first-order derivative spectrum of 30 µg/ml solution of STR in SAB. The legends for absorbance spectrum of 30 µg/ml solutions STR in the presence and absence of self emulsifying additives are shown in insert.
Figure 5: First derivative spectra of different standard solution of STR and placebo self emulsifying additives in SAB. The legend of different concentration and Self emulsifying (SE) additives are shown as insert in the figure.
the first-order derivative UV-spectrophotometry method provided a calibration curve rectilinear over the concentration ranges 5-50 μg/ml with high values of correlation coefficients (r) of the regression equations, small values of the standard deviations of residuals (Sy/x), of intercept (Sa), and of slope (Sb), and small values of percentage relative standard deviation (% RSD) and percentage relative error (Table 1). These data showed the linearity of the calibration graphs and the agreement of the results with Beer’s law. The residual sum of square of UV Spectrophotometry method was observed to be about 22 times higher than that was obtained from first order derivative spectrophotometry method. Thus in the presence of Self-emulsifying additives, concentration of Sertraline hydrochloride in SGF was much better correlated linearly with dA/dλ value at 276.4 nm than the absorbance value at 273 nm.
The recovery analysis of Sertraline at four concentration levels in presence of Self emulsifying additives has been shown in Table 2. It was apparent that, while the range of recovery varied from 191% to 380 % with a bias of 91% to 280% by the UV-spectrophotometry method, the same varied from 100.68% to 109.85% with a bias of 0.68% to 9.85% by the first-order derivative UV-spectrophotometry method. This clearly indicates that the first-order derivative UV-spectrophotometry method was more accurate than the UV-spectrophotometry method. The first-order derivative UV-spectrophotometry method was found to quantify Sertraline hydrochloride at 10 μg/ml concentrations in the presence of as much as 35 times Self emulsifying components with approximately 109.85 % recovery (i.e., 9.85 % bias) and 0.58% relative standard deviation (RSD). While the percent RSD was 3.67 %, the bias was approximately 279.62 % when quantification was done with UV-spectrophotometry method. This suggests that in comparison to UV-spectrophotometry method, first order derivative UV-spectrophotometry method is more specific to quantify Sertraline hydrochloride in presence of self-emulsifying additives with acceptable limit of accuracy.
Additionally, the intermediate precision (ruggedness) of first-order derivative UV-spectrophotometry method was higher as the inter-day percent RSD values (≤1) were less than that of UV-spectrophotometry method (percent RSD ≤2). The intra-day relative standard deviation (percent RSD), representing the repeatability of the analytical methods, are shown in Table 3. A small value represents better repeatability. Hence, in comparison to UV-spectrophotometry method, the first-order derivative UV-spectrophotometry method had better repeatability. The LOD and LOQ for the UV-spectrophotometry method were found to be 2.782μg/ml and 8.446μg/ml respectively. The values of the same parameters for the first order derivative UV-spectrophotometry method were 1.754μg/ml and 5.314μg/ml. Thus, in presence of Self-emulsifying additives, the first-order derivative UV-spectrophotometry method was found to detect and quantify Sertraline hydrochloride at much lower concentration than the UV-spectrophotometry method.
ConclusionUV-spectrophotometry method appeared to be unsuitable
for the estimation of Sertraline hydrochloride in presence of Self emulsifying components in formulated SMEDD formulation. However, the first-order derivative UV-spectrophotometry method can be used to measure Sertraline hydrochloride in the presence of
Austin J Anal Pharm Chem 1(3): id1013 (2014) - Page - 06
Khutle Nilesh M. et al Austin Publishing Group
Submit your Manuscript | www.austinpublishinggroup.com
those additives with sufficient accuracy and precision. The proposed first-order derivative spectrophotometry method is simple, rapid, and economical for routine analysis of Sertraline hydrochloride in SMEDDS formulations.
References1. Kim KM, Jung BH, Choi MH, Woo JS, Paeng KJ, Chung BC, et al. Rapid
and sensitive determination of sertraline in human plasma using gas chromatography-mass spectrometry. J Chromatogr B Analyt Technol Biomed Life Sci. 2002; 769: 333-339.
2. Kathleen P, Sean CS, Paul, SB. Martindale the complete drug reference. 32nd edn. UK: Pharmaceutical press. 1999; 307-308.
3. Humberstone AJ, Charman WN. Lipid-based vehicles for the oral delivery of poorly water-soluble drugs. Adv Drug Del Rev. 1997; 25:103–128.
4. Chiou WL, Chen SJ, Athanikar N. Enhancement of dissolution rates of poorly water-soluble drugs by crystallization in aqueous surface solutions. I. Sulfathiazole, prednisone, and chloramphenicol. J Pharm Sci. 1997; 65:1702–1704.
5. Pouton CW. Self-emulsifying drug delivery systems: assessment of the efficiency of emulsification. Int J Pharm. 1985; 27: 335–348.
6. Pouton CW. Effects of the inclusion of a model drug on the performance self-emulsifying formulations. J Pharm Pharmacol. 1985; 37: 1P.
7. Pouton CW. Formulation of self-emulsifying drug delivery systems. Adv Drug Deliv Rev. 1997; 25: 47–58.
8. Kararli TT, Needham TE, Griffin M, Schoenhard G, Ferro LJ, Alcorn L, et al. Oral delivery of a renin inhibitor compound using emulsion formulations. Pharm Res. 1992; 9: 888-893.
Analytical Method SRT Concentration (µg/ml)
Average Calculated Concentration (µg/ml) % Recovery % bias RSD a (%) of Inter-day
Variation
UV-Spectrophotometry
10 37.962300 379.623007 279.623007 3.67063
20 48.509127 240.878968 140.878968 3.26773
30 60.429365 201.431217 101.431217 1.06531
40 95.730952 191.461904 91.461904 2.86872
First-order derivative Spectrophotometry
10 10.985555 109.855557 9.855557 0.580231
20 21.470370 107.351878 7.351878 0.403183
30 30.477777 101.592592 1.592592 0.367506
40 40.466667 100.681481 0.681481 0.257737
Table 2: Statistical Result of Recovery analysis.
RSD: Relative Standard Deviation
Analytical MethodSertraline Hydrochloride Concentration (µg/ml)
% RSD
Day 1 Day 2 Day 3
UV-Spectrophotometry 10 3.80742 2.38891 1.81557
20 1.44909 4.49370 3.09415
30 1.06913 3.23798 1.88884
40 2.08301 6.14554 3.37761
First-order derivative Spectrophotometry 10 0.632085 0.475241 0.633367
20 0.467290 0.474141 0.268119
30 0.383115 0.332915 0.386488
40 0.274325 0.332080 0.166810
Table 3: Repeatability of the Analytical Methods.
RSD: Relative Standard Deviation9. Schwendener RA, Schott H. Lipophilic 1-beta-D-arabinofuranosyl cytosine
derivatives in liposomal formulations for oral and parenteral antileukemic therapy in the murine L1210 leukemia model. J Cancer Res Clin Oncol. 1996; 122: 723-726.
10. Shen H, Zhong M. Preparation and evaluation of self-microemulsifying drug delivery systems (SMEDDS) containing atorvastatin. J Pharm Pharmacol. 2006; 58: 1183-1191.
11. Wang DK, Shi ZH, Liu L, Wang XY, Zhang CX, Zhao P, et al. Development of self-microemulsifying drug delivery systems for oral bioavailability enhancement of alpha-Asarone in beagle dogs. PDA J Pharm Sci Technol. 2006; 60: 343-349.
12. Date AA, Nagarsenker MS. Design and evaluation of self-nanoemulsifying drug delivery systems (SNEDDS) for cefpodoxime proxetil. Int J Pharm. 2007; 329: 166-172.
13. Singh AK, Chaurasiya A, Singh M, Upadhyay SC, Mukherjee R, Khar RK, et al. Exemestane loaded self-microemulsifying drug delivery system (SMEDDS): development and optimization. AAPS PharmSciTech. 2008; 9: 628-634.
14. Owen T. Fundamentals of UV-visible spectroscopy-A primer. Hewlett-Packard compony.1996.
15. Karstenmaider AA, Sandra K. A New Self-emulsifyind drug delivery system (SEDDS) for poorly soluble drugs: Characterization, dissolution, invitro digestion and incorporation into solid pellets. Eur J Pharm Sci. 2008; 35: 457-464.
16. Borhade V, Nair H, Hegde D. Design and evaluation of self-microemulsifying drug delivery system (SMEDDS) of tacrolimus. AAPS PharmSciTech. 2008; 9: 13-21.
17. Elnaggar YS, El-Massik MA, Abdallah OY. Self-nanoemulsifying drug delivery
Austin J Anal Pharm Chem 1(3): id1013 (2014) - Page - 07
Khutle Nilesh M. et al Austin Publishing Group
Submit your Manuscript | www.austinpublishinggroup.com
systems of tamoxifen citrate: design and optimization. Int J Pharm. 2009; 380: 133-141.
18. Dastidar DG, Sa B. A comparative study of UV-spectrophotometry and first-order derivative UV-spectrophotometry methods for the estimation of diazepam in presence of Tween-20 and propylene glycol. AAPS PharmSciTech. 2009; 10: 1396-1400.
19. Walash MI, Rizk MS, Sheribah ZA, Salim MM. Derivative spectrophotometric analysis of benzophenone (as an impurity) in phenytoin. Chem Cent J. 2011; 5: 85.
20. ICH Harmonized Tripartite Guideline. Validation of Analytical Procedures: Text and Methodology, Q2 (R1), Current Step 4 Version, Parent Guidelines on Methodology 1996, Incorporated in 2005.
21. Sanford B. Pharmaceutical Statistics, Practical and clinical Applications. 3rd edn. Marcel Dekkers Inc. 2003; 80: 216- 263.
22. Bachhav YG, Patravale VB. SMEDDS of glyburide: formulation, in vitro evaluation, and stability studies. AAPS PharmSciTech. 2009; 10: 482-487.
Citation: Khutle Nilesh M, Pawar Harshal A and Vijaya C. “Zero-Crossing” First-order Derivative Spectroscopy Method for Analysis of Sertraline Hydrochloride in Novel Self Micro Emulsifying Drug Delivery System. Austin J Anal Pharm Chem. 2014;1(3): 1013.
Austin J Anal Pharm Chem - Volume 1 Issue 3 - 2014ISSN : 2381-8913 | www.austinpublishinggroup.comHarshal et al. © All rights are reserved


![Austin Journal of Analytical and Austin Publishing …d.researchbib.com/f/cnLKImqTyhpUIvoTymnTyhM2qlo3IjYzAioF...evaluating oxidative stability, but nowadays it is still used [17,18]](https://img.dokumen.tips/doc/110x75/5f76297827f98c268253a84c/austin-journal-of-analytical-and-austin-publishing-d-evaluating-oxidative-stability.jpg)


![Austin Journal of Analytical and A Austin Publishing Group...exchange of the extraction of polar organic analyses from bio fluids [5]. Alternatively, there are several approaches to](https://img.dokumen.tips/doc/110x75/5f49a2382fe2eb452b3315f7/austin-journal-of-analytical-and-a-austin-publishing-group-exchange-of-the-extraction.jpg)