Embed Size (px)
Citation preview

ON THE ABILITY OF PROTECTIVE HEADGEAR TO ALTER SKULL AND BRAIN
KINETICS DURING BLAST AND IMPACT: AN EXPERIMENTAL STUDY USING A
SURROGATE MODEL OF THE HUMAN HEAD WITH NOVEL INSTRUMENTATION
by
Austin David Azar
A thesis submitted in partial fulfillment of the requirements for the degree of
Master of Science
DEPARTMENT OF MECHANICAL ENGINEERING
University of Alberta
© Austin David Azar, 2019

ii
Abstract
Blast-induced traumatic brain injury (bTBI) has become increasingly prevalent among
military personnel over recent years. Head protection is fielded to mitigate the amount of
energy imparted to head, as a result of ballistic and impact exposure. Despite the efficacy of
contemporary headgear in protecting the wearer from ballistic and impact threats, rates of bTBI
have been continuing to rise. Limited biomechanical literature exists to determine whether or
not modern military head protection is able to alter the transmission of blast energy into the
head and brain. Using a simulant-based surrogate model of the human head, equipped with a
novel array of instrumentation, this thesis aims to investigate the effect of protective headgear
on the transmission of energy into the head and brain during blast and impact experiments.
The development and validation of an in-fibre Bragg grating (FBG) transducer for
measuring kinetics on the inner skull table are first presented. The developed FBG force
transducer contains a multi-layered composite superstructure (6 mm nominal diameter) and
demonstrates linearity and repeatability under both dynamic impact-response calibrations and
blast-loading conditions. Spectral analysis indicates that the presented transducer captures
transient kinetics of blast overpressure with an average of 0.12% difference in normalized
Fourier amplitudes captured by the FBG and validated reference piezo-electric transducer.
Time-domain analysis indicates that the FBG force transducer is repeatable with maximum
coefficient of variance for repeated measures at 7.9% whereas the validated reference
transducer coefficient of variance is 9.1% (maximum), based on the normalized blast exposure
data. The novel force transducer is the first application of FBG technology to measure inner
skull kinetics under blast loading and can be used to evaluate the mechanisms of energy
transfer into the head during blast exposure.
The newly developed transducers were then integrated into a biofidelic simulant-based
surrogate model of the head and used to assess whether or not helmets and eye protection can
alter mechanical measures during both blast and impact loading scenarios. Free-field blast
simulations at an outdoor test range (DRDC Valcartier) were conducted to create realistic blast
exposure on the head surrogate using various protection scenarios. Impact loading on the
headform was created in a laboratory setting, using a linear monorail drop tower, for the cases
iii
with a bare headform and for cases wearing a combat helmet. Specifically, inner skull forces
and pressure within the brain parenchyma were investigated for the various blast and impact
loading conditions and protection scenarios. Results suggest that adding head protection can
attenuate the measured kinetics relative to the case when the surrogate model is unprotected,
in both blast and impact. Measurements also demonstrate a propensity towards more spectral
content at lower frequencies, relative to an unprotected head, for measurements nearest to the
site of loading. Overall, adding head protection was found to attenuate pressure in the brain
parenchyma by as much as 49% during blast and 53% during impact, and forces on the inner
table of the skull by as much as 80% during blast and 84% during impact, relative to an
unprotected head.
In summary, this work presents a developed transducer that is a repeatable tool with the
capacity to assess inner skull kinetics during blast and impact events and therefore can be
applied towards the assessment of relative headgear protection efficacy. A simulant-based
surrogate headform, with integrated instrumentation, documents the mitigation of internal
kinetics and shift of frequency content with the addition of protective headgear. These results
are an important contribution to documenting how the skull and brain react during blast and
impact loading when the head is protected relative to when the head is unprotected.

iv
Preface
This work was financially supported by the US Department of Defence ITC Program
(Contract #W911NF-16-0083), with in-kind support from Defence Research and Development
Canada Collaborative Agreement (#SRE 16-023).
This research was sponsored by the Army Research Laboratory and was accomplished
under Cooperative Agreement Number W911NF-16-2-0083. The views and conclusions
contained in this document are those of the authors and should not be interpreted as
representing the official policies, either expressed or implied, of the Army Research
Laboratory or the U.S. Government. The U.S. Government is authorized to reproduce and
distribute reprints for Government purposes notwithstanding any copyright notation herein.
This thesis expresses content of the primary author and does not necessarily reflect
opinions of ARL or DRDC.

v
Acknowledgements
I would first like to recognize my supervisor Dr. Christopher Dennison for the
unwavering support and guidance throughout my experience as a graduate student. He
continually offered excellent feedback and discussions during the development of this thesis.
I am undoubtedly a better researcher from having worked with him, and I cannot thank him
enough for all his efforts.
I would like to thank Dr. James Hogan for providing thoughtful evaluations and feedback
of the work presented in this thesis and published in literature.
I would also like to thank several researchers at Army Research Laboratory (ARL) and
Defence Research and Development Canada (DRDC). Sikhanda Satapathy from ARL
provided insightful feedback and considerations throughout monthly teleconferences. Tyson
Josey and Thomas Sawyer from DRDC Suffield and Simon Ouellet from DRDC Valcartier
offered tremendous experimental support and contributed heavily towards my professional
development.
Finally, I would like to thank all the members of the Biomedical Instrumentation Lab for
creating such a fantastic and positive work environment. From solving challenging problems
together one moment, to sharing tea and homemade ice cream the next. You are all awesome
and I wish each of you the very best!

vi
Table of Contents
Chapter 1: Introduction ......................................................................................................... 1
1.1 Motivation .................................................................................................................. 1
1.2 Thesis Objectives ....................................................................................................... 2
1.3 Thesis Organization.................................................................................................... 2
Chapter 2: Background ......................................................................................................... 3
2.1 Blast Physics .............................................................................................................. 3
2.2 Classifications of Blast Injury .................................................................................... 5
2.3 Traumatic Brain Injury (TBI) ..................................................................................... 6
2.4 Blast TBI .................................................................................................................... 7
2.5 Blast Surrogate Models .............................................................................................. 9
2.6 Head Protective Devices .......................................................................................... 11
2.7 FBG Technology and Applications Towards Biomechanics ................................... 12
Chapter 3: An optical fibre transducer for measuring kinetics of skull-brain interaction in a
surrogate model of the human head subjected to blast overpressure ...................................... 14
3.1 Introduction .............................................................................................................. 14
3.2 Background .............................................................................................................. 14
3.3 Methods .................................................................................................................... 17
3.3.1 BIPED Geometry and Instrumentation ............................................................. 17
3.3.2 Force Transducer Design and Optical Instrumentation .................................... 19
3.3.3 Finite Element Modelling ................................................................................. 21
3.3.4 Calibration Experiments ................................................................................... 23
3.3.5 Impact-Response Calibration ............................................................................ 23
3.3.6 Blast Exposure Simulation ................................................................................ 25
3.3.7 Free-Field Blast Experiment ............................................................................. 27

vii
3.3.8 Statistics ............................................................................................................ 28
3.4 Results ...................................................................................................................... 28
3.4.1 Numerical Prediction of Mechanical Resonance .............................................. 28
3.4.2 Dynamic Calibration Results ............................................................................ 29
3.4.3 Blast Simulation Results ................................................................................... 33
3.4.4 Free-Field Blast Experiment Results ................................................................ 34
3.5 Discussion ................................................................................................................ 36
3.6 Conclusions .............................................................................................................. 41
Chapter 4: Protective headgear attenuates forces on the inner table and pressure in the brain
parenchyma during blast and impact: an experimental study using a simulant-based surrogate
model of the human head. ....................................................................................................... 42
4.1 Introduction .............................................................................................................. 42
4.2 Background .............................................................................................................. 42
4.3 Methods .................................................................................................................... 46
4.3.1 Surrogate Headform and Instrumentation ......................................................... 46
4.3.2 Blast Exposure .................................................................................................. 49
4.3.3 Impact Loading ................................................................................................. 52
4.3.4 Signal Conditioning and Time Synchronization ............................................... 53
4.3.5 Statistics ............................................................................................................ 54
4.4 Results ...................................................................................................................... 55
4.4.1 Blast Exposure .................................................................................................. 55
4.4.2 Impact Loading ................................................................................................. 64
4.5 Discussion ................................................................................................................ 72
Chapter 5: Conclusions ....................................................................................................... 78
5.1 Contributions ............................................................................................................ 78

viii
5.2 Future Work and Recommendations ........................................................................ 79
References ............................................................................................................................... 80

ix
List of Tables
Table 1: Sensitivity, predicted Standard Deviation in sensitivity, and COV (standard deviation
divided by sensitivity) for three sets of FBG transducer dynamic calibration experiments (n =
3 for each). Permissions for reproduction of this table were granted by IEEE. ..................... 32
Table 2: Comparison of normalized accelerometer and FBG transducer fourier amplitudes
from the dynamic calibrations of three transducers (n = 3 for each). Permissions for
reproduction of this table were granted by IEEE. ................................................................... 32
Table 3: Driver overpressures and corresponding sensor peak measurements during ABS
experiments. Permissions for reproduction of this table were granted by IEEE. ................... 35
Table 4: Spectral comparison of normalized reference pressure transducer and normalized FBG
force transducer amplitudes. Permissions for reproduction of this table were granted by IEEE.
................................................................................................................................................. 36
Table 5: Test conditions of the free-field blast experiments ................................................... 52
Table 6: Test matrix for laboratory impact experiments ........................................................ 53
Table 7: Peak pressures measured with external transducers on BIPED, for incident blast and
ground reflected waves. Means are tabulated for each of the different protection scenarios. 57
Table 8: Maximum and minimum magnitudes in the ICP data for each trial, with means for
each scenario. .......................................................................................................................... 60
Table 9: Maximum and minimum magnitudes in the force signals for each trial, with means
for each scenario. Greyed cells containing no values are assigned to results lacking a
continuous signal, in which excessive bending occurred in the optical fibre for these trials.
When excessive bending occurs, an optical fibre cannot transmit a signal adequately for
interrogation, and thus a discontinuity appears in the data until the bending is alleviated. .... 60
Table 10: Low speed impact data: peak ICP and force measurements from unprotected
(Scenario #1) and protected (Scenario #2) trials. Trials lacking force data due to bending losses
in the optical fibres are highlighted in grey. Means, standard deviations, and coefficients of
variation are reported in bold text for both Scenario #1 and Scenario #2. ............................. 67

x
Table 11: Medium speed impact data: peak ICP and force from unprotected (Scenario #1) and
protected (Scenario #2) trials. Means, standard deviations, and coefficients of variation are
reported in bold text for both Scenario #1 and Scenario #2. .................................................. 67
Table 12: High speed impact data: peak ICP and force from unprotected (Scenario #1) and
protected (Scenario #2) trials. Means, standard deviations, and coefficients of variation are
reported in bold text for both Scenario #1 and Scenario #2. .................................................. 68
List of Figures
Figure 1: An ideal theoretical blast wave (Friedlander waveform) with indications of the
positive and negative phases [28]. The dashed line indicates atmospheric pressure. Image used
with permission from Elsevier. ................................................................................................. 4
Figure 2: Classifications of injury from blast events [31]. Image used with permission from
Wolters Kluwer Health, Inc. ..................................................................................................... 5
Figure 3: From left to right - (a) Frontal view of the BIPED skull and scalp soft tissue layer.
(b) Side view of the BIPED skull. (c) Bottom view of the BIPED skull showing the 4-point
attachment location for the Hybrid III neck. (d) Top view of the BIPED skull with the skull
cap removed and the surrogate brain material exposed. Permissions for reproduction of this
figure were granted by IEEE. .................................................................................................. 19
Figure 4: (a) Transducer assembly and key dimensions, indicating the position of the FBG and
force transmission. (b) Schematic of the FBG force transducer located within the BIPED.
Permissions for reproduction of this figure were granted by IEEE. ....................................... 21
Figure 5: Finite element model boundary conditions and mesh (a coarse mesh is used here for
better visualization). Visual indicators are displayed on top of the solid model to indicate the
applied structural conditions. Permissions for reproduction of this figure were granted by
IEEE. ....................................................................................................................................... 22
Figure 6: Finite element model used to determine strain at the nominal FBG location. Visual
indicators are displayed on top of the solid model to indicate the applied structural conditions.
Permissions for reproduction of this figure were granted by IEEE. ....................................... 23
xi
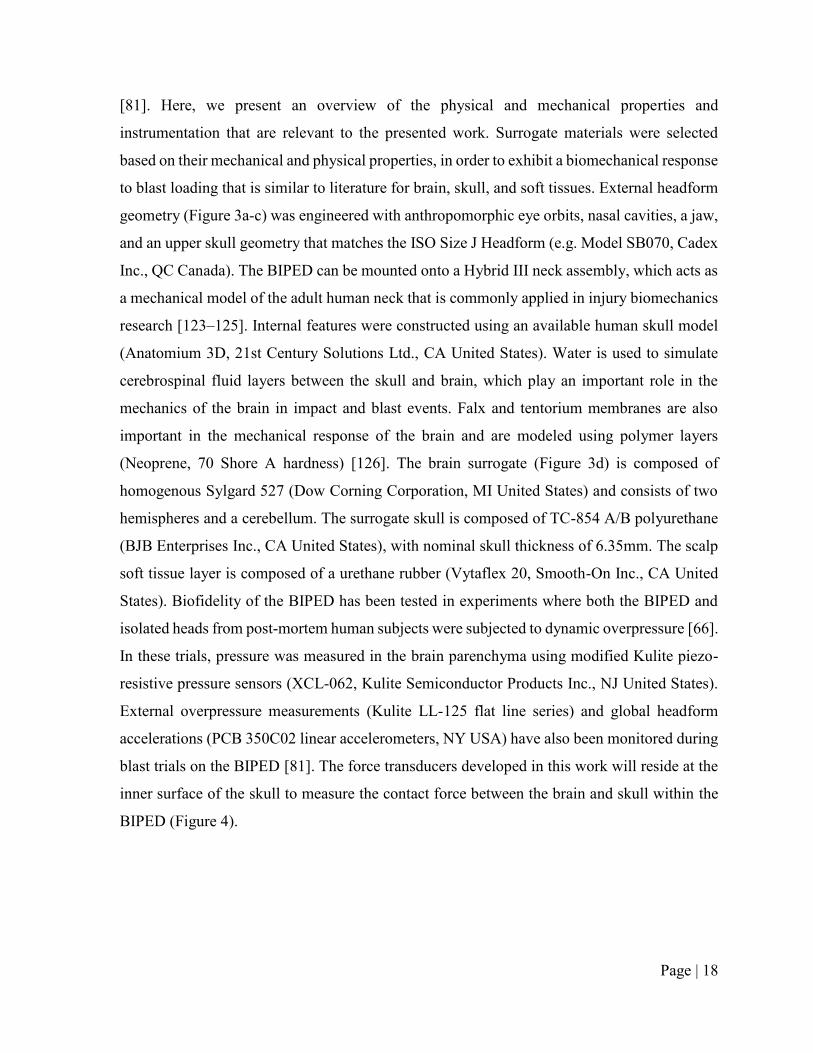
Figure 7: (a) Experimental set-up for an impact response dynamic calibration. (b) Schematic
of the drop tower and close-up of the transducer position. Permissions for reproduction of this
figure were granted by IEEE. .................................................................................................. 25
Figure 8: Schematic and photographs of the ABS, indicating the positions of the FBG
transducers and the reference transducer. Permissions for reproduction of this figure were
granted by IEEE. ..................................................................................................................... 26
Figure 9: Image of the BIPED with a cross-sectional planar view of the instrumentation
integrated within the headform. Permissions for reproduction of this figure were granted by
IEEE. ....................................................................................................................................... 27
Figure 10: Modal analysis result for the first mechanical resonance of the transducer and strain
optic predictions for transducer sensitivity. Permissions for reproduction of this figure were
granted by IEEE. ..................................................................................................................... 29
Figure 11: (a) Typical impact force applied to the FBG transducer plotted against time, and (b)
the corresponding impact-induced wavelength shift vs. time. Permissions for reproduction of
this figure were granted by IEEE. ........................................................................................... 30
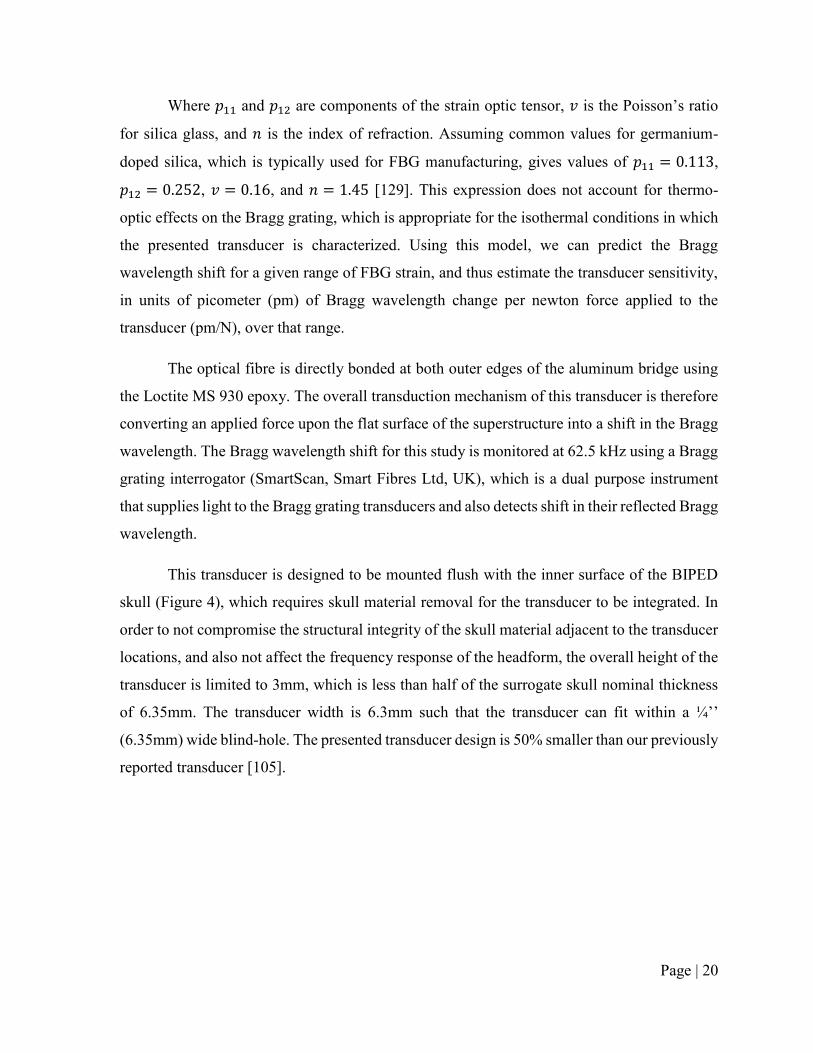
Figure 12: Sample calibration characteristics from three FBG transducers, showing their
sensitivities and coefficients of determination from a linear regression analysis. The strain optic
model prediction of 16.6 pm/N sensitivity is shown in the plot as well. Individual data points
are not visible at this scale because all data captured at 62.5 kHz is presented and the distance
between points at this rate is not discernable with the unaided eye. Permissions for reproduction
of this figure were granted by IEEE. ...................................................................................... 31
Figure 13: Frequency spectrum of accelerometer (force data) and FBG transducer (wavelength
data) from an impact response calibration experiment. Permissions for reproduction of this
figure were granted by IEEE. .................................................................................................. 31
Figure 14: Normalized amplitude vs. time from a sample ABS experiment for both the
reference pressure transducer and an FBG force transducer. Permissions for reproduction of
this figure were granted by IEEE. ........................................................................................... 33

xii
Figure 15: Spectral results from an ABS experiment, comparing the normalized output from
the reference pressure transducer and an FBG force transducer. Permissions for reproduction
of this figure were granted by IEEE. ...................................................................................... 33
Figure 16: FBG force and ICP measurements, along with FFT transforms, from a free-field
blast experiment using 5kg C4 at a 5m standoff. The presented data is for an un-helmeted (un-
protected) BIPED. Permissions for reproduction of this figure were granted by IEEE. ........ 34
Figure 17: (a) BIPED with the upper skull cap removed and surrogate brain exposed on the
left, with the surrogate scalp to the right. (b) Right to left side view X-ray image of the
instrumented BIPED showing front and back ICP and force transducer locations. (c) Front to
back view X-ray image of the instrumented BIPED showing side ICP and force transducer
locations. ................................................................................................................................. 47
Figure 18: (a) BIPED front view showing the transducer plane and front external transducer.
(b) BIPED side view showing the transducer plane and side external transducer. (c) Top view
of the transducer plane showing the instrumentation locations. ............................................. 48
Figure 19: (a) Unprotected BIPED. (b) Protected BIPED with TBH, showing the approximate
plane in which the transducers are located relative to the helmet rim. (c) Protected BIPED with
TBH and visor. ........................................................................................................................ 49
Figure 20: (a) Top-view schematic of the free-field blast experiment setup. (b) Free-field blast
experiment setup showing the suspending charge and mounted BIPED with a TBH helmet. 50
Figure 21: Blast test site showing the resulting fireball from a 5kg C4 detonation and BIPED
location during experiments. ................................................................................................... 51
Figure 22: Unhelmeted (left) and helmeted (right) BIPED headform fixed to a Hybrid III neck
and drop tower gimbal during an impact experiment. ............................................................ 52
Figure 23: Representative blast data for all transducer locations in an unprotected scenario
(Scenario #1, trial T4, shown at left) and a protected scenario (Scenario #3, trial T1, shown at
right). The top row contains external pressure measurements for each transducer location. The
middle row contains ICP measurements from each transducer location, along with the front
external pressure measurement for reference. The bottom row contains force measurements

xiii
from each transducer location, along with the front external pressure measurement for
reference. ................................................................................................................................. 56
Figure 24: ICP time series and FFT data from blast experiments for various protection
scenarios. External overpressure data for each location is also shown for trial #4 from scenario
#1. The top row shows front ICP data, the middle row shows side ICP data, and the bottom
row shows back ICP data. ....................................................................................................... 58
Figure 25: Force time series and FFT data from blast experiments for several protection
scenarios. The top row shows front force data, the middle row shows side force data, and the
bottom row shows back force data.......................................................................................... 59
Figure 26: Normalized cumulative FFT data for force and ICP measurements from blast
experiments. These figures are plotted up to 6000 Hz, the frequency at which the majority of
signals spectral content falls below. Data is normalized based on the accumulated frequency at
the Nyquist frequency (250 kHz for ICP and 20 kHz for force data). Therefore, the normalized
cumulative results do not reach a value of 1 until higher frequencies than what is shown. ... 61
Figure 27: Representative ICP impact measurements from a medium speed impact for an
unprotected scenario (left) and protected scenario (right), showing results from each transducer
location within the surrogate brain. ........................................................................................ 65
Figure 28: Representative force data from a medium speed impact, for an unprotected scenario
(left) and protected scenario (right), showing data from each transducer location. ............... 66
Figure 29: Unprotected vs. protected BIPED impact ICP data showing ICP versus time in the
first column, spectral content from an FFT transform in the second column, and normalized
cumulative pressure in the third column. The first row shows front transducer measurements,
the second row shows side transducer measurements, and the third row shows back transducer
measurements. ......................................................................................................................... 69
Figure 30: Unprotected and protected BIPED impact force data. Force versus time is shown in
the first column, spectral content from an FFT transform in the second column, and normalized
cumulative force in the third column. The first row shows front transducer measurements, the
second/third rows show side transducer measurements, and the fourth row shows back
transducer measurements. ....................................................................................................... 70

Page | 1
Chapter 1: Introduction
The issue of blast induced brain injury and the importance of studying energy transmission
into the head is described in this chapter, along with the objectives and organization of this
thesis.
1.1 Motivation
Traumatic brain injury (TBI) has an immense effect on the overall health of combat
veterans and civilian society, with long-term physical and psychological consequences. The
overall economic costs of TBIs, including medical expenses and lost productivity for all
society, have been estimated to be upward of $76 billion for the United States alone [1,2]. In
military demographics, rates of TBI have been rising during recent conflicts [3–7], with nearly
25% of US deployed soldiers to Afghanistan (Operation Enduring Freedom; OEF), and Iraq
(Operation Iraqi Freedom; OIF) exhibiting symptoms of TBI [8–10]. For soldiers on
deployment, blast exposure accounts for the vast majority of injuries sustained, with reports as
high as 80% of total injuries [11–14]. Additionally, it is estimated that over 50% of head
injuries that involve blast exposure are also attributable to blunt trauma [15]. This is because
blast events will often launch an individual or part of their body and can induce blunt impact
through collision with surrounding objects. The increased rates of blast-induced traumatic
brain injury (bTBI) is considered to be partially attributed to the increased use of explosive
devices in modern warfare, such as land mines, rocket propelled grenades (RPGs), and
improvised explosive devices (IEDs) [16]. Effective mitigation strategies could halt or reverse
the increasing rates of bTBI, but in order to accomplish this, a proper understanding of the
bTBI injury mechanisms must be known [14].
The desire to understand and effectively mitigate bTBI has led towards intense research
efforts on several possible injury mechanisms and evaluation methods for protective devices.
Combat helmets are fielded to protect the user from impact and ballistic threats and are
commonly considered to be effective at mitigating these threats [15,17–22]. Despite the
efficacy of contemporary head protection towards mitigating ballistic and impact threats, bTBI
rates continue to rise [14], and it appears to be unknown whether or not modern helmets are
effective at protecting against blast waves. Currently, there is limited literature that exists to

Page | 2
address this issue and determine whether head protection is capable of altering the transmission
of blast energy into the head and brain.
1.2 Thesis Objectives
The objectives of this thesis are twofold. The first objective is to design a force
transducer that integrates into the interior skull of a simulant-based surrogate headform such
that mechanical interactions between the simulant skull and brain can be detected. The second
objective of this thesis is to use the instrumented surrogate headform, equipped with pressure
transducers within the brain parenchyma along with novel force transducers on the inner skull
table, to ascertain whether or not protective headgear alters the transmission of blast and impact
energy into the brain.
1.3 Thesis Organization
This thesis begins with a brief overview of relevant theory and literature on blast waves
and traumatic brain injury. Following that, an outline of head models that have been used for
blast experiments is presented. An overview of head protection devices and how they are tested
is then discussed, proceeded by a summary of optical sensing technologies and their
applications towards biomechanics.
Chapter 3 documents the development and validation of an optical fibre force transducer
for measuring inner skull forces during blast and impact loading. The transducer presented in
this section is the first application of FBG technology towards the measurement of inner skull
kinetics during blast loading. This chapter is a re-formatted version of the manuscript that has
been accepted to the journal of IEEE Sensors and published on October 8, 2018 (© 2018 IEEE),
titled “An optical fibre transducer for measuring kinetics of skull-brain interaction in a
surrogate model of the human head subjected to blast overpressure.” The first author of this
manuscript is also the author of this thesis.
Chapter 4 documents the effect of contemporary protective headgear on the transmission
of energy into the head and brain of a simulant-based surrogate model during blast and impact.
The content in this chapter has been reformatted from a manuscript that is under preparation
Page | 3
for submission into the ASME Journal of Biomechanical Engineering. The first author of this
manuscript is also the author of this thesis.
Finally, the concluding chapter will summarize the contributions of this thesis as well as
provide suggestions for future work.
In reference to IEEE copyrighted material which is used with permission in this thesis, the
IEEE does not endorse any of University of Alberta's products or services. Internal or personal
use of this material is permitted. If interested in reprinting/republishing IEEE copyrighted
material for advertising or promotional purposes or for creating new collective works for resale
or redistribution, please go to the following link to learn how to obtain a License from
RightsLink:
http://www.ieee.org/publications_standards/publications/rights/rights_link.html
Chapter 2: Background
2.1 Blast Physics
An explosion occurs from the nearly instantaneous phase change of a solid or liquid into
gas form [23]. Immediately post-detonation, these converted gasses temporarily occupy the
same volume as the parent solid or liquid, resulting in extremely high pressures and rapid
expansion outwards in all directions away from the source. The ensuing compression of
surrounding air molecules, thereby forming what is known as the shock front, propagates away
from the point location of the detonation site [24]. The increase in pressure above atmospheric
conditions is commonly referred to as the blast overpressure.
Blast dynamics in close proximity to the detonation site is highly complex and may
involve two-dimensional wave motion, ballistics, and substantial thermal radiation effects
[14]. Further away from the detonation, blast physics are much more simplistic and
approximately one-dimensional. This far-field flow regime is often referred to as the “free-
field” region and is typically where most blast wave injury research is focused [14].
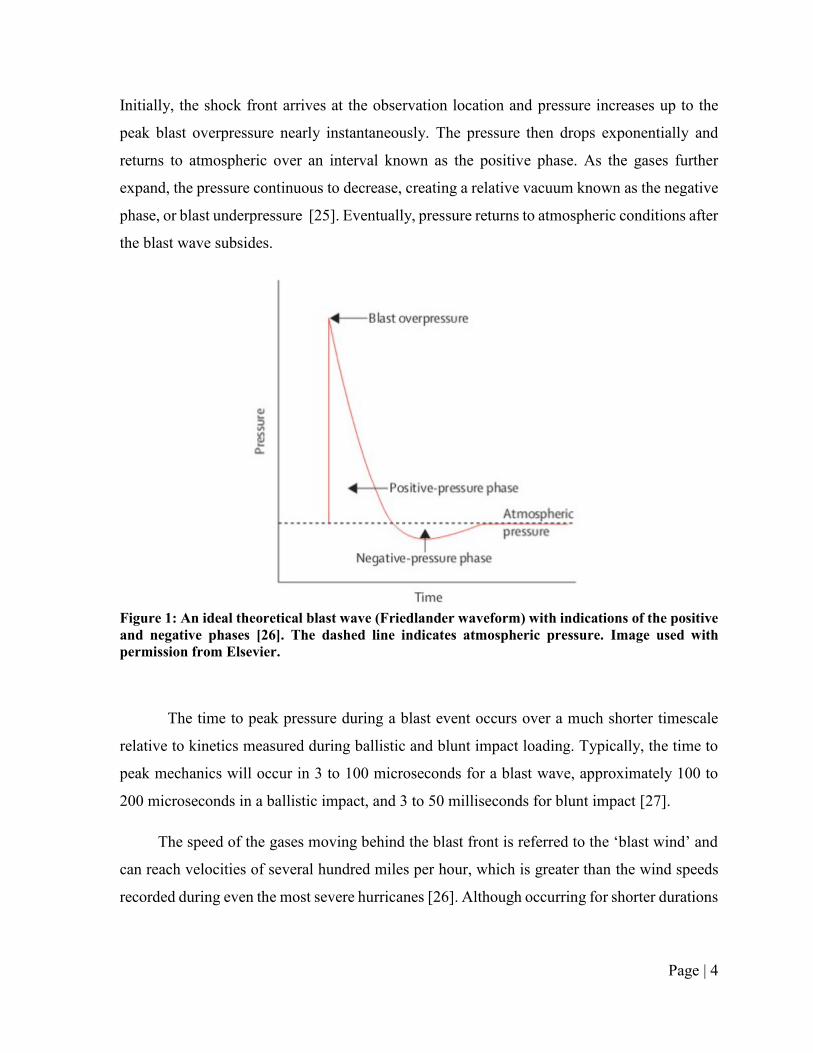
In free-field conditions, static overpressure can be estimated using the Friedlander
equation [14]. An ideal representation of the Friedlander waveform shown in Figure 1.
Page | 4
Initially, the shock front arrives at the observation location and pressure increases up to the
peak blast overpressure nearly instantaneously. The pressure then drops exponentially and
returns to atmospheric over an interval known as the positive phase. As the gases further
expand, the pressure continuous to decrease, creating a relative vacuum known as the negative
phase, or blast underpressure [25]. Eventually, pressure returns to atmospheric conditions after
the blast wave subsides.
Figure 1: An ideal theoretical blast wave (Friedlander waveform) with indications of the positive
and negative phases [26]. The dashed line indicates atmospheric pressure. Image used with
permission from Elsevier.
The time to peak pressure during a blast event occurs over a much shorter timescale
relative to kinetics measured during ballistic and blunt impact loading. Typically, the time to
peak mechanics will occur in 3 to 100 microseconds for a blast wave, approximately 100 to
200 microseconds in a ballistic impact, and 3 to 50 milliseconds for blunt impact [27].
The speed of the gases moving behind the blast front is referred to the ‘blast wind’ and
can reach velocities of several hundred miles per hour, which is greater than the wind speeds
recorded during even the most severe hurricanes [26]. Although occurring for shorter durations

Page | 5
than a sustained hurricane wind, a blast wind can still propel objects and individuals into the
air and induce a variety of injurious scenarios.
2.2 Classifications of Blast Injury
A blast event can result in many different types of injuries, which are broadly classified
into four categories [14,16,26,28,29] (Figure 2). Primary blast injuries are due to the blast wave
propagating through the body and damaging living tissue, also referred to as barotrauma [14].
These injuries typically affect organs containing gas or interfacing with air, such as the lungs,
ears, eyes, and gastrointestinal tract [16], but the effects of primary blast on the central nervous
system (CNS) remain unresolved. Secondary blast injuries occur when the explosion propels
shrapnel or other debris at the victim and inducing either blunt or penetrating trauma. Tertiary
blast injuries are due to displacement of an individual following a blast exposure, and the
subsequent impact of the victim into surrounding structures. These injuries typically occur for
individuals in close proximity to the detonation location, and can induce significant blunt
trauma [16]. Quaternary blast injuries are due to thermal radiation or chemical exposure from
the explosion, often manifesting as burns [14]. Typically, blast events are polytraumatic [16],
implying that multiple mechanisms will induce injury simultaneously, and often multiple of
the above-mentioned pathways do not occur in isolation on the battlefield.
Figure 2: Classifications of injury from blast events [30]. Image used with permission from
Wolters Kluwer Health, Inc.

Page | 6
2.3 Traumatic Brain Injury (TBI)
TBI affects the lives of millions of people around the world, with an estimated range of
occurrence between 60 to 720 cases per 100,000 individuals [31,32]. Brain injuries are
typically classified as either focal or diffuse, with focal injuries comprising damage to a
localized area and diffuse injuries involving damage over a large generalized area [33].
Diffuse axonal injury (DAI), contusion, and subdural hemorrhage are the most prevalent
forms of TBI [23], and have all been observed following a blast exposure [34]. DAI is a broad
term to describe the scattered disruption of white matter tracts within the brain [35,36]. DAI is
generally associated with the shearing, elongation, or bending of axons within brain matter that
can result in impaired neuronal transport from focal axonal swelling and may result in axonal
disconnection [35]. DAI typically manifests in the internal capsule, deep gray matter, upper
brainstem, cordicomedullary junction, and the corpus callosum [36]. Cerebral contusion is the
bruising of brain tissue, and is associated with microhemorrhages of blood vessels and edema
within the brain parenchyma [24]. Contusions often occur in the cortical tissue, typically within
the superficial gray matter of the inferior, lateral, and anterior aspects of the temporal and
frontal lobes [23]. Subdural hemorrhage, or hematoma, manifests when the brain moves within
the skull to an extent that ruptures bridging veins which connect the brain to the encapsulating
dura mater [23,37]. This injury most commonly occurs for the frontal and parietal convexities
[23].
For blast exposure, it is commonly assumed that elevated levels of internal mechanics
such as intracranial pressure (ICP) will lead towards symptoms of TBI [14,38–42], however
the exact thresholds or injury risks have not yet been determined for humans.

Page | 7
2.4 Blast TBI
Blasts are the most common cause of injury during modern conflicts, with reports as high
as 80% of total sustained injuries [11,12,14,43]. The Walter Reed Army Medical Center
(WRAMC) reported that out of all the individuals that sustained injuries during the Iraq and
Afghanistan wars, 28% of them had a TBI [44]. Because of the polytraumatic nature of blast
events, it is difficult to clinically define which forms of blast injuries are most prevalent when
considering TBI [14]. Often during research, the effects of primary blast are investigated in
isolation from other forms of injury such as blunt or penetrating trauma, but it is important to
note that real blast events are likely to trigger multiple mechanisms. For example, it has been
estimated that 50 to 60 percent of head injuries that involve blast exposure were also
attributable to low-rate blunt trauma [27]. This section describes various mechanisms of bTBI
that have been proposed in current literature with a specific focus on primary, secondary, and
tertiary blast effects.
The effects of primary blast on the brain have been challenging to define and remain yet
to be fully understood [14,45]. Current theories of primary bTBI mechanisms include
transosteal wave propagation, skull orifice transmission, skull flexure dynamics, thoracic
surge, and cavitation [14]. A blast wave could transmit directly into the brain through the skull
by way of transosteal wave propagation [46–48], also known as the “direct cranial transmission
theory,” however, it is a theoretically unlikely mechanism due to the acoustic impedances of
the cranium and surrounding tissue [14]. Acoustic impedance is defined as the product of
density and speed of sound within a material, and a blast wave can only transmit effectively at
an interface when two materials have similar acoustic impedances, otherwise the majority of
the wave will be reflected. It has been demonstrated that due to the high acoustic impedance
discrepancies within the human head, less than 0.001% of the blast wave would transmit
through the scalp, skull, and cerebrospinal fluid (CSF) and into the brain [14]. A blast wave
could also disrupt brain tissue by propagating through skull orifices such as nasal sinuses [49],
auditory canals [50,51], and/or eye orbits [52–55]. Sensory organs located at these orifices are
frequently injured during blast exposure [24], however a blast wave may not be able to transmit
effectively into the brain through these orifices since blast waves are very sensitive to large
reductions in area [14]. Even if transmission through skull orifices does not induce brain

Page | 8
damage directly, it could lead towards indirect brain injuries through focal injuries at the
orifice. For example, disruption of cranial nerves in close proximity to the eye orbits could
induce secondary brain injury effects such as neurodegeneration in the occipital visual cortex
[14]. It has also been hypothesized that modes of skull flexure can be excited under blast
loading [56–58], which results in elevated pressure within the cranial vault [14,59]. The blast
wave travels faster through the skull relative to other human tissues, resulting in a complex
strain profile surrounding the brain [14]. This mechanism could manifest as diffuse brain injury
patterns [60], which has been documented in several rodent models [61–64]. This theory is
supported by high-frequency oscillations in ICP that has been observed during animal [57],
cadaver [65,66], and computational finite element models [58,67]. A blast wave could also
propagate indirectly into the brain through vulnerable cavities in the thorax and abdomen
region [14]. This theory, referred to as “thoracic surge,” speculates that the rapid compression
of organs within the thorax and abdomen following blast exposure can create a shock front that
propagates towards the brain through soft tissue and vascular mediums [68–70]. This theory is
supported by significant increases in pressure within the internal carotid artery following a
thoracic blast exposure [71]. It is important to note that thoracic and abdominal injuries on the
battlefield have become much less prevalent in recent conflicts due to advancements in body
armor [72–74], which would also contribute towards reductions in the prevalence of the
thoracic surge mechanism. Cavitation is another primary bTBI theory which postulates that
regions of negative pressure within the cranial vault could yield the formation of cavitation
bubbles [14]. These bubbles may damage surrounding brain tissue when they collapse [14,75].
Studies using surrogate and PMHS models found negative ICP responses following blast
exposure [65,75], however further work is required to prove whether or not negative ICP
actually causes cavitation. A study using an ellipsoid brain model with a transparent
polycarbonate skull imaged cavitation bubbles under blast loading with ICP signals around
150 kPa underpressure [75], but this has not been fully demonstrated for biological tissue.
Understanding which bTBI mechanisms are most prevalent during a blast event, and
how their prevalence may vary based on the blast loading scenario [76], can help direct the
development of future protective combat headgear and ultimately mitigate the occurrence of
bTBI.

Page | 9
2.5 Blast Surrogate Models
Surrogate models are an engineering method to provide robust and repeatable
approximations to complex problems that cannot be easily examined directly. In biomechanics
research, a surrogate model attempts to approximate key anatomy, in terms of shape,
dimensions, and mechanical properties of human tissue, in an effort to achieve a model with a
mechanical response that is similar to a human. Robustness is an important quality for a
surrogate model, which requires that the model’s integrity will not degrade after use which
would effect future measurements. Repeatability is another important quality of a surrogate
model such that repeated measurements can be expected to be similar and very high sample
sizes and resources are not required when using the model. If measured mechanics within a
validated model can be linked to injury, then such models can be useful in estimating the
mitigation in injury risk via protective gear.
Blast headforms are surrogate models of the human head, designed to study the effect of
blast exposure to the head and to evaluate the efficacy of protective headgear under blast
loading. In order to have a biofidelic response to blast, it is necessary to effectively and
accurately model the aspects and regions of the human head that influence blast wave
transmission [16]. Material selection and geometry are important factors in developing a
surrogate model with a biofedelic response to blast [16]. Several headforms have been
employed for the assessment of blast loading and are briefly outlined in this chapter.
The Hybrid III is an anthropomorphic test device (ATD) developed in 1973 for use in
the automotive industry, and has been used in blast experiments [16]. The headform comprises
an aluminum skull and an external vinyl rubber for skin. The Hybrid III is very durable,
however, it lacks appropriate biofidelity towards blast due to the lack of important internal
features/materials and the wavespeed within aluminum is far greater than a human skull.
The Manikin for Assessing Blast Incapacitation and Lethality (MABIL) was designed
by at Defence Research and Development Canada (DRDC) Valcartier to evaluate personal
protective devices under blast loading [16]. MABIL comprises a solid urethane head, with
facial features based on the Canadian Standards Association’s (CSA) headform
anthropometry. MABIL was instrumented with a pressure transducer in the ear canal and

Page | 10
another in the eye, along with a photodiode in the eye to measure light intensity during a blast
event [16].
The Dynamic Event Response Analysis Man (DERAMan) headform was developed by
Britain’s Defence Evaluation and Research Agency [16], and was designed to suffer car
crashes, sports collisions, and automotive seat ejections [77]. The DERAMan is made with a
polyurethane outer skin, a skull (hard plastic – undisclosed composition) and a soft gelatinous
brain (undisclosed composition). The headform is instrumented with 40 piezoelectric pressure
transducers within the brain, 45 piezoelectric pressure transducers on the inner surface of the
skull, two accelerometers, and one three-dimensional force gauge. The DERAMan has
reportedly been used for blast experiments but results have not been published [16,77].
Johns Hopkins University (JHU) developed a human surrogate head model (HSHM)
based on a finite element model of the human head [78]. The skull of this head model is
composed of a glass/epoxy composite and the brain is made from Sylgard gel. The JHU HSHM
has been instrumented with two pressure transducers and four displacement transducers, all
within the surrogate brain material, and has been subjected to blast overpressure within a shock
tube [78].
The Warrior Injury Assement Manikin (WIAMan) blast manikin was developed for
studying underbody blasts to improve military vehicle design [79], however it lacks any
approximation of the brain and inner skull anatomy.
The Realistic Explosive Dummy Head (REDHead) was developed at the University of
Nebraska using various surrogate materials for the skin, skull, and brain [77]. The final version
consisted of a polydimethylsiloxane (PDMS) skin and a polyurethane skull assembly, with an
opening for the brain and CSF [80]. Water was used to model the CSF, and a silicone gel was
used for the surrogate brain. The headform was instrumented with polyvinylidene fluoride
(PVDF) piezoelectric pressure transducers within the brain and on the outer surface of the
skull, strain gauges (Vishay MR1-350-130) on the outer surface of the skull, a micro electro-
mechanical systems (MEMS) accelerometer (unreported location), and a fibre optic pressure
transducer within the surrogate brain.

Page | 11
The Blast Injury Protection Evaluation Device (BIPED) is a simulant-based surrogate
model of the human head, fully developed by researchers at DRDC Valcartier [81]. The BIPED
comprises surrogate skin, skull, falx and tentorium membranes, a brain, and CSF. The
surrogate skin is composed of a tough urethane rubber with facial features based on the CSA
headform anthropometry [82]. The skull, nominally 6.35 mm thick, is made from polyurethane
with internal features based on an available CAD model [83]. Falx and tentorium membranes
are composed of neoprene sheets (70 Shore A hardness). The surrogate brain is made from a
silicone gel (Sylgard 527, Dow Corning) and CSF is modelled as saline solution. The BIPED
has been instrumented with pressure transducers within the brain and on the outer surface of
the headform and used during free-field blast experiments [81]. The BIPED has also been
directly compared to post mortem human subjects (PMHS) within a shock tube and results
suggests similar responses in terms of ICP both in magnitude and frequency [66].
2.6 Head Protective Devices
Helmets are commonly attributed as being the primary protection device for the head. In
the military, combat helmets have been shown to be effective at protecting the wearer from
impact and ballistic threats [15,17,84–89]. Originally, combat helmets comprised a formed
steel bowl with a web-based suspension system [90] and were widely employed during World
War I. Today, modern combat helmets involve the use of light-weight and high strength fibrous
materials, such as Kevlar 129 or Twaron [90], with a phenolic resin, along with an elastomeric
foam suspension system.
Helmets for both sport and military purposes are all designed to protect the wearer from
relevant environmental threats, while constrained to being sufficiently lightweight and
ergonomic in order to not inhibit performance or morale. During ballistic and blunt impact,
helmets are designed to mitigate the energy imparted to the head and reductions in energy
transmission to the underlying head is generally associated with reduced risk of head injury.
The outer shell of the helmet protects the head from focal damage through deformation of the
shell material and redistribution of the loading over a larger area. The inner liner of the helmet
further attenuates the re-distributed energy transmitted from the shell and provides an

Page | 12
ergonomic interface for the user. For sport helmet certifications, which focus on protecting the
wearer from blunt impact, helmets are traditionally evaluated by their ability to attenuate linear
head acceleration below a threshold value [91–93]. Modern combat helmets are tested by their
ability to mitigate ballistic penetration and behind-helmet blunt trauma (BHBT), as well by
their ability to withstand other environmental stressors such as exposure to temperature
extremes [14]. The mitigation of mechanics under blast loading is lesser documented compared
to ballistic and impact loading.
In combat scenarios, no existing protective headgear is able to completely protect the
wearer against all the potential threats that can exist on the battlefield [58]. Combat helmet
certifications do not currently have a paradigm for directly mitigating bTBI, yet it is commonly
assumed that protecting the wearer against other threats, such as ballistics, will also provide
protection from blast. With the current state of biomechanics research, the extent of validity
for that assumption remains unknown. However, despite the efficacy of modern combat
helmets in mitigating injury from ballistic threats and impacts, bTBI rates continue to rise [65],
and it appears to be an open-ended question whether or not modern combat helmets are
effective at protecting military personnel from blast waves.
2.7 FBG Technology and Applications Towards Biomechanics
Fibre Bragg gratings (FBGs) have become increasing popular in recent years for sensing
applications within the field of biomechanics [94], in addition to a wide range of other
applications [95]. FBGs offer attractive advantages such as biocompatibility, small size, light
weight, chemical inertness, immunity to electromagnetic interference, and capacity for
multiplexing [94,96].
Fibre-optic sensors operate by modulating properties of light, such as intensity, phase,
polarization, and frequency, in response to specific environmental stimuli. Optical fibres
consist of a core, cladding, and will often also have a buffer coating and protective jacketing.
The core is a very thin strand of glass where signals in the form of light are transmitted through.
The cladding surrounds the core and is composed of a higher refractive index material than the
core. This mismatch of refractive indices causes light to reflect back internally within the core

Page | 13
and allows for transmission of light with minimal losses. This phenomenon is known as total
internal reflection. An outer coating and other protective layers are often employed to guard
the optical fibre from any harsh external conditions.
FBGs are the most widely employed type of optic fibre sensing technology, and are
particularly common among the research community [97]. Other forms of optical sensing
technology include interferometry, scattering, faraday rotation, luminescence, blackbody, fibre
optic gyroscope (FOG), among others [97]. FBG technology was discovered accidentally in
1978 at the Canadian Research Center in Ottawa [98]. Just over a decade later, improved
fabrication methods for the gratings were developed [99], allowing for more intensive research
to follow. Many forms of gratings exist (uniform, long-period, chirped, tilted, sampled [97]),
however FBGs all operate based on the common principle of reflecting specific wavelengths
of forward propagating light from the source to a backwards propagating mode through the
core and sometimes through the cladding. The reflected spectrum of the backwards
propagating light can be interpreted using a form of wavelength interrogation or demodulation
technology. The peak of the reflected spectrum is known as the Bragg wavelength, λB.
For uniform FBGs, the grating period Λ, or the distance between similar edges of one
grating to another, is constant and the reflected light is transmitted back through the core of
the fibre. The reflected Bragg wavelength changes as a function of the grating period Λ and
the effective refractive index of the core, neff, as follows [97]:
𝐵 = 2n𝑒𝑓𝑓Λ (i)
FBGs are useful for sensing applications because when the gratings are subjected to strain
or temperature, the grating period will change, resulting in a shift in the Bragg wavelength
based on the above equation. Multiple sets of Bragg gratings can be fabricated within a single
optical fibre, each with a distinct Bragg wavelength, allowing for distributed measurements
along the length of a fibre. Transducers based on FBG technology have been developed and
employed to measure a wide variety of physical parameters such as strain [100,101],
temperature [102,103], pressure [104], force [105,106], and refractive index [107].

Page | 14
Chapter 3: An optical fibre transducer for measuring kinetics of skull-brain
interaction in a surrogate model of the human head subjected to blast
overpressure
The following manuscript has been accepted to the journal of IEEE Sensors and published
on October 8, 2018 (© 2018 IEEE). The first author of this manuscript is also the author of
this thesis.
3.1 Introduction
Before measurement of skull kinetics during blast can be achieved, a novel transducer
needs to be developed and integrated into the BIPED. This chapter describes the development,
calibration, and validation of the optical fibre force transducer for blast and impact
measurements, along with the integration of the transducer into the BIPED. This transducer is
the first application of FBG technology towards the measurement of inner skull kinetics under
blast loading, and can be used for evaluating the mechanisms of energy transfer into the head.
3.2 Background
Mild traumatic brain injury (mTBI) has become increasingly prevalent among personnel
in the armed forces over recent years [3,108–110]. This has been partially attributed to the
increased use of explosive devices in modern warfare [16], including devices such as land
mines, rocket propelled grenades (RPGs), and improvised explosive devices (IEDs). While the
mechanisms of injury are not universally agreed upon, exposure to these devices can lead to
injury through: (1) an overpressure wave that couples energy into the torso and head; (2) high
velocity projectiles and fragments that can cause severe penetrating injury; and (3)
displacement of the head and torso by overpressure, leading to acceleration/deceleration
injuries and possibly blunt impact, which can cause both focal and diffuse tissue damage. The
underlying mechanisms of these three exposures, in particular exposure to blast overpressure,
that lead to brain injury are as yet not completely understood despite the wealth of clinical and
pre-clinical research that is available [23,111,112]. The fact that underlying injury mechanisms
are not completely characterized is potentially worrisome because statistics indicate rates of
mTBI are elevated in warfighters and could be increasing [108]. A retrospective study from
1997 to 2007 looking at mild traumatic brain injury (mTBI) in US warfighters indicated 98,012

Page | 15
mTBI injuries over the decade with an average increase of 8.5% per year [108]. Prevention
strategies could halt or reverse the increasing trend, but to prevent an injury the mechanisms
must be understood.
The desire to understand and ultimately prevent blast-induced brain injury has led to
intense research efforts focusing on both injury mechanisms and protection devices. It is
generally accepted that the mechanism of injury comprises both mechanical and biological
factors. Specific to mechanical factors, it has been hypothesized that overpressures can couple
energy into the brain and through various mechanisms result in tissue damage [16]. This
coupling could lead to elevated pressure in cerebrospinal fluid spaces and stress in brain tissue,
both of which could be relevant in brain injury. This hypothesis has led to biomechanical
studies using animals and post-mortem human subjects, both of which have confirmed that
exposure to blast can significantly elevate pressure and stress in the anatomy of the brain
[113,114]. At the same time, research using small animal models has examined the role of blast
overpressure in the onset and long-term cascade of biological processes that characterize brain
injury. This research also suggests the mechanics of the overpressure are relevant in the onset
and progression of the complex biological processes of brain injury [11]-[12]. As a result of
this research, the mechanics of overpressure exposure and the stress that it can create in the
brain has been a focus for researchers attempting to develop repeatable models with which
protective headgear can be tested.
The majority of mechanical models used in assessing protection devices attempt to
recreate the mechanics of the human response to an injury event and, through instrumentation,
measure mechanics that quantify injury risk mitigation. A contemporary example of this
paradigm is mechanical models of the human head used in the assessment of sport helmets.
These head models recreate the physical size and mass of human heads and measure head
accelerations, which is thought to relate to risk of severe focal head injury (the injury that sport
helmets are credited with preventing [18,117–119]). Head models for blast include the
Dynamic Event Response Analysis Man (DERAMan) [16], Johns Hopkins Human Surrogate
Head Model (HSHM) [16], the Realistic Explosive Dummy Head (REDHead) [77,80], and the
Blast Injury Protection Evaluation Device (BIPED) [66,76]. Developed for military blast injury
investigations, the Warrior Injury Assessment Manikin (WIAMAN) lacks any approximation
Page | 16
of the brain and inner skull anatomy. Pioneered by Defence Research and Development
Canada (DRDC), MABIL was designed to measure only blast pressure at the mouth and ear
canal. The British contributed the DERAMan headform, but to-date there has been no data
released for this model. The Applied Physics Laboratory (APL) of Johns Hopkins University
developed an experimental head-brain model and a computer model designed to match
experiment measurements [78].
The BIPED, again designed by researchers at DRDC, comprises skin, skull, falx and
tentorium membranes, a simulant model of the brain, and a fluid layer between the skull and
brain. This model is designed to measure pressures on the head exterior and within the brain
parenchyma [66]. The BIPED also measures global head acceleration to allow quantification
of inertial loading of the head and brain. In this paper, we present research on the development
of an optical transducer system to measure interaction kinetics between the skull and brain
within the BIPED. These transducers quantify the transient forces that occur between the skull
and brain, which can lead to compression/tension in brain tissue. Skull interaction and resulting
compression of brain tissue is a known mechanism for brain injury [38,120–122] and therefore
it is desired that the BIPED have instrumentation capable of quantifying mitigation of this
mechanism.
This manuscript presents a transient force transducer for detecting contact force between
the BIPED simulant skull and brain. The transducer is built around an optical approach using
in-fibre Bragg grating (FBG) technology. Our research group previously reported on transient
force transducers designed specifically for characterizing forces applied on the head exterior
by protective sport helmets subjected to low speed blunt impact [105]. The work presented in
the current manuscript is an advancement of these previous efforts and builds upon our
previous work by developing a transducer that: is physically smaller than previous variants, is
amenable to being arrayed within the interior (not exterior) of head models within simulated
cerebrospinal fluid layers, and perhaps most importantly, is verified to be capable of resolving
force transients that occur over much shorter timescales (typical of blast) than blunt impact
force transducers that we have previously reported on utilizing FBG technology.
FBGs comprise a short segment of an optical fibre, typically 1mm to 10mm, in the core
of which a periodic modulation in refractive index is created. In single mode optical fibre,

Page | 17
coherent light travels through the core and when it encounters an FBG, a single-peaked
spectrum of light is reflected and propagates back towards the light source. This spectrum has
a center wavelength called the Bragg wavelength, B. The Bragg wavelength can be
predictably modulated when the fibre length corresponding to the FBG is exposed to, among
other parameters, mechanical strain and temperature. If the FBG is contained in a transducer
that can convert a given measurand (e.g. pressure, force, humidity) to strain, then B can be
used to indicate the magnitude of the given measurand. Knowledge of this transduction
approach and the fact that FBGs possess highly desirable characteristics including
biocompatibility, potentially high frequency response, immunity to harsh environments and
electromagnetic interference, along with the capacity to be multiplexed allowing spatially
distributed measurements, has led the authors and other researchers to apply FBGs in basic and
trauma biomechanics [94]. In the present work, we exploit extremely small size and
compatibility with liquid that is offered by optical fibre to develop a force transducer that is
small enough to be implanted into the inner table, in contact with fluid, of a physical model of
the human head.
The specific objective of this work is to design a transducer that integrates into the interior
skull of the BIPED such that mechanical interaction between a simulant skull and brain can be
detected as contact forces. Strain-optic and linear elastic numerical modeling is used to predict
transducer sensitivity and to examine the mechanical resonances of the transducer,
respectively. Calibration experiments that expose the transducer to impact force and blast
overpressure demonstrate that the transducer is capable of detecting mechanics over the range
of frequencies characteristic of dynamic blast overpressures. Finally, exemplar measurements
of skull-brain contact force from a single exposure of the BIPED to an incident blast wave are
presented to verify the FBG transducer functions in its proposed application (in-situ).
3.3 Methods
3.3.1 BIPED Geometry and Instrumentation
Developed by the Weapons Effects and Protection section of DRDC-Valcartier, the
BIPED is a reusable anthropomorphic model of the human head with several biofidelic
features. Mechanical and physical properties for the BIPED are presented in previous literature
Page | 18
[81]. Here, we present an overview of the physical and mechanical properties and
instrumentation that are relevant to the presented work. Surrogate materials were selected
based on their mechanical and physical properties, in order to exhibit a biomechanical response
to blast loading that is similar to literature for brain, skull, and soft tissues. External headform
geometry (Figure 3a-c) was engineered with anthropomorphic eye orbits, nasal cavities, a jaw,
and an upper skull geometry that matches the ISO Size J Headform (e.g. Model SB070, Cadex
Inc., QC Canada). The BIPED can be mounted onto a Hybrid III neck assembly, which acts as
a mechanical model of the adult human neck that is commonly applied in injury biomechanics
research [123–125]. Internal features were constructed using an available human skull model
(Anatomium 3D, 21st Century Solutions Ltd., CA United States). Water is used to simulate
cerebrospinal fluid layers between the skull and brain, which play an important role in the
mechanics of the brain in impact and blast events. Falx and tentorium membranes are also
important in the mechanical response of the brain and are modeled using polymer layers
(Neoprene, 70 Shore A hardness) [126]. The brain surrogate (Figure 3d) is composed of
homogenous Sylgard 527 (Dow Corning Corporation, MI United States) and consists of two
hemispheres and a cerebellum. The surrogate skull is composed of TC-854 A/B polyurethane
(BJB Enterprises Inc., CA United States), with nominal skull thickness of 6.35mm. The scalp
soft tissue layer is composed of a urethane rubber (Vytaflex 20, Smooth-On Inc., CA United
States). Biofidelity of the BIPED has been tested in experiments where both the BIPED and
isolated heads from post-mortem human subjects were subjected to dynamic overpressure [66].
In these trials, pressure was measured in the brain parenchyma using modified Kulite piezo-
resistive pressure sensors (XCL-062, Kulite Semiconductor Products Inc., NJ United States).
External overpressure measurements (Kulite LL-125 flat line series) and global headform
accelerations (PCB 350C02 linear accelerometers, NY USA) have also been monitored during
blast trials on the BIPED [81]. The force transducers developed in this work will reside at the
inner surface of the skull to measure the contact force between the brain and skull within the
BIPED (Figure 4).

Page | 19
Figure 3: From left to right - (a) Frontal view of the BIPED skull and scalp soft tissue layer. (b)
Side view of the BIPED skull. (c) Bottom view of the BIPED skull showing the 4-point attachment
location for the Hybrid III neck. (d) Top view of the BIPED skull with the skull cap removed and
the surrogate brain material exposed. Permissions for reproduction of this figure were granted
by IEEE.
3.3.2 Force Transducer Design and Optical Instrumentation
The optical force transducer is fabricated using an in-fibre Bragg grating (FBG)
embedded within a multi-layered superstructure (Figure 4) composed of aluminum (6061-T6
alloy) and an acrylic-based photopolymer (VeroGray RGD850, Stratasys Ltd., MN United
States). The upper and lower polymer layers are 1.15 mm and 0.85 mm thick, respectively,
while the aluminum layer is 1 mm thick. The fully assembled transducer superstructure has an
overall height of 3 mm and diameter of 6.3 mm. An industrial silane adhesive (Loctite MS 930,
Henkel AG & Co., Germany) is used to bond the aluminum and polymer layers together at
their points of contact. The present transducer design houses a 1550nm centered Bragg grating
(Technica Optical Components LLC., GA United States), with a full-width at half maximum
(FWHM) of 1.5nm, a grating length of 1mm, and a 60% nominal reflectivity.
Force applied to the transducer, as shown in Figure 4, is transmitted to the aluminum
layer, creating strain in the center beam. Positioning the optical fibre along the beam
component of the aluminum layer (Figure 4), with the active sensing region (i.e. the Bragg
grating) in the center of the beam, allows for force transmission to induce linear bending of the
aluminum beam and thus linear strain along the FBG. The peak shift of the Bragg wavelength,
ΔB, for a uniform FBG under longitudinal mechanical strain, ε, can be calculated as [127–
130]:
Δ𝐵 = 𝐵 {1 − (𝑛2
2) [𝑝12 − 𝑣(𝑝11 + 𝑝12)]} ε (1)
Page | 20
Where 𝑝11 and 𝑝12 are components of the strain optic tensor, 𝑣 is the Poisson’s ratio
for silica glass, and 𝑛 is the index of refraction. Assuming common values for germanium-
doped silica, which is typically used for FBG manufacturing, gives values of 𝑝11 = 0.113,
𝑝12 = 0.252, 𝑣 = 0.16, and 𝑛 = 1.45 [129]. This expression does not account for thermo-
optic effects on the Bragg grating, which is appropriate for the isothermal conditions in which
the presented transducer is characterized. Using this model, we can predict the Bragg
wavelength shift for a given range of FBG strain, and thus estimate the transducer sensitivity,
in units of picometer (pm) of Bragg wavelength change per newton force applied to the
transducer (pm/N), over that range.
The optical fibre is directly bonded at both outer edges of the aluminum bridge using
the Loctite MS 930 epoxy. The overall transduction mechanism of this transducer is therefore
converting an applied force upon the flat surface of the superstructure into a shift in the Bragg
wavelength. The Bragg wavelength shift for this study is monitored at 62.5 kHz using a Bragg
grating interrogator (SmartScan, Smart Fibres Ltd, UK), which is a dual purpose instrument
that supplies light to the Bragg grating transducers and also detects shift in their reflected Bragg
wavelength.
This transducer is designed to be mounted flush with the inner surface of the BIPED
skull (Figure 4), which requires skull material removal for the transducer to be integrated. In
order to not compromise the structural integrity of the skull material adjacent to the transducer
locations, and also not affect the frequency response of the headform, the overall height of the
transducer is limited to 3mm, which is less than half of the surrogate skull nominal thickness
of 6.35mm. The transducer width is 6.3mm such that the transducer can fit within a ¼’’
(6.35mm) wide blind-hole. The presented transducer design is 50% smaller than our previously
reported transducer [105].

Page | 21
Figure 4: (a) Transducer assembly and key dimensions, indicating the position of the FBG and
force transmission. (b) Schematic of the FBG force transducer located within the BIPED.
Permissions for reproduction of this figure were granted by IEEE.
3.3.3 Finite Element Modelling
The mechanical resonance of the transducer was estimated using structural Finite
Element (FE) analysis (ANSYS AIM 19.0, ANSYS Inc., PA United States). The purpose of
this analysis is to verify that the frequencies observed during blast loading are sufficiently low
in comparison to the first resonance of the transducer, such that blast loading will not induce
resonance in the FBG force transducer. The FE model is designed to match the physical
dimensions of the transducer, using 6061 Aluminum Alloy (Young’s Modulus = 69 GPa) for
the aluminum layer and a custom plastic (Young’s Modulus = 2 GPa, based on a Stratasys
polyjet material catalogue) for the VeroGray rigid opaque polymer components. Bonded
contact set connections model the contact interfaces between the three layers of the transducer,
as shown in Figure 5. The optical fibre bends away from the superstructure in application, but
for simplicity in the simulation, it is treated as a perfectly horizontal remote mass, with material
properties of silicon dioxide (Young’s Modulus = 67 GPa). The bottom layer, which in
application will be resting against the BIPED skull, is modelled as fixed along all degrees of
freedom. All other surfaces within the model are modelled to move freely. Using a mesh
composed of linear tetrahedral solid elements (4 nodes per element), the number of nodes was
doubled iteratively until the lowest mode of resonance changed by less than 0.5% of the
previous magnitude. This resulted in a final mesh with a maximum element face size of 0.25
mm and 52,466 nodes.

Page | 22
The same FE model and mesh is used to estimate the force sensitivity of the transducer
(Figure 6). Compressive loads are simulated from 0 N to 100 N in 10 N increments, applied
uniformly upon the upper surface of the model, and the strain at the nominal FBG location is
determined. Equation (1) is used to predict the shift in Bragg wavelength based upon the
computed FBG strain, which, in conjunction with the applied loading, can be used to assess
the model-predicted force sensitivity of the transducer.
Figure 5: Finite element model boundary conditions and mesh (a coarse mesh is used here for
better visualization). Visual indicators are displayed on top of the solid model to indicate the
applied structural conditions. Permissions for reproduction of this figure were granted by IEEE.

Page | 23
Figure 6: Finite element model used to determine strain at the nominal FBG location. Visual
indicators are displayed on top of the solid model to indicate the applied structural conditions.
Permissions for reproduction of this figure were granted by IEEE.
3.3.4 Calibration Experiments
We first calibrate the force transducer for impact forces, using an impact-response
calibration that applies forces over a range which we speculate the skull could apply to the
brain due to relative skull-brain motion during blast. Then, we subject the transducer to a
simulated blast overpressure, to confirm that the force transducer captures all frequencies of
interest in blast loading.
3.3.5 Impact-Response Calibration
Calibration is required to develop a relationship between the shift in peak reflected
wavelength and the force applied to the transducer. In this study, the FBG force transducers
are dynamically calibrated using an impact-response calibration method [36], [37], which
involves dropping an impactor of known mass onto the force transducer. The experiment is
shown in Figure 7. The spherical impactor (5kg total falling mass) has a single-axis linear

Page | 24
piezoresistive accelerometer (Xiamen Niell, Model CAYZ147V-2-2KA, China) attached so
that vertical acceleration of the mass can be accurately recorded. Acceleration of the impactor
is used to calculate the dynamic loading applied to the transducer, using Newton’s second law
of motion. The FBG transducer is fixed upon a Modular Elastomer Programmer (MEP) pad,
positioned directly underneath the impactor, and as close as possible to the vertical axis of the
accelerometer. The accelerometer is wired to a custom-built amplifier, containing an analog
anti-aliasing filter and a programmable gain amplifier. The analog output signal from the
amplifier is then directed to a data acquisition system (National Instruments, PXI-6251, TX
USA), with a custom LabView program that was developed to initiate data collection from the
accelerometer at a sampling rate of 100 kHz.
The applied forces on the transducer nominally range from 0 N to 100 N. Transducer data
is filtered using a 4th order low-pass Butterworth filter with a cut-off frequency of 1000 Hz.
The signals collected from the accelerometer and Bragg transducer are aligned using signal
correlation and post-processed (MATLAB R2016b, MathWorks, MA United States) to
compute the dynamic transducer sensitivity.
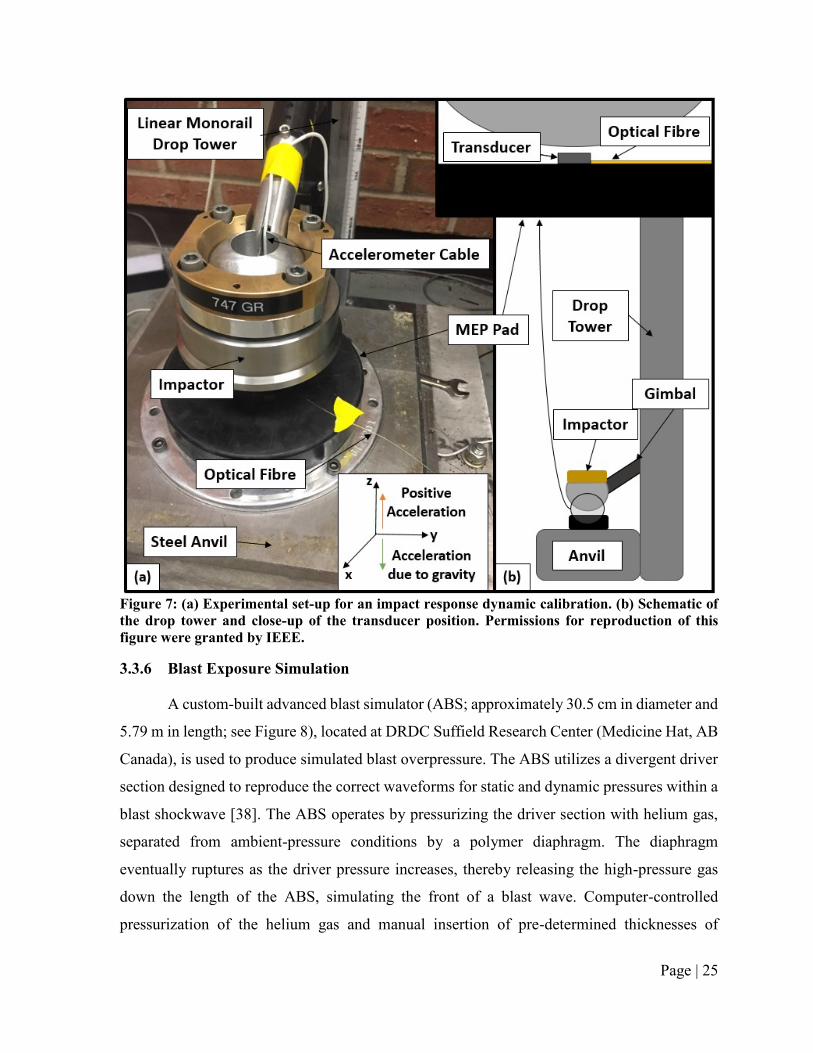
Page | 25
Figure 7: (a) Experimental set-up for an impact response dynamic calibration. (b) Schematic of
the drop tower and close-up of the transducer position. Permissions for reproduction of this
figure were granted by IEEE.
3.3.6 Blast Exposure Simulation
A custom-built advanced blast simulator (ABS; approximately 30.5 cm in diameter and
5.79 m in length; see Figure 8), located at DRDC Suffield Research Center (Medicine Hat, AB
Canada), is used to produce simulated blast overpressure. The ABS utilizes a divergent driver
section designed to reproduce the correct waveforms for static and dynamic pressures within a
blast shockwave [38]. The ABS operates by pressurizing the driver section with helium gas,
separated from ambient-pressure conditions by a polymer diaphragm. The diaphragm
eventually ruptures as the driver pressure increases, thereby releasing the high-pressure gas
down the length of the ABS, simulating the front of a blast wave. Computer-controlled
pressurization of the helium gas and manual insertion of pre-determined thicknesses of

Page | 26
reinforced cellulose acetate sheets (collectively forming the polymer diaphragm) allow for
control over the intensity of the shock front in order to achieve the required target overpressure.
For this work, a steel end plate is fixed to the end of the ABS, and contains five open holes
in it (see Figure 8). The larger center hole is left open to the external environment, while the
four outer holes were all filled to be flush with the inner surface of the ABS. Two of these four
holes are used to position the presented design for FBG transducers within the steel end plate,
mounted flush with the inner surface. Custom-built polymer components were designed to
house the transducers within these holes, and to wire the optical fibre out of the ABS. A third
hole in the steel plate is used for a reference pressure sensor (Model 133A28, PCB Piezotronics
Inc., NY United States) spaced at an equal distance from the center and also mounted flush
with the inner surface. This PCB pressure transducer is used for comparison with FBG force
transducer results in terms of time-domain traces and frequency domain profiles. FBG
transducer data is collected by the SmartScan wavelength interrogator at 62.5 kHz, while PCB
pressure transducer data is collected at 500 kHz. Both force and pressure signals were filtered
using a 4th order low pass butterworth filter with a 10 kHz cutoff frequency [39].
Figure 8: Schematic and photographs of the ABS, indicating the positions of the FBG transducers
and the reference transducer. Permissions for reproduction of this figure were granted by IEEE.

Page | 27
3.3.7 Free-Field Blast Experiment
An FBG force transducer was integrated into the frontal region of the BIPED headform,
located as shown in Figure 9 (also described in Figure 4), approximately 15mm above the
transverse plane located just above the eye sockets). A Kulite XCL-072 was molded into the
Sylgard 527 surrogate brain material at the approximate location shown in Figure 9 and used
to monitor intracranial pressure (ICP) in the frontal region. The ICP transducer is located in
roughly the same plane as the FBG transducer and approximately two-thirds of the distance
away from the center of the BIPED towards the front of the skull (based on an x-ray image of
the instrumented surrogate brain).
We performed a free-field blast trial using a 5kg C4 charge detonated at a height of 1.5m
from the ground. The un-protected (un-helmeted) BIPED is positioned (measuring from the
nose on the urethane soft tissue layer) at the same height as the charge, with a 5m standoff
distance. A Hybrid III neck (Humanetics ATD, Farmington Hills MI), fixed rigidly at the
lower-neck to a steel pole, connects at the upper-neck to the base of the BIPED, and positions
the surrogate headform such that it rests vertically and facing towards the charge.
Figure 9: Image of the BIPED with a cross-sectional planar view of the instrumentation
integrated within the headform. Permissions for reproduction of this figure were granted by
IEEE.

Page | 28
3.3.8 Statistics
From the impact calibration experiments, force transducer sensitivity is determined
using the least squares method. Force is the independent variable and Bragg wavelength shift
is the predicted or the dependent variable, with sensitivity as the predicted slope in the data
(reported in units of pm/N). The coefficient of determination, R2, is reported for each calculated
sensitivity and is interpreted as how well the linear model predicts the dependent variable (R2
ranges from 0 to 1, with 1 being an ideal model). Mean and standard deviation for transducer
sensitivity are calculated based on the results from three drop trials (n = 3), and repeated for
three transducers.
From ABS experiments, the mean, standard deviation, and coefficient of variation (COV)
of peak measurements are calculated for both FBG force transducer results and PCB pressure
sensor results, along with the driver overpressure. For comparing spectral results, the average
normalized FFT magnitude, root mean square (RMS) difference, maximum deviation, and the
ratio of RMS to average FFT magnitude are reported. The mean and standard deviations of
these are also presented.
3.4 Results
3.4.1 Numerical Prediction of Mechanical Resonance
The ANSYS FE modal analysis predicts a first mechanical resonance for the force
transducer at approximately 24.8 kHz, and the mode of deformation associated with this
resonance is shown as the insert in Figure 10, with exemplar data from FBG transducer #1.
This figure also shows the strain optic model predictions for Bragg wavelength shifts as a
function of applied loading. The model predicts a force sensitivity of 16.6 pm/N with R2 greater
than 0.99.

Page | 29
Figure 10: Modal analysis result for the first mechanical resonance of the transducer and strain
optic predictions for transducer sensitivity. Permissions for reproduction of this figure were
granted by IEEE.
3.4.2 Dynamic Calibration Results
From the impact-response calibration method, typical force versus time and typical
wavelength versus time plots are shown in Figure 11. Subsequent peaks at lower amplitudes
are due to rebounding and subsequent impacts of the impactor, resulting in the damped
oscillatory behavior observed.
Plotting the rising edges of the initial impact peak for both wavelength shift and force
against each other, up until a peak wavelength shift of approximately 1 nm, is shown in Figure
10 for three transducers. The average sensitivity from the three transducers in Figure 12 is 19.7
pm/N, which is within 16% of the model predicted sensitivity of 16.6 pm/N. Sensitivity,
standard deviation, and R2 for individual calibrations of the three transducers (n = 3 for each)
are tabulated in Table 1. Full scale uncertainty (F.S.U.) represents the standard deviation in
force, based upon the standard error (i.e. one standard deviation) of the calibration, relative to
a force output of 10 N (i.e. the full scale output based on the results shown later in section D).
Stated another way, F.S.U. conveys a +/- range on force about the magnitudes shown in Figure
14 that the true force value is expected to lie within.

Page | 30
Spectral results from the discrete Fourier transform of the transducer outputs and
accelerometer readings (normalized with respect to the maximum amplitude in the trial) are
shown for a sample trial in Figure 13. Similar spectral results were found for different trials
with the same transducer, as well as for other transducers. To analyze the repeatability from
dynamic calibrations in the frequency domain, the RMS difference between normalized force
and wavelength Fourier amplitudes are tabulated in Table 2. The average of normalized force
Fourier amplitudes are also reported, along with the maximum deviation between force (F) and
wavelength (WL) normalized magnitudes in the frequency domain. The Fourier analysis
associated with impact calibration (Figure 13) showed amplitudes in applied force signals that
were less than 1000 Hz (<4% of the frequency at first resonance), suggesting that based on the
dynamics of the transducer, the impact loading experiment could be viewed as quasi-static.
Therefore, we did not complete static calibration experiments where loads were incrementally
applied to the FBG transducer.
Figure 11: (a) Typical impact force applied to the FBG transducer plotted against time, and (b)
the corresponding impact-induced wavelength shift vs. time. Permissions for reproduction of this
figure were granted by IEEE.
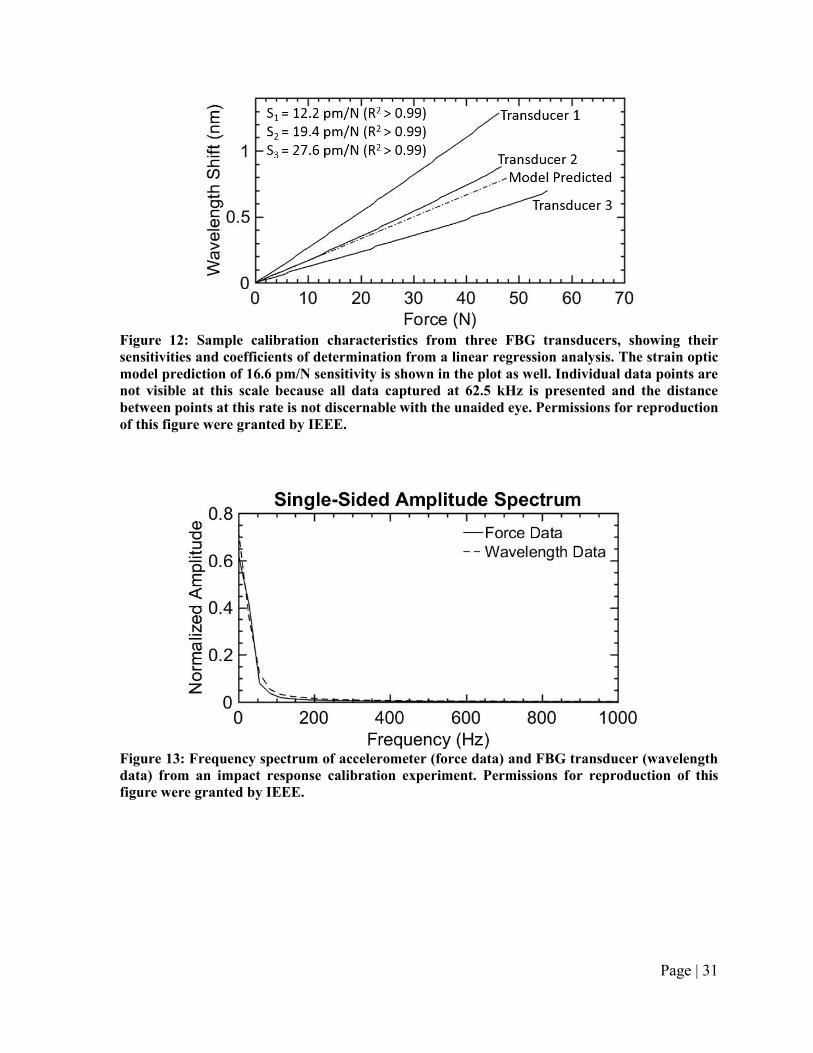
Page | 31
Figure 12: Sample calibration characteristics from three FBG transducers, showing their
sensitivities and coefficients of determination from a linear regression analysis. The strain optic
model prediction of 16.6 pm/N sensitivity is shown in the plot as well. Individual data points are
not visible at this scale because all data captured at 62.5 kHz is presented and the distance
between points at this rate is not discernable with the unaided eye. Permissions for reproduction
of this figure were granted by IEEE.
Figure 13: Frequency spectrum of accelerometer (force data) and FBG transducer (wavelength
data) from an impact response calibration experiment. Permissions for reproduction of this
figure were granted by IEEE.

Page | 32
Table 1: Sensitivity, predicted Standard Deviation in sensitivity, and COV (standard deviation
divided by sensitivity) for three sets of FBG transducer dynamic calibration experiments (n = 3
for each). Permissions for reproduction of this table were granted by IEEE.
Tx
#
Drop # Sx
[pm/N]
S.E.
[pm/N]
COV
[pm/N]
F.S.U.
[N]
R2
[ ]
1 1 12.206 0.024 0.20% 0.020 >0.99
1 2 12.153 0.023 0.19% 0.019 >0.99
1 3 12.109 0.021 0.17% 0.017 >0.99
Mean: 12.156 0.023 0.19% 0.019 >0.99
2 1 18.807 0.036 0.19% 0.019 >0.99
2 2 19.014 0.038 0.20% 0.020 >0.99
2 3 20.483 0.026 0.13% 0.013 >0.99
Mean: 19.434 0.033 0.17% 0.017 >0.99
3 1 27.019 0.040 0.15% 0.015 >0.99
3 2 28.012 0.025 0.09% 0.009 >0.99
3 3 27.852 0.026 0.09% 0.009 >0.99
Mean: 27.627 0.030 0.11% 0.011 >0.99
Tx = transducer, Sx = sensitivity, S.E. (Sx) = standard error of sensitivity, COV = coefficient of variation of
sensitivity, F.S.U. = full scale uncertainty.
Table 2: Comparison of normalized accelerometer and FBG transducer fourier amplitudes from
the dynamic calibrations of three transducers (n = 3 for each). Permissions for reproduction of
this table were granted by IEEE.
Tx
#
Drop
#
FFT Average a
[ ]
RMS Difference b
[ ]
Max Deviation c
[ ]
RMS/Average
[ ]
1 1 3.80E-03 1.11E-06 2.31E-02 0.03%
1 2 3.80E-03 1.90E-06 2.56E-02 0.05%
1 3 3.82E-03 3.78E-06 4.48E-02 0.10%
2 1 3.78E-03 3.29E-06 3.80E-02 0.09%
2 2 3.80E-03 2.04E-06 2.59E-02 0.05%
2 3 3.89E-03 5.21E-06 3.77E-02 0.13%
3 1 3.85E-03 1.62E-06 2.74E-02 0.04%
3 2 3.87E-03 1.38E-06 2.08E-02 0.04%
3 3 3.84E-03 3.75E-06 2.83E-02 0.10%
Mean: 3.83E-03 2.68E-06 3.02E-02 0.07%
STD: 3.75E-05 1.39E-06 8.08E-03 0.04%
a FFT average is calculated as the average normalized magnitude in the frequency domain for the reference
transducer. b RMS difference is determined based on the differences between the FBG transducer and the reference transducer
magnitudes in the frequency domain. c Max deviation is calculated as the maximum difference between the FBG transducer and the reference transducer
magnitudes in the frequency domain.
STD = sample standard deviation.

Page | 33
3.4.3 Blast Simulation Results
Figure 14 shows pressure transducer output and FBG force transducer output from a
sample ABS trial, normalized with respect to the maximum value observed from each sensor.
Spectral results from these normalized outputs are shown in Figure 15. The peak results, mean,
standard deviation, and coefficient of variation from 11 ABS experiments are tabulated in
Table 3. From the spectral results in Figure 15, the average of reference transducer normalized
output, RMS difference, max deviation, and the RMS/average ratio, are tabulated in Table 4.
Figure 14: Normalized amplitude vs. time from a sample ABS experiment for both the reference
pressure transducer and an FBG force transducer. Permissions for reproduction of this figure
were granted by IEEE.
Figure 15: Spectral results from an ABS experiment, comparing the normalized output from the
reference pressure transducer and an FBG force transducer. Permissions for reproduction of this
figure were granted by IEEE.

Page | 34
3.4.4 Free-Field Blast Experiment Results
Frontal FBG force and ICP measurements and spectral results from the free-field blast
experiment are shown in Figure 16.
Figure 16: FBG force and ICP measurements, along with FFT transforms, from a free-field blast
experiment using 5kg C4 at a 5m standoff. The presented data is for an un-helmeted (un-
protected) BIPED. Permissions for reproduction of this figure were granted by IEEE.

Page | 35
Table 3: Driver overpressures and corresponding sensor peak measurements during ABS
experiments. Permissions for reproduction of this table were granted by IEEE.
Target Pressure
Level
Driver
Overpressure
[kPa]
FBG Transducer #1
Normalized Peak Output a
[pm/pm]
FBG Transducer #2
Normalized Peak Output a
[pm/pm]
Reference Pressure
Transducer Normalized
Peak Output a
[kPa/kPa]
Low (n = 3)
283.23 0.395 0.367 0.447
270.57 0.416 0.331 0.429
208.13 0.362 0.314 0.360
Mean: 253.98 0.391 0.337 0.412
STD: 32.83 0.022 0.022 0.037
COV: 12.9% 5.7% 6.7% 9.1%
Medium (n = 3)
531.55 0.661 0.493 0.682
526.67 0.570 0.581 0.666
527.84 0.652 0.511 0.642
Mean: 528.69 0.627 0.528 0.663
STD: 2.08 0.041 0.038 0.016
COV: 0.4% 6.5% 7.2% 2.5%
High (n = 5)
1045.14 1.000 0.812 1.000
1056.06 0.934 0.885 0.896
1059.14 0.840 1.000 0.897
1059.83 0.846 0.958 1.000
1051.15 0.814 0.995 0.994
Mean: 1054.26 0.887 0.930 0.957
STD: 5.49 0.070 0.072 0.050
COV: 0.5% 7.9% 7.7% 5.2%
a Peak measurements were normalized based on the greatest observed value from that transducer in all 11 trials.
STD = sample standard deviation, COV = coefficient of variation.

Page | 36
Table 4: Spectral comparison of normalized reference pressure transducer and normalized FBG
force transducer amplitudes. Permissions for reproduction of this table were granted by IEEE.
Target Pressure
Level Trial #
FFT Average a
[ ]
RMS Difference b
[ ]
Max Deviation c
[ ]
RMS/Average
[ ]
Low (n = 3)
1 1.34E-04 7.97E-08 1.47E-02 0.06%
2 1.36E-04 9.64E-08 1.50E-02 0.07%
3 1.42E-04 9.71E-08 1.34E-02 0.07%
4 1.15E-04 8.15E-08 1.65E-02 0.07%
Medium (n = 3) 5 1.17E-04 8.57E-08 1.72E-02 0.07%
6 1.19E-04 1.08E-07 1.98E-02 0.09%
High (n = 5)
7 1.11E-04 1.35E-07 2.00E-02 0.12%
8 1.19E-04 1.19E-07 2.21E-02 0.10%
9 1.10E-04 2.56E-07 2.66E-02 0.23%
10 1.06E-04 2.18E-07 3.10E-02 0.21%
11 1.05E-04 2.14E-07 3.04E-02 0.20%
Mean : 1.19E-04 1.36E-07 2.06E-02 0.12%
STD: 1.25E-05 6.33E-08 6.24E-03 0.06%
a FFT average is calculated as the average normalized magnitude in the frequency domain for the reference
transducer. b RMS difference is determined based on the differences between the FBG transducer and the reference transducer
magnitudes in the frequency domain. c Max deviation is calculated as the maximum difference between the FBG transducer and the reference transducer
magnitudes in the frequency domain. Although the values for max deviation seem relatively large, they represent
the maximum deviation at a single frequency, whereas the overall weighted difference is better represented by
the RMS/average ratio.
STD = sample standard deviation.
3.5 Discussion
This work focuses on the development of Bragg grating techniques to measure skull to
brain interaction forces in a surrogate head model designed to study head protection in blast.
The presented transducer provides repeatable peak measurements and also captures all
important transients associated with blast overpressure as indicated by our repeated
experiments yielding data in both the time and frequency domain. To our understanding, this
is the only FBG-based force transducer designed for the study of blast-induced kinetics in the
brain.
Overall, the numerical and experimental results convey that the transducer has
appropriate sensitivity and resonances for blast research. This is demonstrated by successfully
capturing necessary characteristics in both time and frequency domains, under blast and impact
loading conditions, while not inducing transducer resonance.

Page | 37
Finite element simulations predicted a first mechanical resonance of 24.8 kHz for the
FBG force transducer, which is well above the impact-induced frequencies observed during
dynamic calibrations, as well as for blast-induced loading observed during ABS experiments.
Furthermore, we speculate that when the transducer is integrated into the BIPED interior, that
the frequencies of excitation on the transducer will be lesser than those associated with our
ABS experiments because the BIPED exterior skin and skull will provide considerable
mechanical damping. Therefore, we are confident that the resonances of the presented
transducer are appropriate for our ongoing research with the BIPED. Further, these results
suggest that when the transducer is applied in the BIPED, that blast energy will not induce
resonant vibration in the transducer structure and therefore measurement artefacts associated
with mechanical vibrations are not predicted when the transducer is in-situ.
Under impact loading conditions during the dynamic calibration experiments, the FBG
force transducer exhibits linearity (R2 > 0.99 in all trials) and repeatability (mean coefficient
of variation is less than 1% in all trials). Mean sensitivity from the three transducers is 19.7
pm/N, which is within 16% of the model predicted sensitivity of 16.6 pm/N. Variation in
transducer sensitivity is due to the assembly process; specifically when the FBG is fixed along
the aluminum bridge. Any deviation of the Bragg gratings from the nominal center position
yields a drastic effect on sensitivity. Determining an appropriate sensitivity of the FBG
transducer for the proposed application requires knowledge of what forces might be observed
at the skull-brain interface during blast loading, however, literature does not suggest what these
forces might be. Based on previously reported intracranial pressures during free-field blast
experiments on the BIPED [27] and using the exposed surface area of the FBG transducer, we
estimate that peak forces during similar blast trials would be on the order of 5-10 N. By
designing the transducer to have a nominal sensitivity between 10-20 pm/N, combined with
the fact that using higher acquisition rates on the SmartScan wavelength interrogator reduces
the wavelength interrogation range to 1000 pm, allows the FBG transducer to capture forces
up to 50-100 N. This is tenfold greater than the estimated upper limit, nevertheless we wanted
to ensure a larger force range for this transducer since skull-brain interaction forces under blast
loading have never been reported on before. Our pilot measures of skull-brain force (Figure
16), suggest that our estimates on the required force measurement range are appropriate.

Page | 38
For the nine calibration experiments performed on three force transducers, Fourier
analysis suggests that the Bragg transducer is capturing all frequencies of interest in impact
loading, which, for this dynamic calibration procedure, appear to lie below approximately 200
Hz. RMS differences between normalized force and wavelength magnitudes in the frequency
domain were small relative to the average normalized value (ratios of RMS/Average were all
less than 0.13%), indicating that the FBG transducers consistently capture similar spectral
profiles when compared to the applied force signals.
Blast simulations in the ABS indicate that the FBG force transducer and reference
pressure transducer both capture similar loading in the time-domain (Figure 14) and frequency
domain (Figure 15). Because of the lesser sampling rate for the FBG transducer (62.5 kHz)
when compared to the reference pressure transducer (500 kHz), it is possible that the time-
series data for the FBG transducer could omit to capture the true peak captured by the reference
transducer. To investigate this, we downsampled reference transducer data to 62.5 kHz and
found that the peak amplitudes were reduced by approximately 7-10% relative to data collected
at 500 kHz. We remind the reader that in this manuscript, we present normalized data for sensor
calibration experiments in the shock tube and therefore the stated 7-10% reductions should not
affect the trends noted in data tables, due to our normalization approach. Peak measurements
are repeatable between trials (5.7-7.9% COV for FBG Transducer #1, 6.7-7.7% COV for FBG
Transducer #2) and are comparable to the variation observed by the reference pressure
transducer (2.5-9.1% COV). Figure 14 indicates that the force transducer can also capture the
short-duration negative gauge pressure immediately following the positive phase, which is a
characteristic of blast overpressure waves [40], viewed as the negative force section following
the positive shock.
From the 11 ABS experiments, Fourier analysis suggests that the majority of the blast
spectral content lies below approximately 5000 Hz, with similar Fourier amplitude shapes
between FBG force and reference pressure. RMS differences between normalized FBG force
and reference pressure in the frequency domain were small relative to the average normalized
value (all ratios of RMS/Average were less than 0.23%), indicating consistency between the
FBG transducer and reference pressure transducer. An important factor to note from these
spectral results is that the FBG force transducers do not appear to resonate when subjected to

Page | 39
blast loading, which is indicated by an approximately zero amplitude observed at frequencies
above 5 kHz. As mentioned previously, exciting this resonance would lead to mechanical
vibration and force measurement artefacts in the output signal. This also suggests that our data
acquisition rate (62.5 kHz) is sufficient to acquire transient signals in the presented application.
However, we acknowledge that other demodulation approaches based on edge filters and
photodetectors [41] could be employed to achieve greater acquisition rates.
Other sensing technologies, such as resistive or capacitive based force transducers, could
be used for this application but arguably they could be considered to have drawbacks. First,
transducers based on resistance and capacitance can require several conductors for excitation
and signal retrieval, per sensor. The number of excitation and signal conductors increases in
direct proportion to the number of transducers used. Second, because they are electronic these
transducer technologies are not typically capable of operating when submerged in fluid, and if
they are submerged in fluid, they typically require the transducer element to be sealed (i.e.
shielded from the fluid). Optical fibre-based transducers, like that presented in this manuscript,
require only one optical conductor for each measurement location and are intrinsically immune
to the effects of fluid (including the fluid layer in the BIPED). Therefore, because they require
relatively lesser conductors and are not sealed from fluid, optical transducers can typically be
constructed to be relatively smaller and arguably less complicated than electronic alternatives.
Small size and design simplicity offset a primary drawback of using optical transducers: the
requirement for relatively more expensive instruments that supply and detect light. Specific to
application in the BIPED, because the integration of the force transducer into the BIPED skull
requires material removal from the skull, such that the embedded instrumentation appears flush
with the inner surface, it is desirable for the instrumentation (both the transducer itself and the
transmission medium – either wire or optical fibre) to be as small as possible such that the
amount of material removed from the skull is minimized. By minimizing the material removed,
we also minimize the corresponding change to overall skull stiffness, a parameter which we
desire to remain unaltered such that the BIPED continues to offer a mechanical response
similar to previous validation experiments [18]. Therefore, we argue that the use of optical
fibre based transducers (i.e. Bragg gratings in this case) is justified when one considers the
above factors and the requirements of in situ measurements in the BIPED.

Page | 40
Temperature compensation is not implemented for this work due to the short timescales
over which blast wave loading occurs. Despite high temperature exposure during a free-field
detonation experiment, the blast wave interacts with the transducer too rapidly to induce a
significant temperature shift in the FBG transducer.
Data in Figure 16 from a free-field blast experiment shows that the FBG force transducer
is capable of capturing similar time domain traces to the ICP transducer, in both time and
frequency domains. Of note, the FBG force measures exhibit negative magnitude (Figure 16)
when ICP measures reach a local maximum. In ongoing work, we will scrutinize our data in
an attempt to understand these mechanics. In the present paper, we present the exemplar data
(Figure 16) to convey that the FBG transducer is capable of detecting kinetics in-situ during a
blast event. Higher frequency components observed more predominantly in the force
transducer signals could be due to localized skull flexure. The ICP time-series trend and peak
magnitude are similar to previously reported BIPED free-field blast experiment results [27].
Peak force magnitude of 7 N from this blast experiment is within the force range that we
anticipated.
In forthcoming work, the presented transducer will be used to measure skull to brain
interaction forces in multiple locations during free-field blast experiments that expose the
BIPED to realistic overpressures. These blast experiments will be repeated for scenarios both
with and without protective headgear. While the exact threshold forces for skull-brain
interaction and injury are not universally agreed upon, the presented transducers can be used
to measure force mitigation, if any, offered by contemporary military protective headgear.
These force measurements, in parallel with pressure measurements in the brain parenchyma,
will allow us to determine the open question on whether or not protective headgear mitigates
blast energy transfer into helmeted soldiers. It is also possible that the FBG transducer
presented could be applied in other surrogate models used in impact and blast research. Such
application would necessitate minor transducer re-design to ensure the transducer can capture
kinetics over ranges appropriate for the application.
In summary, this study presents the development of a FBG force transducer to measure
skull-brain interaction forces within a mechanical surrogate headform used to assess protective
headgear during blast loading. The presented transducer exhibits repeatability in both impact

Page | 41
force and blast overpressure loading and exhibits excellent agreement with calibration
reference transducers in both the time and frequency domain. The transducer can be arrayed
within the surrogate headform and used to assess the forces that are created as a result of blast
overpressures interacting with both unprotected and protected (i.e. helmeted) heads.
3.6 Conclusions
This paper detailed the development of an FBG force transducer for measuring blast
kinetics and the capacity for these transducers to be integrated into the surrogate skull of the
BIPED. The main contribution from this paper is providing a validated and repeatable
transducer for blast and impact scenarios that can measure inner skull forces within a surrogate
headform. The novel force transducer is the first application of FBG technology towards
measuring inner skull kinetics under blast loading. While brain pressure and inner skull forces
are not directly linked towards TBI, these metrics provide insight towards how the brain and
skull react under blast loading and may present an appropriate paradigm towards assessing the
relative efficacy of protective headgear at mitigating internal kinetics. The next objective of
this thesis, which is the topic for the following chapter, is to investigate the transmissions of
blast and impact energy into the BIPED for various protection scenarios.

Page | 42
Chapter 4: Protective headgear attenuates forces on the inner table and
pressure in the brain parenchyma during blast and impact: an
experimental study using a simulant-based surrogate model of the
human head.
The following manuscript is under preparation for submission into the ASME Journal of
Biomechanical Engineering (to be submitted in January 2019). This paper does not identically
match the version to be submitted to ASME Journal of Biomechanical Engineering. The first
author of this manuscript is also the author of this thesis.
4.1 Introduction
In order to document the effect that head protection has on skull and brain kinetics, the
BIPED was instrumented with an array of transducers and subject to blast and impact
experiments. This chapter describes the effect of contemporary protective headgear on
mechanical measures within the cranial vault of a simulant-based surrogate headform during
both blast and impact events. Specifically, pressures within the brain parenchyma and forces
on the inner table of the skull are investigated.
4.2 Background
Rates of traumatic brain injury (TBI) among warfighters have been rising during recent
conflicts and have had a profound impact on the health of combat veterans [3,131–135]. For
soldiers deployed to Afghanistan (Operation Enduring Freedom; OEF) and Iraq (Operation
Iraqi Freedom; OIF), it has been estimated that nearly 25% of all deployed warfighters suffered
from symptoms of TBI [136–138]. Blast exposure accounts for the majority of total injuries
among contemporary military personnel, with reports as high as 80% [14,139–141]. It is
estimated that 50-60 % of head injuries involving blast exposure on the battlefield also
involved blunt trauma [85]. During the OEF and OIF conflicts, the use of explosive devices
increased, with improvised explosive devices (IEDs) becoming the weapon of choice against
coalition forces [142], resulting in increased blast exposure for the modern warfighter
[143,144]. The US Navy-Marine Corps combat trauma registry reported that IEDs were found
to be the most common mechanism responsible for TBI cases (52%) during OIF [145].

Page | 43
Effective mitigation strategies are strongly desired by Canadian and US militaries, but in order
to reduce the occurrence of blast-induced traumatic brain injury (bTBI), a proper understanding
of the bTBI injury mechanisms is required [14].
An explosive blast can cause many different types of injury, which are broadly classified
into four categories [14,146]. Primary blast injury is due to the direct effects from the blast
wave propagating through the body and damaging living tissue. Secondary blast injury
involves the propulsion of debris or fragments that can cause blunt or penetrating injury.
Tertiary blast injury occurs when the explosion induces global acceleration of the body,
propelling it into collision with surrounding structures in the environment. Quaternary blast
injuries are due to post-detonation environmental stressors, such as chemical exposure or burns
from thermal radiation. There is limited information available on the effect of primary blast on
the human head [14,141], and it is not yet clear how significant primary blasts are relative to
blunt impact as sources of injury [85]. Due to the sensitivity of brain tissue to loading rate
[147], the mechanisms of injury for primary blast TBI (bTBI) may not be similar to
conventional blunt TBI [141,148,149]. In this work, we focus on studying primary blast
exposure using free-field detonation experiments and compare results with low-speed impact
trials that can simulate a tertiary blast injury scenario involving direct head impact [150].
The mechanisms of primary bTBI remain poorly understood, however several theories
exist [14,151]. One theory suggests that blast waves can damage brain tissue by travelling
through skull orifices such as nasal sinuses [49], auditory canals [50,51], and/or eye orbits [52–
55]. It has also been suggested that a blast wave could directly transmit into the brain through
the skull via transosteal wave propagation, referred to as the direct cranial transmission theory
[46–48], however acoustic impedances suggest that this is an unlikely mechanism [14].
Another theory suggests that skull deformation can be induced from a blast wave [56–58],
either through localized deformation or by exciting a mode of skull resonance. These skull
deformations can then cause significant intracranial pressure (ICP) fluctuations [14,59].
Another theory referred to as thoracic surge is proposed to cause bTBI indirectly through the
rapid compression of the thorax and abdomen from the blast wave, which then transmits a
pressure wave towards the brain through soft tissue and vascular mediums [68–70]. Cavitation
has also been proposed as a primary blast injury mechanism, in which localized regions of

Page | 44
negative ICP may result in the formation of cavitation bubbles that cause damage to
surrounding brain tissue when they collapse [65,75]. These theories on primary bTBI remain
under dispute, but likely do not occur in isolation from one another during a realistic blast
scenario, and may vary based on the loading magnitude and exposure duration [14,151].
Understanding which mechanisms are most prevalent during a blast scenario and how they can
effectively be mitigated could help direct the development of future protective combat
headgear.
The mechanisms of impact induced head injury are relatively better documented than are
the mechanisms of blast injury [121]. Impact forces on the head create abrupt head motions
comprising both linear and rotational mechanics. These impact forces are first applied to the
scalp and then skull, which can in turn create relative motion between the skull and the brain
within the cranial vault. These relative motions are believed to be a possible cause of disruption
to bridging veins (usually implicated in subdural hematoma) [152,153] and also of contact
between the brain and skull leading to disruption of brain tissue (proposed as a mechanism for
coup and contre-coup injuries) [154]. Impact to the head and brain also elicit accelerations that
are both linear and rotational which are thought to result in inertial loading of tissue leading to
both local (focal) and widespread (diffuse) tissue damage [155]. Impact induced injuries are
generally classified as either focal or diffuse. Examples of focal injuries include contusion,
laceration and localized skull fracture, the latter of which is typically considered to be caused
by localized forces on the skull and has in a large amount of literature been correlated with
linear head acceleration following impact [156–158]. Examples of diffuse injuries include
widespread subdural hematoma due to bridging vein rupture and diffuse axon disruption, the
severity and risk of each have both been correlated with rotational impact mechanics including
acceleration and velocity [155,159–161]. Often, after a head impact, both linear and rotational
kinematics result and therefore it is possible to have both head and brain injuries that are focal
and diffuse, affecting both the skull and brain.
Helmets are the primary protection device fielded to protect the head of the wearer from
impact, as well as ballistic threats for military personnel, and they are commonly
acknowledged as being effective in protecting the wearer from these threats [15,17,84–89]. In
combat scenarios, no existing protective headgear is able to fully protect against all the

Page | 45
potential threats that can exist on the battlefield [85]. Current combat helmets are tested by
their ability to prevent ballistic penetration, mitigate blunt trauma, and behind-helmet blunt
trauma (BHBT) from projectiles and by their ability to withstand environmental stressors such
as exposure to temperature extremes [85]. Ballistic protection of the head is achieved by the
helmet exterior shell that is struck by projectiles, and through a process involving permanent
deformation and failure of shell materials, the exterior shell redistributes the loading over a
larger area and reduces the amount of energy available for transmission to the helmeted head.
These reductions in energy transfer are typically inferred from head models that use clay to
measure depth of deformation of the helmet interior [162], and more recent proposals use head
models capable of measuring forces exerted on the head exterior during helmet deformation.
Reduction in energy transmission to the underlying head is generally associated with reduced
risk and severity of head injury. Similarly, for impact protection, helmets are tested for their
ability to attenuate impact energy transmission to an underlying head [85], typically quantified
by measuring linear head acceleration during the impact event. A helmet that leads to lesser
head acceleration than that measured with another helmet is typically thought to offer superior
impact attenuation, and head protection [163]. It is evident from the above that the paradigm
for assessing head protection is quantifying reductions in energy transfer. Despite the efficacy
of contemporary combat helmets in mitigating injury from ballistic threats and impacts, bTBI
rates continue to rise [164], and it appears to be an open question whether modern combat
helmets are effective at protecting military personnel from blast waves. Indeed, there is scant
biomechanical literature that assesses whether or not contemporary military head protection is
capable of altering the transmission of blast energy into the head and brain.
The objective of this study is to ascertain whether or not protective headgear alters the
transmission of blast and impact energy into the brain, using a biofidelic surrogate of the head
based on simulant materials. Free field blast simulations at an outdoor test range were
conducted to create realistic blast loading on the head surrogate for cases where the head was
unprotected, wearing a contemporary military helmet, and wearing both a helmet and eye
protection. Impact loading on the head surrogate was also created in a laboratory setting for
the cases where the head surrogate was unprotected and protected using a helmet. Within the
surrogate head, forces on the inner table of the skull were measured, along with pressures

Page | 46
within the brain parenchyma. Transmission of energy into the brain was quantified through
peak measures in force and pressure as well as quantification of frequency components in the
force and pressure data. Descriptive statistics of repeated experiments were quantified for the
purposes of comparing measured mechanics between cases of unprotected and protected
headform scenarios.
4.3 Methods
4.3.1 Surrogate Headform and Instrumentation
For this work, we instrument a surrogate blast headform known as the Blast Injury
Protection Evaluation Device (BIPED), fully developed by Defense Research and
Development Canada (DRDC). An in-depth report on the BIPED, including the history of
development, along with current headform geometry and physical properties, is presented in
previous literature [81]. The BIPED has been subjected to simulated blast overpressure in blast
tube experiments and has been shown to measure ICP of comparable peak magnitude, time
duration, and frequency content to cadaver heads that were subjected to overpressure in the
same blast tube [66]. In this paper, we outline key headform properties and provide details on
the instrumentation used for this study.
The BIPED, shown Figure 17, has several internal and external biofidelic features such
as anthropomorphic eye orbits, nasal cavities, a brain, cerebrospinal fluid, skin, a jaw, ears, a
cerebellum cavity, along with falx and tentorium membranes. Surrogate skull material is
nominally 6.35 mm thick and composed of TC-854 A/B polyurethane (BJB Enterprises Inc.,
CA United States). Surrogate brain tissue (exposed in Figure 17a) is composed of the silicone
Sylgard 527 (Dow Corning Corporation, MI United States), and water is used to simulate
cerebrospinal fluid. The external soft tissue layer (Figure 17a) is composed of a tough urethane
rubber (Vytaflex 20, Smooth-On Inc., CA United States). Internal falx and tentorium
membranes are modelled using 70A hardness Neoprene layers. External feature locations and
size are based upon head models used in, for example, Canadian Standards Association
CAN/CSA Z262.6-02, helmet test standards [82]. The upper skull geometry matches the top
half of the ISO Size J Headform (Cadex Inc., QC, Canada), and internal skull features are based

Page | 47
upon an open-source CAD model of the human skull [83]. The BIPED has a 4-point attachment
location at the base of skull where it can be mounted onto a Hybrid III neck.
Figure 17: (a) BIPED with the upper skull cap removed and surrogate brain exposed on the left,
with the surrogate scalp to the right. (b) Right to left side view X-ray image of the instrumented
BIPED showing front and back ICP and force transducer locations. (c) Front to back view X-ray
image of the instrumented BIPED showing side ICP and force transducer locations.
For the experiments performed in this study, a BIPED is instrumented with several
pressure transducers, similar to work done previously [66,81], but it is additionally equipped
with novel force transducers within the surrogate skull material. X-ray images showing some
of these transducer locations can be seen in Figure 17. In our previous work, in-fibre Bragg
grating (FBG)-based optical force transducers were developed for measuring forces with
frequency content characteristic of blast [165], and for this study, multiple FBG-based force
transducers are calibrated and integrated into the surrogate skull material and mounted flush
with the inner surface (inner table) of the skull. These transducers are composed of an FBG
embedded within an aluminum and acrylic based multi-layered cylindrical superstructure, with
an overall size of 3 mm in height and 6.3 mm in diameter. The approximate transducer plane
for which these transducers are integrated is shown in Figure 18a. This transducer plane is
parallel to the transverse plane and offset by approximately 20 mm above the eye sockets on
the surrogate skull. Individual transducer locations are shown in Figure 18b, with four locations
for front, right, left (impact only), and rear transducers. Two surrogate skull caps are
instrumented with an array of force transducers (one for blast experiments and one for impact
experiments). After performing the blast experiments, the BIPED skull cap was replaced with

Page | 48
another instrumented skull cap for impact experiments with an additional force transducer on
the left side. The transducers are fixed into the headform using high strength epoxy (Loctite
MS 930, Henkel AG & Co., Germany).
Figure 18: (a) BIPED front view showing the transducer plane and front external transducer. (b)
BIPED side view showing the transducer plane and side external transducer. (c) Top view of the
transducer plane showing the instrumentation locations.
In addition to the force transducers, the BIPED used for this study is instrumented with
several pressure transducers for measuring internal pressures within the surrogate brain
parenchyma, as well as the external pressure profile. Three Kulite piezo-resistive pressure
transducers (modified XCL-072, Kulite Semiconductor Products, NJ United States) are used
to monitor ICP. These transducers have a linear output for pressures up to 14 bars, a resonant
frequency over 550 kHz, and are relatively insensitive to acceleration (less than 0.0001% full
scale output per g). These ICP transducers are molded into the surrogate brain material
(locations shown in Figure 18) in approximately the same plane as the force transducers.
External pressure measurements are collected by pressure transducers (modified LL-125 flat
line series, Kulite Semiconductor Products, NJ United States) located on the front, side, and
back locations of the headform (shown in Figure 18). These external pressure transducers were
retrofit into the surrogate skin material and mounted to be flush with the outer surface of the
BIPED. The BIPED is filled with water to model CSF and then sealed using thread sealing
cord (Loctite 55-10, Henkel AG & Co., Germany) and self-fusing silicone (Loctite SI 5075,
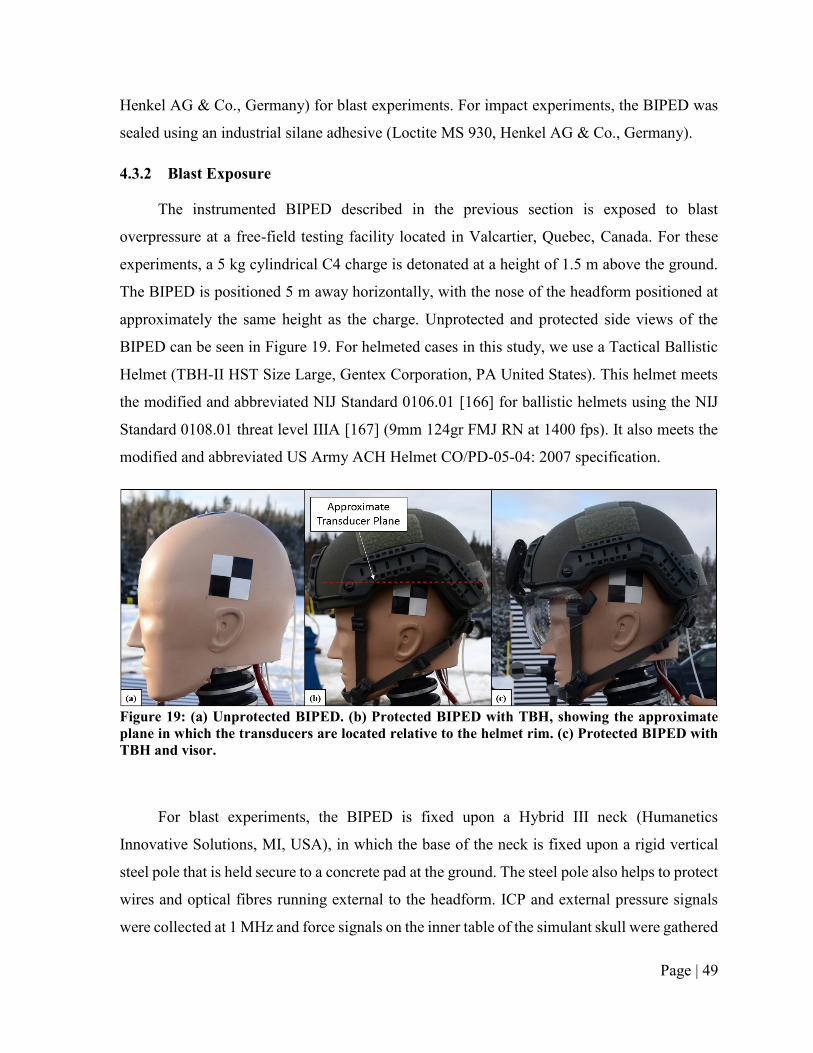
Page | 49
Henkel AG & Co., Germany) for blast experiments. For impact experiments, the BIPED was
sealed using an industrial silane adhesive (Loctite MS 930, Henkel AG & Co., Germany).
4.3.2 Blast Exposure
The instrumented BIPED described in the previous section is exposed to blast
overpressure at a free-field testing facility located in Valcartier, Quebec, Canada. For these
experiments, a 5 kg cylindrical C4 charge is detonated at a height of 1.5 m above the ground.
The BIPED is positioned 5 m away horizontally, with the nose of the headform positioned at
approximately the same height as the charge. Unprotected and protected side views of the
BIPED can be seen in Figure 19. For helmeted cases in this study, we use a Tactical Ballistic
Helmet (TBH-II HST Size Large, Gentex Corporation, PA United States). This helmet meets
the modified and abbreviated NIJ Standard 0106.01 [166] for ballistic helmets using the NIJ
Standard 0108.01 threat level IIIA [167] (9mm 124gr FMJ RN at 1400 fps). It also meets the
modified and abbreviated US Army ACH Helmet CO/PD-05-04: 2007 specification.
Figure 19: (a) Unprotected BIPED. (b) Protected BIPED with TBH, showing the approximate
plane in which the transducers are located relative to the helmet rim. (c) Protected BIPED with
TBH and visor.
For blast experiments, the BIPED is fixed upon a Hybrid III neck (Humanetics
Innovative Solutions, MI, USA), in which the base of the neck is fixed upon a rigid vertical
steel pole that is held secure to a concrete pad at the ground. The steel pole also helps to protect
wires and optical fibres running external to the headform. ICP and external pressure signals
were collected at 1 MHz and force signals on the inner table of the simulant skull were gathered
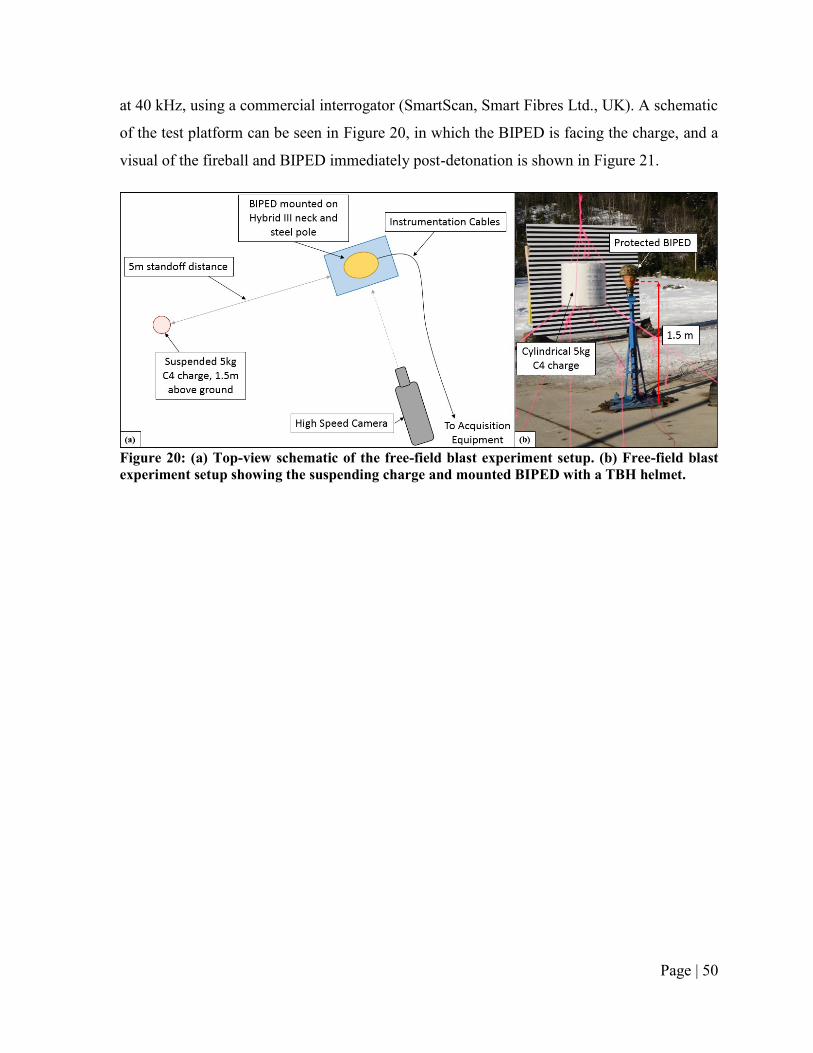
Page | 50
at 40 kHz, using a commercial interrogator (SmartScan, Smart Fibres Ltd., UK). A schematic
of the test platform can be seen in Figure 20, in which the BIPED is facing the charge, and a
visual of the fireball and BIPED immediately post-detonation is shown in Figure 21.
Figure 20: (a) Top-view schematic of the free-field blast experiment setup. (b) Free-field blast
experiment setup showing the suspending charge and mounted BIPED with a TBH helmet.

Page | 51
Figure 21: Blast test site showing the resulting fireball from a 5kg C4 detonation and BIPED
location during experiments.
Four blast experiments are repeated using an unprotected (bare) BIPED, and seven
experiments are conducted using various headform protection scenarios, for a total of 11 blast
experiments and 4 protection scenarios. The different test scenarios for the 11 blast
experiments are outlined in Table 5. For the protected scenarios: three trials were performed
using a TBH, two trials were performed using the TBH and a visor (Baltskin Cobra, Revision
Military Ltd., VT USA), and two trials were performed using the TBH, visor, and a lower
stiffness neck scenario. The lower stiffness neck scenario was achieved by replacing the
standard Hybrid III rubber nodding blocks with a retrofit foam insert. Because the Hybrid III
neck is known to have much greater stiffness than a human neck [168,169], this lower stiffness
neck scenario was created in an attempt to exhibit increased global headform motion in
response to a blast wave.

Page | 52
Table 5: Test conditions of the free-field blast experiments
4.3.3 Impact Loading
An instrumented BIPED (identical to the one used for blast experiments except lacking
external pressure transducers, and has an additional force transducer on the left side) is
subjected to impact experiments using a custom-built linear guided monorail drop tower
[170,171]. All impacts are to the high forehead of the BIPED. High speed cameras (Phantom
v611, Vision Research, Wayne, NJ) are used to track global headform movement at 1000
frames per second. A soft impact surface consisting of sportsfield turf (SouthWest Greens GB-
011, 100% Polyethylene, 1.75 in pile height) with a crumb rubber infill was fixed upon a steel
anvil at the base of the vertical drop tower. This soft impact surface was used instead of the
bare steel anvil in order to protect the bare BIPED headform from potentially rupturing and
leaking internal fluids at higher drop velocities. The BIPED is mounted onto a Hybrid III neck,
which in turn is fixed to an adjustable gimbal that moves freely along the vertical axis of the
drop tower. A still-image of a protected and unprotected BIPED drop tower setup can be seen
in Figure 22.
Figure 22: Unhelmeted (left) and helmeted (right) BIPED headform fixed to a Hybrid III neck
and drop tower gimbal during an impact experiment.
Scenario # Number of Repeats Protection Neck Stiffness
1 n = 4 None (Unprotected) Normal (Regular Hybrid III neck)
2 n = 3 Gentex TBH Normal (Regular Hybrid III neck)
3 n = 2 Gentex TBH + Visor Normal (Regular Hybrid III neck)
4 n = 2 Gentex TBH + Visor Low (Hybrid III neck with foam nodding blocks)
Total Blast Experiments: n = 11
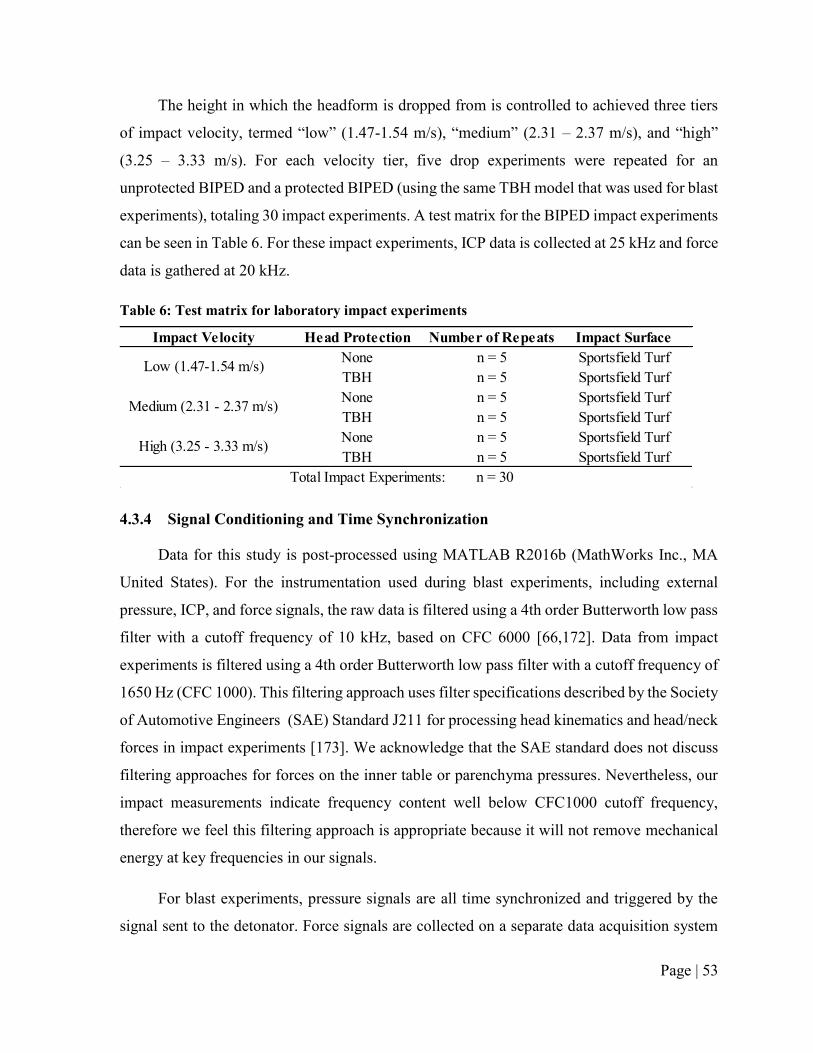
Page | 53
The height in which the headform is dropped from is controlled to achieved three tiers
of impact velocity, termed “low” (1.47-1.54 m/s), “medium” (2.31 – 2.37 m/s), and “high”
(3.25 – 3.33 m/s). For each velocity tier, five drop experiments were repeated for an
unprotected BIPED and a protected BIPED (using the same TBH model that was used for blast
experiments), totaling 30 impact experiments. A test matrix for the BIPED impact experiments
can be seen in Table 6. For these impact experiments, ICP data is collected at 25 kHz and force
data is gathered at 20 kHz.
Table 6: Test matrix for laboratory impact experiments
4.3.4 Signal Conditioning and Time Synchronization
Data for this study is post-processed using MATLAB R2016b (MathWorks Inc., MA
United States). For the instrumentation used during blast experiments, including external
pressure, ICP, and force signals, the raw data is filtered using a 4th order Butterworth low pass
filter with a cutoff frequency of 10 kHz, based on CFC 6000 [66,172]. Data from impact
experiments is filtered using a 4th order Butterworth low pass filter with a cutoff frequency of
1650 Hz (CFC 1000). This filtering approach uses filter specifications described by the Society
of Automotive Engineers (SAE) Standard J211 for processing head kinematics and head/neck
forces in impact experiments [173]. We acknowledge that the SAE standard does not discuss
filtering approaches for forces on the inner table or parenchyma pressures. Nevertheless, our
impact measurements indicate frequency content well below CFC1000 cutoff frequency,
therefore we feel this filtering approach is appropriate because it will not remove mechanical
energy at key frequencies in our signals.
For blast experiments, pressure signals are all time synchronized and triggered by the
signal sent to the detonator. Force signals are collected on a separate data acquisition system
Impact Velocity Head Protection Number of Repeats Impact Surface
None n = 5 Sportsfield Turf
TBH n = 5 Sportsfield Turf
None n = 5 Sportsfield Turf
TBH n = 5 Sportsfield Turf
None n = 5 Sportsfield Turf
TBH n = 5 Sportsfield Turf
Total Impact Experiments: n = 30
Low (1.47-1.54 m/s)
Medium (2.31 - 2.37 m/s)
High (3.25 - 3.33 m/s)

Page | 54
triggered manually just before detonation. During impact experiments, ICP and force signals
are also collected on separate data acquisition systems. For comparison of data from different
blast trials, signals are aligned based on the incident peak of the front external pressure
transducer. For comparison within trials, force signals are aligned by shifting the initial peak
of the front force transducer to be approximately halfway between the front external incident
peak and the front ICP initial peak. For example, in many blast trials the front external pressure
incident peak occurs around 2.6 ms and the front incident ICP peak occurs at approximately
2.8 ms, therefore the force signals are shifted such that the front initial force peak occurs at 2.7
ms in this instance. We acknowledge that this may not be the exact time where the force signal
peaks would occur, however for the visualization purposes in this work, the error from using
this synchronization method should be no greater than 100 µsec and the true difference would
not be distinguishable for the figures shown in this paper. In addition, our subsequent analysis
focuses on magnitudes of measured mechanics as opposed to their relative order of sequence
in the time domain, and so we believe our data analysis approaches are justified. Consequently,
any conclusions drawn are limited to magnitudes of measured mechanics.
For spectral analysis, we use a fast Fourier transform (FFT, implemented using
MATLAB R2016b) to investigate whether the various protection scenarios have an effect on
frequency content [174] in measured data. We also examined the accumulation of amplitudes
with increasing frequency using normalized cumulative FFT data, which contain the
cumulative sum of FFT amplitudes normalized by the total value of all amplitudes accumulated
up to the Nyquist frequency for the given blast or impact experiment. For blast experiments,
the Nyquist frequencies are 250 kHz (pressure data) and 20 kHz (force data). For impact
experiments, they are 12.5 kHz (pressure) and 10 kHz (force). These normalized data convey
the proportion of amplitudes accumulated up to a given frequency in a measured parameter
(e.g. pressure or force).
4.3.5 Statistics
For blast experiments, we report the mean results of peak measurements for each
scenario. For impact experiments, we report mean, sample standard deviation (STD), and
coefficient of variation (COV) of peak measurements for each scenario.

Page | 55
4.4 Results
4.4.1 Blast Exposure
Representative blast data for each transducer location from an unprotected and protected
headform scenario can be seen in Figure 23. Peak results and means for each protection
scenario are tabulated in Table 7 for the incident blast and ground reflected waves, as measured
by the external pressure transducers. Pressure versus time and FFT data from the ICP
transducer measurements are shown in Figure 24 for the four protection scenarios, with
maximum and minimum values summarized in Table 8. Similarly, Force versus time and FFT
data from the force transducer measurements are shown in Figure 25 for the four protection
scenarios, with maximum and minimum values tabulated in Table 9. Finally, normalized
cumulative FFT data, which contain the cumulative sum of FFT magnitudes normalized by the
total value accumulated up to the Nyquist frequency, are shown in Figure 26.

Page | 56
Figure 23: Representative blast data for all transducer locations in an unprotected scenario
(Scenario #1, trial T4, shown at left) and a protected scenario (Scenario #3, trial T1, shown at
right). The top row contains external pressure measurements for each transducer location. The
middle row contains ICP measurements from each transducer location, along with the front
external pressure measurement for reference. The bottom row contains force measurements
from each transducer location, along with the front external pressure measurement for reference.

Page | 57
Table 7: Peak pressures measured with external transducers on BIPED, for incident blast and
ground reflected waves. Means are tabulated for each of the different protection scenarios.
Front Side Back Front Side Back
Scenario # Trial # (kPa) (kPa) (kPa) (kPa) (kPa) (kPa)
1 T1 225.1 97.4 86.7 171.1 91.0 110.6
1 T2 220.8 101.9 89.3 152.2 102.4 94.9
1 T3 230.0 103.0 92.4 180.5 81.8 98.3
1 T4 222.2 102.8 176.6 181.2 97.2 90.3
224.5 101.3 111.3 171.3 93.1 98.5
2 T1 187.1 96.6 104.4 249.3 139.5 85.7
2 T2 170.7 91.0 111.9 232.6 125.8 98.0
2 T3 224.7 78.2 94.2 212.3 87.8 77.7
194.2 88.6 103.5 231.4 117.7 87.1
3 T1 114.1 89.3 112.4 173.3 120.2 107.2
3 T2 107.6 90.3 115.6 229.1 120.2 114.1
110.9 89.8 114.0 201.2 120.2 110.7
4 T1 116.6 90.4 129.3 172.5 109.9 113.3
4 T2 75.3 135.5 135.5 225.0 74.5 74.5
96.0 113.0 132.4 198.8 92.2 93.9
Mean:
Mean:
Mean:
Peak External Pressure Magnitudes
Incident Shock Ground Reflected Shock
Mean:

Page | 58
Figure 24: ICP time series and FFT data from blast experiments for various protection scenarios.
External overpressure data for each location is also shown for trial #4 from scenario #1. The top
row shows front ICP data, the middle row shows side ICP data, and the bottom row shows back
ICP data.

Page | 59
Figure 25: Force time series and FFT data from blast experiments for several protection
scenarios. The top row shows front force data, the middle row shows side force data, and the
bottom row shows back force data.

Page | 60
Table 8: Maximum and minimum magnitudes in the ICP data for each trial, with means for each
scenario.
Table 9: Maximum and minimum magnitudes in the force signals for each trial, with means for
each scenario. Greyed cells containing no values are assigned to results lacking a continuous
signal, in which excessive bending occurred in the optical fibre for these trials. When excessive
bending occurs, an optical fibre cannot transmit a signal adequately for interrogation, and thus
a discontinuity appears in the data until the bending is alleviated.
Front Side Back Front Side Back
Scenario # Trial # (kPa) (kPa) (kPa) (kPa) (kPa) (kPa)
1 T1 53.5 38.1 10.9 -28.5 -29.2 -25.9
1 T2 79.6 31.7 24.9 -33.4 -26.7 -23.5
1 T3 77.6 35.8 25.6 -34.1 -34.5 -27.4
1 T4 79.2 38.3 34.3 -37.8 -31.4 -30.5
72.5 36.0 23.9 -33.5 -30.4 -26.8
2 T1 52.4 40.7 21.1 -30.3 -31.9 -33.5
2 T2 43.3 37.2 13.8 -24.5 -25.2 -26.5
2 T3 39.8 39.2 15.5 -31.0 -26.3 -16.5
45.2 39.0 16.8 -28.6 -27.8 -25.5
3 T1 38.4 35.8 28.8 -40.5 -37.3 -31.9
3 T2 35.6 33.9 20.7 -30.3 -28.7 -25.4
37.0 34.8 24.8 -35.4 -33.0 -28.6
4 T1 48.4 35.0 31.5 -32.2 -25.9 -29.9
4 T2 51.5 50.0 34.2 -40.1 -41.1 -30.0
50.0 42.5 32.8 -36.1 -33.5 -30.0
Mean:
Mean:
Mean:
Mean:
Maximum Minimum
Peak ICP Magnitudes
Front Side Back Front Side Back
Scenario # Trial # (N) (N) (N) (N) (N) (N)
1 T1 8.20 2.83 -4.74 -3.64
1 T2 8.23 3.94 -3.83 -4.62
1 T3 9.23 3.62 -3.80 -4.65
1 T4 8.41 3.11 2.62 -5.99 -4.66 -5.75
8.52 3.56 2.72 -4.59 -4.64 -4.70
2 T1 1.37 -2.34
2 T2 3.60 7.28 -2.80 -5.11
2 T3 1.77 3.62 -3.13 -3.84
2.24 5.45 -2.76 -4.47
3 T1 1.79 5.98 3.02 -4.75 -5.54 -4.96
3 T2 1.55 4.75 3.39 -6.17 -4.96 -3.11
1.67 5.36 3.20 -5.46 -5.25 -4.03
4 T1 1.33 5.96 1.95 -4.91 -4.88 -3.44
4 T2 2.49 4.14 1.74 -5.50 -3.59 -2.44
1.91 5.05 1.85 -5.21 -4.23 -2.94
Mean:
Mean:
Peak FBG Force Magnitudes
Maximum Minimum
Mean:
Mean:

Page | 61
Figure 26: Normalized cumulative FFT data for force and ICP measurements from blast
experiments. These figures are plotted up to 6000 Hz, the frequency at which the majority of
signals spectral content falls below. Data is normalized based on the accumulated frequency at
the Nyquist frequency (250 kHz for ICP and 20 kHz for force data). Therefore, the normalized
cumulative results do not reach a value of 1 until higher frequencies than what is shown.

Page | 62
Figure 23 shows representative external pressure field traces, which show near-
instantaneous rises in pressure for the incident and ground reflective waves once they reach
the headform, with an exponential decay in pressure after their arrival. For these experiments,
the ground reflected wave arrives approximately 2 ms after the incident wave. Adding a helmet
to the surrogate headform (Scenario #2) reduced front incident shock magnitudes, shown in
Table 7, from a mean of 224.5 kPa (Scenario #1) to a mean of 194.2 kPa (attenuation of 13%),
however it increased the ground reflected shock magnitudes from a mean of 171.3 kPa to a
mean of 231.4 kPa (amplification of 35%). It is important to note that this difference in trends
noted in Table 7 for incident and ground reflected peak magnitudes is due to directionality of
the arriving blast waves. The incident wave propagates directly towards the BIPED from the
charge (at approximately the same height), resulting in purely frontal loading. Because the
helmet brim in protected scenarios covers the external pressure transducers (Figure 19b), the
result is attenuation of the incident wave for helmeted trials relative to unhelmeted trials as the
blast wave propagates through the helmet prior to reaching the external transducer. Conversely,
the ground reflected wave propagates towards the BIPED at an upward angle, resulting
complex interactions between the helmet brim and scalp of the BIPED, yielding amplification
of the ground reflected wave external pressures for helmeted trials relative to unhelmeted trials.
Adding eye protection to the surrogate headform (Scenario #3), in addition to a helmet, further
attenuated the incident shock from a mean of 194.2 kPa to 110.9 kPa (attenuation of 43%,
relative to Scenario #2), measured by the front external transducer. No systematic changes in
overpressure measurements for the various protection scenarios were observed for the side and
back external pressure transducers.
Measures from instrumentation at the front of the head suggests the addition of head
protection affected ICP magnitudes and frequency content. From Table 8, peak frontal ICP
measurements were reduced from a mean of 72.5 kPa in the unprotected trials (Scenario #1)
to means of 45.2 kPa, 37.0 kPa, and 50.0 kPa in Scenarios #2, 3, and 4, respectively. Adding
a TBH helmet alone (Scenario #2, relative to Scenario #1) reduced mean frontal peak ICP
measurements by 38%, while mean frontal external incident peak overpressure was reduced
by only 13%. From Table 8, peak ICP signals for the side and back transducers did not convey
obvious systematic alterations due to addition of protective headgear (despite a large reduction
Page | 63
in the incident wave overpressure and front ICP). The FFT data in Figure 24 demonstrate a
shift in the ICP signal towards lower frequencies for the front and back ICP transducers, with
reduction in amplitudes between frequencies from 1500 Hz to 2000 Hz. The side ICP data,
however, did not convey the same shift in frequency. Side ICP data indicates greater spectral
content in the 1000 Hz to 1500 Hz range (protected relative to unprotected). The normalized
cumulative distribution plots in Figure 26 better illustrate the shift in frequency content,
showing that more of the front ICP transducer signal is accumulated at lower frequencies,
particularly below 2000 Hz, when head protection is used (Scenarios #2-4) relative to an
unprotected headform (Scenario #1). This shift in spectral content towards lower frequencies
is visualized in the normalized cumulative pressure plots as a leftward shift in the normalized
cumulative pressure. For the exemplar plot in Figure 26, approximately 60% of the front ICP
transducer spectral content is accumulated by 1000 Hz for Scenarios #2-4, in comparison to
approximately 47% for Scenario #1. The side ICP data did not indicate change in normalized
cumulative pressure for the various protection scenarios.
Relative to an unprotected head, using head protection under blast loading affects the
force transducer measurements and their frequency content and the effects noted are largest
for instrumentation located at the front of the head. From Table 9, front peak forces at the front
are reduced from a mean of 8.52 N in unprotected blast trials (Scenario #1) to means of 2.24
N, 1.67 N, and 1.91 N, for protected Scenarios # 2, 3, and 4, respectively (attenuation of 74%
to 80%). In contrast, the side force increased from a mean of 3.56 N in unprotected trials
(Scenario #1) to means of 5.45 N, 5.36 N, and 5.05 N, for protected Scenarios #2, 3, and 4,
respectively (amplification of 42% to 53%). The FFT data in Figure 25 also demonstrate a shift
in spectral content towards lower frequencies for the front and back force transducers, with a
particularly substantial attenuation in frequencies in the 1000-1500 Hz range for the front force
transducer. Conversely, the side force transducers observe a shift towards more spectral
content at higher frequencies, particularly in the 1000-1500 Hz range. Similar to the analysis
of ICP signals, the normalized cumulative distribution plots in Figure 26 better illustrate this
phenomenon, showing that a greater amount of the force transducer signal is accumulated at
lower frequencies when head protection is used (Scenarios #2-4), relative to an unprotected
headform (Scenario #1). This shift in spectral content towards lower frequencies is shown as

Page | 64
a leftward shift of the normalized cumulative force. For the plot in Figure 26, between 40%
and 50% of the front force transducer spectral content is accumulated below 1000 Hz for
Scenarios #2-4, in comparison to 30% for Scenario #1. The normalized cumulative forces for
the side transducers appear to accrue more in the 1000-1500 Hz range for the protected
scenarios relative to the unprotected trials.
In Figure 23, the reader can note increases in ICP (up to 4 kPa) and force (up to 0.5 N)
that occur approximately 1 ms prior to the arrival of the incident blast. These increases have
been noted in previous trials and are due to transmission of blast energy from the charge,
downward to the ground, through the concrete at the test-site, and then into the head by way
of the support post and Hybrid III neck. Because these ICP signals do not correspond to either
the incident or ground reflected blasts, they are not considered in our analysis and discussion.
4.4.2 Impact Loading
Representative impact data for each transducer location for both the unprotected and
protected headform is shown in Figure 27 and Figure 28 for ICP and force measurements,
respectively. Peak magnitudes with means of ICP and force are tabulated in Table 10, Table
11, and Table 12 for low, medium, and high-speed impacts, respectively. Plots comparing
results (time series, FFT, and normalized cumulative measurements) for unprotected and
protected BIPED scenarios, at each transducer location, are shown in Figure 29 and Figure 30
for ICP and force data, respectively.

Page | 65
Figure 27: Representative ICP impact measurements from a medium speed impact for an
unprotected scenario (left) and protected scenario (right), showing results from each transducer
location within the surrogate brain.

Page | 66
Figure 28: Representative force data from a medium speed impact, for an unprotected scenario
(left) and protected scenario (right), showing data from each transducer location.
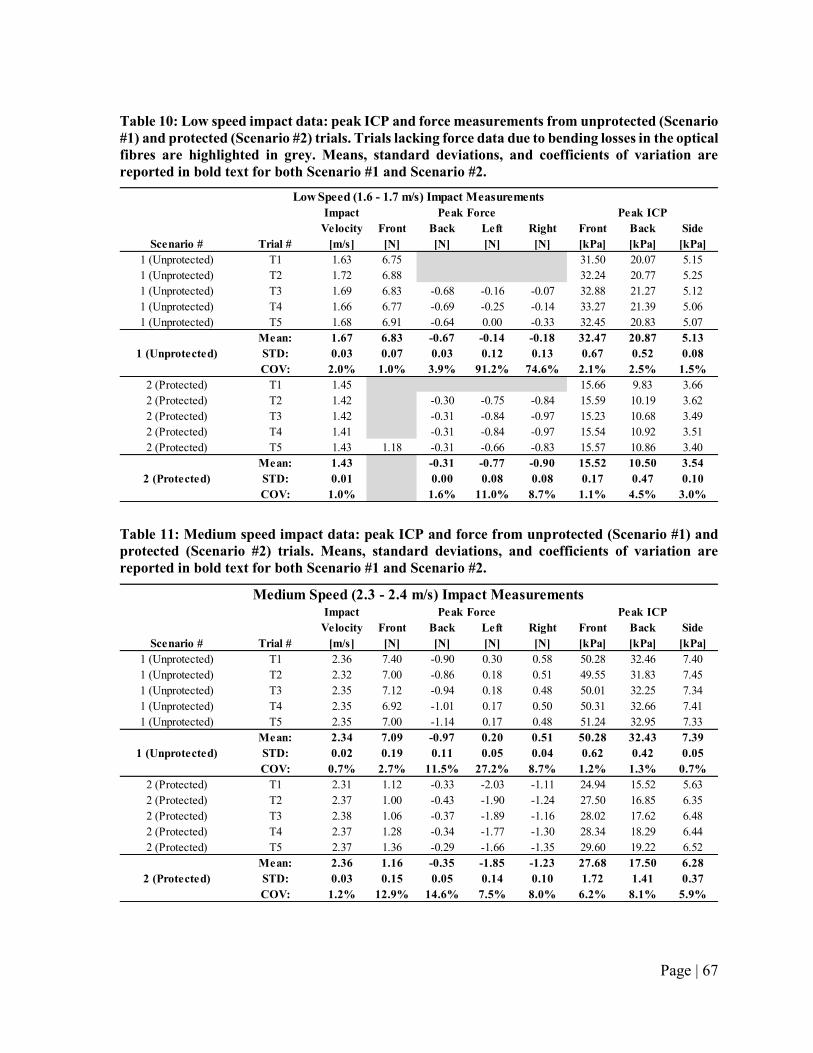
Page | 67
Table 10: Low speed impact data: peak ICP and force measurements from unprotected (Scenario
#1) and protected (Scenario #2) trials. Trials lacking force data due to bending losses in the optical
fibres are highlighted in grey. Means, standard deviations, and coefficients of variation are
reported in bold text for both Scenario #1 and Scenario #2.
Table 11: Medium speed impact data: peak ICP and force from unprotected (Scenario #1) and
protected (Scenario #2) trials. Means, standard deviations, and coefficients of variation are
reported in bold text for both Scenario #1 and Scenario #2.
Impact
Velocity Front Back Left Right Front Back Side
Scenario # Trial # [m/s] [N] [N] [N] [N] [kPa] [kPa] [kPa]
1 (Unprotected) T1 1.63 6.75 31.50 20.07 5.15
1 (Unprotected) T2 1.72 6.88 32.24 20.77 5.25
1 (Unprotected) T3 1.69 6.83 -0.68 -0.16 -0.07 32.88 21.27 5.12
1 (Unprotected) T4 1.66 6.77 -0.69 -0.25 -0.14 33.27 21.39 5.06
1 (Unprotected) T5 1.68 6.91 -0.64 0.00 -0.33 32.45 20.83 5.07
Mean: 1.67 6.83 -0.67 -0.14 -0.18 32.47 20.87 5.13
STD: 0.03 0.07 0.03 0.12 0.13 0.67 0.52 0.08
COV: 2.0% 1.0% 3.9% 91.2% 74.6% 2.1% 2.5% 1.5%
2 (Protected) T1 1.45 15.66 9.83 3.66
2 (Protected) T2 1.42 -0.30 -0.75 -0.84 15.59 10.19 3.62
2 (Protected) T3 1.42 -0.31 -0.84 -0.97 15.23 10.68 3.49
2 (Protected) T4 1.41 -0.31 -0.84 -0.97 15.54 10.92 3.51
2 (Protected) T5 1.43 1.18 -0.31 -0.66 -0.83 15.57 10.86 3.40
Mean: 1.43 -0.31 -0.77 -0.90 15.52 10.50 3.54
STD: 0.01 0.00 0.08 0.08 0.17 0.47 0.10
COV: 1.0% 1.6% 11.0% 8.7% 1.1% 4.5% 3.0%
Peak Force Peak ICP
1 (Unprotected)
2 (Protected)
Low Speed (1.6 - 1.7 m/s) Impact Measurements
Impact
Velocity Front Back Left Right Front Back Side
Scenario # Trial # [m/s] [N] [N] [N] [N] [kPa] [kPa] [kPa]
1 (Unprotected) T1 2.36 7.40 -0.90 0.30 0.58 50.28 32.46 7.40
1 (Unprotected) T2 2.32 7.00 -0.86 0.18 0.51 49.55 31.83 7.45
1 (Unprotected) T3 2.35 7.12 -0.94 0.18 0.48 50.01 32.25 7.34
1 (Unprotected) T4 2.35 6.92 -1.01 0.17 0.50 50.31 32.66 7.41
1 (Unprotected) T5 2.35 7.00 -1.14 0.17 0.48 51.24 32.95 7.33
Mean: 2.34 7.09 -0.97 0.20 0.51 50.28 32.43 7.39
STD: 0.02 0.19 0.11 0.05 0.04 0.62 0.42 0.05
COV: 0.7% 2.7% 11.5% 27.2% 8.7% 1.2% 1.3% 0.7%
2 (Protected) T1 2.31 1.12 -0.33 -2.03 -1.11 24.94 15.52 5.63
2 (Protected) T2 2.37 1.00 -0.43 -1.90 -1.24 27.50 16.85 6.35
2 (Protected) T3 2.38 1.06 -0.37 -1.89 -1.16 28.02 17.62 6.48
2 (Protected) T4 2.37 1.28 -0.34 -1.77 -1.30 28.34 18.29 6.44
2 (Protected) T5 2.37 1.36 -0.29 -1.66 -1.35 29.60 19.22 6.52
Mean: 2.36 1.16 -0.35 -1.85 -1.23 27.68 17.50 6.28
STD: 0.03 0.15 0.05 0.14 0.10 1.72 1.41 0.37
COV: 1.2% 12.9% 14.6% 7.5% 8.0% 6.2% 8.1% 5.9%
Medium Speed (2.3 - 2.4 m/s) Impact MeasurementsPeak Force Peak ICP
1 (Unprotected)
2 (Protected)

Page | 68
Table 12: High speed impact data: peak ICP and force from unprotected (Scenario #1) and
protected (Scenario #2) trials. Means, standard deviations, and coefficients of variation are
reported in bold text for both Scenario #1 and Scenario #2.
Impact
Velocity Front Back Left Right Front Back Side
Scenario # Trial # [m/s] [N] [N] [N] [N] [kPa] [kPa] [kPa]
1 (Unprotected) T1 3.31 8.11 -1.63 0.34 0.97 82.22 54.60 12.75
1 (Unprotected) T2 3.30 8.06 -1.22 0.19 0.74 81.21 53.39 11.46
1 (Unprotected) T3 3.29 8.06 -1.10 0.24 0.74 82.50 53.84 11.66
1 (Unprotected) T4 3.34 7.76 -1.28 0.26 0.86 82.06 53.66 11.73
1 (Unprotected) T5 3.30 9.18 -1.38 0.17 0.83 81.78 53.30 11.25
Mean: 3.31 8.23 -1.32 0.24 0.83 81.95 53.76 11.77
STD: 0.02 0.55 0.20 0.07 0.10 0.49 0.52 0.58
COV: 0.5% 6.7% 14.9% 27.8% 11.7% 0.6% 1.0% 4.9%
2 (Protected) T1 3.14 2.62 -0.96 -1.67 43.45 26.34 8.84
2 (Protected) T2 3.29 2.83 -1.19 -2.62 -1.68 45.00 26.50 10.11
2 (Protected) T3 3.33 2.42 -2.15 -2.77 -1.78 45.95 27.31 10.64
2 (Protected) T4 3.36 2.44 -0.15 -2.70 -1.85 47.83 28.82 10.15
2 (Protected) T5 3.43 2.52 -1.85 -2.66 -1.86 49.07 29.45 10.47
Mean: 3.31 2.57 -1.26 -2.69 -1.77 46.26 27.68 10.04
STD: 0.11 0.17 0.79 0.06 0.09 2.23 1.39 0.71
COV: 3.3% 6.5% 62.4% 2.4% 5.1% 4.8% 5.0% 7.0%
2 (Protected)
High Speed (3.3 - 3.4 m/s) Impact Measurements
Peak Force Peak ICP
1 (Unprotected)

Page | 69
Figure 29: Unprotected vs. protected BIPED impact ICP data showing ICP versus time in the
first column, spectral content from an FFT transform in the second column, and normalized
cumulative pressure in the third column. The first row shows front transducer measurements,
the second row shows side transducer measurements, and the third row shows back transducer
measurements.

Page | 70
Figure 30: Unprotected and protected BIPED impact force data. Force versus time is shown in
the first column, spectral content from an FFT transform in the second column, and normalized
cumulative force in the third column. The first row shows front transducer measurements, the
second/third rows show side transducer measurements, and the fourth row shows back
transducer measurements.

Page | 71
During impact experiments, ICP and force peaks, measured nearest the impact site
(front), are reduced by the addition of a helmet. In low speed scenarios (Table 10), peak front
ICP reduced from a mean of 32.5 kPa to 15.5 kPa with the addition of a TBH helmet (53%
reduction) and peak front force reduced from a mean of 6.83 N to 1.18 N (83% reduction). In
medium speed impacts (Table 11), peak front ICP reduced from a mean of 50.3 kPa to 27.7
kPa (45% reduction) with the addition of a TBH, and peak front force reduced from a mean of
7.09 N to a mean of 1.16 N (84% reduction). In high speed impacts (Table 12), peak front ICP
reduced from a mean of 82 kPa to a mean of 46.3 kPa with the addition of a TBH (44%
reduction), and peak front force reduced from a mean of 8.23 N to a mean of 2.57 N (69%
reduction). Data from the back ICP transducer indicates decreases in pressure magnitudes with
the addition of helmet. However, the side ICP transducer measurements do not indicate any
systematic trend that could be attributed to the presence of head protection. In contrast, specific
to force data (Table 10, Table 11, Table 12), the back sensor did not exhibit trends of force
reduction with the addition of a helmet. However, data from side located force transducers
showed amplification of force with the addition of a TBH.
ICP data for impact experiments do not exhibit shifts in spectral content with the addition
of a helmet. The normalized cumulative pressures shown in Figure 29 suggest that for pressure
data, both protected and unprotected, over 70% of the accumulation resides between 0 Hz and
100 Hz. Force data did exhibit alteration in the accumulation of force amplitude between the
cases of unprotected and protected BIPEDs (Figure 30). Relative to an unprotected BIPED, the
protected BIPED, for left and right located force transducer data, accumulates more amplitude
at lesser frequencies. Data for front located force transducers suggests that the accumulation
of amplitude with frequency is unaffected by the presence (or absence) of head protection.
Force data associated with the back of the head suggests the unprotected BIPED accumulates
amplitude at lower frequencies than the protected BIPED. Figure 30 shows a shift in the force
cumulative frequency distribution plots for the unprotected scenarios, in particular the left and
right located transducers, and the tendency is that head protection shifts mechanics to lower
frequencies than when the head is not protected. Front and back located transducer
measurements convey shift to higher frequencies when the head is protected.

Page | 72
4.5 Discussion
Using a repeatable simulant-based surrogate headform, instrumented with transducers
capable of measuring pressure within the brain parenchyma and forces on the inner table of the
skull, the results of this work suggest that head protection can be associated with overall
reductions in pressures and forces. The surrogate, with novel instrumentation, and the data
presented are the first that document forces, along with pressure within the brain, and the
effects that adding head protection has on these measures in blast and impact loading. In both
blast and impact, the overall trend is that peak pressures and peak forces are lesser for a
protected head relative to an unprotected head.
Free-field blast experiments using 5 kg C4 charges at a 5 m standoff produced repeatable
blast loading overpressures measured on the outer surface of the BIPED. Between trials and
within a given protection scenario, variation in measured overpressure on the head exterior
was generally less than 10%. Relative to the alterations in peak pressures and peak forces in
the cranial vault, associated with the addition of head protection, which in some cases were
50% (pressure) and 80% (force), 10% variation is relatively small. Further, as shown in Table
7, while there was typically 10% variation (or less) in external pressure data within a given
group of data for a given protection scenario, the variations in external pressures between
protection scenarios were as high as 50% (reduced, relative to an unprotected BIPED).
Consequently, we speculate that the alterations in force and pressure that are noted in the
presence of head protection can be associated with the head protection, as opposed to non-
repeatability in loading between trials. Therefore, we argue that the blast loading conditions
were repeatable and further that the BIPED is capable of detecting alteration in the loading of
the head exterior due to the presence of head protection.
The overarching trend is that relative to an unprotected BIPED, head protection could be
associated with attenuation of peak metrics. The majority of attenuation occurs for the
transducer locations closest to the loading site, with peak forces at the front location attenuated
by as much as 84% and peak pressures at the front location within the surrogate brain
attenuated by as much as 53%. In contrast, back and side ICP transducer measurements were
altered less, and the side force transducer measurements appeared to be amplified. We
speculate the increased forces observed on the side of the skull when adding head protection

Page | 73
could explain why the side ICP measurements were not attenuated in the presence of head
protection. This may indicate that adding head protection alters the mode of skull flexure [151]
and increases the amount of lateral skull deformation under frontal blast loading, which results
in increased lateral skull-brain interaction forces.
The measurements from the BIPED also suggest that the addition of headgear alters the
frequency content of mechanics experienced in the brain. For blast, Figure 24 shows that higher
frequencies are attenuated for the front ICP transducer, particularly in the 1500 Hz to 2000 Hz
range. Figure 25 also indicates attenuation for the front force transducer data, particularly in
the 1000 Hz to 1500 Hz range, but there is also attenuation from 800 Hz to 900 Hz. There
appears to be a shift in spectral content with the addition of protective headgear, in which lower
frequency peaks (observed below 600 Hz) are amplified while higher frequencies are
attenuated (Figure 24 and Figure 25). The shift in spectral content is demonstrated in Figure
26 where the normalized cumulative plots for the front ICP and force transducers accrue more
amplitude at lower frequencies for the protected scenarios relative to the unprotected scenarios
(observed as a leftward shift in the top two plots). Findings were mixed for instrumentation
located at the side and back of the head; in some cases the protected head accrued amplitude
at lesser frequencies, and in some cases greater, relative to the unprotected head. Figure 29 and
Figure 30 convey that relative to blast, alteration in frequency content due to head protection
was relatively lesser for impact.
ICP signals are significantly lower in comparison to the external overpressures (Figure
24 shows data from various protection scenarios and transducer locations), indicating that
energy attenuation occurs as the blast wave propagates through several materials (surrogate
scalp, skull, membranes, CSF, and then brain). Figure 23 shows that the most significant ICP
fluctuations occur shortly after the arrival of the incident wave, and again approximately 2 ms
later after the arrival of the ground reflection wave. Front ICP measurements, shown in Table
8, are approximately 20-40% of the front external pressure transducer, with a mean of 72.5 kPa
for the front ICP transducer in an unprotected case (Scenario #1), and means of 45.2 kPa, 37.0
kPa, and 50.0 kPa for protected cases (Scenarios #2,3, and 4, respectively).
In blast experiments, both ICP and force transducers measured negative pressures and
forces following positive values occurring earlier in the pressure-time and force-time data,

Page | 74
despite a positive overpressure on the external head form. Arguably, this finding could be
construed as counter-intuitive. In this study, ICP signals are observed to be as low as -40.5 kPa
for blast and were not negative for impact. Inner table forces are observed to be as low as -6.2
N for blast and -2.2 N for impact. Negative pressures within the cranial vault have been
measured in other work using cadavers, under blast loading, and computed in numerical
simulations [65,75], in which it is suggested that skull flexure may be a mechanism through
which negative pressures are created and cavitation in fluid occurs. While the thresholds of
negative pressures that can lead to brain injury through cavitation in humans are not yet agreed
upon, and indeed cavitation as a contributor to brain injury is arguably as yet unproven, the
BIPED could be capable of quantifying negative valued pressure and force. While skull flexure
and resonance have been studied in detail for the BIPED [151], further study is needed to
ascertain whether or not the BIPED measurements are accurate in relation to cavitation
mechanics.
For the impact loading conditions we subject the BIPED to, the ICP data exhibit
similarities to what has been published for experimental cadaveric and numerical simulations.
A study on blunt impact to human cadaver heads reports coup and counter-coup pressures at
velocities of 3 to 4 m/s [17], using a football helmet for head protection. They found mean
peak coup pressures of 58 21.9 kPa (mean standard deviation) for a helmeted cadaver head,
and 68.1 47.6 kPa for mean peak coup pressures for an unhelmeted cadaver. Impact pressure
pulse widths varied significantly but were typically between 5 to 35 ms duration. ICP and force
versus time data from the BIPED exhibit similar pulse widths (approximately 10 to 20 ms for
most trials) to the average cadaveric results. Peak frontal ICPs of 82.0 kPa without a helmet
and 46.3 kPa with a combat helmet were observed within the BIPED for the high speed impact
scenario (3.3 – 3.4 m/s), which are within the pressure ranges observed during the previous
cadaveric study, for a similar impact velocity. Another study reconstructed NFL player impacts
that resulted in cases of mTBI and simulated, using finite-elements, ICP responses to be 90
24 kPa for injury cases, and 61 17 kPa for non-injury cases [175]. Based on their findings,
the high speed results from our study are comparable to the range of simulated ICP responses
from reconstructed impact scenarios that have induced mTBI in professional athletes.

Page | 75
The BIPED surrogate model used in this study demonstrates repeatability in both impact
and blast measurements in both unprotected and protected scenarios. The measured ICP and
force signals report similar peak results and fluctuations, and capture similar spectral profiles
for trials of the same protection scenario. For high speed impact experiments, peak front force
signals and peak front ICP signals had coefficients of variation (COV) less than 7% in both
protected (n = 5) and unprotected scenarios (n = 5), which is lesser than the variation of peak
measurements observed within cadaveric tissue. Impact pulse widths (calculated based on the
initial impact signal width at 20% of the peak value, reported in a cadaver study by Hardy et
al. 2007 [17]) are also significantly more repeatable in the BIPED compared to experiments
with post mortem human subjects [17], with COV for ICP and force pulse widths less than
12% for each impact scenario.
We noted important differences in the forces measured at the inner table when comparing
impact results to blast results. During impact, force transducers at the side and back of the head
measure negative values, while at the front of the head measure positive values. The time-
duration of these forces (nominally 20 ms) are approximately the same when comparing front
located sensors to all other locations. The negative valued forces could be interpreted to suggest
that the separation between the inner table and simulant brain increases as the impact event
occurs causing net reduction in the amount of force that the brain exerts on the skull. The
separation could be due to either motion of the brain relative to the skull (while the skull
geometry is unchanged), or flexure of the skull toward or away from the brain, or a combination
of both. The positive increasing forces at the front could be due to the brain compressing the
skull due to relative motion, or skull flexure leading the skull to press against the brain, or both.
In blast, the force data exhibits high frequency sign reversal in force magnitude, at timescales
lesser than 3 ms, and these sign reversals appear at all locations. It is arguably plausible that
skull-brain motion and or skull flexure be responsible for the sign reversals measured. Detailed
examinations in previous studies suggest that for blast, these sign reversals correspond to skull
flexure mechanics [151]. In future work, we will attempt to ascertain whether the mechanics-
based explanation offered above for the BIPED in impact is valid, and if it is, the relative
contributions of skull flexure or relative motion between the skull-brain in the force versus
time data to ascertain which mechanism dominates. Strain sensors, that are mounted to the

Page | 76
skull and co-located with force transducers, could transduct skull flexure and allow us to
ascertain the proportional contribution that skull flexure has on energy transfer in impact and
blast loading to the BIPED.
The findings in this study, as with any study that involves a surrogate model, are subject
to limitations and may not be indicative of how a human head would respond under the same
loading conditions. While the BIPED has been shown to measure similar ICP magnitudes and
fluctuation durations to a cadaver headform under a specific set of blast loading conditions
[66], this does not imply that the BIPED will respond equally to a human head in other loading
scenarios such as the free-field blast conditions and the impact loading conditions we tested in
this study. In addition, the Hybrid III neck arguably may not be an appropriate model of the
human neck for blast. It is often criticized as possessing too great a mechanical stiffness and
researchers have speculated the stiffness may lead to head kinematics that are unrealistic
relative to the living human, specifically in blunt impact [168,169]. Because the Hybrid III
neck has not been characterized or designed for applications in blast, we acknowledge that it
could be a poor model for application in blast and further that the findings of our study could
be different if neck mechanics are altered. In our study, we reduced flexion-extension neck
stiffness for blast experiments (Scenario #4) and observed greater peak ICP and skull-brain
forces relative to Scenario #3 (relative stiffer neck), suggesting that neck mechanics may have
affect energy transferred into the BIPED. For both blast and impact experiments in this study,
the loading into the head was always frontal. Further experiments would be needed to assess
whether head protection leads to reductions in mechanics in other loading directions. Future
work could also involve testing secondary blast injury due to ballistic/projectile threats from
debris/shrapnel [150].
In this work, we quantify mechanical measures of forces on the inner table and pressure
within the parenchyma of a simulant-based surrogate headform subjected to blast and impact
loading. Our results suggest that adding head protection can attenuate the measured mechanics
relative to the case when the surrogate model is unprotected. Head protection had the greatest
effect on measurements nearest to the site of blast/impact loading, with front forces attenuated
by as much as 80% under blast loading and 84% under impact loading, and front ICP signals
attenuated by as much as 49% under blast loading and 53% under impact loading. Additionally,

Page | 77
results for forces and pressures (measured at the head front) for a helmeted head demonstrate
propensity towards more spectral content at lower frequencies, relative to an unprotected head.
It is premature to ascribe definitive statements regarding mitigation of brain injury risk based
on our mechanical measures. However, it is possible that with further biomechanical research
that elucidates how mechanics relates to injury likelihood in blast and impact, that
measurements like those presented here could indicate whether or not protective headgear
offers net protective effects to military personnel exposed to blasts and impacts.

Page | 78
Chapter 5: Conclusions
5.1 Contributions
The primary goals of this thesis were to develop a transducer for measuring forces on
the inner skull table during high-rate loading scenarios and to apply this novel technology
towards investigating the effect of head protection on the transmissions of blast and impact
energy imparted to the head and brain. The main contributions of this thesis work are outlined
below:
1. A novel force transducer was developed to make the first measurements of inner skull
kinetics during both impact and blast loading scenarios. These transducers are
repeatable tools that, when integrated into the BIPED, can be applied towards the
evaluation of headgear by inferring the relative efficacy at mitigating energy
transmission into the head and brain.
2. The BIPED and embedded instrumentation were applied to blast and impact loading
scenarios to document the attenuation of peak internal mechanics, as well as the shift
in spectral frequencies, for various protection conditions. There is limited
biomechanical data in the literature on the effect of protective headgear on skull-brain
kinetics during blast and impact, and therefore these results are an important
contribution towards documenting how the skull and brain react under blast and impact
loading for a protected head relative to an unprotected head.
3. The BIPED is demonstrated to be a repeatable model for impact loading conditions, in
addition to blast. This is an important step towards having an all-encompassing bTBI
evaluation device, in which the surrogate headform can be used for evaluating multiple
bTBI mechanisms. Prior to this study, blast headforms were only applied towards the
investigation of primary blast effects. This work presents the first demonstration of a
biofidelic surrogate headform that has been applied towards both primary and tertiary
blast loading scenarios.
Overall, the results in this work suggest that protective headgear alters the transmission of
blast and impact energy into the head and brain. These results should not be construed to
indicate any efficacy or deficiency of the protective headgear that was used.

Page | 79
5.2 Future Work and Recommendations
There are many opportunities for this work to be continued. The BIPED has been
shown to measure similar ICP magnitudes and frequencies to a cadaver head under primary
blast conditions [66], however validation experiments have not yet been performed for impact
or ballistic loading scenarios. For both blast and impact experiments in this work, the loading
orientation has always been frontal. Future work could assess the response of the BIPED and
the effect of protective headgear on internal mechanics for other loading orientations. The
Hybrid III neck was used during this study and is widely employed amongst blunt impact injury
research; however, the Hybrid III neck is often criticized for having far greater mechanical
stiffness than a human neck. It has been postulated that increased neck stiffness can lead
towards unrealistic mechanics in the surrogate model relative to the human head, specifically
during blunt impact [168,169]. We acknowledge that the Hybrid III may not be an appropriate
model for blast, and future work could employ a more biofidelic neck model towards the
assessment of the BIPED and protective headgear under blast. Forthcoming work could also
investigate the effect of protective headgear on internal mechanics within the BIPED, along
with the repeatability of the surrogate model, under secondary bTBI loading scenarios (e.g.
ballistic exposure to shrapnel or other projectile threats).
In the current state of biomechanics research, it is premature to declare any definitive
statements regarding injury risk based on the mechanical measures presented in this thesis.
Further research on this topic can clarify how these mechanical measures relate to brain injury
likelihood during blast and impact events, allowing measurements like what is presented here
to indicate whether or not protective headgear can mitigate the risk of bTBI. All of the above-
mentioned future work presented in this section provides an opportunity to further develop a
complete head protection assessment paradigm against blast, which can ultimately be
employed towards reducing the occurrence of bTBI.

Page | 80
References
[1] David W. Wright, 2013, “CDC Grand Rounds: Reducing Severe Traumatic Brain Injury
in the United States,” Cent. Dis. Control Prev., 62(27), pp. 549–552.
[2] Seifert, J., 2007, “Incidence and Economic Burden of Injuries in the United States,” J.
Epidemiol. Community Health, 61(10), p. 926.
[3] Ling, G. S. F., and Ecklund, J. M., 2011, “Traumatic Brain Injury in Modern War,” Curr.
Opin. Anaesthesiol., 24(2), pp. 124–130.
[4] Wilk, J. E., Thomas, J. L., McGurk, D. M., Riviere, L. A., Castro, C. A., and Hoge, C.
W., 2010, “Mild Traumatic Brain Injury (Concussion) during Combat: Lack of
Association of Blast Mechanism with Persistent Postconcussive Symptoms,” J. Head
Trauma Rehabil., 25(1), pp. 9–14.
[5] Morey, R. A., Haswell, C. C., Selgrade, E. S., Massoglia, D., Liu, C., Weiner, J., Marx,
C. E., MIRECC Work Group, Cernak, I., and McCarthy, G., 2013, “Effects of Chronic
Mild Traumatic Brain Injury on White Matter Integrity in Iraq and Afghanistan War
Veterans,” Hum. Brain Mapp., 34(11), pp. 2986–2999.
[6] Cernak, I., and Noble-Haeusslein, L. J., 2010, “Traumatic Brain Injury: An Overview
of Pathobiology with Emphasis on Military Populations,” J. Cereb. Blood Flow Metab.
Off. J. Int. Soc. Cereb. Blood Flow Metab., 30(2), pp. 255–266.
[7] MacGregor, A. J., Dougherty, A. L., and Galarneau, M. R., 2011, “Injury-Specific
Correlates of Combat-Related Traumatic Brain Injury in Operation Iraqi Freedom,” J.
Head Trauma Rehabil., 26(4), pp. 312–318.
[8] Terrio, H., Brenner, L. A., Ivins, B. J., Cho, J. M., Helmick, K., Schwab, K., Scally, K.,
Bretthauer, R., and Warden, D., 2009, “Traumatic Brain Injury Screening: Preliminary
Findings in a US Army Brigade Combat Team,” J. Head Trauma Rehabil., 24(1), pp.
14–23.
[9] Polusny, M. A., Kehle, S. M., Nelson, N. W., Erbes, C. R., Arbisi, P. A., and Thuras, P.,
2011, “Longitudinal Effects of Mild Traumatic Brain Injury and Posttraumatic Stress
Disorder Comorbidity on Postdeployment Outcomes in National Guard Soldiers
Deployed to Iraq,” Arch. Gen. Psychiatry, 68(1), pp. 79–89.
[10] Nelson, N. W., Davenport, N. D., Sponheim, S. R., and Anderson, C. R., 2015, “Blast-
Related Mild Traumatic Brain Injury: Neuropsychological Evaluation and Findings,”
Brain Neurotrauma: Molecular, Neuropsychological, and Rehabilitation Aspects, F.H.
Kobeissy, ed., CRC Press/Taylor & Francis, Boca Raton (FL).
[11] Jones, E., 2007, “Shell Shock and Mild Traumatic Brain Injury: A Historical Review,”
The American Journal of Psychiatry, 164(11), pp. 1641–1645.
[12] Belmont, P. J., Goodman, G. P., Zacchilli, M., Posner, M., Evans, C., and Owens, B. D.,
2010, “Incidence and Epidemiology of Combat Injuries Sustained during ‘the Surge’
Portion of Operation Iraqi Freedom by a U.S. Army Brigade Combat Team,” J. Trauma,
68(1), pp. 204–210.

Page | 81
[13] Bass, C. R., Panzer, M. B., Rafaels, K. A., Wood, G., Shridharani, J., and Capehart, B.,
2012, “Brain Injuries from Blast,” Ann. Biomed. Eng., 40(1), pp. 185–202.
[14] Fievisohn, E., Bailey, Z., Guettler, A., and VandeVord, P., 2018, “Primary Blast Brain
Injury Mechanisms: Current Knowledge, Limitations, and Future Directions,” J.
Biomech. Eng., 140(2).
[15] Committee on Review of Test Protocols Used by the DoD to Test Combat Helmets,
Board on Army Science and Technology, Division on Engineering and Physical
Sciences, and National Research Council, 2014, Review of Department of Defense Test
Protocols for Combat Helmets, National Academies Press (US), Washington (DC).
[16] Fournier, E., David Sullivan, Bayne, T., and Nicholas Shewchenko, 2007, “Blast
Headform Development.”
[17] Hardy, W. N., Mason, M. J., Foster, C. D., Shah, C. S., Kopacz, J. M., Yang, K. H.,
King, A. I., Bishop, J., Bey, M., Anderst, W., and Tashman, S., 2007, “A Study of the
Response of the Human Cadaver Head to Impact,” Stapp Car Crash J., 51, p. 17.
[18] Sone, J. Y., Kondziolka, D., Huang, J. H., and Samadani, U., 2016, “Helmet Efficacy
against Concussion and Traumatic Brain Injury: A Review,” J. Neurosurg., 126(3), pp.
768–781.
[19] Breeze, J., Baxter, D., Carr, D., and Midwinter, M. J., 2015, “Defining Combat Helmet
Coverage for Protection against Explosively Propelled Fragments,” J. R. Army Med.
Corps, 161(1), pp. 9–13.
[20] Nakatsuka, A. S., and Yamamoto, L. G., 2014, “External Foam Layers to Football
Helmets Reduce Head Impact Severity,” Hawaii J. Med. Public Health, 73(8), pp. 256–
261.
[21] Delaney, J. S., Al-Kashmiri, A., Drummond, R., and Correa, J. A., 2008, “The Effect of
Protective Headgear on Head Injuries and Concussions in Adolescent Football (Soccer)
Players,” Br. J. Sports Med., 42(2), pp. 110–115; discussion 115.
[22] Haider, A. H., Saleem, T., Bilaniuk, J. W., and Barraco, R. D., 2012, “An Evidence
Based Review: Efficacy of Safety Helmets in Reduction of Head Injuries in Recreational
Skiers and Snowboarders,” J. Trauma Acute Care Surg., 73(5), pp. 1340–1347.
[23] Taber, K. H., Warden, D. L., and Hurley, R. A., 2006, “Blast-Related Traumatic Brain
Injury: What Is Known?,” J. Neuropsychiatry Clin. Neurosci., 18(2), pp. 141–145.
[24] Mayorga, M. A., 1997, “The Pathology of Primary Blast Overpressure Injury,”
Toxicology, 121(1), pp. 17–28.
[25] Rigby, S. E., Tyas, A., Bennett, T., Clarke, S. D., and Fay, S. D., 2014, “The Negative
Phase of the Blast Load,” Int. J. Prot. Struct., 5(1), pp. 1–19.
[26] Westrol, M. S., Donovan, C. M., and Kapitanyan, R., 2017, “Blast Physics and
Pathophysiology of Explosive Injuries,” Ann. Emerg. Med., 69(1S), pp. S4–S9.
[27] CombatHelmets, C. on R. of T. P. U. by the D. to T., Technology, B. on A. S. and,
Sciences, D. on E. and P., and Council, N. R., 2014, Threats, Head Injuries, and Test
Methodologies, National Academies Press (US).

Page | 82
[28] BlastExposures, C. on G. W. and H. L.-T. E. of, Populations, B. on the H. of S., and
Medicine, I. of, 2014, Pathophysiology of Blast Injury and Overview of Experimental
Data, National Academies Press (US).
[29] DePalma, R. G., Burris, D. G., Champion, H. R., and Hodgson, M. J., 2005, “Blast
Injuries,” N. Engl. J. Med., 352(13), pp. 1335–1342.
[30] Ramasamy, A., Hill, A. M., Masouros, S., Gibb, I., Phillip, R., Bull, A. M. J., and
Clasper, J. C., 2013, “Outcomes of IED Foot and Ankle Blast Injuries,” J. Bone Joint
Surg. Am., 95(5), p. e25.
[31] Stocchetti, N., and Zanier, E. R., 2016, “Chronic Impact of Traumatic Brain Injury on
Outcome and Quality of Life: A Narrative Review,” Crit. Care, 20(148).
[32] Feigin, V. L., Theadom, A., Barker-Collo, S., Starkey, N. J., McPherson, K., Kahan, M.,
Dowell, A., Brown, P., Parag, V., Kydd, R., Jones, K., Jones, A., Ameratunga, S., and
BIONIC Study Group, 2013, “Incidence of Traumatic Brain Injury in New Zealand: A
Population-Based Study,” Lancet Neurol., 12(1), pp. 53–64.
[33] Nolan, S., 2005, “Traumatic Brain Injury: A Review,” Crit. Care Nurs. Q., 28(2), pp.
188–194.
[34] Hicks, R. R., Fertig, S. J., Desrocher, R. E., Koroshetz, W. J., and Pancrazio, J. J., 2010,
“Neurological Effects of Blast Injury,” J. Trauma, 68(5), pp. 1257–1263.
[35] Hurley, R. A., McGowan, J. C., Arfanakis, K., and Taber, K. H., 2004, “Traumatic
Axonal Injury: Novel Insights into Evolution and Identification,” J. Neuropsychiatry
Clin. Neurosci., 16(1), pp. 1–7.
[36] McAllister, T. W., Sparling, M. B., Flashman, L. A., and Saykin, A. J., 2001,
“Neuroimaging Findings in Mild Traumatic Brain Injury,” J. Clin. Exp. Neuropsychol.,
23(6), pp. 775–791.
[37] Monea, A. G., Baeck, K., Verbeken, E., Verpoest, I., Sloten, J. V., Goffin, J., and
Depreitere, B., 2014, “The Biomechanical Behaviour of the Bridging Vein – Superior
Sagittal Sinus Complex with Implications for the Mechanopathology of Acute Subdural
Haematoma,” J. Mech. Behav. Biomed. Mater., 32, pp. 155–165.
[38] Pearce, C. W., and Young, P. G., 2014, “On the Pressure Response in the Brain Due to
Short Duration Blunt Impacts,” PLOS ONE, 9(12), p. e114292.
[39] Ward, C., Chan, M., and Nahum, A., 1980, “Intracranial Pressure–A Brain Injury
Criterion.”
[40] Kenner, V. H., and Goldsmith, W., 1973, “Impact on a Simple Physical Model of the
Head,” J. Biomech., 6(1), pp. 1–11.
[41] Freitas, C. J., Mathis, J. T., Scott, N., Bigger, R. P., and MacKiewicz, J., 2014, “Dynamic
Response Due to Behind Helmet Blunt Trauma Measured with a Human Head
Surrogate,” Int. J. Med. Sci., 11(5), pp. 409–425.
[42] Säljö, A., Svensson, B., Mayorga, M., Hamberger, A., and Bolouri, H., 2009, “Low-
Level Blasts Raise Intracranial Pressure and Impair Cognitive Function in Rats,” J.
Neurotrauma, 26(8), pp. 1345–1352.

Page | 83
[43] Owens, B. D., Kragh, J. F., Wenke, J. C., Macaitis, J., Wade, C. E., and Holcomb, J. B.,
2008, “Combat Wounds in Operation Iraqi Freedom and Operation Enduring Freedom,”
J. Trauma, 64(2), pp. 295–299.
[44] Warden, D., 2006, “Military TBI during the Iraq and Afghanistan Wars,” J. Head
Trauma Rehabil., 21(5), pp. 398–402.
[45] Elder, G. A., Mitsis, E. M., Ahlers, S. T., and Cristian, A., 2010, “Blast-Induced Mild
Traumatic Brain Injury,” Psychiatr. Clin. North Am., 33(4), pp. 757–781.
[46] Clemedson, C. J., and Pettersson, H., 1956, “Propagation of a High Explosive Air Shock
Wave through Different Parts of an Animal Body,” Am. J. Physiol., 184(1), pp. 119–
126.
[47] Bauman, R. A., Ling, G., Tong, L., Januszkiewicz, A., Agoston, D., Delanerolle, N.,
Kim, Y., Ritzel, D., Bell, R., Ecklund, J., Armonda, R., Bandak, F., and Parks, S., 2009,
“An Introductory Characterization of a Combat-Casualty-Care Relevant Swine Model
of Closed Head Injury Resulting from Exposure to Explosive Blast,” J. Neurotrauma,
26(6), pp. 841–860.
[48] Säljö, A., Arrhén, F., Bolouri, H., Mayorga, M., and Hamberger, A., 2008,
“Neuropathology and Pressure in the Pig Brain Resulting from Low-Impulse Noise
Exposure,” J. Neurotrauma, 25(12), pp. 1397–1406.
[49] Xydakis, M. S., Mulligan, L. P., Smith, A. B., Olsen, C. H., Lyon, D. M., and Belluscio,
L., 2015, “Olfactory Impairment and Traumatic Brain Injury in Blast-Injured Combat
Troops: A Cohort Study,” Neurology, 84(15), pp. 1559–1567.
[50] Choi, C.-H., 2012, “Mechanisms and Treatment of Blast Induced Hearing Loss,” Korean
J. Audiol., 16(3), pp. 103–107.
[51] Shupak, A., Doweck, I., Nachtigal, D., Spitzer, O., and Gordon, C. R., 1993, “Vestibular
and Audiometric Consequences of Blast Injury to the Ear,” Arch. Otolaryngol. Neck
Surg., 119(12), pp. 1362–1367.
[52] Williams, S. T., Harding, T. H., Statz, J. K., and Martin, J. S., 2017, “Blast Wave
Dynamics at the Cornea as a Function of Eye Protection Form and Fit,” Mil. Med.,
182(S1), pp. 226–229.
[53] Weichel, E. D., Colyer, M. H., Bautista, C., Bower, K. S., and French, L. M., 2009,
“Traumatic Brain Injury Associated with Combat Ocular Trauma,” J. Head Trauma
Rehabil., 24(1), pp. 41–50.
[54] Choi, J. H., Greene, W. A., Johnson, A. J., Chavko, M., Cleland, J. M., McCarron, R.
M., and Wang, H.-C., 2015, “Pathophysiology of Blast-Induced Ocular Trauma in Rats
after Repeated Exposure to Low-Level Blast Overpressure,” Clin. Experiment.
Ophthalmol., 43(3), pp. 239–246.
[55] Wang, H.-C. H., Choi, J.-H., Greene, W. A., Plamper, M. L., Cortez, H. E., Chavko, M.,
Li, Y., Dalle Lucca, J. J., and Johnson, A. J., 2014, “Pathophysiology of Blast-Induced
Ocular Trauma with Apoptosis in the Retina and Optic Nerve,” Mil. Med., 179(8 Suppl),
pp. 34–40.

Page | 84
[56] Dal Cengio Leonardi, A., Keane, N. J., Hay, K., Ryan, A. G., Bir, C. A., and VandeVord,
P. J., 2013, “Methodology and Evaluation of Intracranial Pressure Response in Rats
Exposed to Complex Shock Waves,” Ann. Biomed. Eng., 41(12), pp. 2488–2500.
[57] Bolander, R., Mathie, B., Bir, C., Ritzel, D., and VandeVord, P., 2011, “Skull Flexure
as a Contributing Factor in the Mechanism of Injury in the Rat When Exposed to a Shock
Wave,” Ann. Biomed. Eng., 39(10), pp. 2550–2559.
[58] Moss, W., King, M., and Blackman, E., 2009, “Skull Flexure from Blast Waves: A
Mechanism for Brain Injury with Implications for Helmet Design,” Phys. Rev. Lett.,
103(10).
[59] Libertiaux, V., Pascon, F., and Cescotto, S., 2011, “Experimental Verification of Brain
Tissue Incompressibility Using Digital Image Correlation,” J. Mech. Behav. Biomed.
Mater., 4(7), pp. 1177–1185.
[60] Garimella, H. T., Kraft, R. H., and Przekwas, A. J., 2018, “Do Blast Induced Skull
Flexures Result in Axonal Deformation?,” PLOS ONE, 13(3), p. e0190881.
[61] Vandevord, P. J., Bolander, R., Sajja, V. S. S. S., Hay, K., and Bir, C. A., 2012, “Mild
Neurotrauma Indicates a Range-Specific Pressure Response to Low Level Shock Wave
Exposure,” Ann. Biomed. Eng., 40(1), pp. 227–236.
[62] Sajja, V. S. S. S., Galloway, M., Ghoddoussi, F., Kepsel, A., and VandeVord, P., 2013,
“Effects of Blast-Induced Neurotrauma on the Nucleus Accumbens,” J. Neurosci. Res.,
91(4), pp. 593–601.
[63] Sajja, V. S. S. S., Ereifej, E. S., and VandeVord, P. J., 2014, “Hippocampal Vulnerability
and Subacute Response Following Varied Blast Magnitudes,” Neurosci. Lett., 570, pp.
33–37.
[64] Kamnaksh, A., Kovesdi, E., Kwon, S.-K., Wingo, D., Ahmed, F., Grunberg, N. E.,
Long, J., and Agoston, D. V., 2011, “Factors Affecting Blast Traumatic Brain Injury,”
J. Neurotrauma, 28(10), pp. 2145–2153.
[65] Salzar, R. S., Treichler, D., Wardlaw, A., Weiss, G., and Goeller, J., 2017,
“Experimental Investigation of Cavitation as a Possible Damage Mechanism in Blast-
Induced Traumatic Brain Injury in Post-Mortem Human Subject Heads,” J.
Neurotrauma, 34(8), pp. 1589–1602.
[66] Ouellet, S., Bir, C., and Bouamoul, A., 2014, “Direct Comparison of the Primary Blast
Response of a Physical Head Model with Post-Mortem Human Subjects,” Cambridge,
UK.
[67] Wang, C., Pahk, J. B., Balaban, C. D., Miller, M. C., Wood, A. R., and Vipperman, J.
S., 2014, “Computational Study of Human Head Response to Primary Blast Waves of
Five Levels from Three Directions,” PLoS ONE, 9(11).
[68] Cernak, I., Wang, Z., Jiang, J., Bian, X., and Savic, J., 2001, “Ultrastructural and
Functional Characteristics of Blast Injury-Induced Neurotrauma,” J. Trauma, 50(4), pp.
695–706.
Page | 85
[69] Long, J. B., Bentley, T. L., Wessner, K. A., Cerone, C., Sweeney, S., and Bauman, R.
A., 2009, “Blast Overpressure in Rats: Recreating a Battlefield Injury in the
Laboratory,” J. Neurotrauma, 26(6), pp. 827–840.
[70] Simard, J. M., Pampori, A., Keledjian, K., Tosun, C., Schwartzbauer, G., Ivanova, S.,
and Gerzanich, V., 2014, “Exposure of the Thorax to a Sublethal Blast Wave Causes a
Hydrodynamic Pulse That Leads to Perivenular Inflammation in the Brain,” J.
Neurotrauma, 31(14), pp. 1292–1304.
[71] Assari, S., Laksari, K., Barbe, M., and Darvish, K., 2013, “Cerebral Blood Pressure Rise
During Blast Exposure in a Rat Model of Blast-Induced Traumatic Brain Injury,” San
Diego, California, USA, p. V03AT03A016.
[72] Goldberg, M. S., 2010, “Death and Injury Rates of U.S. Military Personnel in Iraq,” Mil.
Med., 175(4), pp. 220–226.
[73] A Breeze, 2011, “The Face of War: The Initial Management of Modern Battlefield
Ballistic Facial Injuries,” Journal of Military and Veterans’ Health, 19(2).
[74] Wood, G. W., Panzer, M. B., Shridharani, J. K., Matthews, K. A., Capehart, B. P.,
Myers, B. S., and Bass, C. R., 2013, “Attenuation of Blast Pressure behind Ballistic
Protective Vests,” Inj. Prev. J. Int. Soc. Child Adolesc. Inj. Prev., 19(1), pp. 19–25.
[75] Goeller, J., Wardlaw, A., Treichler, D., O’Bruba, J., and Weiss, G., 2012, “Investigation
of Cavitation as a Possible Damage Mechanism in Blast-Induced Traumatic Brain
Injury,” J. Neurotrauma, 29(10), pp. 1970–1981.
[76] Ouellet, S., and Philippens, M., 2018, “The Multi-Modal Responses of a Physical Head
Model Subjected to Various Blast Exposure Conditions,” Shock Waves, 28(1), pp. 19–
36.
[77] S.G.M. Hossain, 2010, “Material Modeling and Analysis for the Development of a
Realistic Blast Headform,” University of Nebraska at Lincoln.
[78] Roberts, J., Harrigan, T., Ward, E., Taylor, T., Annett, M., and Merkle, A., 2012,
“Human Head-Neck Computational Model for Assessing Blast Injury,” J. Biomech., 45,
pp. 2899–2906.
[79] U.S. Army, 2018, “WIAMan Blast Manikin” [Online]. Available:
https://www.dtsweb.com/wiaman-blast-manikin/. [Accessed: 15-Oct-2018].
[80] Eyitejumade A. Sogbesan, 2011, “Design and Analysis of Blast Induced Traumatic
Brain Injury Mechanism Using a Surrogate Headform: Instrumentation and Outcomes,”
University of Nebraska-Lincoln.
[81] S Ouellet, Bouamoul, A., R. Gauvin, Binette, J. S., K.V. Williams, and L. Martineau,
2012, “Development of a Biofidelic Head Surrogate for Blast-Induced Traumatic Brain
Injury Assessment.”
[82] Standards Council of Canada, 2008, “Specifications for Facially Featured Headforms
CAN/CSA-Z262.6-02.”
[83] 21st Century Solutions Ltd., 1997, “Anatomium: Digital Human 3D Body Anatomy”
[Online]. Available: http://www.anatomium.com/.

Page | 86
[84] Sone, J. Y., Kondziolka, D., Huang, J. H., and Samadani, U., 2017, “Helmet Efficacy
against Concussion and Traumatic Brain Injury: A Review,” J. Neurosurg., 126(3), pp.
768–781.
[85] Duncan Wallace, and Stephen Rayner, 2012, “Combat Helmets and Blast Traumatic
Brain Injury,” Journal of Military and Veterans’ Health, 20(1), pp. 10–17.
[86] Breeze, J., Baxter, D., Carr, D., and Midwinter, M. J., 2015, “Defining Combat Helmet
Coverage for Protection against Explosively Propelled Fragments,” J. R. Army Med.
Corps, 161(1), pp. 9–13.
[87] Nakatsuka, A. S., and Yamamoto, L. G., 2014, “External Foam Layers to Football
Helmets Reduce Head Impact Severity,” Hawaii J. Med. Public Health, 73(8), pp. 256–
261.
[88] Delaney, J. S., Al-Kashmiri, A., Drummond, R., and Correa, J. A., 2008, “The Effect of
Protective Headgear on Head Injuries and Concussions in Adolescent Football (Soccer)
Players,” Br. J. Sports Med., 42(2), pp. 110–115; discussion 115.
[89] Haider, A. H., Saleem, T., Bilaniuk, J. W., and Barraco, R. D., 2012, “An Evidence
Based Review: Efficacy of Safety Helmets in Reduction of Head Injuries in Recreational
Skiers and Snowboarders,” J. Trauma Acute Care Surg., 73(5), pp. 1340–1347.
[90] Walsh, S. M., Scott, B. R., and Spagnuolo, D. M., 2005, The Development of a Hybrid
Thermoplastic Ballistic Material With Application to Helmets, ARL-TR-3700, ARMY
RESEARCH LAB ABERDEEN PROVING GROUND MD.
[91] 1998, “CPSC - Safety Standard for Bicycle Helmets; Final Rule.”
[92] 2012, “CSA Z262.1-09: Standard for Ice Hockey Helmets.”
[93] 2015, “Standard Performance Specification for Newly Manufactured Football Helmets,
NOCSAE DOC (ND) 002-13m15.”
[94] Al-Fakih, E., Osman, N. A. A., and Adikan, F. R. M., 2012, “The Use of Fiber Bragg
Grating Sensors in Biomechanics and Rehabilitation Applications: The State-of-the-Art
and Ongoing Research Topics,” Sensors, 12(10), pp. 12890–12926.
[95] A. D. Kersey, 1997, “Fiber Grating Sensors,” IEEE J. Light. Technol., 15(8), pp. 1442–
1463.
[96] Dennison, C. R., Wild, P. M., Wilson, D. R., and Cripton, P. A., 2008, “A Minimally
Invasive In-Fibre Bragg Grating Sensor for Intervertebral Disc Pressure
Measurements,” Meas. Sci. Technol., 085201, p. 12.
[97] Lee, B., 2003, “Review of the Present Status of Optical Fiber Sensors,” Opt. Fiber
Technol., 9(2), pp. 57–79.
[98] Hill, K. O., Fujii, Y., Johnson, D. C., and Kawasaki, B. S., 1978, “Photosensitivity in
Optical Fiber Waveguides: Application to Reflection Filter Fabrication,” Appl. Phys.
Lett., 32(10), pp. 647–649.
[99] Meltz, G., Morey, W. W., and Glenn, W. H., 1989, “Formation of Bragg Gratings in
Optical Fibers by a Transverse Holographic Method,” Opt. Lett., 14, pp. 823–825.

Page | 87
[100] Betz, D. C., Thursby, G., Culshaw, B., and Staszewski, W. J., 2006, “Advanced Layout
of a Fiber Bragg Grating Strain Gauge Rosette,” J. Light. Technol., 24(2), pp. 1019–
1026.
[101] M.S. Muller, Buck, T. C., El-Khozondar, H. J., and Koch, A. W., 2009, “Shear Strain
Influence on Fiber Bragg Grating Measurement Systems,” J. Light. Technol., 27(23),
pp. 5223–5229.
[102] Qiu, W., Cheng, X., Luo, Y., Zhang, Q., and Zhu, B., 2013, “Simultaneous Measurement
of Temperature and Strain Using a Single Bragg Grating in a Few-Mode Polymer
Optical Fiber,” J. Light. Technol., 31(14), pp. 2419–2425.
[103] Chen, G., Liu, L., Jia, H., Yu, J., Xu, L., and Wang, W., 2004, “Simultaneous Strain and
Temperature Measurements with Fiber Bragg Grating Written in Novel Hi-Bi Optical
Fibre,” IEEE Photonics Technol. Lett., 16, pp. 221–223.
[104] Singlehurst, D. A., Dennison, C. R., and Wild, P. M., 2012, “A Distributed Pressure
Measurement System Comprising Multiplexed In-Fibre Bragg Gratings Within a
Flexible Superstructure,” IEEE J. Light. Technol., 30, pp. 123–129.
[105] Butz, R., and Dennison, C., 2015, “In-Fibre Bragg Grating Impact Force Transducer for
Studying Head-Helmet Mechanical Interaction in Head Impact.,” J. Light. Technol.,
33(13), p. 8.
[106] Dennison, C. R., Wild, P. M., Wilson, D. R., and Gilbart, M. K., 2010, “An In-Fiber
Bragg Grating Sensor for Contact Force and Stress Measurements in Articular Joints,”
Meas. Sci. Technol., 21, p. 115803.
[107] Lee, S.-M., Jeong, M.-Y., and Saini, S. S., 2012, “Etched-Core Fiber Bragg Grating
Sensors Integrated With Microfluidic Channels,” J. Light. Technol., 30(8), pp. 1025–
1031.
[108] Cameron, K. L., Marshall, S. W., Sturdivant, R. X., and Lincoln, A. E., 2012, “Trends
in the Incidence of Physician-Diagnosed Mild Traumatic Brain Injury among Active
Duty U.S. Military Personnel between 1997 and 2007,” J. Neurotrauma, 29(7), pp.
1313–1321.
[109] Hoge, C. W., and Castro, C. A., 2011, “Blast-Related Traumatic Brain Injury in U.S.
Military Personnel,” N. Engl. J. Med., 365(9), pp. 860; author reply 860-861.
[110] James M. Thompson, 2008, “Persistent Symptoms Following Mild Traumatic Brain
Injury (MTBI) - A Resource for Clinicians and Staff.”
[111] Wolf, S. J., Bebarta, V. S., Bonnett, C. J., Pons, P. T., and Cantrill, S. V., 2009, “Blast
Injuries,” The Lancet, 374(9687), pp. 405–415.
[112] Bandak, F. A., Ling, G., Bandak, A., and De Lanerolle, N. C., 2015, “Injury
Biomechanics, Neuropathology, and Simplified Physics of Explosive Blast and Impact
Mild Traumatic Brain Injury,” Handb. Clin. Neurol., 127, pp. 89–104.
[113] Chavko, M., Koller, W. A., Prusaczyk, W. K., and McCarron, R. M., 2007,
“Measurement of Blast Wave by a Miniature Fiber Optic Pressure Transducer in the Rat
Brain,” J. Neurosci. Methods, 159(2), pp. 277–281.

Page | 88
[114] Leonardi, A. D. C., Bir, C. A., Ritzel, D. V., and VandeVord, P. J., 2010, “Intracranial
Pressure Increases during Exposure to a Shock Wave,” J. Neurotrauma, 28(1), pp. 85–
94.
[115] Svetlov, S. I., Prima, V., Kirk, D. R., Gutierrez, H., Curley, K. C., Hayes, R. L., and
Wang, K. K. W., 2010, “Morphologic and Biochemical Characterization of Brain Injury
in a Model of Controlled Blast Overpressure Exposure,” J. Trauma, 69(4), pp. 795–804.
[116] Rubovitch, V., Ten-Bosch, M., Zohar, O., Harrison, C. R., Tempel-Brami, C., Stein, E.,
Hoffer, B. J., Balaban, C. D., Schreiber, S., Chiu, W.-T., and Pick, C. G., 2011, “A
Mouse Model of Blast-Induced Mild Traumatic Brain Injury,” Exp. Neurol., 232(2), pp.
280–289.
[117] Sosin, D. M., 1990, “Head Injury—Associated Deaths From Motorcycle Crashes:
Relationship to Helmet-Use Laws,” JAMA, 264(18), p. 2395.
[118] Robinson, D. L., 2001, “Changes in Head Injury with the New Zealand Bicycle Helmet
Law,” Accid. Anal. Prev., 33(5), pp. 687–691.
[119] Olivier, J., Walter, S. R., and Grzebieta, R. H., 2013, “Long Term Bicycle Related Head
Injury Trends for New South Wales, Australia Following Mandatory Helmet
Legislation,” Accid. Anal. Prev., 50, pp. 1128–1134.
[120] Nahum, A., Smith, R., and Ward, C., “Intracranial Pressure Dynamics During Head
Impact,” SAE Int. Tech. Pap. 770922, p. 1977.
[121] Hardy, W. N., Khalil, T. B., and King, A. I., 1994, “Literature Review of Head Injury
Biomechanics,” Int. J. Impact Eng., 15(4), pp. 561–586.
[122] Turner, R. C., Naser, Z. J., Bailes, J. E., Smith, D. W., Fisher, J. A., and Rosen, C. L.,
2012, “Effect of Slosh Mitigation on Histologic Markers of Traumatic Brain Injury,” J.
Neurosurg., 117(6), pp. 1110–1118.
[123] Foster, J. K., Kortge, J. O., and Wolanin, M. J., 1977, “Hybrid III-A Biomechanically-
Based Crash Test Dummy,” pp. 975–1014.
[124] D Hynd, 2007, “The Use of the Hybrid III Dummy in Low-Speed Rear Impact Testing.”
[125] Beckwith, J. G., Greenwald, R. M., and Chu, J. J., 2012, “Measuring Head Kinematics
in Football: Correlation Between the Head Impact Telemetry System and Hybrid III
Headform,” Ann. Biomed. Eng., 40(1), pp. 237–248.
[126] Ivarsson, J., Viano, D. C., and Lövsund, P., 2002, “Influence of the Lateral Ventricles
and Irregular Skull Base on Brain Kinematics Due to Sagittal Plane Head Rotation,” J.
Biomech. Eng., 124(4), pp. 422–431.
[127] A. Othonos, 2000, “Bragg Gratings in Optical Fibers: Fundamentals and Applications,”
Opt. Fiber Sens. Technol., pp. 79–187.
[128] Xu, M. G., Reekie, L., Chow, Y. T., and Dakin, J. P., 1993, “Optical In-Fibre Grating
High Pressure Sensor,” Electron. Lett., 29, pp. 398–399.
[129] Measures, R. M., 2001, Structural Health Monitoring with Fiber Optic Technology,
Academic Press.

Page | 89
[130] Xu, M. G., Geiger, H., and Dakin, J. P., 1996, “Fibre Grating Pressure Sensor with
Enhanced Sensitivity Using a Glass-Bubble Housing,” Electron. Lett., 32, pp. 128–129.
[131] Wilk, J. E., Thomas, J. L., McGurk, D. M., Riviere, L. A., Castro, C. A., and Hoge, C.
W., 2010, “Mild Traumatic Brain Injury (Concussion) during Combat: Lack of
Association of Blast Mechanism with Persistent Postconcussive Symptoms,” J. Head
Trauma Rehabil., 25(1), pp. 9–14.
[132] Morey, R. A., Haswell, C. C., Selgrade, E. S., Massoglia, D., Liu, C., Weiner, J., Marx,
C. E., MIRECC Work Group, Cernak, I., and McCarthy, G., 2013, “Effects of Chronic
Mild Traumatic Brain Injury on White Matter Integrity in Iraq and Afghanistan War
Veterans,” Hum. Brain Mapp., 34(11), pp. 2986–2999.
[133] Cernak, I., and Noble-Haeusslein, L. J., 2010, “Traumatic Brain Injury: An Overview
of Pathobiology with Emphasis on Military Populations,” J. Cereb. Blood Flow Metab.
Off. J. Int. Soc. Cereb. Blood Flow Metab., 30(2), pp. 255–266.
[134] Belanger, H. G., Kretzmer, T., Yoash-Gantz, R., Pickett, T., and Tupler, L. A., 2009,
“Cognitive Sequelae of Blast-Related versus Other Mechanisms of Brain Trauma,” J.
Int. Neuropsychol. Soc. JINS, 15(1), pp. 1–8.
[135] MacGregor, A. J., Dougherty, A. L., and Galarneau, M. R., 2011, “Injury-Specific
Correlates of Combat-Related Traumatic Brain Injury in Operation Iraqi Freedom,” J.
Head Trauma Rehabil., 26(4), pp. 312–318.
[136] Terrio, H., Brenner, L. A., Ivins, B. J., Cho, J. M., Helmick, K., Schwab, K., Scally, K.,
Bretthauer, R., and Warden, D., 2009, “Traumatic Brain Injury Screening: Preliminary
Findings in a US Army Brigade Combat Team,” J. Head Trauma Rehabil., 24(1), pp.
14–23.
[137] Polusny, M. A., Kehle, S. M., Nelson, N. W., Erbes, C. R., Arbisi, P. A., and Thuras, P.,
2011, “Longitudinal Effects of Mild Traumatic Brain Injury and Posttraumatic Stress
Disorder Comorbidity on Postdeployment Outcomes in National Guard Soldiers
Deployed to Iraq,” Arch. Gen. Psychiatry, 68(1), pp. 79–89.
[138] Nelson, N. W., Davenport, N. D., Sponheim, S. R., and Anderson, C. R., 2015, “Blast-
Related Mild Traumatic Brain Injury: Neuropsychological Evaluation and Findings,”
Brain Neurotrauma: Molecular, Neuropsychological, and Rehabilitation Aspects, F.H.
Kobeissy, ed., CRC Press/Taylor & Francis, Boca Raton (FL).
[139] Jones, E., 2007, “Shell Shock and Mild Traumatic Brain Injury: A Historical Review,”
American Journal of Psychiatry, 164(11), pp. 1641–1645.
[140] Belmont, P. J., Goodman, G. P., Zacchilli, M., Posner, M., Evans, C., and Owens, B. D.,
2010, “Incidence and Epidemiology of Combat Injuries Sustained during ‘the Surge’
Portion of Operation Iraqi Freedom by a U.S. Army Brigade Combat Team,” J. Trauma,
68(1), pp. 204–210.
[141] Bass, C. R., Panzer, M. B., Rafaels, K. A., Wood, G., Shridharani, J., and Capehart, B.,
2012, “Brain Injuries from Blast,” Ann. Biomed. Eng., 40(1), pp. 185–202.

Page | 90
[142] Tanielian, T., and Jaycox, L. H., 2008, Invisible Wounds of War: Psychological and
Cognitive Injuries, Their Consequences, and Services to Assist Recovery., RAND
Coporation, Santa Monica, CA.
[143] Nelson, T. J., Wall, D. B., Stedje-Larsen, E. T., Clark, R. T., Chambers, L. W., and
Bohman, H. R., 2006, “Predictors of Mortality in Close Proximity Blast Injuries during
Operation Iraqi Freedom,” J. Am. Coll. Surg., 202(3), pp. 418–422.
[144] Jones, N., Thandi, G., Fear, N. T., Wessely, S., and Greenberg, N., 2014, “The
Psychological Effects of Improvised Explosive Devices (IEDs) on UK Military
Personnel in Afghanistan,” Occup. Environ. Med., 71(7), pp. 466–471.
[145] Galarneau, M. R., Woodruff, S. I., Dye, J. L., Mohrle, C. R., and Wade, A. L., 2008,
“Traumatic Brain Injury during Operation Iraqi Freedom: Findings from the United
States Navy-Marine Corps Combat Trauma Registry,” J. Neurosurg., 108(5), pp. 950–
957.
[146] BlastExposures, C. on G. W. and H. L.-T. E. of, Populations, B. on the H. of S., and
Medicine, I. of, 2014, Pathophysiology of Blast Injury and Overview of Experimental
Data, National Academies Press (US).
[147] Chatelin, S., Constantinesco, A., and Willinger, R., 2010, “Fifty Years of Brain Tissue
Mechanical Testing: From in Vitro to in Vivo Investigations,” Biorheology, 47(5–6),
pp. 255–276.
[148] Skotak, M., Alay, E., Zheng, J. Q., Halls, V., and Chandra, N., 2018, “Effective Testing
of Personal Protective Equipment in Blast Loading Conditions in Shock Tube:
Comparison of Three Different Testing Locations,” PLoS ONE, 13(6).
[149] Nyein, M. K., Jason, A. M., Yu, L., Pita, C. M., Joannopoulos, J. D., Moore, D. F., and
Radovitzky, R. A., 2010, “In Silico Investigation of Intracranial Blast Mitigation with
Relevance to Military Traumatic Brain Injury,” Proc. Natl. Acad. Sci., 107(48), pp.
20703–20708.
[150] Nguyen, T.-T., Pearce, A. P., Carpanen, D., Sory, D., Grigoriadis, G., Newell, N.,
Clasper, J., Bull, A., Proud, W. G., and Masouros, S. D., 2018, “Experimental Platforms
to Study Blast Injury,” J. R. Army Med. Corps, p. jramc-2018-000966.
[151] Ouellet, S., and Philippens, M., 2018, “The Multi-Modal Responses of a Physical Head
Model Subjected to Various Blast Exposure Conditions,” Shock Waves, 28(1), pp. 19–
36.
[152] Kleiven, S., 2003, “Influence of Impact Direction on the Human Head in Prediction of
Subdural Hematoma,” J. Neurotrauma, 20(4), pp. 365–379.
[153] Knowles, B. M., MacGillivray, S. R., Newman, J. A., and Dennison, C. R., 2017,
“Influence of Rapidly Successive Head Impacts on Brain Strain in the Vicinity of
Bridging Veins.,” J. Biomech., 59, pp. 59–70.
[154] Goggio, A. F., 1941, “The Mechanism of Contre-Coup Injury,” J. Neurol. Psychiatry,
4(1), pp. 11–22.
[155] Meaney, D. F., and Smith, D. H., 2011, “Biomechanics of Concussion,” Clin. Sports
Med., 30(1), pp. 19–31, vii.

Page | 91
[156] Raymond, D., Van Ee, C., Crawford, G., and Bir, C., 2009, “Tolerance of the Skull to
Blunt Ballistic Temporo-Parietal Impact,” J. Biomech., 42(15), pp. 2479–2485.
[157] McElhaney, J. H., Hopper, R. H., Nightingale, R. W., and Myers, B. S., 1995,
“Mechanisms of Basilar Skull Fracture,” J. Neurotrauma, 12(4), pp. 669–678.
[158] Kleiven, S., 2013, “Why Most Traumatic Brain Injuries Are Not Caused by Linear
Acceleration but Skull Fractures Are,” Front. Bioeng. Biotechnol., 1.
[159] Mckee, A. C., and Daneshvar, D. H., 2015, “The Neuropathology of Traumatic Brain
Injury,” Handb. Clin. Neurol., 127, pp. 45–66.
[160] Inglese, M., Makani, S., Johnson, G., Cohen, B. A., Silver, J. A., Gonen, O., and
Grossman, R. I., 2005, “Diffuse Axonal Injury in Mild Traumatic Brain Injury: A
Diffusion Tensor Imaging Study,” J. Neurosurg., 103(2), pp. 298–303.
[161] Stemper, B. D., and Pintar, F. A., 2014, “Biomechanics of Concussion,” Prog. Neurol.
Surg., 24, pp. 14–27.
[162] Backman, M. E., and Goldsmith, W., 1978, “The Mechanics of Penetration of
Projectiles into Targets,” Int. J. Eng. Sci., 16(1), pp. 1–99.
[163] McIntosh, A. S., and Janda, D., 2003, “Evaluation of Cricket Helmet Performance and
Comparison with Baseball and Ice Hockey Helmets,” Br. J. Sports Med., 37(4), pp. 325–
330.
[164] Cameron, K. L., Marshall, S. W., Sturdivant, R. X., and Lincoln, A. E., 2012, “Trends
in the Incidence of Physician-Diagnosed Mild Traumatic Brain Injury among Active
Duty U.S. Military Personnel between 1997 and 2007,” J. Neurotrauma, 29(7), pp.
1313–1321.
[165] Azar, A., Bhagavathula, K. B., Hogan, J., Josey, T., Ouellet, S., Satapathy, S., and
Dennison, C. R., 2018, “An Optical Fibre Transducer for Measuring Kinetics of Skull-
Brain Interaction in a Surrogate Model of the Human Head Subjected to Blast
Overpressure,” IEEE Sens. J., pp. 1–1.
[166] James L. Underwood, 1981, “Technology Assessment Program: NIJ Standard for
Ballistic Helmets,” U.S. Department of Justice - National Institute of Justice.
[167] Office of Justice Programs, 2017, “Active NIJ Standards and Comparative Test
Methods,” Natl. Inst. Justice [Online]. Available:
https://www.nij.gov:443/topics/technology/standards-testing/Pages/active.aspx.
[Accessed: 13-Nov-2018].
[168] Sances, A., and Kumaresan, S., 2001, “Comparison of Biomechanical Head-Neck
Responses of Hybrid III Dummy and Whole Body Cadaver during Inverted Drops,”
Biomed. Sci. Instrum., 37, pp. 423–427.
[169] Brian Herbst, Stephen Forrest, David Chng, and Anthony Sances Jr, 1998, “Fidelity of
Anthropometric Test Dummy Necks in Rollover Accidents,” Proceedings of the 16th
International Technical Conference on the Enhanced Safety of Vehicles (ESV).

Page | 92
[170] Knowles, B. M., and Dennison, C. R., 2017, “Predicting Cumulative and Maximum
Brain Strain Measures From HybridIII Head Kinematics: A Combined Laboratory
Study and Post-Hoc Regression Analysis,” Ann. Biomed. Eng., 45(9), pp. 2146–2158.
[171] Butz, R., Knowles, B., Newman, J., and Dennison, C., “Effects of External Helmet
Accessories on Biomechanical Measures of Head Injury Risk: An ATD Study Using the
HybridIII Headform,” J. Biomech., 48(14), pp. 3816–3824.
[172] Alphonse, V. D., Kemper, A. R., and Duma, S. M., 2015, “Effects of Filtering on
Experimental Blast Overpressure Measurements,” Biomed. Sci. Instrum., 51, pp. 143–
150.
[173] Society of Automotive Engineers, 2014, “SAE J211 Instrumentation for Impact Test -
Part 1: Electronic Instrumentation.”
[174] M. Philippens, B. de Jong, S. Ouellet, A. Bouamoul, and A. Zwanenburg, 2018,
“Response of the BIPED Head Physical Model to Low Level Shockwaves.”
[175] Zhang, L., Yang, K. H., and King, A. I., 2001, “Comparison of Brain Responses between
Frontal and Lateral Impacts by Finite Element Modeling,” J. Neurotrauma, 18(1), pp.
21–30.