Embed Size (px)
Citation preview
7/5/2005Dave Mathew
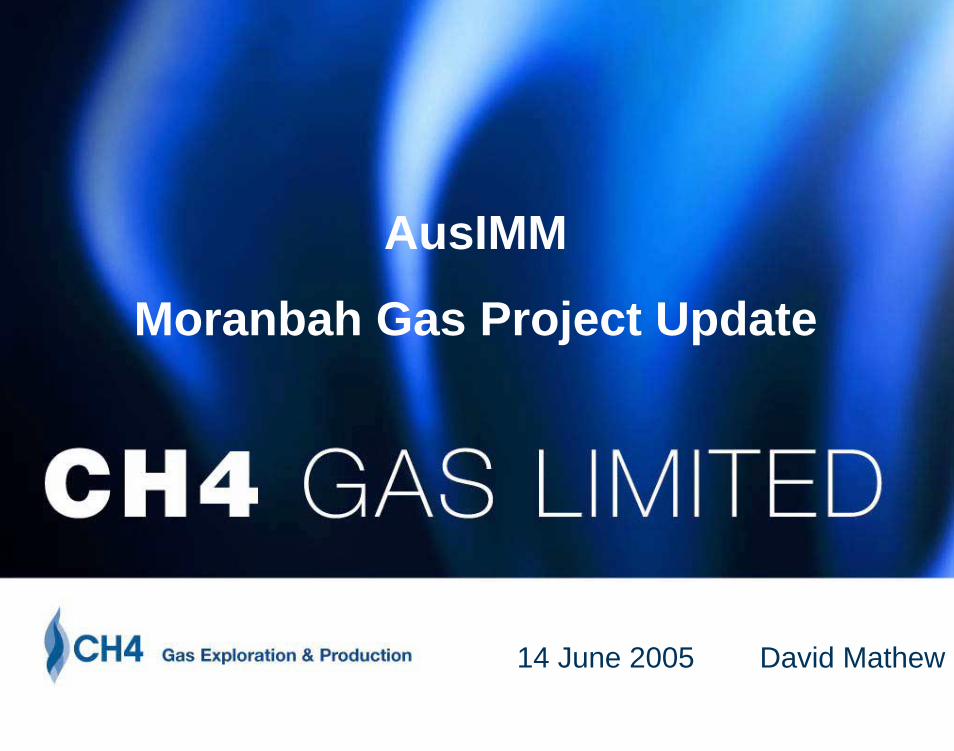
AusIMM
Moranbah Gas Project Update
14 June 2005 David Mathew

Dave Mathew
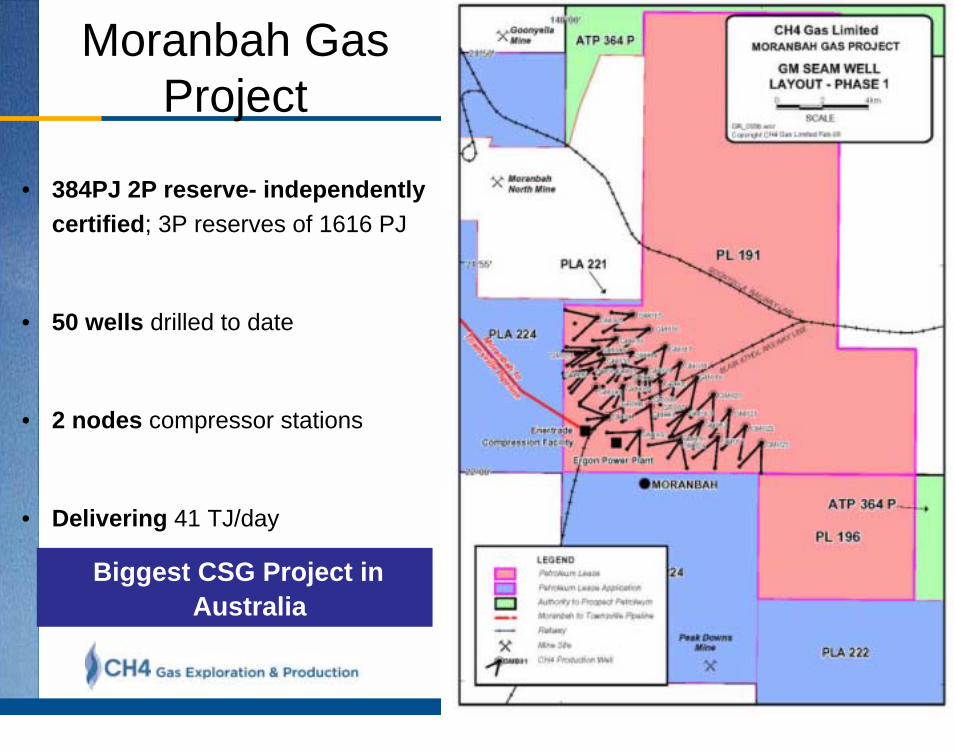
Moranbah Gas Project
PRESENTATION AGENDAPRESENTATION AGENDA
1.1. PROJECT UPDATEPROJECT UPDATE
2.2. TECHNICAL ASPECTS TECHNICAL ASPECTS
ÁÁGeological controls on CSG Geological controls on CSG
ÁÁWell completion Well completion
ÁÁGas profiles and decline analysisGas profiles and decline analysis
3.3. PROJECT LOOK FORWARDPROJECT LOOK FORWARD

7/5/2005Dave Mathew
Moranbah Gas Project
1.PROJECT UPDATE

7/5/2005Dave Mathew
Contract target acheived: 33TJ/day (31 million cubic feet of gas per day) Enertrade Daily Contract Quantity target;
Townsville Power Station now delivering 220MW: base load power produced from Moranbah’s natural gas.
Currently producing 41 TJ/day: 40 million cubic feet of gas per day being produced sustainably.
Largest producer in Australia: producing more CSG than any other project in Australia.
Built in 19 months: from project approval to fulfilling contracted gas sales.
Commissioning complete: all MGP construction completed/commissioned successfully last quarter.
Moranbah Gas Project
Delivering Substantial Production

7/5/2005Dave Mathew
CH4’s Fundamentals
• Over 7,000km2 tenements in highly prospective Bowen Basin
• Well understood geology – 30,000 drill hole database Č a key I.P. advantage
• Exclusive exploration rights to tenements containing in excess of 12,000 PJ GIP
• Delivering into 300PJ contract to supply Enertrade from MGP
• JV with BHPBilliton on MGP
• Well positioned for Townsville and Gladstone.
Well Placed for Growth
7/5/2005Dave Mathew
Moranbah Gas Project
• 384PJ 2P reserve- independently certified; 3P reserves of 1616 PJ
• 50 wells drilled to date
• 2 nodes compressor stations
• Delivering 41 TJ/day
Biggest CSG Project in Australia

7/5/2005Dave Mathew
• 50 wells installed; 90% availability current average
• Averaging 880,000scfd; GM seam more reliable than P seam
7/5/2005Dave Mathew
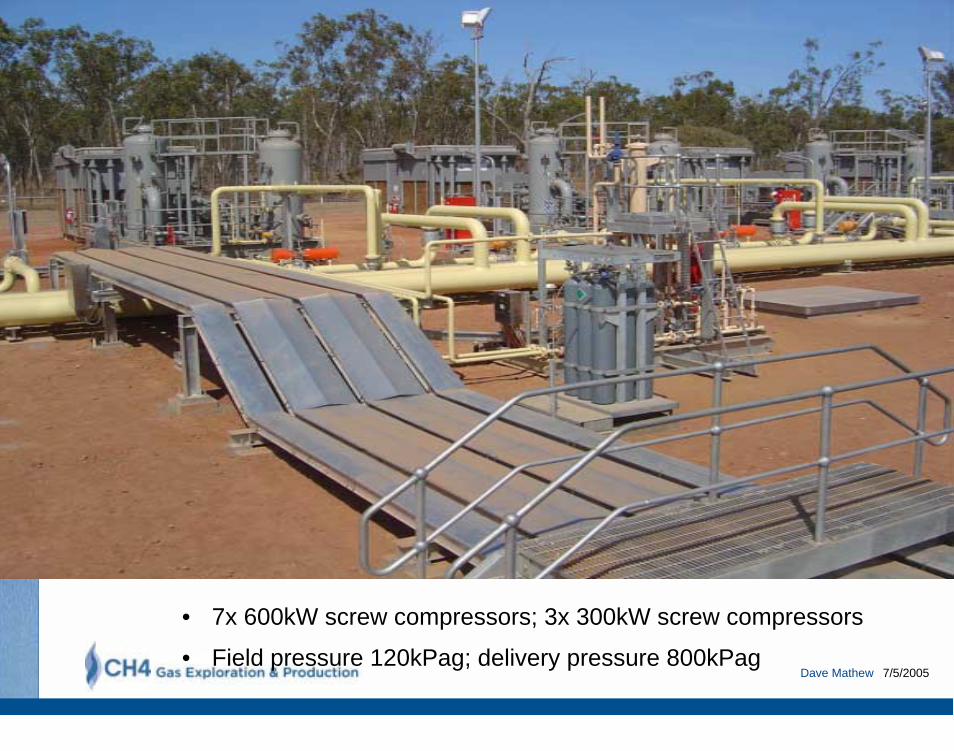
• 7x 600kW screw compressors; 3x 300kW screw compressors
• Field pressure 120kPag; delivery pressure 800kPag
7/5/2005Dave Mathew
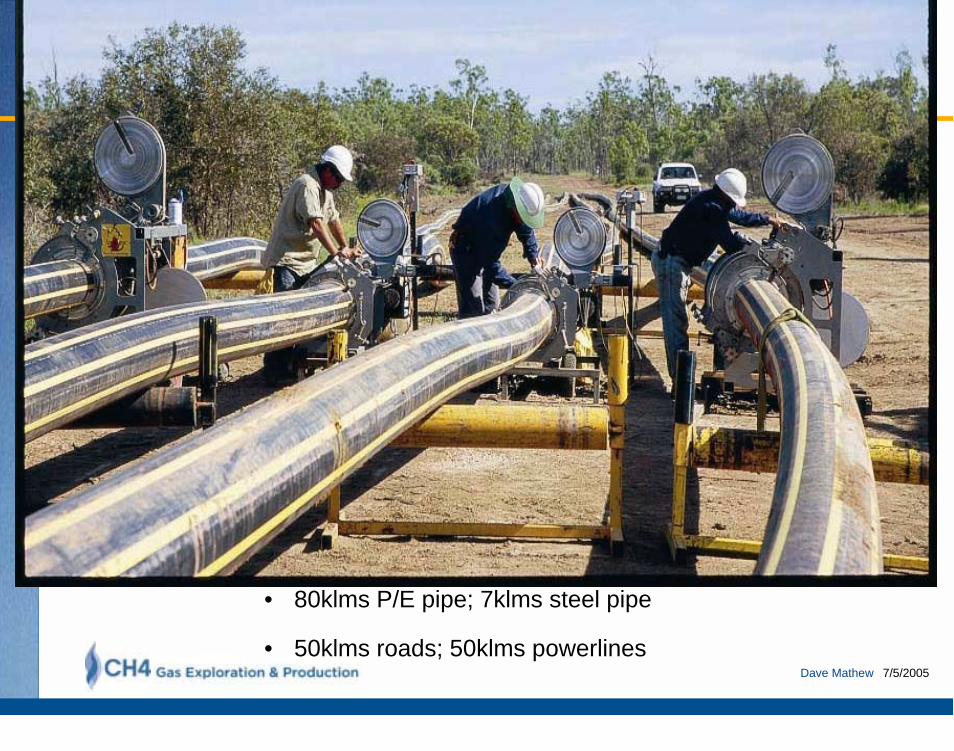
• 80klms P/E pipe; 7klms steel pipe
• 50klms roads; 50klms powerlines

7/5/2005Dave Mathew
Moranbah Gas Project
2. TECHNICAL ASPECTS• Geological control on CSG

7/5/2005Dave Mathew
Coal physical structureHas a dual porosity
Macropores – the cleat system
Micropores – the coal matrixMost of the porosity is in the matrix (eg
85%)Gas is stored as a molecularly adsorbed
phase within micropors
Cleat systemsTwo main sets - orthogonal
Face cleats
Butt cleats
perpendicular to bedding plane
matrix
Plan view
Laubach et al 1998
Cross – section
Nature of Gas in Coal

7/5/2005Dave Mathew
gas adsorbed within matrix
water filled cleats
Initial state – pore fluid pressure maintains a certain mass of gas adsorbed
matrix
pressure difference betweencleat - matrix
Fluid pressure lowered in cleat/fracture system – pressure differencebetween cleat and matrix
Pressure lowered, gas desorbs and diffusesthrough matrix to cleat – water and gasflow within cleats

7/5/2005Dave Mathew

7/5/2005Dave Mathew
Class A Wells on flanks of syncline, north of fault, capped by thick sandstones and basalt
Class C Wells on broad anticline south of hinge zone where fault frequency increases, the GM seam floor splits and seam decreases in quality
Regional Cross Section through MGP
NW SE
GM010VB
GM009VA
GM007VA
GM0O6VA
Approximate location of normal fault12-15m throw, down to north(not modelled)
GM
Psandstone
basaltStanding water level
surface
~300
m

7/5/2005Dave Mathew
Conceptual 1st Order Model for Class A WellsGood production on synclinal flanks
Tension
Syncline
Anticline
Flank Flank
Faulted ground
Low Permeabilityin trough
Class C Wells
Class A Wells

7/5/2005Dave Mathew
Geology – Reservoir Gas Content
GM Seam high domain y = 5.7894Ln(x) - 22.692
P Seam y = 5.2654Ln(x) - 18.754
GM Seam low domain y = 8.0763Ln(x) - 39.164
GL Seam y = 4.5318Ln(x) - 20.534
0
2
4
6
8
10
12
14
0 100 200 300 400 500 600
Depth of Cover (m)
Mea
sure
d G
as C
onte
nt Q
m (m
3/t)
corr
ecte
d to
15%
ash
GM Seam High GradientP SeamGM Seam Low GradientGLQ Seam
GasDataBaseOct02AdjustedJuly03.xls
Gas Contents Gradients All Gas Boreholes
7/5/2005Dave Mathew
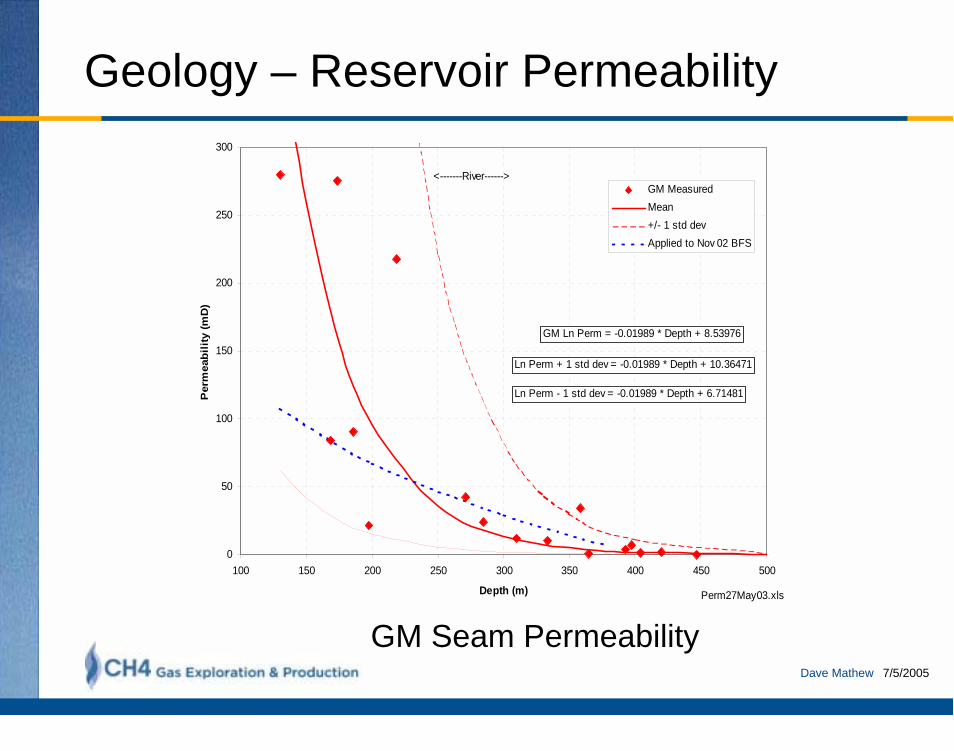
Geology – Reservoir Permeability
0
50
100
150
200
250
300
100 150 200 250 300 350 400 450 500
Depth (m)
Per
mea
bilit
y (m
D)
GM MeasuredMean+/- 1 std devApplied to Nov 02 BFS
Perm27May03.xls
GM Ln Perm = -0.01989 * Depth + 8.53976
Ln Perm + 1 std dev = -0.01989 * Depth + 10.36471
Ln Perm - 1 std dev = -0.01989 * Depth + 6.71481
<-------River------>
GM Seam Permeability
1818
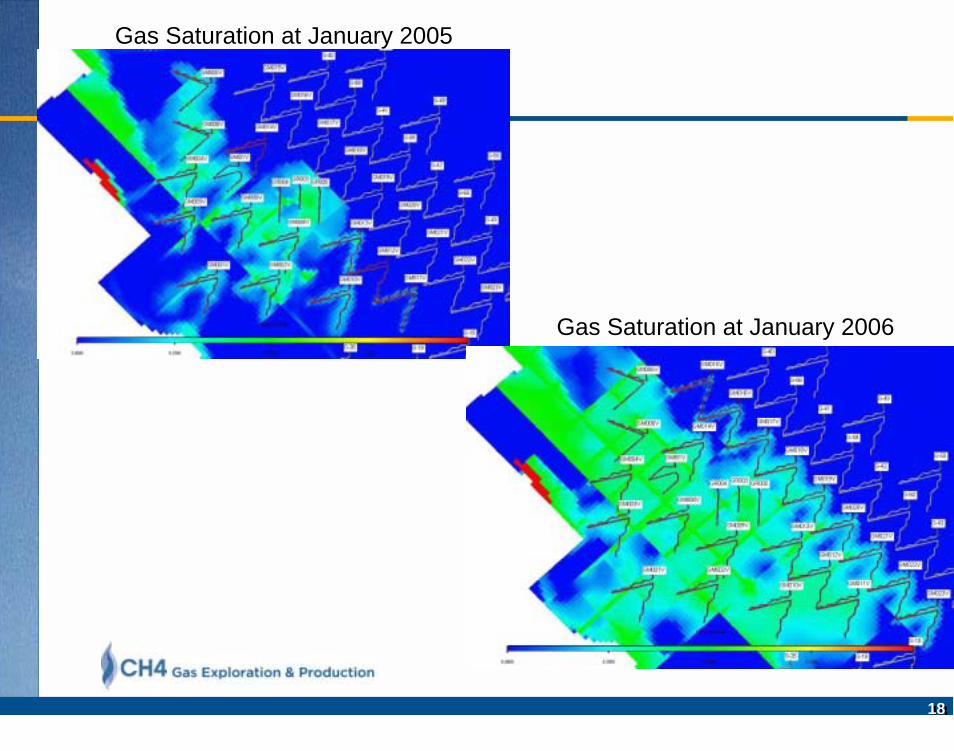
Gas Saturation at January 2005
Gas Saturation at January 2006

7/5/2005Dave Mathew
Moranbah Gas Project
2. TECHNICAL ASPECTS 2. TECHNICAL ASPECTS
••Geological controls on CSGGeological controls on CSG
••Well completions Well completions

7/5/2005Dave Mathew
Surface to In-Seam, Medium Radius Drilling

7/5/2005Dave Mathew
Chevron Well pattern
980m 1020m
1200m
1100m
Vertical Wells
1200m 1200m 1200m
2000m
1200m 1200m
1200m
Chevron Well Design

7/5/2005Dave Mathew
• Conventional exploration/coal/minerals drilling rig
• Increased hole size in Phase 2

7/5/2005Dave Mathew

7/5/2005Dave Mathew
Moranbah Gas Project
2. TECHNICAL ASPECTS 2. TECHNICAL ASPECTS
••Geological controls on CSGGeological controls on CSG
••Well completions Well completions
••Gas production profiles Gas production profiles

7/5/2005Dave Mathew
Production History
0
500
1000
1500
2000
2500
3000
12/06/2004 01/08/2004 20/09/2004 09/11/2004 29/12/2004 17/02/2005 08/04/2005 28/05/2005 17/07/2005
Date
Gas
Vol
ume
(Mcf
d); W
ater
Rat
e (B
PD);
Wat
er L
evel
(m a
bove
se
nsor
)
0
50
100
150
200
250
300
Cas
ing
Pres
sure
(Psi
)
Gas Volume (Mcfd) Water Level (m from sensor)Water Rate (BPD) Coal SeamCasing Pressure (Psi)
GM001 P001
GM002 P002
P007
GM008
GM009
P009
GM010
P010
GM011
P011
GM012
P012
GM013
P013
GM003 P004
GM004
GM006
P005
GM005 P006
GM028
GM007
GM016
P008
GM026
GM014
P014
GM015
GM017
GM018
P016
P017
P018
P015
P019
GM020
GM024
GM027
GM023
GM24 + GM10
GM021
GM030
GM019
GM029
Metric ImperialRay's Cheat-O-Matic
Water Level
GM033
GM032
GM031
P021
P031
Q023
GM022

7/5/2005Dave Mathew
Production History
0
500
1000
1500
2000
2500
3000
01/08/2004 20/09/2004 09/11/2004 29/12/2004 17/02/2005 08/04/2005 28/05/2005 17/07/2005
Date
Gas
Vol
ume
(Mcf
d); W
ater
Rat
e (B
PD);
Wat
er L
evel
(m a
bove
se
nsor
)
0
50
100
150
200
250
300
Cas
ing
Pres
sure
(Psi
)
Gas Volume (Mcfd) Water Level (m from sensor)Water Rate (BPD) Coal SeamCasing Pressure (Psi)
GM001 P001
GM002 P002
P007
GM008
GM009
P009
GM010
P010
GM011
P011
GM012
P012
GM013
P013
GM003 P004
GM004
GM006
P005
GM005 P006
GM028
GM007
GM016
P008
GM026
GM014
P014
GM015
GM017
GM018
P016
P017
P018
P015
P019
GM020
GM024
GM027
GM023
GM24 + GM10
GM021
GM030
GM019
GM029
Metric ImperialRay's Cheat-O-Matic
Water Level
GM033
GM032
GM031
P021
P031
Q023
GM022

7/5/2005Dave Mathew
Average Production Rate per Well
0
200
400
600
800
1000
1200
04/03/2004 23/04/2004 12/06/2004 01/08/2004 20/09/2004 09/11/2004 29/12/2004 17/02/2005 08/04/2005 28/05/2005
Date
Gas
Vol
ume
(Mcf
d)
20
30
40
50
60
70
80
90
100
No.
of W
ells
Average Production per Well (Mcfd) Average Rate needed to meet GSA (Mcfd) No. of Wells Running
Conversion
Metric
Imperial

7/5/2005Dave Mathew
Total Field Production
0
5,000
10,000
15,000
20,000
25,000
30,000
35,000
40,000
45,000
50,000
04/03/2004 23/04/2004 12/06/2004 01/08/2004 20/09/2004 09/11/2004 29/12/2004 17/02/2005 08/04/2005 28/05/2005
Date
Gas
Vol
ume
(Mcf
d)
Total Field Production (Mcfd) Enertrade + Ergon Nom (Mcfd)
Conversion
Metric
Imperial
7/5/2005Dave Mathew
Moranbah Gas Project
3. PROJECT LOOK FORWARD

7/5/2005Dave Mathew
Growth in Qld Demand Vs Supply
Source: ACIL Tasman
Significant Market Exists
Existing Contracts
Potential Demand
0
30
60
90
120
150
180
210
240
270
300
330
360
390
420P
J/a
2004 2006 2008 2010 2012 2014 2016 2018 2020 2022
Queensland supply by Basin

7/5/2005Dave Mathew
Business Development - Strategy
• Our growth strategy remains:– Grow through exploration
– Increase gas sales to Townsville
– Duplicate business model into Gladstone
– Enter the east coast gas market
• Key focus on the growing markets of North + Central Queensland
Focussed Business Strategy

7/5/2005Dave Mathew
Market Developments
• Enertrade increased 2006 nomination by 23% to 14.8 PJ/pa (may request 110% of its nominated amount up to 16.3 PJ)
• Enertrade signed Xstrata’s Townsville copper refinery
• QNI has signed up to take 70 to 150PJ of gas over the next 15 years
• 20PJ/a spoken for including QNI plus Townsville Power Station and Xstrata.
• Expressions of interest called for another Townsville Power Station – declared a Significant Project by QLD Government
The gas market in North and Central Queensland is developing rapidly
7/5/2005Dave Mathew
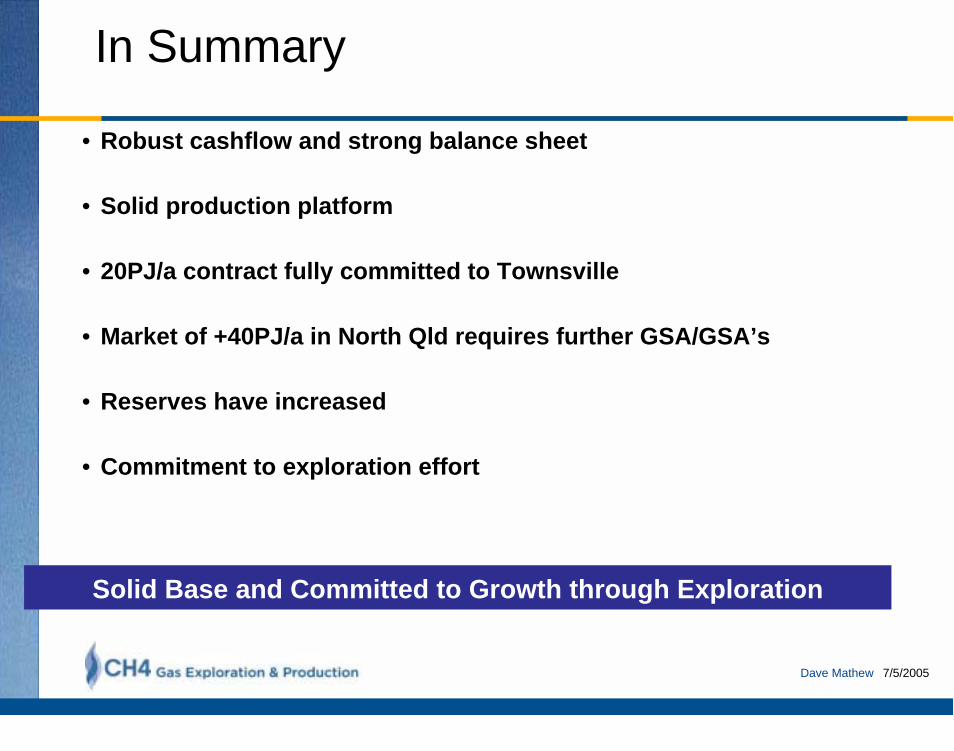
In Summary
• Robust cashflow and strong balance sheet
• Solid production platform
• 20PJ/a contract fully committed to Townsville
• Market of +40PJ/a in North Qld requires further GSA/GSA’s
• Reserves have increased
• Commitment to exploration effort
Solid Base and Committed to Growth through Exploration