Embed Size (px)
Citation preview
August 2018ISSN 1996-0794 DOI: 10.5897/AJFSwww.academicjournals.org
OPEN ACCESS
African Journal of
Food Science
ABOUT AJFS
The African Journal of Food Science (AJFS) (ISSN 1996-0794) is published monthly (one volume per year) by Academic Journals. African Journal of Food Science (AJFS) provides rapid publication of articles in all areas of Food Science such as Sensory analysis, Molecular gastronomy, Food safety, Food technology etc. The Journal welcomes the submission of manuscripts that meet the general criteria of significance and scientific excellence. Papers will be published shortly after acceptance. All articles published in AJFS are peer-reviewed.
Contact Us
Editorial Office: [email protected]
Help Desk: [email protected]
Website: http://www.academicjournals.org/journal/AJFS
Submit manuscript online http://ms.academicjournals.me/
Editors
Dr. Thaddeus Chukwuemeka Ezeji Ohio State University and Ohio State Agricultural and Development Center (OARDC) Department of Animal Sciences USA. Prof. Kofi E. Aidoo Department of Biological and Biomedical Sciences Glasgow Caledonian University Glasgow Scotland. Dr. Barakat S.M. Mahmoud Food Safety/Microbiology Experimental Seafood Processing Laboratory Costal Research and Extension Centre Mississippi State University USA. Dr. Neela Badrie Department of Food Production, Faculty of Science and Agriculture, University of the West Indies, Trinidad and Tobago.
Dr. Hu Xiao-Qing State Key Lab of Food Science and Technology, Jiangnan University, China. Dr. Dominic Agyei Department of Food Science/Te Tari Pütaiao Kai University of Otago, Dunedin, New Zealand. Dr. Fook Yee Chye Faculty of Food Science and Nutrition, Universiti Malaysia Sabah, Malaysia. Dr. Adel Shatta Department of Food Technology, Faculty of Agriculture, Egypt. Dr. Tendekayi Henry Gadaga Departmentof Environmental Health Science University of Swaziland Swaziland.
Editorial Board Members
Dr. K. Pandima Devi Department of Biotechnology Alagappa University Tamil Nadu India. Dr. Ashish Kumar Singh Dairy Technology Division National Dairy Research Institute, Haryana, India. Prof. Rui Cruz Department of Food Engineering Institute of Engineering University of Algarve, Faro Portugal.
African Journal of Food Science
Table of Content: Volume 12 Number 8 August 2018
ARTICLES
Antioxidants activity of the cyanobacterium, Arthrospira (Spirulina) fusiformis cultivated in a low-cost medium 188 Angelina Michael, Margareth S. Kyewalyanga, Matern S. Mtolera and Charles V. Lugomela Nutritional potential of underutilized gum arabic tree seeds (acacia nilotica) and locust bean seeds (Parkia biglobosa) 196 Ajayi K., Adepoju O. T., Taiwo O. M., Omojola S. T. and Aladetuyi M. E. Physicochemical, microbiological and sensory characteristics of cashew milk formulated yoghurt 204 Jayeola Olayinka, Yahaya Eugene, Ogunwolu Olalekan, Igbinadolor Richard and Mokwunye Chuka
Vol. 12(8) pp. 188-195, August 2018
DOI: 10.5897/AJFS2018.1688
Article Number: 8A9CA4457782
ISSN: 1996-0794
Copyright ©2018
Author(s) retain the copyright of this article
http://www.academicjournals.org/AJFS
African Journal of Food Science
Full Length Research Paper
Antioxidants activity of the cyanobacterium, Arthrospira (Spirulina) fusiformis cultivated in a low-
cost medium
Angelina Michael1,2*, Margareth S. Kyewalyanga2, Matern S. Mtolera2 and Charles V. Lugomela3
1Department of Biotechnology and Bioinformatics, University of Dodoma, P. O. Box 338, Dodoma-Tanzania.
2Institute of Marine Sciences, University of Dar es Salaam, P. O. Box 668, Zanzibar-Tanzania.
3Department of Aquatic Sciences and Fisheries Technology, University of Dar es Salaam, P. O. Box 35064,
Dar es Salaam-Tanzania.
Received 16 January, 2018; Accepted 5 June, 2018
Spirulina species are known to have a good nutritional profile and antioxidant properties against reactive oxygen species. However, little is known about the antioxidant contents and the scavenging ability of Arthrospira fusiformis, cultivated under various conditions. This study aimed at evaluating the content of antioxidants (total phenols, total flavonoids, β-carotene, and lycopene) and the activity of A. fusiformis produced using low-cost culture (LCMA) and standard culture (Zarrouk) media. The results revealed that A. fusiformis is rich in antioxidants and it possesses high scavenging and chelating activities. Interestingly, the LCMA was superior over the Zarrouk medium as it resulted in spirulina with a higher amount of antioxidants and lower EC50 values. In this context, production of natural antioxidants can be maximized through the use of cost-saving, inorganic culture medium. Key words: Arthrospira fusiformis, spirulina, total phenols, total flavonoids, carotenoids, scavenging activity, low-cost culture (LCMA) medium, Zarrouk medium.
INTRODUCTION Arthrospira, commonly known as spirulina is a filamentous helical shaped cyanobacterium belonging to the family Oscillatoriaceae (Kumar et al., 2005; Rasool et al., 2006). It occurs naturally in warm alkaline lakes of the tropical and sub-tropical countries (Germán Chamorro-Cevallos and Vázquez-Sánchez, 2008; Habib et al., 2008; Shalaby and Shanab, 2013; Kumari et al., 2015). Spirulina is proven to be toxicologically free (Germán Chamorro-
Cevallos and Vázquez-Sánchez, 2008; Gutiérrez-Salmeán et al., 2015) and it has been cultivated massively in several countries especially those in the Asian and American continent and used as protein and vitamins supplement in the diets (Rasool et al., 2006; Belay, 2008; Salamatullah, 2014). Spirulina is a rich source of protein (about 50 to 70%), essential amino acids, vitamins, minerals and unsaturated fatty acid (Pandey et al., 2010;
*Corresponding author. E-mail: [email protected].
Author(s) agree that this article remain permanently open access under the terms of the Creative Commons Attribution
License 4.0 International License
Gutiérrez-Salmeán et al., 2015). More interestingly, it possesses the antioxidant and antiradical properties being attributed by phytonutrients such as phenolics, phycocyanin, tocopherol and β-carotene (Colla et al., 2007; Shalaby and Shanab, 2013; Al-Dhabi and Valan Arasu, 2016; Ismaiel et al., 2016). Thus, consumption of spirulina improved the resistance of consumers against oxidative stress. Several studies have pointed out the efficiency of spirulina as an anti-viral and anticancer (Kumar et al., 2005), anti-inflammation (Rasool et al., 2006), and anti-allergic and antibacterial (Belay, 2008). It is further reported that the antioxidant activity in spirulina extract against lipid peroxidation is even more powerful than that of synthetic antioxidants such as butylated hydroxyanisole (BHA) and butylated hydroxytoluene (BHT) (Chopra and Bishnoi, 2008; Tarko et al., 2012).
Among the Arthrospira species, Arthrospira platensis and Arthrospira maxima are the most studied and cultivated for human food, dietary supplement, and animal feed additive (Belay, 2008). There is scarce information regarding the potential of Arthrospira fusiformis especially the nutritional and bioactive composition. However, some studies have confirmed the anti-inflammatory and anti-cancer properties of A. fusiformis (Mathew et al., 1995; Rasool et al., 2006; Deng and Te-Jin, 2010). More recently, Mulokozi (2016) suggested that the cultivated A. fusiformis can replace a significant amount of the fishmeal in tilapia feeds. Nevertheless, antioxidant and nutritional contents may vary due to factors such as culture conditions, culture media, analysis methods, type and source of the organism (Habib et al., 2008; Gutiérrez-Salmeán et al., 2015; Al-Dhabi and Valan Arasu, 2016).
Spirulina can be cultivated under laboratory conditions as well as outdoor for large-scale systems. The outdoor culture systems rely mainly on Zarrouk medium (Belay, 2008; Madkour et al., 2012; Tarko et al., 2012) though it is highly expensive. Thus, efforts have been made to develop a more convenient and a less expensive culture media (Raoof et al., 2006; Chen, 2011; Gami et al., 2011; Madkour et al., 2012), which can produce high-quality spirulina biomass comparable to the standard culture medium. Cultivation trials of spirulina conducted in Tanzania used the culture medium termed as OFER, which composes fewer analytical grade chemicals as compared to those of Zarrouk medium (Mulokozi, 2016). In joining the effort to reduce the cost of production and maximizing spirulina biomass, in this study a new culture medium, namely, LCMA was introduced. The LCMA was formed by mixing a low-cost inorganic fertilizer (NPK10-20-20), two analytical grade chemicals from Zarrouk medium (sodium chloride and sodium bicarbonate) and drops of trace element solution. Moreover, the aim of this study was to assess the antioxidant components (total phenols, total flavonoids, β-carotene, and lycopene) and antioxidant properties in the fresh and dried extracts of A. fusiformis cultivated in the cost-effective medium, and
Michael et al. 189 compared the results to the standard culture medium. MATERIALS AND METHODS
Preparation of culture media and spirulina cultivation
The strain of A. fusiformis used in this study was obtained from the stock kept at the Institute of Marine Sciences, University of Dar es Salaam, Tanzania. The algal sample was previously collected from Lake Big Momela, Tanzania, and purified according to Mulokozi (2016). The stock was maintained in 2000 ml conical flasks in standard culture medium (Zarrouk). On the beginning of this study, spirulina was cultivated in two synthetic media (Table 1) whereby Zarrouk was used as a standard medium (Kumari et al., 2015) and LCMA as an alternative low-cost medium for mass culture. NPK10-20-20 fertilizer was obtained from authorized dealers of agricultural inputs farmers in Tanzania at Kariakoo Market. The analytical grade chemicals for Zarrouk medium were purchased from laboratory equipment and chemical supplier in Zanzibar (Zan-Lab Equipment).
The experiment was carried out in 10 L aquaria containing 1900 ml of culture media and 100 ml (0.038 g/L dry weight) of spirulina. Three aquaria were set for each Zarrouk and LCMA. The culture was incubated for 30 days in a growth chamber at the Department of Botany, University of Dar es Salaam at a temperature range of 28 to 30°C. Light emitting diodes (LEDs) supplying 4.5 Klux light intensity at the surface of the vessels with a photoperiod of 12/12 h light/dark cycle were used as a source of light. Aerators fixed on the air pump were used to supply air in the cultures. On harvest, some of the spirulina concentrates was kept fresh in the refrigerator for further analysis and part of spirulina concentrates were oven dried at 60°C overnight. The dry sample was ground to make powder and then stored in the refrigerator.
Preparation of spirulina extracts
Fresh and dry biomass of spirulina (0.5 g) from each LCMA and Zarrouk media were placed in the conical flasks and then soaked in 100 ml of 95% ethanol. The sample was continuously stirred to ensure complete extraction. The extracts were centrifuged for 10 min then filtered using Whatman No. 1 filter paper. Ethanol was evaporated from the supernatant in a rotary evaporator (Gmbh & Co.KG, Germany) under reduced pressure at 40°C. Extraction was repeated three times until the desired concentration of extract was obtained. The obtained extracts were stored in a refrigerator at 4°C until further analyses.
Yield of extracts The yield of ethanolic extracts of spirulina samples was calculated based on the following equation: Yield (%) = (W2 × 100) / W1 Where W1 is a weight of spirulina before evaporation/extraction and W2 is the weight of extract after evaporation.
Determination of antioxidants levels and activity in spirulina extracts Total phenolic compounds were estimated by Folin-Ciocalteu calorimetric method adapted from Pal et al. (2010). In brief, 1 ml of ethanolic extract was mixed with 1 ml of Folin-Ciocalteus’s reagent
190 Afr. J. Food Sci.
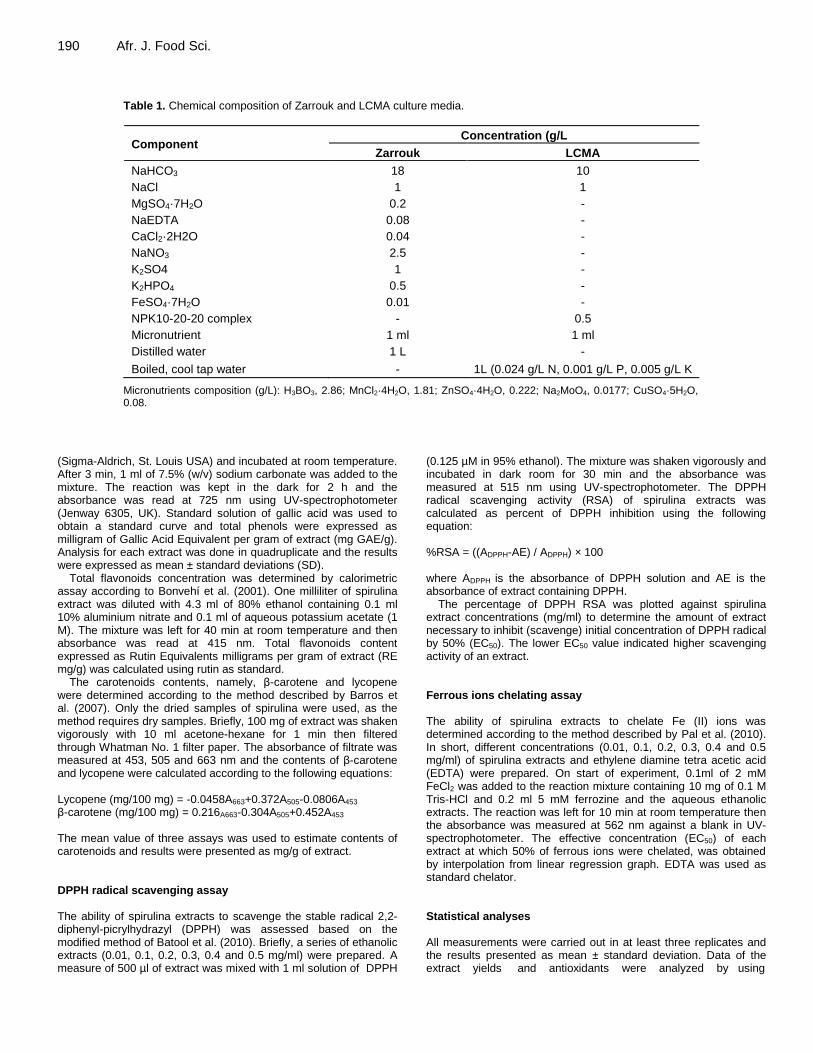
Table 1. Chemical composition of Zarrouk and LCMA culture media.
Component Concentration (g/L
Zarrouk LCMA
NaHCO3 18 10
NaCl 1 1
MgSO4·7H2O 0.2 -
NaEDTA 0.08 -
CaCl2·2H2O 0.04 -
NaNO3 2.5 -
K2SO4 1 -
K2HPO4 0.5 -
FeSO4·7H2O 0.01 -
NPK10-20-20 complex - 0.5
Micronutrient 1 ml 1 ml
Distilled water 1 L -
Boiled, cool tap water - 1L (0.024 g/L N, 0.001 g/L P, 0.005 g/L K
Micronutrients composition (g/L): H3BO3, 2.86; MnCl2·4H2O, 1.81; ZnSO4·4H2O, 0.222; Na2MoO4, 0.0177; CuSO4·5H2O, 0.08.
(Sigma-Aldrich, St. Louis USA) and incubated at room temperature. After 3 min, 1 ml of 7.5% (w/v) sodium carbonate was added to the mixture. The reaction was kept in the dark for 2 h and the absorbance was read at 725 nm using UV-spectrophotometer (Jenway 6305, UK). Standard solution of gallic acid was used to obtain a standard curve and total phenols were expressed as milligram of Gallic Acid Equivalent per gram of extract (mg GAE/g). Analysis for each extract was done in quadruplicate and the results were expressed as mean ± standard deviations (SD).
Total flavonoids concentration was determined by calorimetric assay according to Bonvehí et al. (2001). One milliliter of spirulina extract was diluted with 4.3 ml of 80% ethanol containing 0.1 ml 10% aluminium nitrate and 0.1 ml of aqueous potassium acetate (1 M). The mixture was left for 40 min at room temperature and then absorbance was read at 415 nm. Total flavonoids content expressed as Rutin Equivalents milligrams per gram of extract (RE mg/g) was calculated using rutin as standard.
The carotenoids contents, namely, β-carotene and lycopene were determined according to the method described by Barros et al. (2007). Only the dried samples of spirulina were used, as the method requires dry samples. Briefly, 100 mg of extract was shaken vigorously with 10 ml acetone-hexane for 1 min then filtered through Whatman No. 1 filter paper. The absorbance of filtrate was measured at 453, 505 and 663 nm and the contents of β-carotene and lycopene were calculated according to the following equations: Lycopene (mg/100 mg) = -0.0458A663+0.372A505-0.0806A453 β-carotene (mg/100 mg) = 0.216A663-0.304A505+0.452A453
The mean value of three assays was used to estimate contents of carotenoids and results were presented as mg/g of extract. DPPH radical scavenging assay The ability of spirulina extracts to scavenge the stable radical 2,2-diphenyl-picrylhydrazyl (DPPH) was assessed based on the modified method of Batool et al. (2010). Briefly, a series of ethanolic extracts (0.01, 0.1, 0.2, 0.3, 0.4 and 0.5 mg/ml) were prepared. A measure of 500 µl of extract was mixed with 1 ml solution of DPPH
(0.125 µM in 95% ethanol). The mixture was shaken vigorously and incubated in dark room for 30 min and the absorbance was measured at 515 nm using UV-spectrophotometer. The DPPH radical scavenging activity (RSA) of spirulina extracts was calculated as percent of DPPH inhibition using the following equation: %RSA = ((ADPPH-AE) / ADPPH) × 100 where ADPPH is the absorbance of DPPH solution and AE is the absorbance of extract containing DPPH.
The percentage of DPPH RSA was plotted against spirulina extract concentrations (mg/ml) to determine the amount of extract necessary to inhibit (scavenge) initial concentration of DPPH radical by 50% (EC50). The lower EC50 value indicated higher scavenging activity of an extract. Ferrous ions chelating assay The ability of spirulina extracts to chelate Fe (II) ions was determined according to the method described by Pal et al. (2010). In short, different concentrations (0.01, 0.1, 0.2, 0.3, 0.4 and 0.5 mg/ml) of spirulina extracts and ethylene diamine tetra acetic acid (EDTA) were prepared. On start of experiment, 0.1ml of 2 mM FeCl2 was added to the reaction mixture containing 10 mg of 0.1 M Tris-HCl and 0.2 ml 5 mM ferrozine and the aqueous ethanolic extracts. The reaction was left for 10 min at room temperature then the absorbance was measured at 562 nm against a blank in UV-spectrophotometer. The effective concentration (EC50) of each extract at which 50% of ferrous ions were chelated, was obtained by interpolation from linear regression graph. EDTA was used as standard chelator. Statistical analyses All measurements were carried out in at least three replicates and the results presented as mean ± standard deviation. Data of the extract yields and antioxidants were analyzed by using
Michael et al. 191 Table 2. The yields, contents of antioxidants, EC50 values of DPPH scavenging and Fe
2+ chelation in the Spirulina extracts.
Sample Yield (%) Phenolics
(mg GAE/g)b
Flavonoids
(RE mg/g)b
β-carotene (mg/100 mg)
a
Lycopene (mg/100 mg)
a
EC50 DPPH scavenging
(mg/ml)
EC50 Fe2+
chelation
(mg/ml)
ZM fresh 6.98±0.00 137.65±4.39 5.10±0.12 NA NA 0.3 0.078
LCMA fresh 6.83±0.01 151.45±0.70 8.30±0.141 NA NA 0.202 0.068
ZM Dry 16.21±0.32 292.17±5.50 11.25±0.5 0.17±0.00 1.06±0.01 0.26 0.014
LCMA Dry 21.63±0.04 409.28±28.78 13.25±0.5 0.89±0.00 1.28±0.02 0.11 0.001 aValues are the mean ± SD (n = 3);
bvalues are mean ± SD (n = 4). ZM: Extracts from Zarrouk medium; LCMA: extracts from LCMA medium. NA: not
applicable (the determination was done for dry samples only).
Paleontological Statistical programme (PAST ver. 2.17, Natural History Museum, University of Oslo, Norway). A two-sample t-test was used to see if there is significant difference in the yields, total phenolics, flavonoids and carotenoids between the two culture media. The differences between means at 5% (P-values less than 0.05) were considered significant.
RESULTS AND DISCUSSION Yield of spirulina extracts The extract yields of spirulina samples are shown in Table 2. The highest (21.63 ± 0.04%) and lowest (6.83 ± 0.01) yields for LCMA medium were recorded in dry and fresh extracts, respectively. In the fresh extracts, standard culture medium (Zarrouk) recorded significantly higher yield than LCMA (p < 0.001, t = 22.958). Similarly, there was significant difference (p < 0.0001, t = -28.709) among dried sample extracts with LCMA’s extracts recording higher yield (21.63 ± 0.04%) as compared to Zarrouk’s extracts (16.21 ± 0.32%). The highest yield recorded in LCMA suggests that LCMA is the best medium for the yield of spirulina biomass. The yields of the current study are higher than previously reported by Shalaby and Shanab (2013). Antioxidant contents
Table 2 also shows the antioxidant contents in spirulina extracts. The total phenolics among other antioxidants were the most abundant. All the extracts analyzed were found to have significant amount of total phenols, flavonoids and carotenoids, which are evidence for protection of human body and other spirulina consumers against oxidative damage. With regard to total phenolics, it was shown that the dried sample extracts for spirulina grown in LCMA medium contained notably higher levels (409.28 ± 28.78 mg GAE/g) as compared to other extracts. There was significant variation in phenolics between dry (p = 0.0002, t = -7.8769) and fresh extracts (p = 0.0013, t = -5.6934). Differences in phenolic contents among extracts may be caused by several factors as
previous reported (El-Baky et al., 2009; Tarko et al., 2012; Salamatullah, 2014; Ismaiel et al., 2016). For instance, Tarko et al. (2012) stated that the composition of growth media used for cultivating the selected species of Arthrospira influenced the synthesis of bioactive components and antioxidant properties. However, Wu et al. (2013) reported that organisms may produce phenols as a defensive mechanism against disease and other stress especially when nutrient is depleted. The authors also recorded higher phenolic contents in the jujube tree planted in natural unfertilized area and they linked the observations with limitation of nutrient resources. Studies on Spirulina species (Salamatullah, 2014; Ismaiel et al., 2016), associated pH rise in the culture media to the increased production of phenols so as to alleviate the oxidative stress induced by the rising pH. In the current study, pH level (not reported here) was higher in LCMA medium in few days before harvest, and it was lower for Zarrouk medium; this might have influenced the variation in total phenols.
The current results on phenols are incomparable to previous reports due to the differences in methods and extraction solvent used. For instance, the study by Machu et al. (2015), water extract of A. platensis recorded the highest level of 43.2 mg/g GAE, which is lower than that obtained in this study. Another study by Shalaby and Shanab (2013), on Spirulina platensis, recorded phenolics of 282.76 g/100 mg, which are more or less similar to the current study (for Zarrouk’s phenolics). However, Bhattacharya and Shivaprakash (2005) reported that higher phenolic contents as compared to the current study whereby Spirulina laxissima was found to contain the highest intracellular phenolics (4.46 g/100 mg), while S. platensis contained the highest extracellular phenolics (0.3 g/100 mg).
For the total flavonoids, there was significant difference in total flavonoids between dried (p = 0.0013, t = -5.6569) and fresh extracts (p < 0.0001, t = -35.054). The dried spirulina extracts from LCMA medium contained higher flavonoids than the dried extract of Zarrouk medium and the fresh extracts. In general, all extracts were found to have lower total flavonoids than the total phenols implying that large part of polyphenol compounds in
192 Afr. J. Food Sci.
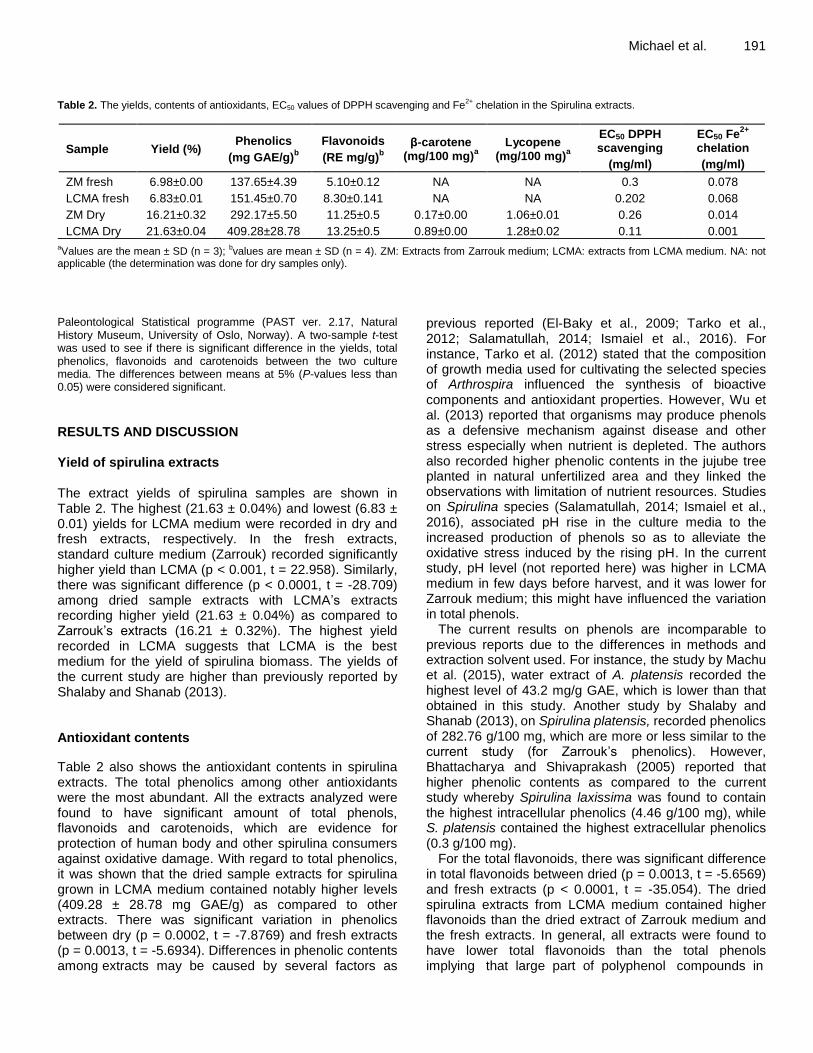
Figure 1. Scavenging activity (%) of spirulina ethanolic extracts on DPPH by fresh spirulina extracts (A) and dry extracts (B).
spirulina is phenolic substance instead of flavonoids. Other studies working on different sources of flavonoids (El-Baky et al., 2009; Salamatullah, 2014) also recorded lower amount of the flavonoids as compared to total phenols. As it is for phenolic compounds, the amount of flavonoid is also affected by the growth media (El-Baky et al., 2009).
Carotenoids are important groups of pigments found in some plants and algae. They possess strong antioxidant properties (Rao and Agarwal, 2000; Pal et al., 2010) and thought to be an anti-cancer agents (Gutiérrez-Salmeán et al., 2015). Beta carotene is a fat soluble pigment and is known as precursor of vitamin A in mammals (Pal et al., 2010), it bio-transforms into vitamin A once absorbed (Gutiérrez-Salmeán et al., 2015). In the current study, the content of β-carotene was higher in spirulina extract cultured in LCMA medium as compared to Zarrouk medium (Table 2). The reason for such variation may be due to the differences in the composition and amount of nutrients used for preparing the culture media. The investigations by Tarko et al. (2012) reveled that β-carotene contents of different strains of spirulina was strongly influenced by the growth medium whereby the standard Zarrouk medium was superior over the low-cost medium. In the current study, although the values of β-carotene are lower than reported by Tarko et al. (2012) but the LCMA recorded higher content than Zarrouk medium. Moreover, the β-carotene contents reported in the current study are much lower than previously reported (Bhattacharya and Shivaprakash, 2005; Belay, 2008; Gutiérrez-Salmeán et al., 2015) for other species of spirulina. Contrary, the content of β-carotene for S. laxissima reported by Bhattacharya and Shivaprakash (2005) was much lower than those in the current study. Earlier study demonstrated that the β-carotene is the most fluctuating pigment among other carotenoids, and
the variation can even be more than 40 times, that is, from 10 to 400 mg/100 g (Tarko et al., 2012).
For lycopene content, this study is the first found lycopene in spirulina (A. fusiformis). Spirulina extracts cultured in LCMA medium was found to have significantly (p < 0.0001, t = -20.863) higher lycopene contents than that of Zarrouk. The amount of lycopene reported here are slightly higher than that present in edible mushrooms (Barros et al., 2007; Robaszkiewicz et al., 2010). Variations in lycopene contents are associated with variety of factors such as climatic conditions (Wawrzyniak et al., 2005) geographic location, fertilizer used and plant variety (Bhumsaidon and Chamchong, 2016). Radical scavenging activity (RSA) using DPPH The DPPH is a stable free radical, which possesses a characteristic absorption at 515 nm, the absorption decreases regularly upon exposure to radical-scavenging species. A lower absorbance indicates high radical scavenging activity of an extract (Barros et al., 2007). DPPH was selected to evaluate the antioxidant activities of spirulina extracts because it is the most effective and standard method for assessing the radical scavenging activity of a particular extract (Amarowicz et al., 2004; Maisuthisakul et al., 2007). Figure 1 shows the DPPH RSA of both fresh and dry spirulina extracts cultured in Zarrouk and LCMA media. The dry extract from LCMA exhibited strongest scavenging activity than all other extracts thereby quenching 95% of the DPPH radicals at the concentration of 0.5 mg/ml. The scavenging activities of other extracts at 0.5 mg/ml were 87, 81 and 72% for fresh spirulina in LCMA, dry and fresh spirulina in Zarrouk media, respectively. Though the extracts showed good scavenging activities, there was no significant variation
Michael et al. 193
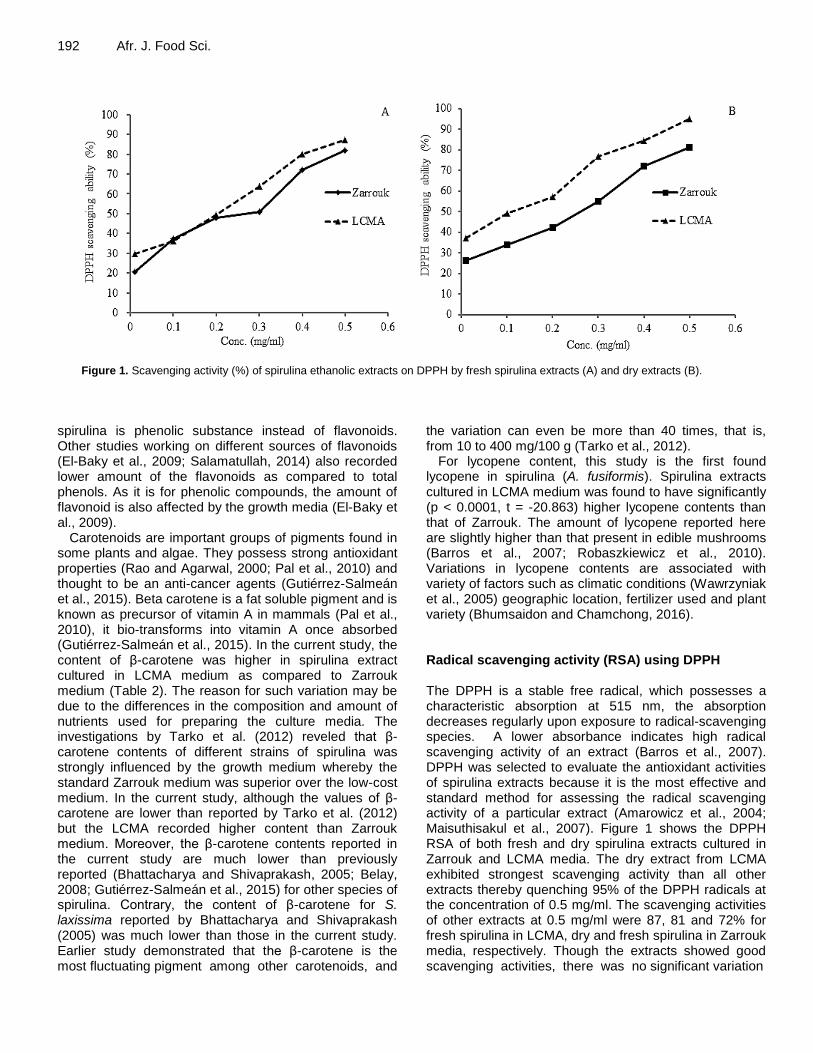
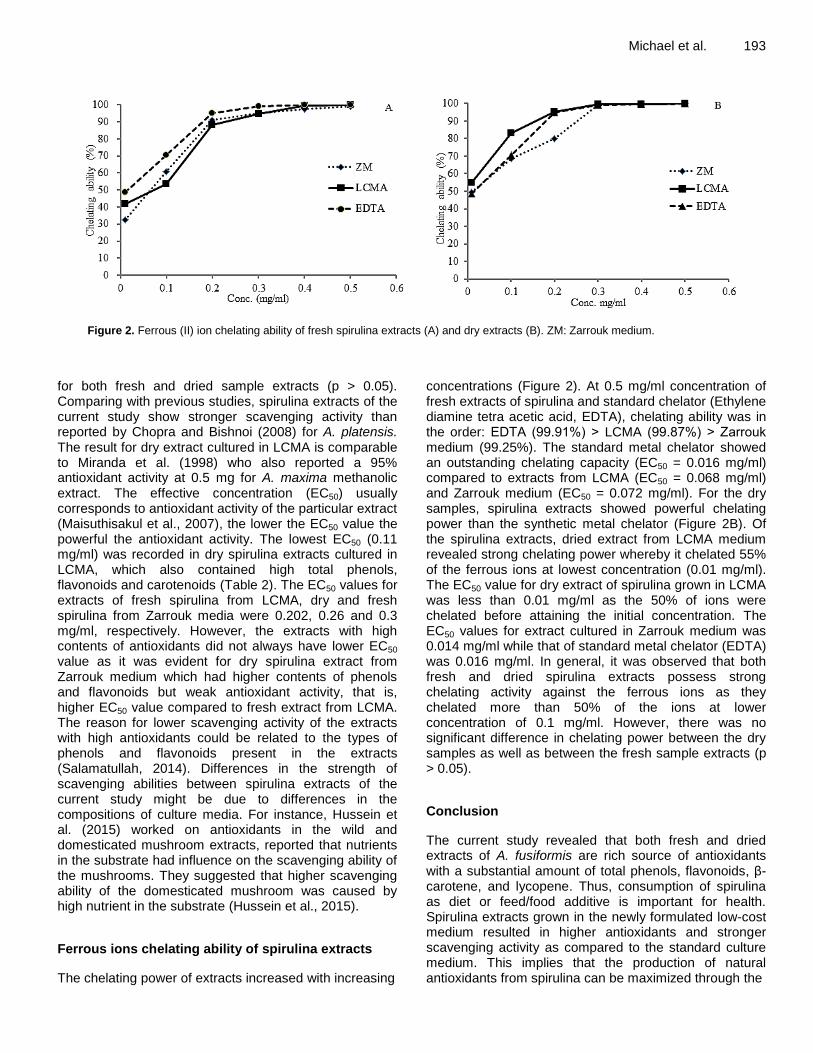
Figure 2. Ferrous (II) ion chelating ability of fresh spirulina extracts (A) and dry extracts (B). ZM: Zarrouk medium.
for both fresh and dried sample extracts (p > 0.05). Comparing with previous studies, spirulina extracts of the current study show stronger scavenging activity than reported by Chopra and Bishnoi (2008) for A. platensis. The result for dry extract cultured in LCMA is comparable to Miranda et al. (1998) who also reported a 95% antioxidant activity at 0.5 mg for A. maxima methanolic extract. The effective concentration (EC50) usually corresponds to antioxidant activity of the particular extract (Maisuthisakul et al., 2007), the lower the EC50 value the powerful the antioxidant activity. The lowest EC50 (0.11 mg/ml) was recorded in dry spirulina extracts cultured in LCMA, which also contained high total phenols, flavonoids and carotenoids (Table 2). The EC50 values for extracts of fresh spirulina from LCMA, dry and fresh spirulina from Zarrouk media were 0.202, 0.26 and 0.3 mg/ml, respectively. However, the extracts with high contents of antioxidants did not always have lower EC50 value as it was evident for dry spirulina extract from Zarrouk medium which had higher contents of phenols and flavonoids but weak antioxidant activity, that is, higher EC50 value compared to fresh extract from LCMA. The reason for lower scavenging activity of the extracts with high antioxidants could be related to the types of phenols and flavonoids present in the extracts (Salamatullah, 2014). Differences in the strength of scavenging abilities between spirulina extracts of the current study might be due to differences in the compositions of culture media. For instance, Hussein et al. (2015) worked on antioxidants in the wild and domesticated mushroom extracts, reported that nutrients in the substrate had influence on the scavenging ability of the mushrooms. They suggested that higher scavenging ability of the domesticated mushroom was caused by high nutrient in the substrate (Hussein et al., 2015).
Ferrous ions chelating ability of spirulina extracts
The chelating power of extracts increased with increasing
concentrations (Figure 2). At 0.5 mg/ml concentration of fresh extracts of spirulina and standard chelator (Ethylene diamine tetra acetic acid, EDTA), chelating ability was in the order: EDTA (99.91%) ˃ LCMA (99.87%) ˃ Zarrouk medium (99.25%). The standard metal chelator showed an outstanding chelating capacity (EC50 = 0.016 mg/ml) compared to extracts from LCMA (EC50 = 0.068 mg/ml) and Zarrouk medium (EC50 = 0.072 mg/ml). For the dry samples, spirulina extracts showed powerful chelating power than the synthetic metal chelator (Figure 2B). Of the spirulina extracts, dried extract from LCMA medium revealed strong chelating power whereby it chelated 55% of the ferrous ions at lowest concentration (0.01 mg/ml). The EC50 value for dry extract of spirulina grown in LCMA was less than 0.01 mg/ml as the 50% of ions were chelated before attaining the initial concentration. The EC50 values for extract cultured in Zarrouk medium was 0.014 mg/ml while that of standard metal chelator (EDTA) was 0.016 mg/ml. In general, it was observed that both fresh and dried spirulina extracts possess strong chelating activity against the ferrous ions as they chelated more than 50% of the ions at lower concentration of 0.1 mg/ml. However, there was no significant difference in chelating power between the dry samples as well as between the fresh sample extracts (p > 0.05).
Conclusion
The current study revealed that both fresh and dried extracts of A. fusiformis are rich source of antioxidants with a substantial amount of total phenols, flavonoids, β-carotene, and lycopene. Thus, consumption of spirulina as diet or feed/food additive is important for health. Spirulina extracts grown in the newly formulated low-cost medium resulted in higher antioxidants and stronger scavenging activity as compared to the standard culture medium. This implies that the production of natural antioxidants from spirulina can be maximized through the
194 Afr. J. Food Sci. use of cost-saving culture medium, the LCMA. However, it was noted that sometimes the extracts with higher antioxidants do not always express powerful antioxidant activity. This calls for further studies to assess the types of phenols and flavonoids in spirulina extracts. CONFLICT OF INTERESTS The authors have not declared any conflict of interests. ACKNOWLEDGEMENTS
The authors are very grateful to the Swedish International Development Cooperation Agency (Sida)-Bilateral Marine Science Programme (BMSP) for financing the research. They further extend their appreciation to the Institute of Marine Sciences, University of Dar es Salaam for providing laboratory facilities. Mr. Charles Kweyunga of Botany Department, University of Dar es Salaam is acknowledged for technical assistance in sample analysis. REFERENCES Al-Dhabi NA, Valan-Arasu M (2016). Quantification of phytochemicals
from commercial spirulina products and their antioxidant activities. Evidence-Based Complementary and Alternative Medicine 2016:1-8.
Amarowicz R, Pegg R, Rahimi-Moghaddam P, Barl B, Weil J (2004). Free-radical scavenging capacity and antioxidant activity of selected plant species from the Canadian prairies. Food Chemistry 84:551-562.
Barros L, Ferreira MJ, Queiros B, Ferreira IC, Baptista P (2007). Total phenols, ascorbic acid, β-carotene and lycopene in Portuguese wild edible mushrooms and their antioxidant activities. Food Chemistry 103:413-419.
Batool F, Sabir SM, Rocha J, Shah AH, Saify ZS, Ahmed SD (2010). Evaluation of antioxidant and free radical scavenging activities of fruit extract from Zanthoxylum alatum: a commonly used spice from Pakistan. Pakistan Journal of Botany 42:4299-4311.
Belay A (2008). Spirulina (Arthrospira): Production and quality assurance. In: Spirulina in Human Nutrition and Health, (Gershwin M, Belay A (eds.), Boca Raton: CRC Press, London. pp. 1-26
Bhattacharya S, Shivaprakash M (2005). Evaluation of three Spirulina species grown under similar conditions for their growth and biochemicals. Journal of the Science of Food and Agriculture 85:333-336.
Bhumsaidon A, Chamchong M (2016). Variation of lycopene and beta-carotene contents after harvesting of gac fruit and its prediction. Agriculture and Natural Resources 50:257-263.
Bonvehí JS, Torrent MS, Lorente EC (2001). Evaluation of polyphenolic and flavonoid compounds in honeybee-collected pollen produced in Spain. Journal of Agricultural and Food Chemistry 49:1848-1853.
Chen YC (2011). The effect of shifts in medium types on the growth and morphology of Spirulina platensis (Arthrospira platensis). Journal of Marine Science and Technology 19:565-570.
Chopra K, Bishnoi M (2008). Antioxidant profile of Spirulina: a blue-green microalga. In: Spirulina in Human Nutrition and Health, Gershwin M, Belay A (eds.), Boca Raton: CRC Press, London. pp. 101-118.
Colla LM, Furlong EB, Costa JAV (2007). Antioxidant properties of spirulina (Arthospira) platensis cultivated under different temperatures and nitrogen regimes. Brazilian Archives of Biology and Technology 50:161-167.
Deng R, Te-Jin C (2010). Hypolipidemic, antioxidant, and anti-
inflammatory activities of microalgae spirulina. Cardiovascular Therapeutics 28:33-45.
El-Baky HA, El Baz FK, El-Baroty GS (2009). Production of phenolic compounds from Spirulina maxima microalgae and its protective effects. African Journal of Biotechnology 8:7059-7067.
Gami B, Naik A, Patel B (2011). Cultivation of spirulina species in different liquid media. Journal of Algal Biomass Utilization 2:15-26.
Germán Chamorro-Cevallos BLB, Vázquez-Sánchez AJ (2008). Toxicologic Studies and Antitoxic Properties of Spirulina. In: Spirulina in Human Nutrition and Health, (Gershwin M, Belay A (eds,),. Boca Raton: CRC Press, London. pp. 28-44.
Gutiérrez-Salmeán G, Fabila-Castillo L, Chamorro-Cevallos G (2015). Nutritional and toxicological aspects of spirulina (Arthrospira). Nutricion Hospitalaria 32:34-40.
Habib MAB, Parvin M, Huntington TC, Hasan MR (2008). A review on culture, production and use of spirulina as food for humans and feeds for domestic animals and fish. Food and Agriculture Organization of the United Nations (FAO), Rome.
Hussein J, Tibuhwa D, Mshandete A, Kivaisi A (2015). Antioxidant properties of seven wild edible mushrooms from Tanzania. African Journal of Food Science 9:471-479.
Ismaiel MMS, El-Ayouty YM, Piercey-Normore M (2016). Role of pH on antioxidants production by Spirulina (Arthrospira) platensis. Brazilian Journal of Microbiology 47:298-304.
Kumar M, Sharma MK, Kumar A (2005). Spirulina fusiformis: a food supplement against mercury induced hepatic toxicity. Journal of Health Science 51:424-430.
Kumari A, Pathak AK, Guria C (2015). Cost-effective cultivation of Spirulina platensis using NPK fertilizer. Agricultural Research 4:261-271.
Machu L, Misurcova L, Vavra Ambrozova J, Orsavova J, Mlcek J, Sochor J, Jurikova T (2015). Phenolic content and antioxidant capacity in algal food products. Molecules 20:1118-1133.
Madkour FF, Kamil AEW, Nasr HS (2012). Production and nutritive value of Spirulina platensis in reduced cost media. The Egyptian Journal of Aquatic Research 38:51-57.
Maisuthisakul P, Suttajit M, Pongsawatmanit R (2007). Assessment of phenolic content and free radical-scavenging capacity of some Thai indigenous plants. Food Chemistry 100:1409-1418.
Mathew B, Sankaranarayanan R, Nair PP, Varghese C, Somanathan T, Amma BP, Amma NS, Nair MK (1995). Evaluation of chemoprevention of oral cancer with Spirulina fusiformis. Nutrition and Cancer 24:197-202.
Miranda M, Cintra R, Barros S, Mancini-Filho J (1998). Antioxidant activity of the microalga Spirulina maxima. Brazilian Journal of Medical and Biological Research 31:1075-1079.
Mulokozi D (2016). Spirulina (Arthrospira spp) culture and its use as a protein source for Rufiji tilapia (Oreochromis urolepis urolepis Norman, 1922) Mariculture. M. Sc. Thesis. University of Dar es Salaam, Tanzania. P 116.
Pal J, Ganguly S, Tahsin KS, Acharya K (2010). In vitro free radical scavenging activity of wild edible mushroom, Pleurotus squarrosulus (Mont.) Singer. Indian Journal of Experimental Biology 48(12):1210-1218.
Pandey J, Pathak N, Tiwari A (2010). Standardization of pH and light intensity for the biomass production of Spirulina platensis. Journal of Algal Biomass Utilization 1:93-102.
Rao AV, Agarwal S (2000). Role of antioxidant lycopene in cancer and heart disease. Journal of the American College of Nutrition 19:563-569.
Raoof B, Kaushik B, Prasanna R (2006). Formulation of a low-cost medium for mass production of Spirulina. Biomass and Bioenergy 30:537-542.
Rasool M, Sabina EP, Lavanya B (2006). Anti-inflammatory effect of Spirulina fusiformis on adjuvant-induced arthritis in mice. Biological and Pharmaceutical Bulletin 29:2483-2487.
Robaszkiewicz A, Bartosz G, Ławrynowicz M, Soszyński M (2010). The role of polyphenols, β-carotene, and lycopene in the antioxidative action of the extracts of dried, edible mushrooms. Journal of Nutrition and Metabolism pp. 1-9.
Salamatullah A (2014). Characterization of extraction methods to

recover phenolic-rich antioxidants from blue green algae (spirulina) using response surface approaches. M. Sc. Thesis. Univerity of Nebraska, Lincoln. 94 p.
Shalaby EA, Shanab SM (2013). Comparison of DPPH and ABTS assays for determining antioxidant potential of water and methanol extracts of Spirulina platensis. Indian Journal of Geo-Marine Sciences 42:556-564.
Tarko T, Duda-Chodak A, Kobus M (2012). Influence of growth medium composition on synthesis of bioactive compounds and antioxidant properties of selected strains of Arthrospira Cyanobacteria. Czech Journal of Food Science 30:258-267.
Michael et al. 195 Wawrzyniak A, Marciniak A, Rajewska J (2005). Lycopene content of
selected foods available on the polish market and estimation of its intake. Polish Journal of Food and Nutrition Sciences 14:195-200.
Wu CS, Gao QH, Kjelgren RK, Guo XD, Wang M (2013). Yields, phenolic profiles and antioxidant activities of Ziziphus jujube Mill. in response to different fertilization treatments. Molecules 18:12029-12040.
Vol. 12(8) pp. 196-203, August 2018
DOI: 10.5897/AJFS2017.1650
Article Number: 4D1156857784
ISSN: 1996-0794
Copyright ©2018
Author(s) retain the copyright of this article
http://www.academicjournals.org/AJFS
African Journal of Food Science
Full Length Research Paper
Nutritional potential of underutilized gum arabic tree seeds (acacia nilotica) and locust bean seeds
(Parkia biglobosa)
Ajayi K.1*, Adepoju O. T.2, Taiwo O. M.1, Omojola S. T.1 and Aladetuyi M. E.1
1Department of Human Nutrition and Dietetics, College of Medicine and Health Sciences, Afe Babalola University,
P. M. B. 5454, Ado Ekiti, Ekiti State, Nigeria. 2Department of Human Nutrition, Faculty of Public Health, College of Medicine, University of Ibadan, Ibadan,
Oyo State, Nigeria.
Received 21 August, 2017; Accepted 13 September, 2017
Acacia nilotica seed (ANS) and Parkia biglobosa seed (PBS) are underutilised legume found to have health benefits and functional properties. This study determined nutrient composition of A. nilotica and P. biglobosa seeds. ANS and PBS were collected and processed properly for chemical analysis. The proximate, minerals, vitamins, essential amino-acids, and antinutrient composition were analyzed to ascertain nutritional attributes and its potential in promoting dietary diversity. The raw and fermented A. nilotica seeds contained in g/100 g, protein (12.88 to 15.38), fat (3.29 to 4.91), ash (5.24 to 6.84), dietary fibre (1.98 to 2.66) and available carbohydrate (69.63 to 71.73), while the FPB contained in g/100 g, protein (18.30), fat (9.20), ash (8.69), dietary fibre (2.61), and available carbohydrate (56.27). The fermented A. nilotica (FAN) seed contained all the nine (9) essential amino acids. The raw and fermented ANS contained in mg/100 g, iron (9.67 to 12.23), zinc (0.69 to 1.13), calcium (0.17 to 0.22), sodium (0.14-0.21) while the FPB seed contained 14.86, 1.59, 0.25, and 0.24, respectively. FAN and FPB contained in µg/100 g, vitamin A (148.79 and 197.81), vitamin E (15.90 and 24.69) and vitamin K (1.41 and 1.63), respectively. The levels of antinutrient factors in all the samples were not significant. Fermented A. nilotica seed contained adequate level of some micronutrients and essential amino acids. Consumption of the seed should therefore be promoted.
Key words: Nutrient composition, dietary diversity, underutilized legumes, essential amino acid, functional properties, proximate composition, antinutritional factors.
INTRODUCTION Globally, the nutritional value of legumes is gaining considerable interest due to the demand for healthy and nutritious foods. Presently, attention towards underutilized
legumes is increasing to find new alternate protein sources to meet the ever increasing demand for vegetable protein (Pugalenthi et al., 2005). In developing
*Corresponding author. E-mail: [email protected].
Author(s) agree that this article remain permanently open access under the terms of the Creative Commons Attribution
License 4.0 International License
countries, underutilized legumes households particularly, during drought, famine and dry season (Magbagbeola et al., 2010). Legumes are the life-savers for millions of resource poor people where ensuring food and nutritional security is one of the significant problems, particularly in traditional subsistence farming systems (Haq, 2002). Deficiencies of micronutrients are a major global health problem. It is estimated that 1.2 billion people in the world do not have enough food to meet their daily requirements and a further 2 billion people in the world today are estimated to be deficient in key vitamins and minerals, particularly vitamin A, iodine, iron and zinc (FAO, 2012).
Dietary diversification is a proven cost-effective strategy to ameliorate malnutrition. The loss of dietary diversity has many implications for the nutrition and health of rural communities including loss of income generation and decreased consumption of diverse foods. The multiple benefits of preservation and promotion of indigenous foods range from a collateral benefit on biodiversity and environmental sustainability to improving micronutrient intakes (Bharucha and Pretty, 2010). In many communities in south west Nigeria, edible fruits from wild plants are often taken as food or added to food as condiment to supplement important minerals and vitamins in human diets (Olujobi, 2012). In order to address protein malnutrition and food security issues in developing countries, there is need to emphasize the utilization of legumes as a low-cost dietary vegetable protein source.
Acacia nilotica is a species of Acacia (wattle) native to Africa and the Indian subcontinent. In India, it is called gum arabic tree, kikar, babul or Indian gum arabica tree and recognized worldwide as a multipurpose tree (National Academy of Sciences, 1980). A. nilotica has both nutritional and medicinal values based on the presence of numerous secondary metabolites and essential metals (Bwai et al., 2015). However, A. nilotica has not attracted much attention in Nigeria and it is an under-exploited legume that has many medicinal properties found mainly on the bark, stem, pods, gum, trunk, and leaves of the gum arabic tree (A. nilotica).
A. nilotica seeds can be fermented and serve as a seasoning like fermented P. biglobosa and also provide essential macro and micro nutrients when consumed. This seed has the potential to assume a more important role globally in the sustainable supply of diverse and nutritious food if given appropriate attention by agriculturists and nutritionists. Hence, this study determined the nutrient composition of A. nilotica seeds and compares them with P. biglobosa, to find out if A. nilotica seeds are nutritious and safe for consumption.
MATERIALS AND METHODS
Sample collection
A. nilotica seed pods were collected from Odo-Owa in Ijero Local
Ajayi et al. 197 Government Area, Ekiti State, Nigeria. Freshly fermented P. biglobosa seed samples were purchased from Oja Oba market; a local main market situated in Ado-Ekiti, Ekiti State, Nigeria.
Sample preparation and analysis The seed pods were separated from the fruit. Foreign materials and dirt were removed from the seed pods by hand picking and washing. The seedpods were boiled in a pressure pot for 5 to 6 h. When it was well boiled, the seed pods were dehulled and the whole cotyledons were separated from the pods. The dehulled cotyledons were washed properly with distilled water, and drained appropriately. They were further cooked in distilled water for 1 h, drained, and allowed to cool, then separated in two places. One half of the raw cooked seeds was dried in its solid form in an air oven at 65°C for 20 h, blended and packaged properly for chemical analysis, while the other half was spread in calabash lined with banana leaves (Musa acuminata) and was well covered with more banana leaves. Fermentation process was carried out for 4 days. The fermented samples were oven dried at 65°C for 20 h, blended (using Marlex; Excella mixer grinder with 3 stainless steel jars, made in India. Reg. trademark no: 277985) and finally packaged for chemical analysis. The fermented P. biglobosa seed samples was also dried in an air oven at 65°C for 20 h, blended (using Marlex; Excella mixer grinder with 3 stainless steel jars, made in India. Reg. trademark no: 277985) and packaged for chemical analysis. The sample preparation was done in the dietetics kitchen, Afe Babalola University Ado-Ekiti.
Proximate composition and amino acid determination Moisture content of raw and fermented A. nilotica seed, and fermented P. biglobosa were analyzed by drying method, crude fat by Soxhlet extraction method and crude protein by semimicro-Kjeldhal method (AOAC, 1996). Crude ash was determined by incinerating in a muffle furnace at 550°C (AOAC, 1996). Dietary fibre was determined by enzymatic gravimetric method – Prosky (AOAC, 1995). Available carbohydrate value was calculated as the difference between 100 and the sum of the percentages of water, protein, crude fat, ash and dietary fibre.
The samples were mixed in a laboratory blender, hydrolyzed at 150°C for about 90 min and the solution was used for the determination of amino acids by the modified Waters ‘Pictotag’system described by Bidlingmeyer et al. (1984).
Determination of minerals
Potassium and sodium content of the samples were determined by digesting the ash of the samples with perchloric acid and nitric acid, and then taking the readings on Jenway digital flame photometer/spectronic20 (Bonire et al., 1990). Calcium, magnesium, iron, zinc, copper and selenium content of the samples were determined from the digested ash of the samples spectrophoto-metrically by using Buck 200 atomic absorption spectrophotometer (Buck Scientific, Norwalk) (Essien et al., 1992) and compared with absorption of standards of these minerals.
Vitamin analysis
Vitamin A determination (AOAC Method 960.5 & 974.29, 2005) Vitamin A was determined through ultraviolet absorption measurement at 328 nm after extraction with chloroform.
198 Afr. J. Food Sci. Calibration curve of vitamin A acetate was made and sample vitamin A concentration estimated as microgram (μg) of vitamin A acetate. Thiamine (Vitamin B1) determination (Woollard and Indyk, 2002) Thiamine content of the samples was determined by weighing 1 g of each sample into 100 ml volumetric flask and adding 50 ml of 0.1 M H2SO4 and boiled in a boiling water bath with frequent shaking for 30 min. Five milliliters of 2.5 M sodium acetate solution was added and flask set in cold water to cool contents below 500°C. The flask was stoppered and kept at 45 to 500°C for 2 h and thereafter made up to 100 ml mark. The mixture was filtered through a No. 42 Whatman filter paper, discarding the first 10 ml. 10 ml was pipetted from remaining filtrate into a 50 ml volumetric flask and 5 ml of acid potassium chloride solution was added with thorough shaking. Standard thiamine solutions were prepared and treated same way. The absorbance of the sample as well as that of the standards was read on a fluorescent UV spectrophotometer (Cecil A20 Model) at a wavelength of 285 nm.
Riboflavin (Vitamin B2) determination (AOAC Official Method 981.15, 1995)
One gram of each sample was weighed into a 250 ml volumetric flask, 5 ml of 1 M HCl was added, followed by the addition of 5 ml of dichloroethene. The mixture was shaken and 90 ml of de-ionized water was added. The whole mixture was thoroughly shaken and heated on a steam bath for 30 min to extract all the riboflavin. The mixture was then cooled and made up to volume with de-ionized water. It was then filtered, discarding the first 20 ml of the aliquot. 2 ml of the filtrate obtained was pipetted into another 250 ml volumetric flask and made up to mark with de-ionized water. Sample was read on the fluorescent spectrophotometer at a wavelength of 460 nm. Standard solutions of riboflavin were prepared and readings taken at 460 nm, and the sample riboflavin obtained through calculation. Niacin (Vitamin B3) determination (AOAC Methods 944.13, 985.34, 2000) Five grams of blended sample was extracted with 100 ml of distilled water. Five millilitres of this solution was drawn into 100 ml volumetric flask and made up to the mark with distilled water. Standard solutions of niacin were prepared and absorbance of sample and standard solutions were measured at a wavelength of 385 nm on a spectrophotometer and niacin concentration of the sample estimated. Determination of Vitamin B6, B9 and B12 (Antakli et al., 2015) Vitamin B6, B9 and B12 were determined with simple ion-pair RP-HPLC validated method using a C18 column with two different detectors, photodiode array detector (UV-DAD) and fluorescence detector (FLD). Ascorbic acid determination (AOAC official Method 967.21, 2005)
Ascorbic acid in the sample was determined by titrating its aqueous
extract with solution of 2,6-dichlorophenol-indophenol dye to a faint pink end point.
Tocopherol (Vitamin E) determination
One gram of sample was weighed into a 250 ml conical flask fitted with a reflux condenser wrapped in aluminium foil, and refluxed with 10 ml of absolute ethanol and 20 ml of 1 M ethanolic sulphuric acid for 45 min. The resultant solution was cooled for 5 min, followed by addition of 50 ml of distilled water and then transferred into a separating funnel covered with aluminium foils. The unsaponifiable matter in the mixture was extracted with 5 x 50 ml diethyl ether. The combined extract was washed free of acid and dried over anhydrous sodium sulphate. The extract was later evaporated at a low temperature and the residue obtained was immediately dissolved in 10 ml absolute alcohol. Aliquots of solutions of the sample and standard were transferred to a 20 ml volumetric flask. 5 ml absolute ethanol was added, followed by a careful addition of 1 ml concentrated HNO3 and placed on a water bath at 900°C
Determination of Vitamins D and K
Vitamins D and K were determined by methods described by AOAC Official Method 2016.05 and 2015.09, respectively
Antinutrient determination
The phytate content was determined using the method adopted by Mohammed et al. (1986). Oxalates were determined by the official method of analysis (AOAC, 1990) and tannins determined as described by Bainbridge et al. (1996). The quantification of saponin levels was done using afrosimetric method (Koziol, 1990) while the trypsin inhibitory activity was determined on casein and comparing the absorbance with that of trypsin standard solutions read at 280 nm (Makkar and Becker, 1996).
Data analysis
Statistical Package for Social Sciences (SPSS) for Windows, version 15.0 (SPSS Inc. Chicago, IL.USA) was used for data analysis. The means and standard error of mean were calculated for all values. A. nilotica and P. biglobosa samples were compared using analysis of variance (ANOVA). Differences between samples were determined using Fisher’s least significant difference (LDS) test. P < 0.05 was considered significant.
RESULTS AND DISCUSSION
Proximate composition
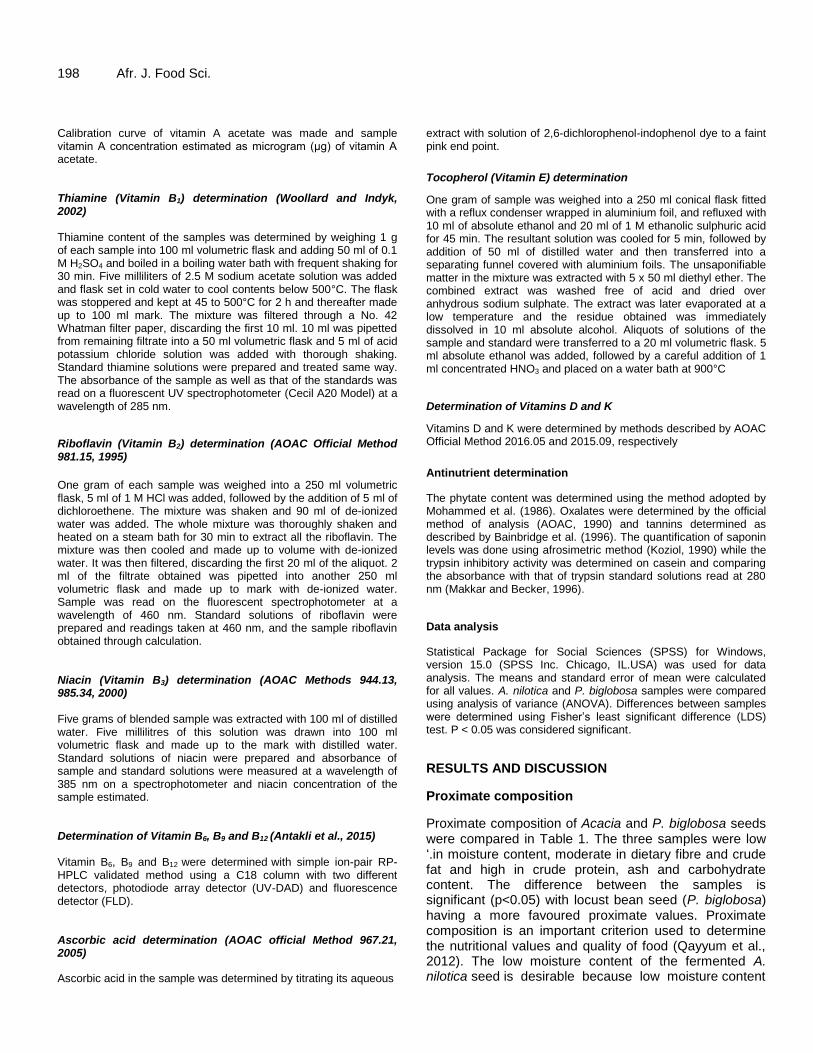
Proximate composition of Acacia and P. biglobosa seeds were compared in Table 1. The three samples were low ‘.in moisture content, moderate in dietary fibre and crude fat and high in crude protein, ash and carbohydrate content. The difference between the samples is significant (p<0.05) with locust bean seed (P. biglobosa) having a more favoured proximate values. Proximate composition is an important criterion used to determine the nutritional values and quality of food (Qayyum et al., 2012). The low moisture content of the fermented A. nilotica seed is desirable because low moisture content
Ajayi et al. 199
Table 1. Proximate composition of gum arabic tree seeds (A. nilotica) and locust bean seeds (P. biglobosa) (g/100 g).
Parameters Raw Acacia nilotica Fermented Acacia nilotica Fermented Parkia biglobosa
Moisture 3.08±0.02a 2.39±0.03
b 4.92±0.02
c
Crude proteina 12.88±0.05
a 15.38±0.06
b 18.30±0.01
c
Crude fata 4.91±0.01
a 3.29±0.02
b 9.20±0.02
c
Fibrea 2.66±0.01
a 1.98±0.02
b 2.61±0.01
a
Asha 6.84±0.07
a 5.24±0.02
b 8.69±0.01
c
Carbohydratea 69.63±0.08
a 71.73±0.02
b 56.27±0.07
c
Values are mean ±SEM, n =3. Value with different superscripts on the same row are significantly different (P<0.05).
aValues are on dry weight basis.
Table 2. Essential amino acid (%) in gum arabic tree seeds (A. nilotica), and locust bean seeds (P. biglobosa).
Parameters Fermented A. nilotica Fermented P. biglobosa
Arginine 2.99±0.02a
4.18±0.01b
Isoleucine 3.31±0.02a
4.91±0.02b
Leucine 6.54±0.01a
9.41±0.02b
Histidine 2.01±0.03a
2.40±0.02b
Methionine 1.51±0.02a
1.79±0.01b
Lysine 5.37±0.01a
8.09±0.01b
Threonine 4.91±0.01a
7.05±0.01b
Phenylalanine 3.11±0.01a
4.69±0.01b
Valine 6.29±0.02a
8.30±0.01b
Values are mean ±SEM, n =2. Value with different superscripts on the same row are significantly different (P<0.05).
Values are on dry weight bas
discourages the growth of bacteria and mold, and enhances stability and shelf life.
Fermented P. biglobosa seed has the highest protein value (18.30 g/100 g) as compared to the fermented acacia seed (15.38 g/100 g) and raw acacia seed (12.88 g/100 g). Fermentation increase protein content. Fagbemi et al. (2005) reported protein increase in fermented fluted pumpkin (Telfairia occidentalis) seeds for production of ‘Ogiri ugu’ also, Enujiugha (2003), Omafuvbe et al. (2004) and Pelig-Ba (2009) observed similar trends from their studies. The increase in amino acid content with fermentation time is especially important from the nutritional point of view as it would increase digestibility and absorption. Dietary proteins usually play an important role in natural synthesis and maintenance of body tissues, enzymes and hormones as well as other substances that are required for healthy functioning (Hayat et al., 2014).
Slight decrease was observed in ash content of the fermented A. nilotica seed as compared to the raw seeds. Loss in ash contents may be due to leaching of soluble inorganic salts into the processing water during the
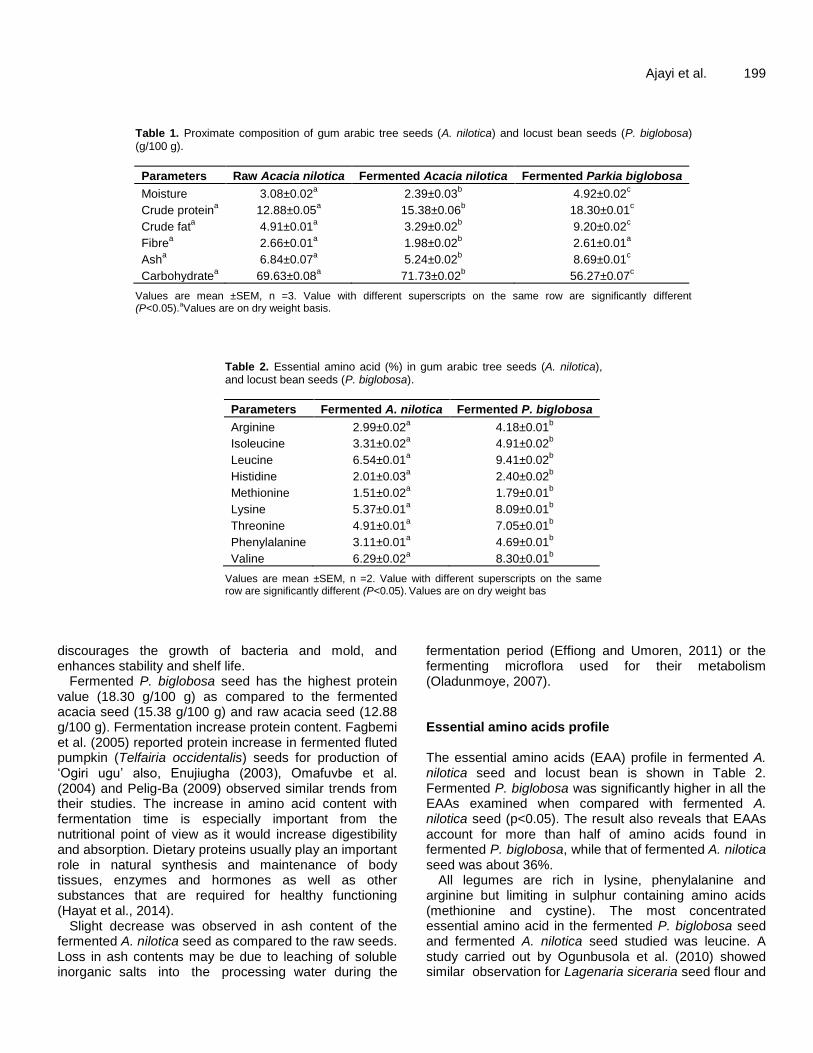
fermentation period (Effiong and Umoren, 2011) or the fermenting microflora used for their metabolism (Oladunmoye, 2007). Essential amino acids profile The essential amino acids (EAA) profile in fermented A. nilotica seed and locust bean is shown in Table 2. Fermented P. biglobosa was significantly higher in all the EAAs examined when compared with fermented A. nilotica seed (p<0.05). The result also reveals that EAAs account for more than half of amino acids found in fermented P. biglobosa, while that of fermented A. nilotica seed was about 36%.
All legumes are rich in lysine, phenylalanine and arginine but limiting in sulphur containing amino acids (methionine and cystine). The most concentrated essential amino acid in the fermented P. biglobosa seed and fermented A. nilotica seed studied was leucine. A study carried out by Ogunbusola et al. (2010) showed similar observation for Lagenaria siceraria seed flour and
200 Afr. J. Food Sci.
Table 3. Minerals composition gum arabic tree seeds (A. nilotica) and locust bean seeds (P. biglobosa) (mg/100 g).
Parameter Raw A. nilotica Fermented A. nilotica Fermented P. biglobosa
Sodium 0.14±0.00a
0.21±0.00b
0.24±0.00c
Potassium 0.33±0.00a
0.59±0.00b
0.73±0.00c
Magnesium 0.21±0.00a
0.24±0.00b
0.27±0.00c
Calcium 0.17±0.00a
0.22±0.00b
0.25±0.00c
Zinc 0.69±0.02a
1.13±0.02b
1.59±0.02c
Iron 9.67±0.01a
12.23±0.03b
14.86±0.01c
Copper 0.16±0.01a
0.39±0.02b
0.67±0.02c
Selenium 0.12±0.00a
0.28±0.02b
0.51±0.01c
Values are mean ±SEM, n =3. Value with different superscripts on the same row are significantly different (P<0.05).
Values are on dry weight basis.
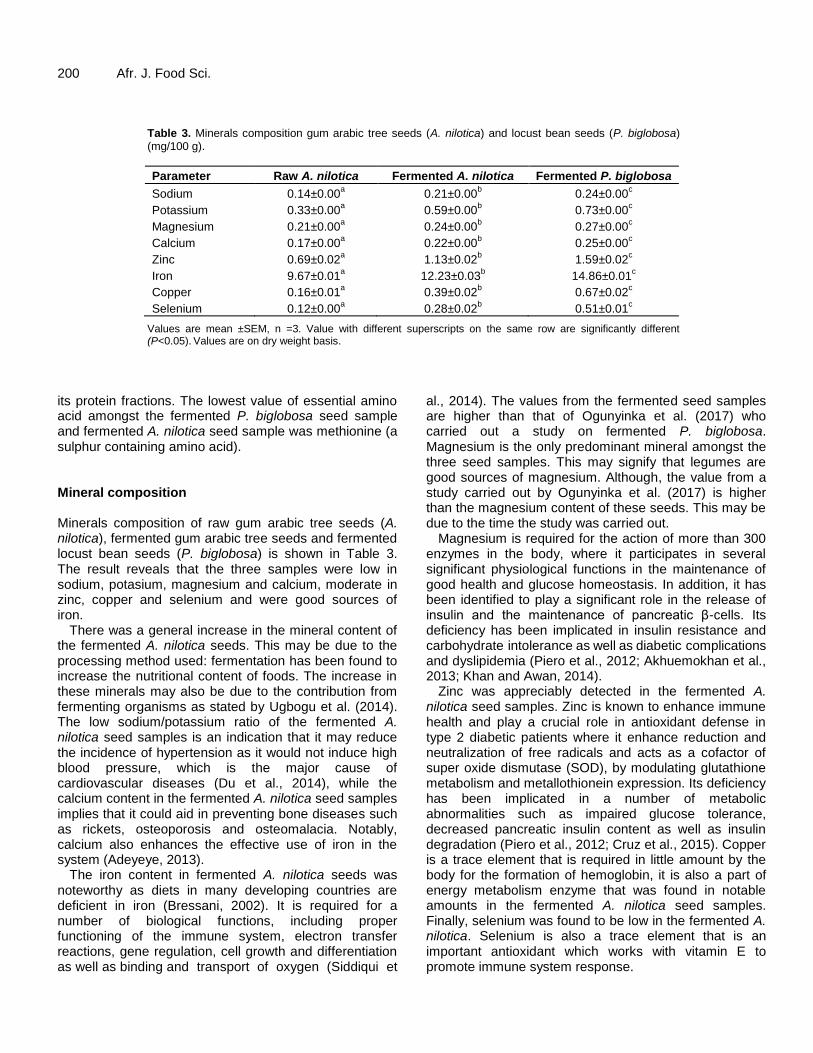
its protein fractions. The lowest value of essential amino acid amongst the fermented P. biglobosa seed sample and fermented A. nilotica seed sample was methionine (a sulphur containing amino acid). Mineral composition Minerals composition of raw gum arabic tree seeds (A. nilotica), fermented gum arabic tree seeds and fermented locust bean seeds (P. biglobosa) is shown in Table 3. The result reveals that the three samples were low in sodium, potasium, magnesium and calcium, moderate in zinc, copper and selenium and were good sources of iron.
There was a general increase in the mineral content of the fermented A. nilotica seeds. This may be due to the processing method used: fermentation has been found to increase the nutritional content of foods. The increase in these minerals may also be due to the contribution from fermenting organisms as stated by Ugbogu et al. (2014). The low sodium/potassium ratio of the fermented A. nilotica seed samples is an indication that it may reduce the incidence of hypertension as it would not induce high blood pressure, which is the major cause of cardiovascular diseases (Du et al., 2014), while the calcium content in the fermented A. nilotica seed samples implies that it could aid in preventing bone diseases such as rickets, osteoporosis and osteomalacia. Notably, calcium also enhances the effective use of iron in the system (Adeyeye, 2013).
The iron content in fermented A. nilotica seeds was noteworthy as diets in many developing countries are deficient in iron (Bressani, 2002). It is required for a number of biological functions, including proper functioning of the immune system, electron transfer reactions, gene regulation, cell growth and differentiation as well as binding and transport of oxygen (Siddiqui et
al., 2014). The values from the fermented seed samples are higher than that of Ogunyinka et al. (2017) who carried out a study on fermented P. biglobosa. Magnesium is the only predominant mineral amongst the three seed samples. This may signify that legumes are good sources of magnesium. Although, the value from a study carried out by Ogunyinka et al. (2017) is higher than the magnesium content of these seeds. This may be due to the time the study was carried out.
Magnesium is required for the action of more than 300 enzymes in the body, where it participates in several significant physiological functions in the maintenance of good health and glucose homeostasis. In addition, it has been identified to play a significant role in the release of insulin and the maintenance of pancreatic β-cells. Its deficiency has been implicated in insulin resistance and carbohydrate intolerance as well as diabetic complications and dyslipidemia (Piero et al., 2012; Akhuemokhan et al., 2013; Khan and Awan, 2014).
Zinc was appreciably detected in the fermented A. nilotica seed samples. Zinc is known to enhance immune health and play a crucial role in antioxidant defense in type 2 diabetic patients where it enhance reduction and neutralization of free radicals and acts as a cofactor of super oxide dismutase (SOD), by modulating glutathione metabolism and metallothionein expression. Its deficiency has been implicated in a number of metabolic abnormalities such as impaired glucose tolerance, decreased pancreatic insulin content as well as insulin degradation (Piero et al., 2012; Cruz et al., 2015). Copper is a trace element that is required in little amount by the body for the formation of hemoglobin, it is also a part of energy metabolism enzyme that was found in notable amounts in the fermented A. nilotica seed samples. Finally, selenium was found to be low in the fermented A. nilotica. Selenium is also a trace element that is an important antioxidant which works with vitamin E to promote immune system response.
Ajayi et al. 201
Table 4. Vitamin composition of A. nilotica and P. biglobosa seeds (mg/100 g).
Parameter Raw A. nilotica Fermented A. nilotica Fermented P. biglobosa
Vitamin A 89.06±0.01a
148.79±0.02b
197.81±0.02c
Vitamin B1 0.33±0.01a
0.58±0.02b
0.81±0.01c
Vitamin B2 0.02±0.00a
0.03±0.00b
0.05±0.00c
Vitamin B3 1.07±0.01a
1.23±0.01b
1.38±0.01c
Vitamin B6 1.13±0.01a
1.38±0.02b
1.57±0.01c
Vitamin B9 0.01±0.00a
0.02±0.00b
0.03±0.00c
Vitamin B12 0.21±0.01a
0.31±0.02b
0.47±0.01c
Vitamin C 0.17±0.01a
0.35±0.01b
0.59±0.01c
Vitamin D 0.09±0.01a
0.15±0.01b
0.31±0.01c
Vitamin E 9.62±0.01a
15.90±0.02b
24.69±0.01c
Vitamin K 1.16±0.01a
1.41±0.01b
1.63±0.01c
Values are mean ±SEM, n =3. Value with different superscripts on the same row are significantly different (P<0.05).
Values are on dry weight basis.
Table 5. Anti-nutritional factors of A. nilotica and P. biglobosa seeds (%).
Parameter Raw Acacia nilotica Fermented Acacia nilotica Fermented Parkia biglobosa
Tannin 0.00±0.00a
0.00±0.00a
0.00±0.00a
Saponin 0.05±0.00a
0.07±0.00b
0.01±0.00c
Phytate 0.00±0.00a
0.01±0.00b
0.01±0.00b
Oxalate 0.00±0.00a
0.00±0.00a
0.01±0.00c
Trypsin 0.18±0.01a
0.36±0.02b
0.81±0.00c
Values are mean ±SEM, n =3. Value with different superscripts on the same row are significantly different (P<0.05). Values are on dry
weight basis.
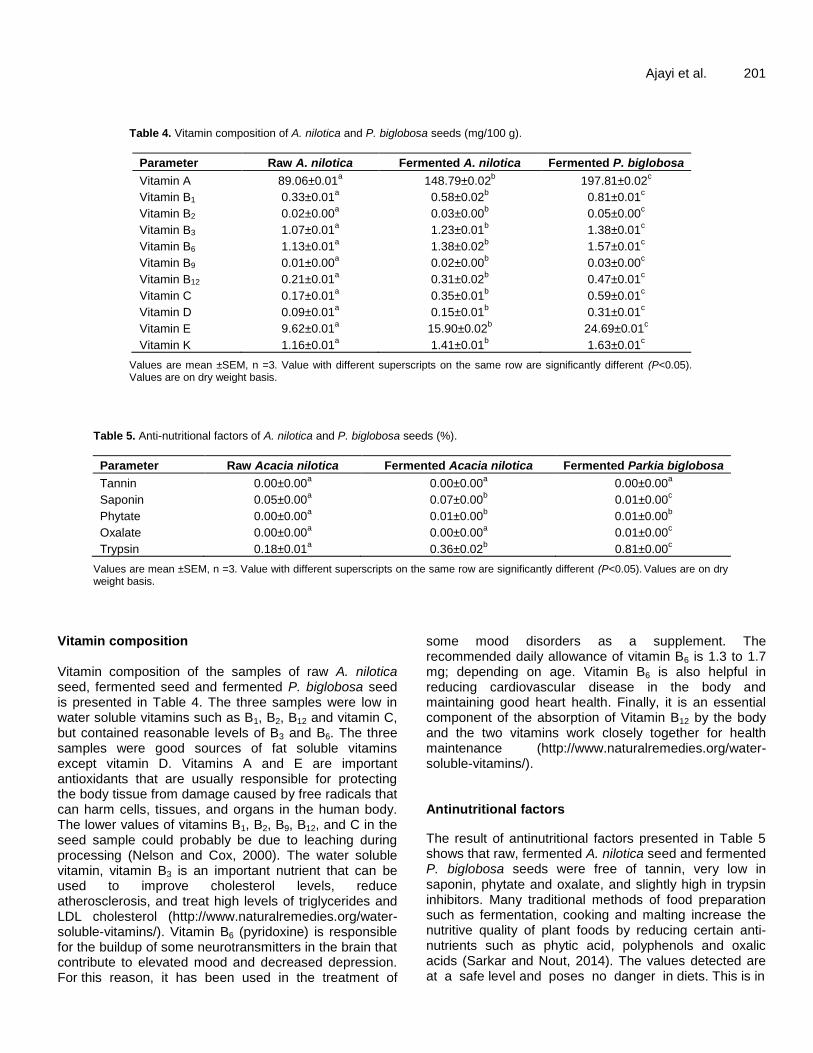
Vitamin composition Vitamin composition of the samples of raw A. nilotica seed, fermented seed and fermented P. biglobosa seed is presented in Table 4. The three samples were low in water soluble vitamins such as B1, B2, B12 and vitamin C, but contained reasonable levels of B3 and B6. The three samples were good sources of fat soluble vitamins except vitamin D. Vitamins A and E are important antioxidants that are usually responsible for protecting the body tissue from damage caused by free radicals that can harm cells, tissues, and organs in the human body. The lower values of vitamins B1, B2, B9, B12, and C in the seed sample could probably be due to leaching during processing (Nelson and Cox, 2000). The water soluble vitamin, vitamin B3 is an important nutrient that can be used to improve cholesterol levels, reduce atherosclerosis, and treat high levels of triglycerides and LDL cholesterol (http://www.naturalremedies.org/water-soluble-vitamins/). Vitamin B6 (pyridoxine) is responsible for the buildup of some neurotransmitters in the brain that contribute to elevated mood and decreased depression. For this reason, it has been used in the treatment of
some mood disorders as a supplement. The recommended daily allowance of vitamin B6 is 1.3 to 1.7 mg; depending on age. Vitamin B6 is also helpful in reducing cardiovascular disease in the body and maintaining good heart health. Finally, it is an essential component of the absorption of Vitamin B12 by the body and the two vitamins work closely together for health maintenance (http://www.naturalremedies.org/water-soluble-vitamins/). Antinutritional factors
The result of antinutritional factors presented in Table 5 shows that raw, fermented A. nilotica seed and fermented P. biglobosa seeds were free of tannin, very low in saponin, phytate and oxalate, and slightly high in trypsin inhibitors. Many traditional methods of food preparation such as fermentation, cooking and malting increase the nutritive quality of plant foods by reducing certain anti-nutrients such as phytic acid, polyphenols and oxalic acids (Sarkar and Nout, 2014). The values detected are at a safe level and poses no danger in diets. This is in
202 Afr. J. Food Sci. agreement with what was reported previously for African locust beans (P. biglobosa) (Ijarotimi and Keshinro, 2012). One of the major factors that contribute to a lower nutritional value of legumes and cereals is the presence of naturally-occurring anti-nutritional factors (ANFs, for example phytate, tannins and enzyme inhibitors) that indirectly decrease the bioavailability status of minerals. However, these ANFs can be reduced through different processing methods, such as heating, enzymes application, soaking, sprouting, irradiation, fermentation, mechanical methods such as dehulling and milling, or even by means of other techniques such as high pressure processing, microwave heating and extrusion (Nooshin et al., 2017).
Conclusion In conclusion, this study has shown the nutritional composition of A. nilotica and P. biglobosa seed. A. nilotica seed is not known and consume unlike P. biglobosa seed. This study has demonstrated that A. nilotica seed is rich in macro- and micro-nutrients and low in antinutritional factors. Further research using animal study should be conducted to help determine bioavaialability of nutrients and safety of consumption.
CONFLICT OF INTERESTS The authors declare that there is no conflict of interest. REFERENCES Adeyeye EI (2013). Proximate, mineral and antinutrient composition of
dika nut (Irvingia gabonensis) kernel. Elixir. Food Science 58:14902-14906.
Akhuemokhan IK, Eregie A, Fasanmade OA (2013). Diabetes prevention and management: The role of trace minerals. African Journal of Diabetes Medicine 21(1):37-41.
Antakli S, Sarkees N, Sarraf T (2015). Determination of water-soluble vitamins B1, B2, B3, B6, B9, B12 and C on C18 column with particle size 3 µm in some manufactured food products by HPLC with UV-DAD/FLD detection. International Journal of Pharmacy and Pharmaceutical Sciences 7(6):219-224.
AOAC (1995). Official method of analysis of the Association of Official Analytical Chemists. 15th ed. Arlington V.A. USA. Available at: https://www.worldcat.org/title/official-methods-of-analysis-of-aoac-international/oclc/421897987
AOAC (1996). Official Method 981.15, AOAC International, Section 45.1.09, Whashington, USA. Available at: http://www.worldcat.org/title/official-methods-of-analysis-of-aoac-international/oclc/477023313
Association of Official Analytical Chemists (AOAC) (1990). Association of Official Analytical Chemists Official methods of analysis 13th ed. Washington DC. Available at: http://www.worldcat.org/title/official-methods-of-analysis-of-the-association-of-official-analytical-chemists/oclc/20709424
Bainbridge Z, Tomlins K, Willings K, Westby A (1996). Methods for assessing quality characteristics of non-grain starch staples. Part 3. Laboratory methods pp. 143-479. Available at: http://gala.gre.ac.uk/11040/
Bharucha Z, Pretty J (2010). The roles and values of wild foods in
agricultural systems. Philosophical Transactions of the Royal Society of London B: Biological Sciences 365(1554):2913-2926.
Bidlingmeyer BA, Chen SA, Tervin TL (1984). Rapid analysis of amino acids using Precolumn derivatization. Chromatography 336:93-100.
Bressani R (2002). Factors influencing nutritive value in food grain legumes: Mucuna in comparison to other grain legumes. In: Flores M (Eds) Food and Feed from Mucuna: Current Uses and the Way Forward: Proceedings of an International Workshop, Tegucigalpa, Honduras, April 26-29, 2000. pp. 164-188.
Bwai MD, Uzama D, Abubakar S, Olajide OO, Ikokoh PP, Magu J (2015). Proximate, elemental, phytochemical and anti-fungal analysis of Acacia nilotica fruit. Pharmaceutical and Biological Evaluations 2(3):52-59.
Cruz KJC, Oliveira ARS, Marreiro DN (2015). Antioxidant role of zinc in diabetes mellitus. World Journal of Diabetes 6(2):333-337.
Du SA, Neiman C, Batis Wang H, Zhang BJ, Popkin BM (2014). Understanding the patterns and trends of sodium intake potassium intake and sodium to potassium ratio and their effect on hypertension in China. The American Journal of Clinical Nutrition 99(2):334-343.
Effiong OO, Umoren UE (2011). Effects of multiprocessing techniques on the chemical composition of horse eye beans (Mucuna urens). Asian Journal of Animal Sciences 5(5):340-348.
Enujiugha VN (2003). Nutrient changes during the fermentation of African oil bean (Pentaclethra macrophylla benth) seeds. Pakistan Journal of Nutrition 2(5):320-323.
Fagbemi TN, Eleyinmi F, Atum AF, Akpanbang O (2005). Nutritional Composition of fermented fluted pumpkin (Telfaria occidentalis) seeds for production of ‘ogiri’ ugu. Fermented Foods and Beverages: General. 2005 IFT Annual Meeting, New Orleans, Louisiana.
Food and Agriculture (FAO) (2012). FAO statistical Yearbook, 2012. World Food and Agriculture. Hunger dimensions. Food Science and Technology 47(6):656-661.
Haq N (2002). ICUC activities in South Asia. In: Haq N (Ed.), Fruits for the future in Asia. Proceedings of a regional consultation meeting on utilization of tropical fruit trees in Asia, Bangkok, Thailand. 16 p.
Hayat I, Ahmad A, Ahmed A, Khalil S, Gulfraz M (2014). Exploring the potential of red kidney beans (Phaseolus vulgaris L.) to develop protein-based product for food applications. Journal of Animal and Plant Science 24:860-868.
Khan AR, Awan FR (2014). Metals in the pathogenesis of type 2 diabetes. Journal of Diabetes and Metabolic Disorders 13(1):16.
Koziol MJ (1990). Afrosimetric estimation of threshold saponin concentration for bitterness in quinoa. Journal of the Science of Food and Agriculture 54(2):211-219.
Magbagbeola JAO, Adetoso JA, Owolabi OA (2010). Neglected and underutilized species (NUS): A panacea for community focused development to poverty alleviation/poverty reduction in Nigeria. Journal of Economics and International Finance 2(10):208-211.
Makkar HP, Becker K (1996). Nutritional value and antinutritional components of whole and Ethanol extracted Moringa oleifera leaves. Animal Feed Science and Technology 63(1-4):211-228.
Mohammed AI, Ponnamperuma AJP, Youssep SH (1986). New chromophore method for phytic acid determination. Cereal Chemistry 63:475-478.
National Academy of Sciences (1980). Firewood Crops: Shrub and Tree Species for Energy Production. Washington DC, USA; National Academy of Sciences.
Nelson DL, Cox MM (2000). Lehninger Principles of Biochemistry, Third Edition (3 Har/Com ed.). W. H. Freeman. P 1200. ISBN 1-57259- 931-6.
Official Methods of Analysis (2005). 18th Ed., AOAC International, Gaithersburg, MD, USA, Official Method.
Ogunbusola EM, Fagbemi TN, Osundahunsi OF (2010). Amino acid composition of Lagenaria siceraria seed flour and protein fractions. Journal of Food Science and Technology 47(6): 656–661.
Ogunyinka BI, Babatunji E, Oyinloye FO, Osunsanmi AP, Kappo AR (2017). Comparative study on proximate, functional, mineral, and antinutrient composition of fermented, defatted, and protein isolate of Parkia biglobosa seed. Food Science and Nutrition 5(1):139-147.
Oladunmoye MK (2007). Effects of fermentation on nutrient enrichment
of locust beans (Parkia biglobosa Robert bam). Research Journal of Microbiology 2(2):185-189.
Olujobi OJ (2012). Comparative evaluation of nutritional composition of African locust bean (Parkia biglobosa) fruits from two locations. Nigerian Journal of Basic and Applied Sciences 20(3):195-198.
Omafuvbe BO, Falade OS, Osuntogun BA, Adewusi SRA (2004). Chemical and Biochemical changes in African locust beans (Parkia biglobosa) and melon (Citrullus vulgaris) seeds during fermentation to condiments. Pakistan Journal of Nutrition 3(3):140-145.
Pelig-Ba KB (2009). Effect of ash, KOH and millet on the fermentation of Parkia biglobosa seeds to form a condiment. Pakistan Journal of Nutrition 8:1548-1554.
Piero NM, Joan NM, Cromwell KM, Maina D, Joseph NJ, Eliudm NN (2012). Trace elements content of selected Kenyan antidiabetic medicinal plants. International Journal of Current Pharmaceutical Research 4(3):39-42.
Ajayi et al. 203 Pugalenthi M, Vadivel V, Siddhuraju P (2005). Alternative food/feed
perspectives of an underutilized legume Mucuna pruriens var. Utilis-A review. Plant foods for Human Nutrition 60(4):201-218.
Qayyum MMN, Butt MS, Anjum FM, Nawaz H (2012). Composition analysis of some selected legumes for protein isolates recovery. The Journal of Animal and Plant Sciences 22(4):1156-1162.
Sarkar PK, Nout MR (2014). Handbook of Indigenous Foods Involving Alkaline Fermentation CRC Press.
Siddiqui K, Bawazeer N, Scaria JS (2014). Variation in macro and trace elements in progression of type 2 diabetes. The Scientific World Journal 2014:461-591.
Ugbogu AE, Akubugwo EI, Uhegbu FO, Chinyere CG, Ugbogu OC, Oduse KA (2014). Quality assessment profile of Jatropha curcas (L) seed oil from Nigeria. International Food Research Journal 21(2):735-741.
Vol. 12(8) pp. 204-209, August 2018
DOI: 10.5897/AJFS2017.1607
Article Number: 1F414C557786
ISSN: 1996-0794
Copyright ©2018
Author(s) retain the copyright of this article
http://www.academicjournals.org/AJFS
African Journal of Food Science
Full Length Research Paper
Physicochemical, microbiological and sensory characteristics of cashew milk formulated yoghurt
Jayeola Olayinka*, Yahaya Eugene, Ogunwolu Olalekan, Igbinadolor Richard
and Mokwunye Chuka
End Use Research Department, Cocoa Research Institute of Nigeria, Ibadan, Oyo State, Nigeria.
Received 27 April, 2017; Accepted 2 October, 2017
Cashew yoghurt was formulated using cashew kernel milk. The physicochemical, microbiological and organoleptic assessment of the resulting product was examined and compared with commercial yoghurts. Results indicated that crude protein of 16.8% for cashew milk yoghurt compared favorably with 14.82% of commercial yoghurt. Caloric value of cashew yoghurt (133.06 kJ) was higher than that obtained for commercial yoghurts (112.01 kJ). Microbiological study revealed a total count of 1x10
6
CFU/g, which was attributed to the culture used in the fermentation process. The cashew milk yoghurt was generally accepted by the panelist as there were no differences in the sensory characteristics examined; however, there was a difference at p> 0.05 for mouth feel for the sample studied. It can be concluded that cashew milk serves as a potential recipe for acceptable yoghurt formulation. Key words: Cashew kernel, yoghurt, sensory, protein, organoleptic.
INTRODUCTION Cashew plant, Anacaduim occidentale L. is native to Brazil. The plant is widely grown in the continents of Asia, Europe as well as Africa. In most of the African countries, especially Nigeria, the tree is grown mainly for its pseudo apple and the nuts, which are mainly consumed raw, that is, unprocessed (Ohler, 1979; Nambiar et al., 1980). Cashew is a climacteric crop, and harvesting of the nuts often takes place between January and April or May. When the cashew apples are ripe, they fall down from the tree, and the nuts are collected after detaching from the rotten apples, sun-dried on concrete floor for two days to
attain moisture content of 12%, and this is to avoid spoilage. Nigeria’s annual cashew nut production from 466,000 MT in the year 2000 to 836,500 MT in year 2012 representing 45% of cashew nuts produced in African (FAOSTAT, 2013).
The fruit of cashew tree consists mainly of the cashew nut, an embryo shaped shelled nut and the false fruit cashew apple. The composition of the shelled nut consists of 20 to 25% kernel, 20 to 25% cashew nut shell liquid (CNSL), 20% testa and 48 to 55% shell. The cashew nuts are majorly sold as export crop and few of
*Corresponding author. E-mail: [email protected].
Author(s) agree that this article remain permanently open access under the terms of the Creative Commons Attribution
License 4.0 International License
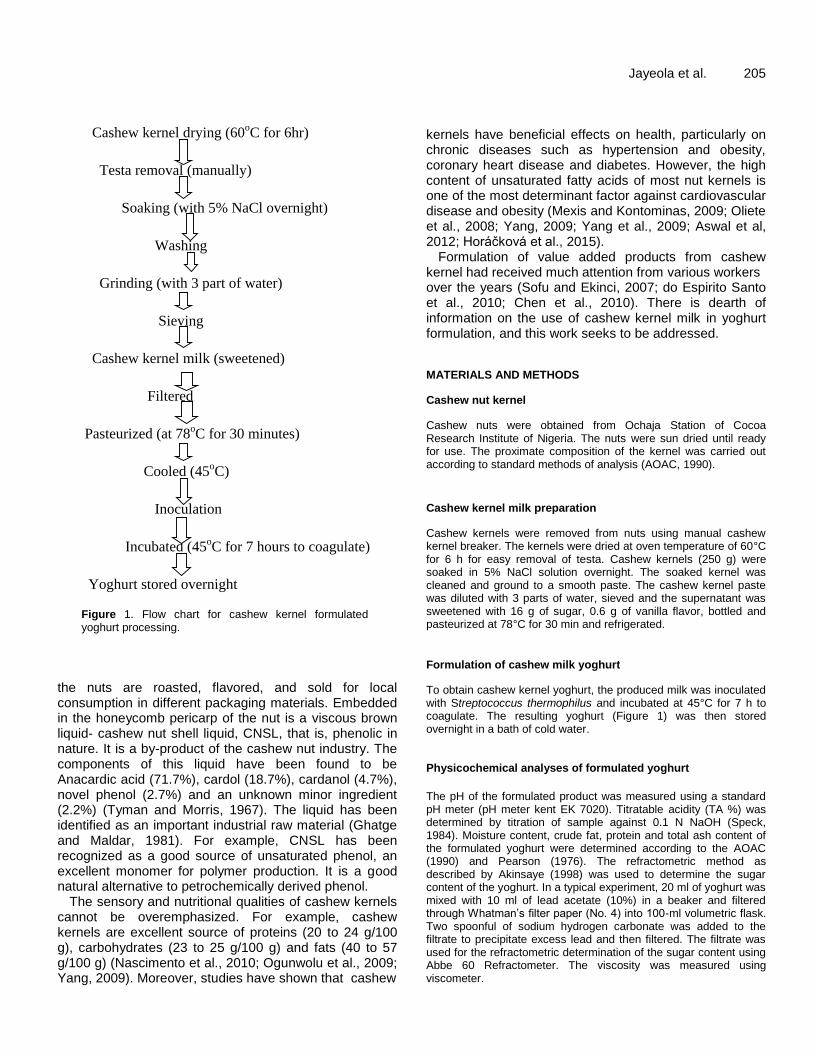
Figure 1. Flow chart for cashew kernel formulated yoghurt processing.
the nuts are roasted, flavored, and sold for local consumption in different packaging materials. Embedded in the honeycomb pericarp of the nut is a viscous brown liquid- cashew nut shell liquid, CNSL, that is, phenolic in nature. It is a by-product of the cashew nut industry. The components of this liquid have been found to be Anacardic acid (71.7%), cardol (18.7%), cardanol (4.7%), novel phenol (2.7%) and an unknown minor ingredient (2.2%) (Tyman and Morris, 1967). The liquid has been identified as an important industrial raw material (Ghatge and Maldar, 1981). For example, CNSL has been recognized as a good source of unsaturated phenol, an excellent monomer for polymer production. It is a good natural alternative to petrochemically derived phenol.
The sensory and nutritional qualities of cashew kernels cannot be overemphasized. For example, cashew kernels are excellent source of proteins (20 to 24 g/100 g), carbohydrates (23 to 25 g/100 g) and fats (40 to 57 g/100 g) (Nascimento et al., 2010; Ogunwolu et al., 2009; Yang, 2009). Moreover, studies have shown that cashew
Jayeola et al. 205 kernels have beneficial effects on health, particularly on chronic diseases such as hypertension and obesity, coronary heart disease and diabetes. However, the high content of unsaturated fatty acids of most nut kernels is one of the most determinant factor against cardiovascular disease and obesity (Mexis and Kontominas, 2009; Oliete et al., 2008; Yang, 2009; Yang et al., 2009; Aswal et al, 2012; Horáčková et al., 2015).
Formulation of value added products from cashew kernel had received much attention from various workers over the years (Sofu and Ekinci, 2007; do Espirito Santo et al., 2010; Chen et al., 2010). There is dearth of information on the use of cashew kernel milk in yoghurt formulation, and this work seeks to be addressed. MATERIALS AND METHODS
Cashew nut kernel
Cashew nuts were obtained from Ochaja Station of Cocoa Research Institute of Nigeria. The nuts were sun dried until ready for use. The proximate composition of the kernel was carried out according to standard methods of analysis (AOAC, 1990).
Cashew kernel milk preparation
Cashew kernels were removed from nuts using manual cashew kernel breaker. The kernels were dried at oven temperature of 60°C for 6 h for easy removal of testa. Cashew kernels (250 g) were soaked in 5% NaCl solution overnight. The soaked kernel was cleaned and ground to a smooth paste. The cashew kernel paste was diluted with 3 parts of water, sieved and the supernatant was sweetened with 16 g of sugar, 0.6 g of vanilla flavor, bottled and pasteurized at 78°C for 30 min and refrigerated.
Formulation of cashew milk yoghurt
To obtain cashew kernel yoghurt, the produced milk was inoculated with Streptococcus thermophilus and incubated at 45°C for 7 h to coagulate. The resulting yoghurt (Figure 1) was then stored overnight in a bath of cold water.
Physicochemical analyses of formulated yoghurt
The pH of the formulated product was measured using a standard pH meter (pH meter kent EK 7020). Titratable acidity (TA %) was determined by titration of sample against 0.1 N NaOH (Speck, 1984). Moisture content, crude fat, protein and total ash content of the formulated yoghurt were determined according to the AOAC (1990) and Pearson (1976). The refractometric method as described by Akinsaye (1998) was used to determine the sugar content of the yoghurt. In a typical experiment, 20 ml of yoghurt was mixed with 10 ml of lead acetate (10%) in a beaker and filtered through Whatman’s filter paper (No. 4) into 100-ml volumetric flask. Two spoonful of sodium hydrogen carbonate was added to the filtrate to precipitate excess lead and then filtered. The filtrate was used for the refractometric determination of the sugar content using Abbe 60 Refractometer. The viscosity was measured using viscometer.
Cashew kernel drying (60oC for 6hr)
Testa removal (manually)
Soaking (with 5% NaCl overnight)
Washing
Grinding (with 3 part of water)
Sieving
Cashew kernel milk (sweetened)
Filtered
Pasteurized (at 78oC for 30 minutes)
Cooled (45oC)
Inoculation
Incubated (45oC for 7 hours to coagulate)
Yoghurt stored overnight
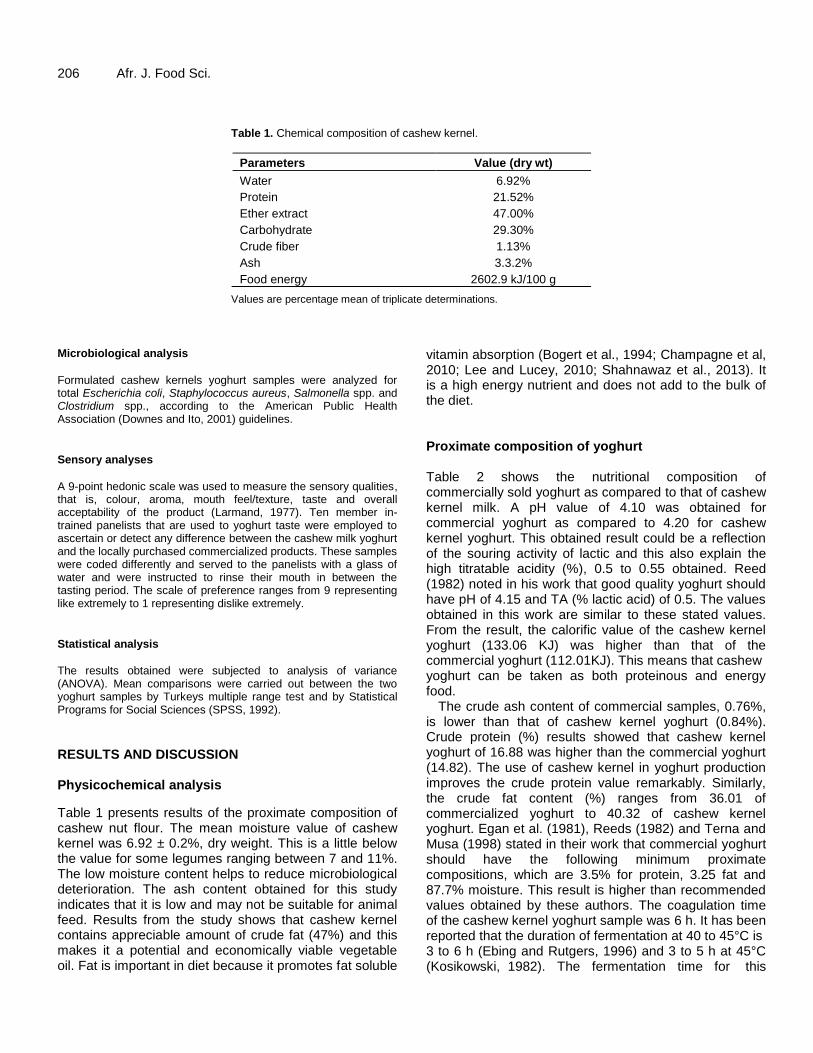
206 Afr. J. Food Sci.
Table 1. Chemical composition of cashew kernel.
Parameters Value (dry wt)
Water 6.92%
Protein 21.52%
Ether extract 47.00%
Carbohydrate 29.30%
Crude fiber 1.13%
Ash 3.3.2%
Food energy 2602.9 kJ/100 g
Values are percentage mean of triplicate determinations.
Microbiological analysis
Formulated cashew kernels yoghurt samples were analyzed for total Escherichia coli, Staphylococcus aureus, Salmonella spp. and Clostridium spp., according to the American Public Health Association (Downes and Ito, 2001) guidelines.
Sensory analyses
A 9-point hedonic scale was used to measure the sensory qualities, that is, colour, aroma, mouth feel/texture, taste and overall acceptability of the product (Larmand, 1977). Ten member in-trained panelists that are used to yoghurt taste were employed to ascertain or detect any difference between the cashew milk yoghurt and the locally purchased commercialized products. These samples were coded differently and served to the panelists with a glass of water and were instructed to rinse their mouth in between the tasting period. The scale of preference ranges from 9 representing like extremely to 1 representing dislike extremely.
Statistical analysis
The results obtained were subjected to analysis of variance (ANOVA). Mean comparisons were carried out between the two yoghurt samples by Turkeys multiple range test and by Statistical Programs for Social Sciences (SPSS, 1992).
RESULTS AND DISCUSSION Physicochemical analysis
Table 1 presents results of the proximate composition of cashew nut flour. The mean moisture value of cashew kernel was 6.92 ± 0.2%, dry weight. This is a little below the value for some legumes ranging between 7 and 11%. The low moisture content helps to reduce microbiological deterioration. The ash content obtained for this study indicates that it is low and may not be suitable for animal feed. Results from the study shows that cashew kernel contains appreciable amount of crude fat (47%) and this makes it a potential and economically viable vegetable oil. Fat is important in diet because it promotes fat soluble
vitamin absorption (Bogert et al., 1994; Champagne et al, 2010; Lee and Lucey, 2010; Shahnawaz et al., 2013). It is a high energy nutrient and does not add to the bulk of the diet. Proximate composition of yoghurt Table 2 shows the nutritional composition of commercially sold yoghurt as compared to that of cashew kernel milk. A pH value of 4.10 was obtained for commercial yoghurt as compared to 4.20 for cashew kernel yoghurt. This obtained result could be a reflection of the souring activity of lactic and this also explain the high titratable acidity (%), 0.5 to 0.55 obtained. Reed (1982) noted in his work that good quality yoghurt should have pH of 4.15 and TA (% lactic acid) of 0.5. The values obtained in this work are similar to these stated values. From the result, the calorific value of the cashew kernel yoghurt (133.06 KJ) was higher than that of the commercial yoghurt (112.01KJ). This means that cashew yoghurt can be taken as both proteinous and energy food.
The crude ash content of commercial samples, 0.76%, is lower than that of cashew kernel yoghurt (0.84%). Crude protein (%) results showed that cashew kernel yoghurt of 16.88 was higher than the commercial yoghurt (14.82). The use of cashew kernel in yoghurt production improves the crude protein value remarkably. Similarly, the crude fat content (%) ranges from 36.01 of commercialized yoghurt to 40.32 of cashew kernel yoghurt. Egan et al. (1981), Reeds (1982) and Terna and Musa (1998) stated in their work that commercial yoghurt should have the following minimum proximate compositions, which are 3.5% for protein, 3.25 fat and 87.7% moisture. This result is higher than recommended values obtained by these authors. The coagulation time of the cashew kernel yoghurt sample was 6 h. It has been reported that the duration of fermentation at 40 to 45°C is 3 to 6 h (Ebing and Rutgers, 1996) and 3 to 5 h at 45°C (Kosikowski, 1982). The fermentation time for this
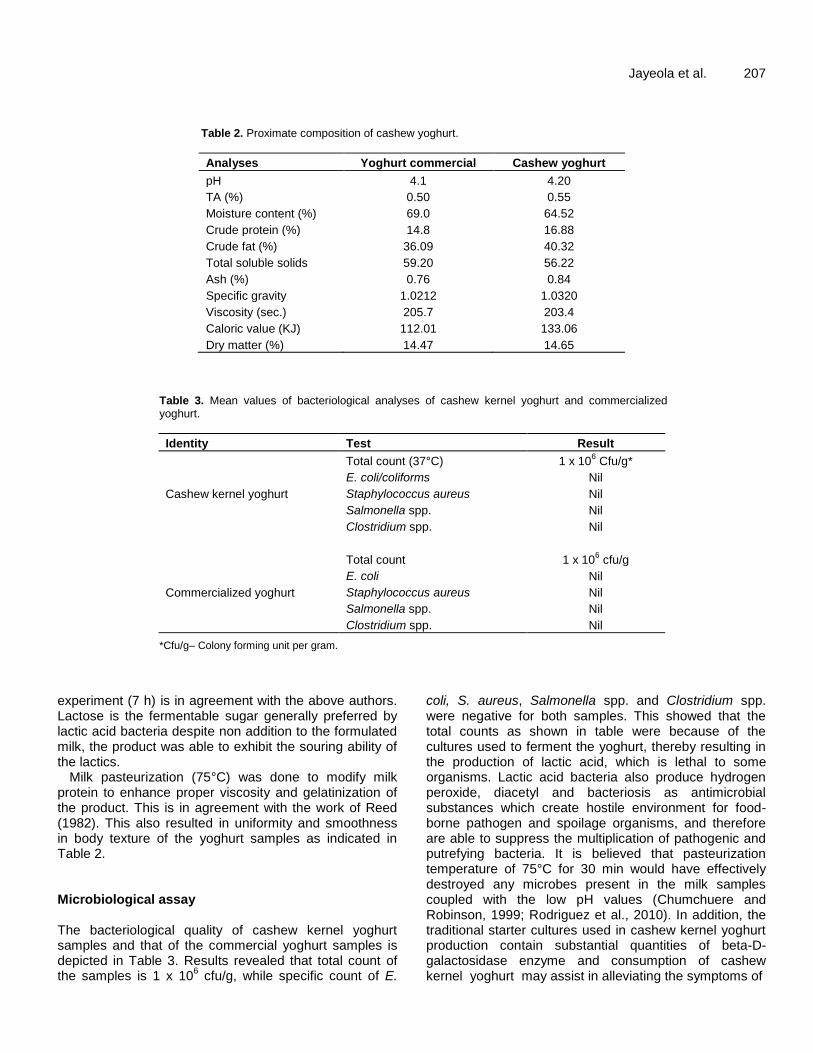
Jayeola et al. 207
Table 2. Proximate composition of cashew yoghurt.
Analyses Yoghurt commercial Cashew yoghurt
pH 4.1 4.20
TA (%) 0.50 0.55
Moisture content (%) 69.0 64.52
Crude protein (%) 14.8 16.88
Crude fat (%) 36.09 40.32
Total soluble solids 59.20 56.22
Ash (%) 0.76 0.84
Specific gravity 1.0212 1.0320
Viscosity (sec.) 205.7 203.4
Caloric value (KJ) 112.01 133.06
Dry matter (%) 14.47 14.65
Table 3. Mean values of bacteriological analyses of cashew kernel yoghurt and commercialized yoghurt.
Identity Test Result
Cashew kernel yoghurt
Total count (37°C) 1 x 10⁶ Cfu/g*
E. coli/coliforms Nil
Staphylococcus aureus Nil
Salmonella spp. Nil
Clostridium spp. Nil
Commercialized yoghurt
Total count 1 x 10⁶ cfu/g
E. coli Nil
Staphylococcus aureus Nil
Salmonella spp. Nil
Clostridium spp. Nil
*Cfu/g– Colony forming unit per gram.
experiment (7 h) is in agreement with the above authors. Lactose is the fermentable sugar generally preferred by lactic acid bacteria despite non addition to the formulated milk, the product was able to exhibit the souring ability of the lactics.
Milk pasteurization (75°C) was done to modify milk protein to enhance proper viscosity and gelatinization of the product. This is in agreement with the work of Reed (1982). This also resulted in uniformity and smoothness in body texture of the yoghurt samples as indicated in Table 2. Microbiological assay The bacteriological quality of cashew kernel yoghurt samples and that of the commercial yoghurt samples is depicted in Table 3. Results revealed that total count of the samples is 1 x 10
6 cfu/g, while specific count of E.
coli, S. aureus, Salmonella spp. and Clostridium spp. were negative for both samples. This showed that the total counts as shown in table were because of the cultures used to ferment the yoghurt, thereby resulting in the production of lactic acid, which is lethal to some organisms. Lactic acid bacteria also produce hydrogen peroxide, diacetyl and bacteriosis as antimicrobial substances which create hostile environment for food-borne pathogen and spoilage organisms, and therefore are able to suppress the multiplication of pathogenic and putrefying bacteria. It is believed that pasteurization temperature of 75°C for 30 min would have effectively destroyed any microbes present in the milk samples coupled with the low pH values (Chumchuere and Robinson, 1999; Rodriguez et al., 2010). In addition, the traditional starter cultures used in cashew kernel yoghurt production contain substantial quantities of beta-D-galactosidase enzyme and consumption of cashew kernel yoghurt may assist in alleviating the symptoms of

208 Afr. J. Food Sci. Table 4. Mean comparison of sensory evaluation scores of cashew kernel yoghurt and locally commercialized yoghurt.
Yoghurt Aroma Colour Taste Mouth feel Overall acceptability
Cashew kernel yoghurt 8.1NS 7.2NS 7.4NS 8.8a 8.0NS
Commercial yoghurt 1 7.8 7.0 7.4 7.0b 7.8
Commercial yoghurt 2 7.3 7.0 7.0 7.5ab 8.0
Skimmed milk yoghurt 8.0 6.6 6.9 8.2a 7.5
Letters with the same column are significantly different (P < 0.05); NS- not significant.
lactose maladsorption. The cashew kernel yoghurt was therefore considered safe microbiologically. Sensory characteristics
The results of the organoleptic appraisal performed on all the yoghurts are shown in Table 4. The results indicates that panelist find it difficult to differentiate them from one another. The products have milky color with semi-solid texture and the taste was slightly sour. However, there was a significant difference at P> 0.05 for mouth feel. The overall acceptability showed that the yoghurt samples were acceptable but does not show any significant difference at P< 0.05.
Conclusion
This study shows that yoghurt can be produced from a vegetable source especially for the vegetarians. This indicates that it is possible to produce good quality yoghurt that is well acceptable for human consumption using cashew kernel. It was also shown that there were no differences in the taste and flavor of yoghurts studied and this makes the product more enjoyable and pleasurable. Thus, cashew kernel yoghurt due to its content and viscosity can delay gastric emptying and can be of an immense benefit for people who are lactose intolerant.
CONFLICT OF INTERESTS The authors have not declared any conflict of interests. REFERENCES Akinsaye OP (1998). Sugar laboratory. National Cereal Research
Institute Badeggi Niger State (Personal communication). Espirito Santo AP, Silva RC, Soares FA, Anjos D, Gioielli LA, Oliveira
MN (2010). Açai pulp addition improves fatty acid profile and probiotic viability in yoghurt. International Dairy Journal 20(6):415-422.
Aswal P, Shukla A, Priyadarshi S (2012). Yoghurt: Preparation, characteristics and recent advancements. Cibtech Journal of Bio-Protocols 1(2):32-44.
Bogert JL, Briggs GM, Galloway DH (1994). Nutrition and physical fitness. International Journal of Food Science and Nutrition 45:223-230.
Champagne CP, Tompkins TA, Buckley ND, Green- Johnson JN (2010). Effect of fermentation by pure and mixed cultures of Streptococcus thermophiles and Lactobacillus helveticus on isoflavone and B-vitamin content of a fermented soy beverage. Food Microbiology 27:968-972.
Chen TR, Su RQ, Wei QK (2010). Hydrolysis of isoflavone phytoestrogens in soymilk fermented by Lactobacillus and Bifidobacterium cocultures. Journal of Food Biochemistry 34:1-12.
Chumchuere S, Robinson RK (1999). Selection of starter cultures for the fermentation of soya milk. Food Microbiology 16:129-137.
Downes FP, Ito H (2001). Compendium of methods for the microbiological examination of foods (4th. ed.). Washington: American Public Health Association.
Ebing P, Rutgers K (1996). Preparation of dairy products 3rd Ed.
Agrodok – Series No. 36 CTA, pp. 45-46. FAOSTAT (2013). Food and Agriculture Organization Statistics. Ghatge D, Malder NN (1981). Cashew nut shell liquid and its use in
Rubber. National Communication Laboratories, Pune 411(X) 8. India. Horáčková S, Mühlhansová A, Sluková M, Schulzová V, Plockova M
(2015). Fermentation of Soymilk by Yoghurt and Bifidobacteria Strains. Czechlovaskia Journal of Food Science 33(4):313-319.
Kosikowski FV (1982). Cheese and fermented milk foods. 2nd
Ed. New York: F.V. Kosikowski and Association.
Larmand E (1977). Laboratory method for sensory Evaluation of food. Publication No. 1637, Ottawa, Canada; Canadian Department of Agriculture pp. 12-16.
Lee WJ, Lucey JA (2010). Formation and Physical Properties of Yogurt. Asian-Australasian Journal of Animal Sciences 23(9):1127-1136.
Mexis SF, Kontominas MG (2009). Effect of g-irradiation on the physicochemical and sensory properties of cashew nuts (Anacardium occidentale L.). Lebensmittel-Wissenschaft und Technologie 42:1501 -1507.
Nascimento AN, Naozuka J, Oliveira PV (2010). In vitro evaluation of Cu and Fe bioavailability in cashew nuts by off-line coupled SEC-UV and SIMAAS. Microchemical Journal 96(1):58-63.
Nambiar MC, Nambiar KKN, Kunhikrishna S (1980). Cashew in India. World Crops 32(1):20-23
Ohler JG (1979). Cashew. Commination 71. Department of Agriculture Research. Koninklik Institute voor de Tropen Amstardam.
Ogunwolu SO, Henshaw FO, Mock HP, Santros A, Awonorin SO (2009). Functional properties of protein concentrates and isolates produced from cashew (Anacardium occidentale L.) nut. Food Chemistry 115:852-858.
Oliete B, Gómez M, Pando V, Fernández-Fernández E, Caballero PA, Ronda F (2008). Effect of nut paste enrichment on physical characteristics and consumer acceptability of bread. Food Science and Technology International 14(3):259-269.
Pearson D (1976). The Chemical Analysis of Food. 6th Edn. Chemical
Publishers Co. New York. Rodriguez LA, Ortolani MBT, Nero LA (2010). Microbiological quality of
yoghurt commercialized in Viçosa, Minas Gerais, Brazil. African Journal of Microbiology Research 4(3):210-213.

Shahnawaz M, Sheikh SA, Akbar ZA (2013). Physicochemical analysis
of desi yoghurts produced by the local community in Gilgit District. African Journal of Food Science 7(7):183-185.
Sofu A, Ekinci FY (2007). Estimation of storage time of yogurt with artificial neural network modeling. Journal of Dairy Science 90(7):3118-3125.
Tyman JHP, Morris LJ (1967). The composition of cashew nut-shell liquid (CNSL) and the detection of a novel phenolic ingredient. Journal of Chromatography A 27:287-288.
Terna G, Musa A (1998). Soybeans yoghurt production using starter culture from 'nono' Nigerian. Nigerian Journal of Biotechnology 9(1):17-23.
Jayeola et al. 209 Yang J (2009). Brazil nuts and associated health benefits: A review.
Lebensmittel- Wissenschaft und Technologie 42:1573-1580. Yang J, Liu RH, Halim L (2009). Antioxidant and antiproliferative
activities of common edible nuts. Lebensmittel-Wissenschaft und Technologie 42:1-8.
Journal of
Microbiology and Antimicrobials
Journal of Microbiology and Antimicrobials
International Journal of
Biotechnology and Molecular
Biology Research
African Journal of
Microbiology Research
African Journal of
Microbiology Research
www.academicjournals.org
African Journal of
Biochemistry Research
African Journal of
Biochemistry Research
Journal of
Bioinformatics and Sequence Analysis
Journal of
Biophysics and Structural Biology
![新3表1・表4-05 04 [更新済み]TEL(0794)45-7698/FAX(0794)44-2081 技術部 〒676-8670 高砂市荒井町新浜2丁目3番1号 TEL(0794)45-9024/FAX(0794)45-9022](https://img.dokumen.tips/doc/110x75/60ffc14b6e84fe4bff5a6fab/3e1fe4-05-04-teli0794i45-7698ifaxi0794i44-2081.jpg)