Embed Size (px)
Citation preview

Federated States of Micronesia
ECONOMIC BRIEFFSM FY 2017
August, 2018

2 FSM FY 2017 - Economic Update - August, 2018
1. Economic Performance
After experiencing strong growth in FY2015 of 5.0 percent, economic growth weakened in FY2016 recording 0.7 percent, but improved in FY2017 growing by 3.2 percent. The component of FSM GDP resulting from domestic purse seine fishing operations adds considerably to the volatility of year-to-year growth rates. Excluding those domestic purse seine fishing operations, and despite continuing issues with the use of the Compact infrastructure grant, the FSM’s domestic economy grew by a respectable 2.3 percent in FY2015, 2.4 percent in FY2016 and 3.5 percent in FY2017.
During the first six years of the amended Compact, economic performance was weak in the FSM due to difficult adjustments to the new Compact. However, the following four years saw improvement, in large part resulting from the strong demand for infrastructure. The poor results in the following period (FY2012-FY2014), reflect management issues with the use of the Compact infrastructure grant. With agreement on construction management and procurement procedures in mid-2017, it was hoped that the large backlog of infrastructure funds remaining under the amended Compact would spur investment spending and would underpin a sustained higher growth trajectory. However, despite a large
number of approvals of infrastructure projects by JEMCO, ground breaking of the new projects has yet to take place.
2. Employment
After a period of declining and stagnant employment conditions since FY2011, the improved conditions in the FSM’s domestic economy led to employment growth of 2.1 and 1.4 percent in FY2016 and FY2017. Private sector employment was the driving force, which grew by 3.6 percent over the period—although job prospects in the public sector also improved by 1.8 percent. Since the start of the amended Compact private sector employment has remained flat while that in the public sector has declined by 14 percent as the FSM governments have downsized reflecting reductions in the real value of Compact funding. Overall, jobs have fallen by 6 percent since FY2003.
3. Inflation
With the prior decline in world oil prices coming to a halt and with oil prices rising modestly in FY2017 inflation stagnated recording a 0.1 percent increase, helping to moderate the cost of living. The main contributing factor to inflation continued to be food prices, which fell by 1.6 percent offsetting rises in alcohol, tobacco and other prices.
Recent Economic Performance FY2017
FSM’s domestic economy performed well over the three years through FY2017, averaging 2.7% annual growth.
Employment in the FSM has fallen by 6 percent since FY2003, driven by government downsizing.

3Federated States of Micronesia
4. Wages
Wages have grown modestly in the FSM by 1.6 and 1.9 percent per annum in the private and public sectors, respectively in the amended Compact since FY2003. However, once inflation has been taken into account real wages have fallen in the two sectors by 1.5 and 1.3 percent, indicating declining standards of living.
1. Banking
The deposit base in the FSM banking system ($320 million in FY2017) has grown significantly reflecting a sound financial system. However, lending performance to the private sector has been weak and represents only 15 percent of the deposit base, one of the lowest in the region. The resulting surplus liquidity, now over $264 million, is invested offshore in low yielding assets. The low rate of domestic lending reflects the perceived high risk of lending in the FSM and “lack of bankable projects.” Overall, the inability of businesses to prepare credible business plans and financial statements, lack of collateral, the limited ability to use land as security, and inadequate provisions to secure transactions have inhibited development of the financial sector. With limited opportunities, commercial banks have preferred to invest their assets offshore in less risky and more secure markets.
2. External Debt
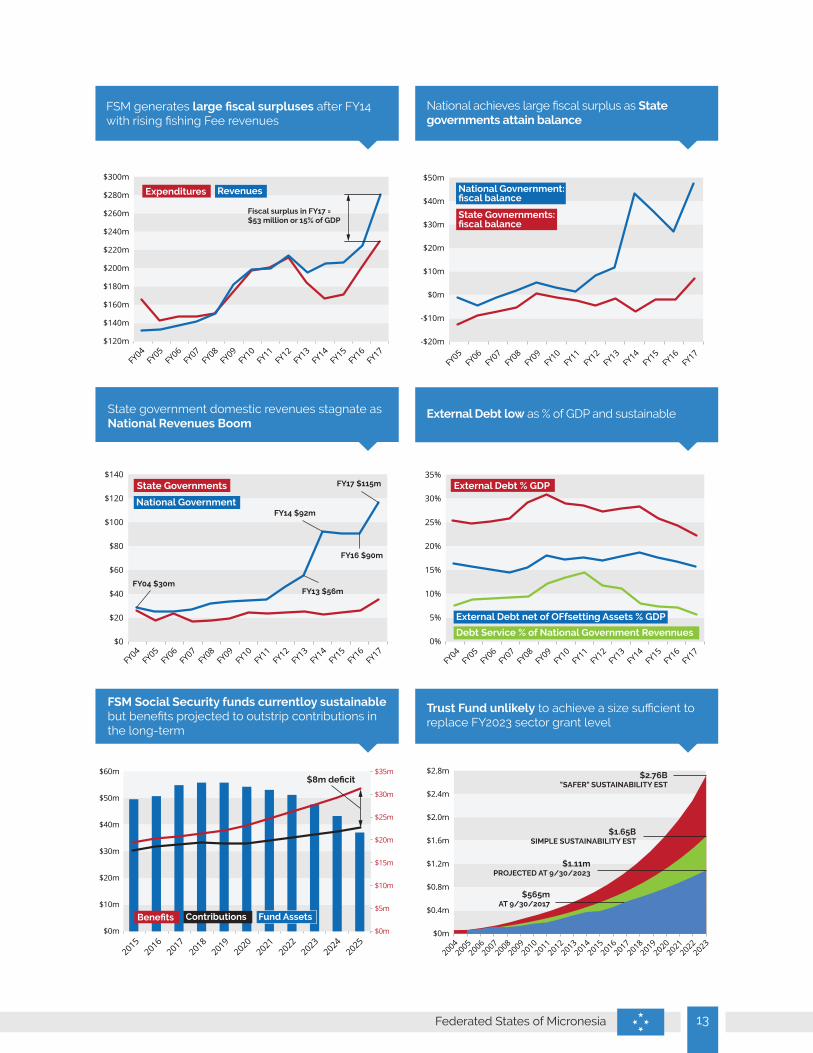
The FSM’s external debt, at 22 percent of GDP and 16 percent net of offsetting assets (sinking fund), is one of the lowest in the region. Debt service of 6 percent of national government domestic revenues remains well within the capacity of the national government to service and does not present any threat of debt stress. A recent review by the FSM public auditor revealed many weaknesses in the FSM’s external debt management. As a result, a debt management Bill has been drafted but has yet to be acted upon by the FSM Congress.
While our analysis indicates that the FSM is not at risk of debt stress, the standard IMF Debt Sustainability Analysis (DSA) places the FSM in an at-risk category. The DSA analysis assumes that large fiscal shortfalls projected post-FY2023 would be financed through (hypothetical) concessionary external borrowing. However, the FSM does not have access to the assumed persistent borrowing from donors, especially to maintain operational expenditures. While the IMF’s assumptions may be unrealistic, the consequence of the DSA is that the FSM has been accorded “grant only” status for access to resources. Under the current round of World Bank IDA funding, the FSM is thus not eligible for loan finance, but does qualify for up to $25 million grants annually, a very large increase in external aid compared with historical levels.
3. Social Security Sustainability
As of January 2014, an actuarial assessment of the FSM Social Security Fund indicated an unfunded
The Financial Sector
External debt of the FSM is at a low level equivalent to 22 percent of GDP and is projected to decline further under grant-only status with major donors.

4 FSM FY 2017 - Economic Update - August, 2018
liability of $259 million compared with assets of $49 million, an unfunded ratio of 84 percent similar to that in the RMI. However, unlike the RMI, the fund is not under imminent threat of collapse. Contributions to the fund in FY2017 were 91 percent of benefit payments and after strong investment earnings and a $1 million transfer from the national government the SSA recorded a large surplus of close to $5 million. However, long-run projections indicate benefits rising faster than contributions. Further reforms to the system will likely be needed. While the contribution from the national government is welcome, in the long-run the fund should achieve self-sufficiency without the need for government intervention.
4. FSM Domicile for Japanese Companies
In 2005 the FSM passed corporate tax legislation that enabled the creation of an overseas domicile which has primarily been targeted at Japanese Companies. The law provides for a corporate tax rate of 21 percent, and through differential tax rates, the FSM host environment provides an attractive domicile for Japanese captive insurance companies and other corporations. The benefit of these arrangements has been a steadily growing stream of revenues to the National government now averaging $6 million in recent years. In FY2014 there was an unusually large receipt of $28 million, reflecting a large declaration of capital gains by one company. In FY2017 there was a further large receipt of $23 million by that same parent corporation. In FY2018 there was a receipt of $77 million from a different Japanese organization. Although large payments can be expected periodically, FY2018 was exceptional.
A particular area of concern has been compliance with the Global Forum on Transparency and Exchange of Information for Tax Purposes. The Global forum is a group of 146 members that are working under guidance of the OECD to create a transparent environment among nations to share information in the tax area, but the FSM is not currently a member. As a result of phase 1 first round of peer reviews in 2015 the FSM was
deemed non-compliant. In June 2016, there was a front-page article in the Nikkei Shimbum reporting that Panama, Micronesia and Indonesia would be blacklisted by the Global Forum. The implications of being placed in the same group as Panama would have been damaging to the FSM’s reputation, and any inclusion on this list could have potentially frozen, or even killed the FSM domicile and Captive Insurance Industry.
As a result of Global forum non-compliance, the FSM enhanced its efforts and passed legislation on transparency and exchange of tax information. In 2016 the Global Forum undertook a fast track process and countries were designated as compliant, largely compliant, partially compliant, or non-compliant. As a result of the review, the FSM was designated as largely compliant, thus alleviating the fears arising from the Nikkei Shimbum article. Work with the Global Forum is on-going, and the FSM will undertake a second-round peer review which combines phases I and II late in 2018. The focus of the current review is on demonstration of availability of beneficial ownership.
Additional risks to the industry have resulted from changes in Japanese Corporate law concerning tax haven status. In addition to requiring foreign jurisdictions to have an income tax burden in excess of 20 percent, foreign domiciled companies are required to display substantial business activity rather than paper or cash box type functions. The exact nature of displaying substantial business activity is not yet known, but it will require a physical office and an administrator for each Japanese subsidiary in the FSM. A further risk, although diminished from prior years, is the potential for FSM states to offer domicile to foreign entities. At present the industry resides in Pohnpei although corporate taxes generated from the FSM domicile are not treated as subject to FSM revenue sharing, and thus only generate revenue for the national government. However, should this be contested, and if states were to share in the arrangements, it could generate inter-state competition and loss of revenue.

5Federated States of Micronesia
1. The Fiscal Outturn
The overall fiscal balance recorded a record surplus in FY2017 of $53 million, or 14.6 percent of GDP. This was a significant increase from the large surpluses attained in FY2015 and FY2016 of 10.4 and 7.4 percent of GDP, respectively. Revenues were up in a series of different categories from an additional $17 million in corporate taxes from the offshore FSM domicile for Japanese companies, an additional $15 million in foreign grants and an increase of $9 million in fishing fees. While expenditures grew, reflecting the large fiscal space, they did not keep pace with revenues. Major increases in expenditures were on use of goods and services ($11 million), and non-financial assets or infrastructure funded through additional foreign grants (an additional $11 million) and FSM Congressional district public projects (additional $5 million).
However, the fiscal outturn differed significantly between the FSM national and state governments. The national government ran a surplus of $46.8 million, while the states recorded a surplus of $6.8 million, the largest recorded and only second time for the states to achieve a surplus during
the amended Compact period. The FSM state governments, where service delivery occurs, have been constrained by the declining real value of Compact grants, while the national government has benefited from a boom in revenues from fishing fees and the offshore domicile for Japanese corporations.
2. Tax Reform
In the mid-2000s the FSM embarked on a lengthy process of tax reforms, which after many years of donor support and hard work has not yet led to adoption. With a tax/GDP ratio of 11 percent (ignoring corporate taxes), FSM revenue effort has been low and presents an opportunity to adjust to future fiscal shocks and to create an efficient tax environment that supports private sector development. Two of the four FSM states (Chuuk and Kosrae) supported the tax reform initiative. Yap State, while expressing no objection to the reforms indicated that the proposal was unconstitutional with respect to Yap’s constitution, and thus declined to participate. There was some renewed recent interest from Pohnpei State, but this now appears to have waned. While there is clearly little incentive for additional revenue effort at the national government, the need at the state level to achieve greater autonomy over fiscal policy going into to the post amended Compact period is strong.
3. Structural surplus and contributions to the FSM Trust Fund
The boom in national government revenues derived principally from fishing fees but also from corporate taxes from off shore Japanese companies has led to the generation of large fiscal surpluses at the national government. In FY2015 national government domestic revenues were close to $90 million, a level sustained in FY2016, and rising to $115 million in FY2017. In FY2015 the national government ran a fiscal surplus of $35 million or 11 percent of GDP which had risen to $47 million or 13 percent of GDP in FY2017.
Fiscal Performance and Policy
FSM has achieved large fiscal surpluses representing large increases in sovereign rents to the national treasury.

6 FSM FY 2017 - Economic Update - August, 2018
While revenues have grown rapidly the increase in fiscal space afforded by the increase has also enabled a large increase in expenditures on use of goods and services and Congressional district public projects. From FY2013 use of goods and services has risen from $19 million to $43 million, and outlays on public projects has risen from an average of $3.3 million during the first 9 years of the amended Compact to $16 million in FY2017. Taking these rapid increases into account a measure of the structural fiscal surplus at the national government can be estimated: rising from $5 million or 1.7 percent of GDP in FY2011 to $81 million or 25 percent of GDP by FY2017.
The national government has been allocating part of the fiscal surplus to the FSM Trust Fund, and the corpus stood at $116 million at the end of FY2017. Contributions have been made on behalf of both the State and National governments. While most of the contributions have been on behalf of the national government $6.3 million was allocated to the state accounts in FY2016 and a further $21.9 million in FY2017. Clearly, the contributions to the FSM Trust Fund to provide a pool of resources for future generations are highly desirable. However, there is considerable scope to increase the level of contribution in normal years to the order of $30 million per annum (and more in years when large receipts are received from domiciled Japanese corporations). Such saving would materially reduce the risks arising from projected massive fiscal shortfalls for the state governments of the FSM as early as FY2024 and thereafter.
4. Long-Term Planning
In 2012, the FSM initiated an exercise to plan for transition to the post amended Compact era after FY2023, known as the 2023 Action Plan. The Plan, while focusing on the post-2023 era also addressed the use of the emerging national government structural fiscal surplus. However, since 2015, the 2023 planning effort and issue of sovereign wealth management is no longer actively on the policy agenda. Rather, in an attempt to address the growing disparities between national and state government revenues, the
Public Financial Management
allocation of surplus resources has dissolved into an ad hoc process of funding priority state projects, state sub-accounts in the FSM trust fund, and ballooning legislative projects. Clearly, there is a need for a rational approach to the emergence of significant sovereign resources. The former 2023 Plan established a useful framework for resource allocation and a renewed focus on private sector development and selective policy reforms. The FSM would be well advised to revisit the approach, if not the precise content, to ensure the best use of readily available funds to address CTF shortfalls.
1. Public Expenditure and Financial Accountability (PEFA)
In 2010 the FSM conducted a PEFA self-assessment, a scored system of PFM established by the World Bank. After little action in the subsequent years, a renewed self-assessment was conducted in 2016 with the support of PFTAC, which led to development of a “Road Map”. The Road Map provides a list of targets for reform against which progress can be monitored. Progress in this area is a standard condition of eligibility for budgetary support from some donors such as the European Union and the World Bank. Since preparation of the Roadmap, the FSM selected four key areas of focus, including implementation of a new Financial Management Information System and Financial Management Procedures. To be of value FSM-wide, the PEFA exercise needs be rolled out to each of the FSM States, where most of the public expenditures take place. To this end

7Federated States of Micronesia
the EU is providing TA support to develop PEFAs for each of the four governments.
2. Financial Management Information Systems (FMIS)
The FMIS in the FSM is nearing the end of its effective life as the responsible software company is ceasing to support a declining user base. With donor grant support from the World Bank, a replacement system is being pursued. A project manager has been hired, and consultants are being selected to guide the FSM through needs assessment, development of an RFP, and selection of suitable software. However, implementation is likely to take place over a period of years. Enhanced reporting and a well-formulated chart of accounts should enable improved information for fiscal management and performance budgeting.
3. Public Sector Payroll
With public payroll representing a high proportion of GDP, 20 percent in FY2017, careful monitoring of trends is warranted with anticipation of declining resources post-FY2023. The proportion of public sector payroll has been slowly declining since the start of the amended Compact from 24 percent of GDP in FY2004. This reflects the substantial reductions in force in Chuuk and Kosrae and recent growth in the economy at a rate greater than the increase in public sector payroll. Since the start of the amended Compact in FY2003 through FY2017 the number of public servants has declined by 7 percent. However, the wage bill increased by 16 percent during this period, reflecting a 1.6 percent annual average increase in nominal wage rates. It is unclear if the FSM (at least at the state level) can sustain this rate of increase in the wage bill without further fiscal adjustment given the relatively stagnant economy and the static nature of nominal Compact sector grants.
1. The Power Sector
The FSM has managed to operate the SOE sector without the need for large subsidies. However, weak pricing policies in the utility area have led to inefficient operations and lack of replacement of capital. While the supply of electricity in Chuuk is now 24 hours with an improved sewer and water treatment system, Pohnpei suffers from load shedding and central components of its sewer system need rehabilitation. In Yap, the utility charges the government twice the normal price to maintain a positive cash flow. Moves are under way at Pohnpei Utility Corporation to reform the ailing utilities along the lines of the Chuuk initiative through a jointly financed reform program with the World Bank, Asian Development Bank, and U.S. (Compact) funding. Current indications are that the key parties in Pohnpei state are prepared to endorse and fully implement the comprehensive reforms and practices that resulted in success in Chuuk state.
2. Telecom and ICT Reforms
The World Bank is supporting ICT reform through a series of reforms and grants. The initial phase of the project has been to lay a fiber connection ($47.5 million) to Yap and Chuuk. The reforms have required a new law permitting competition in the ICT market, the establishment of an independent regulator, and creation of an Open Access Entity (OAE) to own and operate the new fiber asset. The ICT reform process envisages open access to the fiber network to all potential service providers enabling the birth of a competitive market.
SOE Performance and Reforms

8 FSM FY 2017 - Economic Update - August, 2018
While the conditions have been met, the project has been fraught with issues. An initial lack of agreement on the terms of access to the existing HANTRU cable (providing access between Pohnpei and Guam) was eventually resolved through the issue of an Indefensible Right of Use, guaranteeing the OAE access to the new cable at no cost. Clearly, the most efficient and effective solution is ownership of all submarine cables by one entity. At present the fiber connections are owned and managed by two separate entities: FSM Telecom and the OAE. The new cable connection to Yap is now operational, and while Chuuk is also connected there are currently disputes over the site and operation of the landing site. As in the case of access to HANTRU, lack of resolution is existential and threatens release of funds and the viability of follow on projects.
A second World Bank regional project agreed by the Bank’s Board is to connect Kiribati, Nauru and Kosrae to the Pohnpei HANTRU spur. A third phase currently under design and known as the domestic “roll-out”, will provide fiber connectivity to the premises and home. In all, the FSM will have received a total of over $100 million for enhanced ICT connectivity, that is if current disputes can be resolved and further disputes can be avoided.
3. FSM PetroCorp and Coconut Products for Export
The FSM PetroCorp was created in 2007 to take over the operations of the departing supplier, Mobil. The transfer proceeded well and the PetroCorp has achieved an annual return on capital of 10 percent since its commencement and has now opened operations in Guam and Nauru. It is one of the rare cases of a well-run SOE. However, recent plans to open a coconut processing facility in Tonoas, Chuuk threaten to blemish the good record. While the project has been well designed and researched, investment costs are likely to escalate. However, it falls more under the domain of venture capital and it must be questioned whether high risk projects are an appropriate use of public funds. For an industry
that in the Pacific has been in decline for many years, with labor in short-supply in similar low wage activities, and a declining raw material supply (aging coconut trees), the odds are not favorable. While technology has changed with potential for processing the whole product and production of virgin oil, the market is dominated by the Philippines, which provides 70 percent of world supply at low cost.
1. Fisheries and the Domestic Fleet
After a period in the early 1990s when the FSM invested heavily in the fishing industry, nearly all commercial ventures have either failed or are now under private management. There are two companies with local State government part or full ownership that operate 7 vessels, but under private management. There are a further 3 companies that operate 13 vessels that have been flagged in the FSM. Fishing in the region now effectively comes under the Parties to the Nauru Agreement (PNA); a cartel of 9 pacific island states including PNG, which has led to a remarkable and sustained increase in member country revenues from the sale of vessel days; a fivefold increase for the FSM since the start of the amended Compact. Daily fishing rates average over $10,000 per vessel day and the FSM received $72 million of revenues or 20 percent of GDP in FY2017.
The “domestic” fishing fleet comes under a regional arrangement amongst Pacific nations known as the FSM arrangement, whereby the owners pay a reduced daily rate negotiated
Private Sector Developments

9Federated States of Micronesia
between the host nation and the respective operators. The FSM arrangement was established to encourage the development of the local fishing industry. However, it is debatable whether the 13 domestically flagged vessels make substantial greater contributions to the economy than 3rd country fishing vessels operating without a discount. Our estimates indicate the loss to the FSM treasury may be as much as $14 million or 4% of GDP. This is a matter that requires careful evaluation of the benefits of domestic flagging of vessels, where the private owners make substantial gains, perhaps at the expense of the local economy.
2. The World Bank’s “Doing Business” Survey
The World Bank’s “Doing Business” survey paints a discouraging view of the environment for private sector growth in the FSM. Out of 190 countries the FSM currently scores 155, 82% down the list indicating much room for improvement. The FSM fares worse than Palau and the RMI, which are ranked 130th and 149th, and the FSM is substantially below most of the South Pacific nations. Tonga is ranked 89th, Samoa 87th, Vanuatu 90th, Fiji 101th, and Papua New Guinea 109th. Overall, the FSM’s scores are generally weak. Registering property, protecting investors, and enforcing contracts all score between 183-187 some of the worst scores of all countries surveyed by the World Bank. Slightly higher up the list the FSM registers its best score with 58 for trading across borders and 90 for obtaining credit.
3. Foreign Direct Investment
The existing Foreign Direct Investment (FDI) regime in the FSM, established as part of a set of reforms sponsored by the ADB in the late 90s, provides for a two-part system that provides jurisdiction for investments that are of a national character to the national government and all others to the state governments. However, the system is cumbersome and results in a complex licensing process. In 2016 further reforms were introduced in the FSM Congress to modify the 1997 FDI Act bringing all foreign investment under the jurisdiction of the national government. The reforms effectively claim that all foreign investment is, by its very nature, of national character. While the reforms would streamline the FDI process, and should be supported, they have so far failed to pass through Congressional committee review to be considered for enactment. Overcoming reluctance to conceded jurisdiction in an area formerly under state control will take considerable effort.
1. The FSM Compact Trust Fund
The FSM CTF experienced market gains during FY2017 of 13.8 percent; together with a scheduled contribution from the U.S. of $29.5 million at the outset of the fiscal year, those gains enabled the fund to grow in size by $98 million to an end of FY2016 balance of $565 million. During the period of investment since the outset of FY2007, the annualized rate of return has been 6.9 percent.
Compact Issues
Full benefits of growing domestic flagging of fishing vessels need to be studied in relation to the estimated $14 million loss to the FSM treasury.

10 FSM FY 2017 - Economic Update - August, 2018
The fund would need to grow at 15.1 percent annually from FY2018-2023 to achieve a level sufficient to provide a smooth transition to CTF distributions from FY2024 onward at the real value of FY2023 sector grants ($81 million). Such an unlikely result is all the more concerning as this “simple” sustainability estimate relies upon performance during the distribution period at a 5.0 percent real rate of return and does not allow for market volatility. In the presence of market volatility, the Graduate School has modelled outcomes under the CTF distribution rules. The model results for the FSM indicate a high probability of periodic fiscal shocks, including years in which zero dollars are legally available for distribution.
No distribution rules would simultaneously allow for (i) protecting the real value of the CTF corpus, (ii) ensuring distributions at or near the real value of the FY2023 grants, and (iii) avoiding year-to-year volatility of distributions. However, recent independent studies have shown that technical improvements to the existing rules could provide objectively better results at no extra cost. A key finding is that once market volatility is accounted for, the size of the CTF would need to be approximately 1.67 times larger than estimated using a simple fixed rate of return with no market volatility. Making substantial improvements to the terms of the CTF Agreement would require mutual agreement by the original parties, which for the U.S. entails both executive and congressional approval.
2. Infrastructure and the Economy
Use of the infrastructure grants was slow in implementation at the start of the amended Compact due to capacity constraints to implement the projects. However, by FY2012 implementation issues had been overcome and expenditures exceeded the grant allocation of $22 million by $5 million. Improved performance was short-lived, and a series of issues plagued implementation with utilization falling to $5 million in FY2017. Out of a total estimated allocation of $325 million since the start of the amended Compact, the FSM has only been able to use $124 million, leaving $201 million or 55 percent of GDP of unspent
resources. Project management issues, lack of clear priorities, disputes between and national and state governments, the JEMCO requirement to prepare an updated Infrastructure Development Plan (IDP), and a perception within the FSM national government that requirements to proceed apace were either unclear or changing over time resulted in further delays. By 2016 an Infrastructure Development Plan (IDP) was prepared to set priorities, but project management issues remained. After further delays, in June of 2017 a resolution between the U.S. and the FSM was reached to remove the suspension of the grant, the contractor managing the PMU was terminated, to be replaced for an interim period by the U.S. Army Corps of Engineers.
The failure to implement the infrastructure grant has been very costly to the FSM in lost opportunities and growth. GDP shrunk in the three years FY2012-FY2014, with the economy contracting by 7 percent. While much of the loss was due to the decline in the use of infrastructure grant funding, the earlier completion of large FAA airport improvement projects also resulted in a subsequent decline in economic activity. The large reservoir of unspent resources presents the opportunity to re-invigorate the FSM economy in the remaining years of the amended Compact period. However, care should be taken to ensure the resources are spent evenly, and perhaps well into the FSM trust fund period, to prevent the boom and bust cycle that has afflicted the FSM recently.
3. Post Amended Compact Uncertainties
The annual sector grants, infrastructure, and disaster assistance are set to expire in FY2024. The loss of approximately $80.8 million annually is targeted to be replaced through funding provided from distributions from the Compact Trust Fund; however, there is considerable uncertainty over the continuation of many other special and Federal programs and services the FSM receives from the US. In particular, the FSM benefits from the Special Education Grant (SEG), which was cashed out from

11Federated States of Micronesia
former Federal programs provided in the original Compact. Funding is provided through annual Congressional appropriations whose continuation post-FY2023 will end under current law. There are many further US Federal programs such Postal Services, FDIC, NOAA, Pell grants, FAA, health programs, etc., which are subject to Congressional authorization. While the shortfall in fully sustainable distributions from the Compact Trust Fund is estimated to be $47 million after FY2023, the range of possible values in the loss of Federal programs may, in the worst case, be a further $35 million or more (the sum in FY2017 of SEG, Federal Programs and Pell grants). In the remaining years of the amended Compact through FY2023, clarity is required on the status of these programs so that the FSM can effectively plan for the arrival of the Compact Trust Fund era.
1. Statistical Issues
In former Gradual School reviews of the FSM, statistical availability has been accorded a high score. Since the start of the amended Compact
the FSM has developed a full range of statistics on which to monitor economic performance. However, in a recent IMF Article IV staff review the Fund indicated that “data provision has serious shortcomings that significantly hamper surveillance”. While the ranking of statistical adequacy in the IMF reviews is not transparent, it appears timing and frequency are the major areas of concern. The FSM set of economic statistics is prepared 11 months after the end of the fiscal year. No quarterly estimates are prepared, which are now becoming standard. Coverage does not seem to be an issue. The annual statistical update in the FSM is timed to coincide with the release of the government audits and in time for the annual JEMCO meeting. More frequent estimates, such as quarterly, would not seem essential in an economy such as the FSM where trends are slow moving. However, availability of provisional estimates earlier in the year to coincide with budget preparation would be a priority.
Of more concern has been the recent action by the FSM Department of Finance to cease sharing tax information with the National Statistics Office (NSO) due to the need for compliance with Global Forum requirements. Given these new constraints on sharing of tax information, key data relating to business gross receipts, which formed the basis of the GDP by industry estimates, has been unavailable to the NSO for the FY2016 and FY2017 periods. To address this matter FSM Finance has committed its own resources to code its existing business list and will provide that list to the NSO for validation against the international standard of industrial codes (ISIC). This will then be applied to a database recently constructed by FSM Finance covering the period since the start of FY2014 of the levels of Gross Output for each business. It is understood totals by industry will then be submitted to the NSO to allow the restoration of reporting GDP by u industry. Should this prove a reliable source of information, the GDP by industry series can be constructed for the missing years FY2016 and FY2017. The series can then be maintained in the future so that the FSM does not fall behind in an area where much progress had been achieved.
Other Issues
Sustainable distributions from the Compact Trust Fund imply a decline of $30-47 million annually, while uncertainties about other flows could represent a further decline of $35 million annually.

12 FSM FY 2017 - Economic Update - August, 2018
The FSM experienced volatile GDP Growth during the amended Compact Period
Contributions to GDP: off shore purse seine fisheries add significantly to volatility in economic performance
Large decline in Public Sector Employment
Real Wages decline; public/private sector wage differential remains large
Inflation turns negative in FY15 and FY16, and remains unchanged in FY17
Commercial bank lending remains weak; funds invested offshore
-4%
-5%
-3%
-2%
-1%
0%
1%
2%
4%
3%
5%
6%
FY08
FY09
FY10
FY05
FY04
FY06
FY07
FY11
FY12
FY13
FY14
FY15
FY16
FY17
Total GDP Growth
-4%
-5%
-3%
-2%
-1%
0%
1%
2%
4%
3%
5%
6%GDP without Purse Seiners
Purse Seiners
Total GDP Growth
FY08
FY09
FY10
FY05
FY04
FY06
FY07
FY11
FY12
FY13
FY14
FY15
FY16
FY17
6,500
6,000
7,000
7,500
8,000
8,500
9,000
10,000
9,500Private Sector Public Sector
FY03
FY05
FY07
FY97
FY95
FY99
FY01
FY09
FY11
FY13
FY15
FY17
-0.5%
-1.0%
0.0%
0.5%
1.0%
1.5%
2.0%
2.5%
Fuel and Power
Food FSM CPI
FY08
FY09
FY10
FY05
FY04
FY06
FY07
FY11
FY12
FY13
FY14
FY15
FY16
FY17
$50m
$0m
$100m
$150m
$200m
$250m
$300m
$350m
Deposits Foreign Assets Loans
FY08
FY09
FY10
FY05
FY04
FY06
FY07
FY11
FY12
FY13
FY14
FY15
FY16
FY17
$1,000
$0
$2,000
$3,000
$4,000
$5,000
$6,000
$10,000
$8,000
$9,000
$7,000
Private Sector Public Sector
FY03
FY05
FY07
FY09
FY11
FY13
FY15
FY04
FY06
FY08
FY10
FY12
FY14
FY16
FY17
13Federated States of Micronesia
FSM generates large fiscal surpluses after FY14 with rising fishing Fee revenues
National achieves large fiscal surplus as State governments attain balance
State government domestic revenues stagnate as National Revenues Boom
FSM Social Security funds currentloy sustainable but benefits projected to outstrip contributions in the long-term
External Debt low as % of GDP and sustainable
Trust Fund unlikely to achieve a size sufficient to replace FY2023 sector grant level
-$10m
-$20m
$0m
$10m
$20m
$30m
$40m
$50m
State Govnernments: fiscal balance
National Govnernment: fiscal balance
FY08
FY09
FY10
FY05
FY06
FY07
FY11
FY12
FY13
FY14
FY15
FY16
FY17
$140m
$120m
$160m
$180m
$200m
$220m
$260m
$240m
$280m
$300m
Expenditures Revenues
Fiscal surplus in FY17 = $53 million or 15% of GDP
FY08
FY09
FY10
FY05
FY04
FY06
FY07
FY11
FY12
FY13
FY14
FY15
FY16
FY17
5%
0%
10%
15%
20%
25%
30%
35%External Debt % GDP
External Debt net of OFfsetting Assets % GDP
Debt Service % of National Government Revennues
FY08
FY09
FY10
FY05
FY04
FY06
FY07
FY11
FY12
FY13
FY14
FY15
FY16
FY17
$20
$0
$40
$60
$80
$100
$120
$140State Governments
National Government
FY08
FY09
FY10
FY05
FY04
FY06
FY07
FY11
FY12
FY13
FY14
FY15
FY16
FY17
FY04 $30mFY13 $56m
FY16 $90m
FY14 $92m
FY17 $115m
$0.4m
$0m
$0.8m
$1.2m
$1.6m
$2.0m
$2.4m
$2.8m
20082009
20102005
20042006
20072011
20122013
20142015
20162017
20182019
20202021
20222023
$2.76B"SAFER" SUSTAINABILITY EST
$1.65BSIMPLE SUSTAINABILITY EST
$565mAT 9/30/2017
$1.11mPROJECTED AT 9/30/2023
$10m
$0m
$20m
$30m
$40m
$50m
$60m
$5m
$0m
$10m
$15m
$20m
$25m
$30m
$35m
Benefits Contributions Fund Assets
20192020
20212016
20152017
20182022
20232024
2025
$8m deficit

14 FSM FY 2017 - Economic Update - August, 2018
FSM summary economic indicators, FY2010-FY2017
FY10 FY11 FY12 FY13 FY14 FY15 FY16 FY17National accounts
GDP, at constant prices $ million, FY2004 prices 242.5 250.6 245.6 235.9 230.7 242.1 243.8 251.6 GDP, % growth 2.0 3.3 -2.0 -3.9 -2.2 5.0 0.7 3.2 GDP, % growth (excluding purse seine fishing boats) 3.6 0.7 -1.9 -2.3 -3.5 2.3 2.4 3.5
FY2016 GDP estimates are “Interim” until administrative data on business gross revenues becomes available. Prices (annual percent change)
Consumer price index 3.6 3.9 6.3 2.1 0.7 0.0 -0.9 0.0 CPI Domestic items 5.7 5.1 9.5 3.6 1.3 0.3 0.1 1.6 CPI Imported items 3.0 3.5 5.3 1.7 0.5 0.0 -1.3 -0.1
Employment and WagesNumber of employees 15,809 16,108 15,830 15,538 15,084 15,095 15,404 15,620% change 4.3 1.9 -1.7 -1.8 -2.9 0.1 2.1 1.4 Private sedctor 7,420 7,718 7,500 7,242 6,891 6,951 7,140 7,204 % change 7.9 4.0 -2.8 -3.4 -4.9 0.9 2.7 0.9 Public sector 8,321 8,290 8,226 8,175 8,049 7,981 8,044 8,171 % change 1.3 -0.4 -0.8 -0.6 -1.5 -0.8 0.8 1.6Average annual wage 7,661 7,671 7,913 7,975 8,070 8,301 8,223 8,408% change 2.3 0.1 3.2 0.8 1.2 2.9 -0.9 2.3 Private sector 4,870 5,058 5,224 5,174 5,052 5,175 5,239 5,326 % change 3.8 3.8 3.3 -1.0 -2.4 2.4 1.2 1.7 Public sector 10,128 10,072 10,325 10,419 10,592 10,967 10,843 11,060 % change 3.2 -0.6 2.5 0.9 1.7 3.5 -1.1 2.0Average annual real wage (less inflation) 5,696 5,492 5,329 5,259 5,283 5,433 5,020 4,909% change -1.3 -3.6 -3.0 -1.3 0.5 2.8 -7.6 -2.2
Government Finance Statistics, $ millionsRevenue 200.3 201.0 215.2 196.1 206.0 207.9 226.6 282.3 Tax revenue 35.6 37.3 38.0 38.2 60.3 39.0 42.7 64.0 Grants 136.7 136.8 140.6 111.7 88.8 91.1 107.5 130.9 Other revenue 28.0 26.8 36.6 46.1 57.0 77.8 76.4 87.5Expense -135.8 -135.7 -142.2 -141.7 -147.9 -153.4 -163.3 -174.4 Compensation of Employees -68.0 -68.0 -67.7 -69.1 -69.8 -69.8 -69.8 -73.7 Use of goods and services -54.5 -52.4 -58.8 -53.7 -62.3 -67.8 -75.6 -86.6 Other expense -13.3 -15.4 -15.7 -18.9 -15.8 -15.8 -17.9 -14.1Net Worth and its Changes -62.4 -64.6 -71.9 -54.4 -58.1 -54.5 -63.2 -108.0 Nonfinancial assets -63.2 -67.1 -70.1 -45.3 -22.6 -21.7 -39.1 -55.0 Financial assets 2.3 -4.1 -8.8 -3.2 -30.7 -42.2 -31.5 -83.9 Financial liabilities -1.5 6.6 6.9 -5.9 -4.8 9.5 7.4 30.9Overall fiscal balance 1.4 -1.8 2.9 9.1 35.5 32.7 24.1 53.0
(In percent of GDP)Revenue 82.6 80.2 87.6 83.1 89.3 85.9 92.9 112.2 Taxes 14.7 14.9 15.5 16.2 26.1 16.1 17.5 25.5 Domestic revenues 26.2 25.6 30.4 35.8 50.8 48.2 48.8 60.2 Grants 56.4 54.6 57.3 47.3 38.5 37.6 44.1 52.0Expense -56.0 -54.2 -57.9 -60.0 -64.1 -63.4 -67.0 -69.3 Compensation of Employees -28.0 -27.1 -27.6 -29.3 -30.3 -28.8 -28.6 -29.3 Use of goods and services -22.5 -20.9 -24.0 -22.7 -27.0 -28.0 -31.0 -34.4 Non Financial Assets -26.1 -26.8 -28.5 -19.2 -9.8 -9.0 -16.0 -21.9Overall fiscal balance 0.6 -0.7 1.2 3.8 15.4 13.5 9.9 21.1
FY2016 Population GDP per capitaGDP current prices, $ million 331.4 Chuuk 46,688 1,994Population 102,453 Kosrae 6,227 3,376GDP per capita $ 3,235 Pohnpei 37,893 4,349GNI per capita $ 3,769 Yap 11,645 4,507GNDI per capita $ 4,839FY2016 GDP estimates are “Interim” until administrative data on business gross revenues becomes available.

15Federated States of Micronesia
FY10 FY11 FY12 FY13 FY14 FY15 FY16 FY17Money and Banking ($ million) Assets 178.4 190.1 228.1 237.7 270.4 281.1 263.3 283.1 Foreign assets 111.8 124.3 159.5 172.4 199.3 198.9 173.6 192.2 Loans 55.7 55.2 56.8 54.0 60.9 68.9 78.4 77.8 Commercial loans 34.0 33.0 31.5 29.4 33.5 37.8 41.3 40.9 Consumer loans 21.7 22.2 25.3 24.6 27.4 31.1 37.2 36.9 Other assets 10.9 10.6 11.8 11.3 10.2 13.3 11.3 13.0 Liabilities 178.4 190.1 228.1 237.7 270.4 281.1 263.3 283.1 Deposits 154.1 166.2 204.3 213.2 243.9 253.0 234.2 253.3 Capital 24.3 23.8 23.7 24.5 26.5 28.1 29.1 29.8 Loans to deposit ratio, % 19.3 -0.9 2.9 -4.8 12.7 13.1 27.6 26.6Balance of Payments $ million Trade balance -128.4 -134.0 -125.4 -128.8 -117.5 -127.9 -110.3 0.0 Service balance -45.7 -46.5 -45.4 -40.7 -36.0 -36.8 -41.2 0.0 Primary Income balance 10.6 9.6 15.4 25.5 25.4 59.4 54.8 0.0 Secondary Income balance 110.8 108.6 107.7 107.4 125.2 110.3 109.6 0.0 Current Account, balance -52.7 -62.2 -47.8 -36.6 -2.9 4.9 12.9 0.0 Capital Account, balance 64.2 62.0 68.3 42.2 21.2 30.9 32.4 0.0 Financial account balance 11.5 -0.3 20.6 5.6 18.3 35.8 45.3 0.0International Investment position (IIP), $ million Total stocks, net 182.6 185.1 225.3 263.8 302.7 338.5 383.8 466.5 Direct investment, net n.a. n.a. n.a. n.a. n.a. n.a. n.a. n.a. Portfolio investment, net 153.7 146.3 151.3 174.3 192.1 213.0 228.0 269.7 Other investment, net 26.7 36.6 71.9 85.7 106.8 120.0 150.0 192.4 memo: COFA Trust Fund 177.2 198.5 257.3 323.1 380.9 397.3 467.1 564.3External Debt, $ million Gross External Debt Total 85.6 88.2 88.4 87.7 89.7 81.1 80.4 80.4 External Debt Net of Offsetting Assets 51.9 55.6 56.9 57.3 60.5 56.7 57.1 57.8 Gross External debt as % of GDP 28.9 28.4 27.1 27.7 28.2 25.7 24.3 22.1 Net External debt as % of GDP 17.5 17.9 17.4 18.1 19.0 18.0 17.2 15.9 Debt Service 4.9 5.5 5.6 6.4 7.4 6.7 6.4 6.6 Debt service as % of national goverenment revenues 13.5 14.8 11.8 11.3 8.1 7.4 7.1 5.7

16 FSM FY 2017 - Economic Update - August, 2018
ECONOMIC BRIEFFSM FY 2017
August, 2018
The FSM Economic Brief is produced annually to provide an independent assessment of the Federated States of Micronesia’s economic performance and policy environment, as well as independently verified economic statistics. The FSM Economic Brief summarizes the full FSM Economic Review, which is developed to assist the government of the FSM and the U.S. Department of the Interior’s Office of Insular Affairs to fulfill their respective reporting requirements under the FSM Compact of Free Association with the United States.
The FSM Economic Brief has been prepared by the Economic Monitoring and Analysis Program (EconMAP) of the Graduate School USA, with funding assistance from the United States Department of the Interior’s Office of Insular Affairs. Additional information is available online at www.econmap.org
Additional information on the EconMAP program, as well as a digital copy of this report, is available online at http://www.econmap.org