Embed Size (px)
Citation preview

August 2014
Index
1
In this Issue ...
Fund Manager Commentary Pg 2
HSBC Equity Fund Pg 6
HSBC India Opportunities Fund Pg 8
HSBC Midcap Equity Fund Pg 10
HSBC Progressive Themes Fund Pg 12
HSBC Tax Saver Equity Fund Pg 14
HSBC Dividend Yield Equity Fund Pg 16
HSBC Dynamic Fund Pg 18
HSBC Emerging Markets Fund Pg 20
HSBC Brazil Fund Pg 21
HSBC Asia Pacific (Ex Japan) Dividend Yield Fund Pg 22
HSBC Managed Solutions India - Growth Pg 23
HSBC Managed Solutions India - Moderate Pg 24
HSBC Managed Solutions India - Conservative Pg 25
Fund Managers - Equity Pg 26
Comparative Performance of Equity Schemes Pg 28
HSBC MIP - Savings Plan Pg 32
HSBC MIP - Regular Plan Pg 34
HSBC Income Fund - Investment Plan Pg 36
HSBC Income Fund - Short Term Plan Pg 38
HSBC Floating Rate Fund - Long Term Plan Pg 40
HSBC Cash Fund Pg 42
HSBC Gilt Fund Pg 44
HSBC Ultra Short Term Bond Fund Pg 45
HSBC Flexi Debt Fund Pg 47
Fund Managers - MIP & Debt Pg 49
Comparative Performance of MIP & Debt Schemes Pg 51
Fund Manager Commentary August 2014
2
Equity & MIP
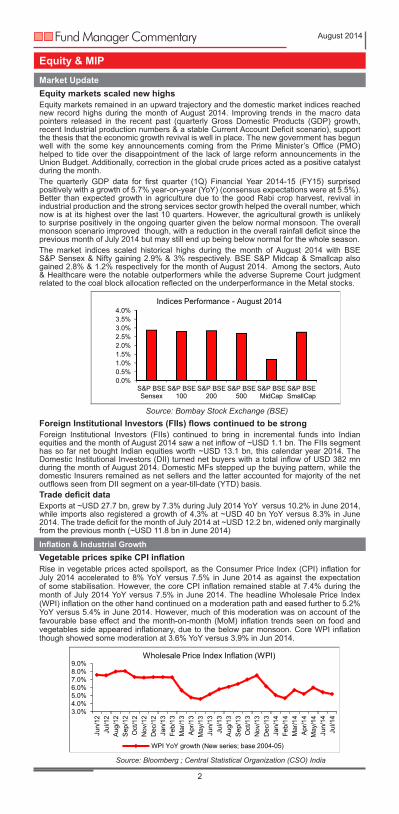
Market UpdateEquity markets scaled new highsEquity markets remained in an upward trajectory and the domestic market indices reached new record highs during the month of August 2014. Improving trends in the macro data pointers released in the recent past (quarterly Gross Domestic Products (GDP) growth, recent Industrial production numbers & a stable Current Account Deficit scenario), support the thesis that the economic growth revival is well in place. The new government has begun well with the some key announcements coming from the Prime Minister’s Office (PMO) helped to tide over the disappointment of the lack of large reform announcements in the Union Budget. Additionally, correction in the global crude prices acted as a positive catalyst during the month.The quarterly GDP data for first quarter (1Q) Financial Year 2014-15 (FY15) surprised positively with a growth of 5.7% year-on-year (YoY) (consensus expectations were at 5.5%). Better than expected growth in agriculture due to the good Rabi crop harvest, revival in industrial production and the strong services sector growth helped the overall number, which now is at its highest over the last 10 quarters. However, the agricultural growth is unlikely to surprise positively in the ongoing quarter given the below normal monsoon. The overall monsoon scenario improved though, with a reduction in the overall rainfall deficit since the previous month of July 2014 but may still end up being below normal for the whole season.The market indices scaled historical highs during the month of August 2014 with BSE S&P Sensex & Nifty gaining 2.9% & 3% respectively. BSE S&P Midcap & Smallcap also gained 2.8% & 1.2% respectively for the month of August 2014. Among the sectors, Auto & Healthcare were the notable outperformers while the adverse Supreme Court judgment related to the coal block allocation reflected on the underperformance in the Metal stocks.
Foreign Institutional Investors (FIIs) flows continued to be strongForeign Institutional Investors (FIIs) continued to bring in incremental funds into Indian equities and the month of August 2014 saw a net inflow of ~USD 1.1 bn. The FIIs segment has so far net bought Indian equities worth ~USD 13.1 bn, this calendar year 2014. The Domestic Institutional Investors (DII) turned net buyers with a total inflow of USD 382 mn during the month of August 2014. Domestic MFs stepped up the buying pattern, while the domestic Insurers remained as net sellers and the latter accounted for majority of the net outflows seen from DII segment on a year-till-date (YTD) basis.Trade deficit data Exports at ~USD 27.7 bn, grew by 7.3% during July 2014 YoY versus 10.2% in June 2014, while imports also registered a growth of 4.3% at ~USD 40 bn YoY versus 8.3% in June 2014. The trade deficit for the month of July 2014 at ~USD 12.2 bn, widened only marginally from the previous month (~USD 11.8 bn in June 2014)
Inflation & Industrial GrowthVegetable prices spike CPI inflationRise in vegetable prices acted spoilsport, as the Consumer Price Index (CPI) inflation for July 2014 accelerated to 8% YoY versus 7.5% in June 2014 as against the expectation of some stabilisation. However, the core CPI inflation remained stable at 7.4% during the month of July 2014 YoY versus 7.5% in June 2014. The headline Wholesale Price Index (WPI) inflation on the other hand continued on a moderation path and eased further to 5.2% YoY versus 5.4% in June 2014. However, much of this moderation was on account of the favourable base effect and the month-on-month (MoM) inflation trends seen on food and vegetables side appeared inflationary, due to the below par monsoon. Core WPI inflation though showed some moderation at 3.6% YoY versus 3.9% in Jun 2014.
Source: Bombay Stock Exchange (BSE)
0.0%0.5%1.0%1.5%2.0%2.5%3.0%3.5%4.0%
S&P BSESensex
S&P BSE100
S&P BSE200
S&P BSE500
S&P BSEMidCap
S&P BSESmallCap
Indices Performance - August 2014
Source: Bloomberg ; Central Statistical Organization (CSO) India
3.0%4.0%5.0%6.0%7.0%8.0%9.0%
Jun/
12Ju
l/12
Aug
/12
Sep
/12
Oct
/12
Nov
/12
Dec
/12
Jan/
13Fe
b/13
Mar
/13
Apr
/13
May
/13
Jun/
13Ju
l/13
Aug
/13
Sep
/13
Oct
/13
Nov
/13
Dec
/13
Jan/
14Fe
b/14
Mar
/14
Apr
/14
May
/14
Jun/
14Ju
l/14
Wholesale Price Index Inflation (WPI)
WPI YoY growth (New series; base 2004-05)

Fund Manager Commentary August 2014
3
Index of Industrial Production (IIP) – Moderation seen but still in the positive territoryThe Index of Industrial Production (IIP) growth for June 2014 continued to remain in the positive territory at 3.4% YoY versus 5% in May 2014, but was lower than the market expectation. The sharp de-growth seen in the consumer segment was the primary reason for the moderation in growth.
Global Economic Scenario
During the month of August 2014, there were hopes of easing in the geopolitical tensions in Ukraine which had kept the investor risk appetite in check at the start of the month. Towards the end of the month, there was some indication on a likely truce between Russia & Ukraine which may help to avoid continuing stalemate on the crisis in the region. International crude oil prices corrected during the month of August 2014 on the back of availability of ample supply, lower than expected demand and on the signs of easing geopolitical tensions in Ukraine. This had a positive ramification on net importer nations such as India. The macroeconomic data releases in the US also were better than expectations during August 2014, with the housing data and followed by the upward revision of the estimate of the GDP growth for Q2 calendar year 2014. The European Central Bank (ECB) President Mario Draghi commented on the scope for fiscal policy to play a greater role alongside monetary policy in the Eurozone during the Jackson Hole (Economic Symposium Conference - held in Jackson Hole, Wyoming, since 1981) meeting. He also mentioned that the medium term outlook on inflation in the region has worsened. These comments have led to expectations that he is likely to contemplate on a stimulus programme in the near term.
Going ForwardEquity markets have continued to rally on the back of a strong set of macro data releases, strong corporate earnings growth momentum and a softening of international crude oil prices. The initial steps taken by the new government coupled with the strong mandate for them, has raised hopes of sustaining the trajectory of this economic growth revival. It may not be a sudden ride to sustained high levels of growth though, as there are some near term headwinds in the form of a below normal monsoon and a likely resultant food inflation. This may act as a drag for agricultural growth in the ongoing quarter. A spike in inflation due to monsoon may also adversely impact the rate easing cycle decision of the Reserve Bank Of India (RBI). Moreover, a sustained growth momentum driven by an improvement in the external demand and a pick-up in the private investment and consumption may only materialize with a lag. We remain constructive and confident on the economic growth revival process and believe that decisive government actions can lead to further upside and re-rating in stocks. For investors with a long term investment horizon, equity investments provide the potential to deliver relatively better returns vis-à-vis other alternatives. Therefore, we continue to urge investors to approach equity investing from a long term perspective and always keep the asset allocation plan in mind, taking into account one’s risk appetite and future goals in mind.
Source: Bloomberg, for all data except where mentioned otherwise
Source: Bloomberg ; Central Statistical Organization (CSO) India
-5.0%
0.0%
5.0%
10.0%
May
/12
Jun/
12Ju
l/12
Aug
/12
Sep
/12
Oct
/12
Nov
/12
Dec
/12
Jan/
13Fe
b/13
Mar
/13
Apr
/13
May
/13
Jun/
13Ju
l/13
Aug
/13
Sep
/13
Oct
/13
Nov
/13
Dec
/13
Jan/
14Fe
b/14
Mar
/14
Apr
/14
May
/14
Jun/
14
Index of Industrial Production (IIP)
IIP YoY Growth (New Series; base 2004- 05)
Sectors HSBC Equity Fund
HSBC India Opportunities
Fund
HSBCMidcap
Equity FundConsumer Discretionary = Consumer Staples Energy = Financials Healthcare Industrials Information Technology =Materials =Telecommunication Utilities
Overweight Underweight = Neutral
Fund Manager Commentary August 2014
4
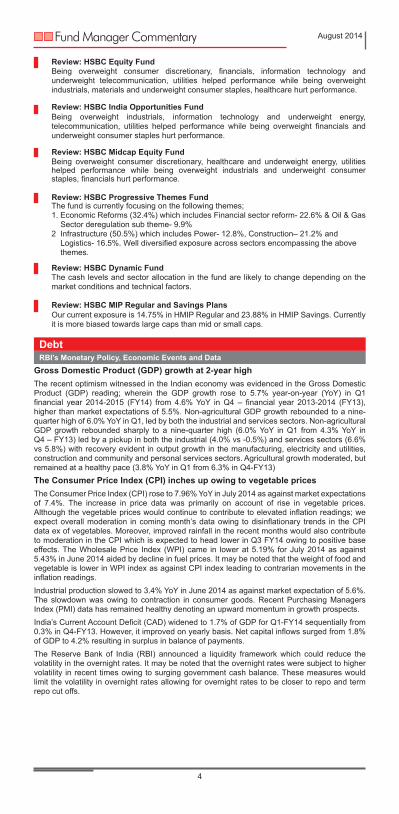
Review: HSBC Progressive Themes FundThe fund is currently focusing on the following themes; 1. Economic Reforms (32.4%) which includes Financial sector reform- 22.6% & Oil & Gas Sector deregulation sub theme- 9.9%2 Infrastructure (50.5%) which includes Power- 12.8%, Construction– 21.2% and Logistics- 16.5%. Well diversified exposure across sectors encompassing the above themes.
Review: HSBC Dynamic FundThe cash levels and sector allocation in the fund are likely to change depending on the market conditions and technical factors.
Review: HSBC MIP Regular and Savings PlansOur current exposure is 14.75% in HMIP Regular and 23.88% in HMIP Savings. Currently it is more biased towards large caps than mid or small caps.
Review: HSBC Midcap Equity FundBeing overweight consumer discretionary, healthcare and underweight energy, utilities helped performance while being overweight industrials and underweight consumer staples, financials hurt performance.
Review: HSBC India Opportunities FundBeing overweight industrials, information technology and underweight energy, telecommunication, utilities helped performance while being overweight financials and underweight consumer staples hurt performance.
Review: HSBC Equity FundBeing overweight consumer discretionary, financials, information technology and underweight telecommunication, utilities helped performance while being overweight industrials, materials and underweight consumer staples, healthcare hurt performance.
DebtRBI’s Monetary Policy, Economic Events and Data
Gross Domestic Product (GDP) growth at 2-year highThe recent optimism witnessed in the Indian economy was evidenced in the Gross Domestic Product (GDP) reading; wherein the GDP growth rose to 5.7% year-on-year (YoY) in Q1 financial year 2014-2015 (FY14) from 4.6% YoY in Q4 – financial year 2013-2014 (FY13), higher than market expectations of 5.5%. Non-agricultural GDP growth rebounded to a nine-quarter high of 6.0% YoY in Q1, led by both the industrial and services sectors. Non-agricultural GDP growth rebounded sharply to a nine-quarter high (6.0% YoY in Q1 from 4.3% YoY in Q4 – FY13) led by a pickup in both the industrial (4.0% vs -0.5%) and services sectors (6.6% vs 5.8%) with recovery evident in output growth in the manufacturing, electricity and utilities, construction and community and personal services sectors. Agricultural growth moderated, but remained at a healthy pace (3.8% YoY in Q1 from 6.3% in Q4-FY13) The Consumer Price Index (CPI) inches up owing to vegetable pricesThe Consumer Price Index (CPI) rose to 7.96% YoY in July 2014 as against market expectations of 7.4%. The increase in price data was primarily on account of rise in vegetable prices. Although the vegetable prices would continue to contribute to elevated inflation readings; we expect overall moderation in coming month’s data owing to disinflationary trends in the CPI data ex of vegetables. Moreover, improved rainfall in the recent months would also contribute to moderation in the CPI which is expected to head lower in Q3 FY14 owing to positive base effects. The Wholesale Price Index (WPI) came in lower at 5.19% for July 2014 as against 5.43% in June 2014 aided by decline in fuel prices. It may be noted that the weight of food and vegetable is lower in WPI index as against CPI index leading to contrarian movements in the inflation readings.Industrial production slowed to 3.4% YoY in June 2014 as against market expectation of 5.6%. The slowdown was owing to contraction in consumer goods. Recent Purchasing Managers Index (PMI) data has remained healthy denoting an upward momentum in growth prospects.India’s Current Account Deficit (CAD) widened to 1.7% of GDP for Q1-FY14 sequentially from 0.3% in Q4-FY13. However, it improved on yearly basis. Net capital inflows surged from 1.8% of GDP to 4.2% resulting in surplus in balance of payments.The Reserve Bank of India (RBI) announced a liquidity framework which could reduce the volatility in the overnight rates. It may be noted that the overnight rates were subject to higher volatility in recent times owing to surging government cash balance. These measures would limit the volatility in overnight rates allowing for overnight rates to be closer to repo and term repo cut offs.

Market Activity
Reduced supply and higher Foreign Institutional Investors (FII) buying capped negative sentimentsThe Government Securities (G-sec) prices remained range bound through the month of August 2014. G-sec yields were under pressure initially post policy as the RBI re-iterated the long pause on monetary rates. Higher than expected CPI reading further dampened the sentiment and bond yields rose significantly. G-sec prices gained later on owing to strong demand from FII investors. Indian Debt markets witnessed highest ever FII buying of over INR 2.4 bn on a single day leading to significant shift in market positioning. Reduction in weekly borrowing, lighter market positioning, and higher stability in overnight rates and reduced net supply in the coming quarter augured well for sovereign bonds in the near term. Softening crude oil prices also aided sentiments as lower crude prices have a positive impact on macro data, especially the twin deficits (CAD & Fiscal deficit).The RBI also announced lower G-sec supply during the remaining five weeks of first half (April 2014 –September 2014) by INR 20 billion to INR 120 bn. Higher cash balances of Government Of India (GOI) has allowed the RBI to tweak the borrowing programme. The above measures positively altered the demand- supply dynamics in the near term providing support to G-sec yields.Credit spreads remain range bound despite higher supplyCorporate bonds remained well bid through the month of August 2014 on back of improved liquidity scenario and positive momentum on the G-sec segment. Markets witnessed larger than expected participation in few primary issues closed recently. Upcoming corporate bond supply would test narrowing of corporate spreads in near term as yield movements in this segment would remain further determined by trends in liquidity and bunching up of corporate bond supply.
Global EconomyAs expected, the Federal Open Market Committee (FOMC) in July 2014 proceeded to taper an additional USD 10 bn, bringing the Quantitative Easing (QE) programme from USD 35 bn to USD 25 bn. Federal Reserve (Fed) commentary was slightly more hawkish as the Fed noted CPI has moved somewhat closer to the Committee’s longer run objective, but that was offset by a weaker than expected Non-Farm Payrolls (NFP) data release at the end of the week. The Fed is expected to remain on track with its tapering and markets expect rate hikes in second half of calendar year 2015 although we would note that despite the more hawkish comments, US Treasuries (UST) have failed to react in a significant manner as geo-political news continue to influence the direction of UST to softer side. In the FOMC minutes, “many” officials saw a rate hike sooner than expected thanks to the improvement in the labour market, with the job market “noticeably closer” to normal. There were differing opinions on the degree of labour slack. “Most” on the Committee also believed downside inflation risks had diminished. Some participants were more uncomfortable with the forward guidance language. Financial vulnerabilities were also well contained.For the month of September 2014, geo-political risk and lower European Central Bank (ECB) ates is expected to keep long term interest rates under pressure while the FOMC press conference could provide some offset, if data continues to remain on the stronger side.
Going ForwardThe RBI’s policy stance remains firmly anchored on keeping the economy on a disinflationary glide path of taking the CPI inflation to 8% by January 2015 and below 6% by January 2016. Monsoons in the near-term and its impact on food prices, and geo-political tensions and changes in US monetary policy remain key risk factors. The short term yields are likely to remain well anchored around the RBI operating overnight rate (Repo rate). There can be some pressure in the near-term on account of increase in certificate of deposit issuance by banks on rollover of maturities.The longer end of the G-sec yield curve is expected to see some easing due to subdued net supply of G-sec. We holding on to long duration given the government’s commitment to maintain fiscal discipline and set targets. The corporate bond yield curve is likely to steepen going forward. The short term corporate bond yields are likely to benefit from stable overnight rates as well as increased demand from rollover of fixed maturity plans (FMPs). The long term yields are likely to see spreads between Government Securities (G-sec) and corporate bonds increase further, with a resumption in supply from the traditional issuers as well as new supply from banks (which have been incentivised to issue seven year maturity infrastructure bonds in the recent Union Budget).We would increase duration on further market weakness primarily through G-sec position given our expectation of spreads to widen in Corporate bonds. We expect a rate cut cycle to begin in 2015 as inflation trends ease and supply side bottlenecks reduce due to government initiatives/policies.Source: Bloomberg, for all data except where mentioned otherwise
Fund Manager Commentary August 2014
5
Source: Bloomberg ; Central Statistical Organization (CSO) India
4.00%5.00%6.00%7.00%8.00%9.00%
10.00%
May
/08
Aug
/08
Nov
/08
Feb/
09M
ay/0
9A
ug/0
9N
ov/0
9Fe
b/10
May
/10
Aug
/10
Nov
/10
Feb/
11M
ay/1
1A
ug/1
1N
ov/1
1Fe
b/12
May
/12
Aug
/12
Nov
/12
Feb/
13M
ay/1
3A
ug/1
3N
ov/1
3Fe
b/14
May
/14
Aug
/14
Repo Rate Movement
Repo Rate
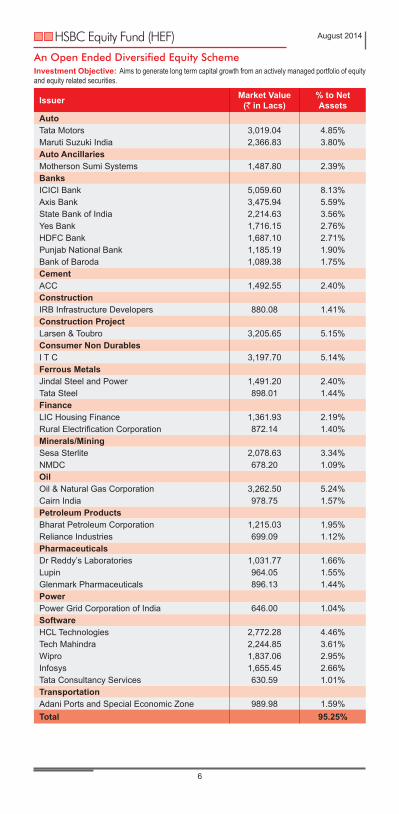
An Open Ended Diversified Equity SchemeInvestment Objective: Aims to generate long term capital growth from an actively managed portfolio of equity and equity related securities.
Issuer Market Value(` in Lacs)
% to NetAssets
Auto Tata Motors 3,019.04 4.85%Maruti Suzuki India 2,366.83 3.80%Auto AncillariesMotherson Sumi Systems 1,487.80 2.39%Banks ICICI Bank 5,059.60 8.13%Axis Bank 3,475.94 5.59%State Bank of India 2,214.63 3.56%Yes Bank 1,716.15 2.76%HDFC Bank 1,687.10 2.71%Punjab National Bank 1,185.19 1.90%Bank of Baroda 1,089.38 1.75%CementACC 1,492.55 2.40%ConstructionIRB Infrastructure Developers 880.08 1.41%Construction ProjectLarsen & Toubro 3,205.65 5.15%Consumer Non DurablesI T C 3,197.70 5.14%Ferrous MetalsJindal Steel and Power 1,491.20 2.40%Tata Steel 898.01 1.44%Finance LIC Housing Finance 1,361.93 2.19%Rural Electrification Corporation 872.14 1.40%Minerals/Mining Sesa Sterlite 2,078.63 3.34%NMDC 678.20 1.09%Oil Oil & Natural Gas Corporation 3,262.50 5.24%Cairn India 978.75 1.57%Petroleum Products Bharat Petroleum Corporation 1,215.03 1.95%Reliance Industries 699.09 1.12%Pharmaceuticals Dr Reddy’s Laboratories 1,031.77 1.66%Lupin 964.05 1.55%Glenmark Pharmaceuticals 896.13 1.44%PowerPower Grid Corporation of India 646.00 1.04%Software HCL Technologies 2,772.28 4.46%Tech Mahindra 2,244.85 3.61%Wipro 1,837.06 2.95%Infosys 1,655.45 2.66%Tata Consultancy Services 630.59 1.01%Transportation Adani Ports and Special Economic Zone 989.98 1.59%Total 95.25%
HSBC Equity Fund (HEF) August 2014
6

Issuer Market Value(` in Lacs)
% to NetAssets
Other Equity Investments 2,414.65 3.87%CBLOs 407.42 0.65%Reverse Repos 499.95 0.80%Net Current Assets -385.78 -0.58%Total Net Assets as on 31 August 2014 62,217.46 100.00%
Asset AllocationAuto 8.65%Auto Ancillaries 2.39%Banks 26.40%Cement 2.40%Construction 1.41%Construction Project 5.15%Consumer Non Durables 5.14%Ferrous Metals 3.84%Finance 3.59%Minerals/Mining 4.43%Oil 6.81%Petroleum Products 3.07%Pharmaceuticals 4.65%Power 1.04%Software 14.69%Transportation 1.59%Other Equity Investments 3.87%Reverse Repos/CBLOs 1.46%Net Current Assets -0.58%Total Net Assets 100.00%
Dividend DeclarationRecord Date / period of
dividend declaredDividend (` per unit)
Non-InstitutionalDividend (` per unit)
InstitutionalNAV (`) per unit(cum dividend)
HSBC Equity Fund - Dividend19-Nov-10 2.00000 2.00000 29.324422-Feb-13 2.50000 2.50000 26.196227-Jun-14 2.50000 2.50000 31.2065HSBC Equity Fund - Dividend - Direct Plan22-Feb-13 2.50000 2.50000 26.250527-Jun-14 2.50000 2.50000 31.5845
Date of Allotment 10-Dec-02Benchmark S&P BSE 200NAV (Growth) per unit(as on 28.08.14)
` 141.6178
Fund Managers Neelotpal SahaiSIP AvailableMinimumApplicationAmount
` 10,000` 1,000 p.m.(SIP)
Exit Load@ NilStatistical Ratios
Standard Deviation 0.86%R-Squared 0.9483Beta (Slope) 0.9516Sharpe Ratio** 0.0328Total Expense Ratio as on August 31, 2014
Regular 2.40% Direct Plan 1.70% Excludes service tax on Investment Management fees of 0.17% of Total Net Assets. Annualised Expense Ratio from 1st April 2014 onwards
Regular 2.42% Direct Plan 1.71% Excludes service tax on Investment Management fees of 0.17% of Total Net Assets. Portfolio Turnover 0.87
Statistical ratios disclosed as per daily returns of the last 3 years/since inception, whichever is later. @ Effective from March 1, 2013 for prospective investments. **Risk free rate: 10 yr Gsec: 8.56% as on August 31, 2014.
HSBC Equity Fund (HEF) August 2014
7
Upon payment of dividend, the NAV per unit falls to the extent of payout and statutory levy, if any. Face value: `10 per unit.
This Product is suitable for investors who are seeking* :l To create wealth over long terml Investment in equity and equity related securitiesl High risk (Brown)*Investors should consult their financial advisers if in doubt about whether the product is suitable for them.Note: Risk may be represented as: (BLUE) investors understand that their principal will be at low risk (YELLOW) investors understand that their principal will be at medium risk (BROWN) investors understand that their principal will be at high risk

An Open Ended Flexi-Cap Equity SchemeInvestment Objective: Seeks long term capital growth through investments across all market capitalisations, including small, mid and large cap stocks. It aims to be predominantly invested in equity & equity related securities. However it could move a significant portion of its assets towards fixed income securities if the fund manager becomes negative on equity markets.
Issuer Market Value(` in Lacs)
% to NetAssets
Auto Eicher Motors 878.04 3.19%Tata Motors 656.31 2.38%Auto AncillariesBalkrishna Industries 580.60 2.11%Sundram Fasteners 320.64 1.16%Banks ICICI Bank 1,868.16 6.78%Axis Bank 1,489.69 5.40%Yes Bank 886.68 3.22%HDFC Bank 843.55 3.06%State Bank of India 492.14 1.79%Punjab National Bank 474.08 1.72%Corporation Bank 327.80 1.19%Syndicate Bank 298.38 1.08%Cement Shree Cement 867.85 3.15%Construction IRB Infrastructure Developers 565.76 2.05%Prestige Estates Project 557.25 2.02%Construction ProjectLarsen & Toubro 915.90 3.32%Consumer Non Durables I T C 1,243.55 4.51%Ferrous MetalsTata Steel 513.15 1.86%Finance LIC Housing Finance 453.98 1.65%Industrial Capital GoodsAIA Engineering 439.28 1.59%Industrial ProductsSupreme Industries 590.05 2.14%Minerals/MiningSesa Sterlite 554.30 2.01%Oil Oil & Natural Gas Corporation 1,087.50 3.95%Aban Offshore 283.52 1.03%Petroleum Products Hindustan Petroleum Corporation 687.00 2.49%Gulf Oil Lubricants 288.45 1.05%Pharmaceuticals Aurobindo Pharma 613.16 2.22%Dr Reddys Laboratories 589.58 2.14%PowerCESC 695.50 2.52%Software HCL Technologies 1,059.99 3.85%Tech Mahindra 708.90 2.57%Mindtree 563.33 2.04%Wipro 423.94 1.54%Infosys 359.88 1.31%Eclerx Services 340.06 1.23%Textile ProductsArvind 716.75 2.60%TransportationGateway Distriparks 461.65 1.67%Gujarat Pipavav Port 287.00 1.04%Total 90.63%
HSBC India Opportunities Fund (HIOF) August 2014
8

Issuer Market Value(` in Lacs)
% to NetAssets
Other Equity Investments 1,122.55 4.08%CBLOs 1,135.71 4.12%Reverse repos 1,393.66 5.06%Net Current Assets -1,071.20 -3.89%Total Net Assets as on 31 August 2014 27,564.03 100.00%
Asset AllocationAuto 5.57%Auto Ancillaries 3.27%Banks 24.24%Cement 3.15%Construction 4.07%Construction Project 3.32%Consumer Non Durables 4.51%Ferrous Metals 1.86%Finance 1.65%Industrial Capital Goods 1.59%Industrial Products 2.14%Minerals/Mining 2.01%Oil 4.98%Petroleum Products 3.54%Pharmaceuticals 4.36%Power 2.52%Software 12.54%Textile Products 2.60%Transportation 2.71%Other Equity Investments 4.08%Reverse Repos/CBLOs 9.18%Net Current Assets -3.89%Total Net Assets 100.00%
Dividend DeclarationRecord Date / period of
dividend declaredDividend (` per unit)
Non-InstitutionalDividend (` per unit)
InstitutionalNAV (`) per unit(cum dividend)
HSBC India Opportunities Fund - Dividend19-Nov-10 1.00000 1.00000 18.231304-Feb-13 1.50000 1.50000 17.731927-Jun-14 1.50000 1.50000 23.2323HSBC India Opportunities Fund - Dividend Direct Plan04-Feb-13 1.50000 1.50000 17.751927-Jun-14 1.50000 1.50000 23.5020
Date of Allotment 24-Feb-04Benchmark S&P BSE 500NAV (Growth) per unit(as on 28.08.14)
` 57.2878
Fund Manager Neelotpal SahaiSIP AvailableMinimumApplication Amount
` 10,000` 1,000 p.m.(SIP)
Exit Load@ NilStatistical Ratios
Standard Deviation 0.81%R-Squared 0.9267Beta (Slope) 0.9071Sharpe Ratio** 0.0482Total Expense Ratio as on August 31, 2014
Regular 2.54% Direct Plan 1.84% Excludes service tax on Investment Management fees of 0.18% of Total Net Assets. Annualised Expense Ratio from 1st April 2014 onwards
Regular 2.57% Direct Plan 1.87% Excludes service tax on Investment Management fees of 0.19% of Total Net Assets. Portfolio Turnover 0.93
Statistical ratios disclosed as per daily returns of the last 3 years/since inception, whichever is later. @ Effective from March 1, 2013 for prospective investments.**Risk free rate: 10 yr Gsec: 8.56% as on August 31, 2014.
HSBC India Opportunities Fund (HIOF) August 2014
9
Upon payment of dividend, the NAV per unit falls to the extent of payout and statutory levy, if any. Face value: `10 per unit.
This Product is suitable for investors who are seeking* :l To create wealth over long terml Invests in equity and equity related securities across market capitalisationsl High risk (Brown)*Investors should consult their financial advisers if in doubt about whether the product is suitable for them.Note: Risk may be represented as: (BLUE) investors understand that their principal will be at low risk (YELLOW) investors understand that their principal will be at medium risk (BROWN) investors understand that their principal will be at high risk

An Open Ended Diversified Equity SchemeInvestment Objective: Seeks to generate long term capital growth from an actively managed portfolio of equity and equity related securities primarily being midcap stocks. However, it could move a portion of its assets towards fixed income securities if the fund manager becomes negative on the Indian equity markets.
Issuer Market Value(` in Lacs)
% to NetAssets
AutoVST Tillers Tractors 433.68 1.98%Auto Ancillaries Sundram Fasteners 899.26 4.11%Balkrishna Industries 702.43 3.21%Suprajit Engineering 586.81 2.68%Apollo Tyres 517.39 2.36%Banks DCB Bank 542.93 2.48%Syndicate Bank 521.56 2.38%Jammu & Kashmir Bank 491.17 2.24%South Indian Bank 366.30 1.67%Federal Bank 283.76 1.30%CementEverest Industries 329.18 1.50%ConstructionIRB Infrastructure Developers 590.91 2.70%National Buildings Construction Corporation 350.59 1.60%Construction ProjectKEC International 438.39 2.00%Consumer Non DurablesGodfrey Phillips India 291.85 1.33%FinanceIndiabulls Housing Finance 677.61 3.09%Cholamandalam Investment & Fin. Co. 584.54 2.67%Motilal Oswal Financial Services 375.58 1.71%Industrial Capital GoodsBEML 564.75 2.58%Industrial ProductsFinolex Industries 517.70 2.36%Media & Entertainment HT Media 469.16 2.14%PesticidesUPL 752.32 3.43%PI Industries 647.06 2.95%Petroleum ProductsGulf Oil Lubricants 510.17 2.33%Hindustan Petroleum Corporation 458.00 2.09%PharmaceuticalsAurobindo Pharma 788.94 3.60%Lupin 636.27 2.90%Torrent Pharmaceuticals 366.41 1.67%Alembic Pharmaceuticals 330.32 1.51%Ipca Laboratories 267.14 1.22%PowerCESC 545.97 2.49%Software Persistent Systems 596.60 2.72%Tech Mahindra 552.94 2.52%Nucleus Software Exports 309.66 1.41%Textile ProductsArvind 636.47 2.91%Transportation Gujarat Pipavav Port 572.57 2.61%Gateway Distriparks 493.51 2.25%Adani Ports and Special Economic Zone 296.99 1.36%Total 88.06%
HSBC Midcap Equity Fund (HMEF) August 2014
10

Issuer Market Value(` in Lacs)
% to NetAssets
Other Equity Investments 2,035.42 9.29%CBLOs 353.83 1.62%Reverse Repos 434.20 1.98%Net Current Assets -215.30 -0.95%Total Net Assets as on 31 August 2014 21,905.04 100.00%
Asset AllocationAuto 1.98%Auto Ancillaries 12.36%Banks 10.07%Cement 1.50%Construction 4.30%Construction Project 2.00%Consumer Non Durables 1.33%Finance 7.47%Industrial Capital Goods 2.58%Industrial Products 2.36%Media & Entertainment 2.14%Pesticides 6.38%Petroleum Products 4.42%Pharmaceuticals 10.90%Power 2.49%Software 6.65%Textile Products 2.91%Transportation 6.22%Other Equity Investments 9.29%Reverse Repos/CBLOs 3.60%Net Current Assets -0.95%Total Net Assets 100.00%
Dividend DeclarationRecord Date / period of
dividend declaredDividend (` per unit)
Non-InstitutionalDividend (` per unit)
InstitutionalNAV (`) per unit(cum dividend)
HSBC Midcap Equity Fund - Dividend24-Mar-08 0.75 0.75 13.379711-Dec-09 1.00 1.00 13.892719-Nov-10 2.00 2.00 15.4864
Date of Allotment 19-May-05Benchmark S&P BSE MidcapNAV (Growth) per unit(as on 28.08.14)
` 30.8458
Fund Manager Dhiraj SachdevSIP AvailableMinimumApplicationAmount
` 10,000` 1,000 p.m.(SIP)
Exit Load@ NilStatistical Ratios
Standard Deviation 1.00%R-Squared 0.8465Beta (Slope) 1.0835Sharpe Ratio** 0.0198Total Expense Ratio as on August 31, 2014
Regular 2.56% Direct Plan 1.86% Excludes service tax on Investment Management fees of 0.19% of Total Net Assets. Annualised Expense Ratio from 1st April 2014 onwards
Regular 2.61% Direct Plan 1.89% Excludes service tax on Investment Management fees of 0.19% of Total Net Assets. Portfolio Turnover 0.59
Statistical ratios disclosed as per daily returns of the last 3 years/since inception, whichever is later. @ Effective from March 1, 2013 for prospective investments.**Risk free rate: 10 yr Gsec: 8.56% as on August 31, 2014.
HSBC Midcap Equity Fund (HMEF) August 2014
11
Upon payment of dividend, the NAV per unit falls to the extent of payout and statutory levy, if any. Face value: `10 per unit.
Our exposure to midcap stocks in HSBC Midcap Equity Fund (HMEF) is 84.6900%
This Product is suitable for investors who are seeking* :l To create wealth over long terml Invests in predominantly mid cap equity and equity related securitiesl High risk (Brown)*Investors should consult their financial advisers if in doubt about whether the product is suitable for them.Note: Risk may be represented as: (BLUE) investors understand that their principal will be at low risk (YELLOW) investors understand that their principal will be at medium risk (BROWN) investors understand that their principal will be at high risk

An Open Ended Flexi-Theme Equity SchemeInvestment Objective: Seeks to generate long term capital growth from an actively managed portfolio of equity and equity related securities by investing primarily in sectors, areas and themes that play an important role in, and/or benefit from India’s progress, reform process and economic development.
Issuer Market Value(` in Lacs)
% to NetAssets
Auto Tata Motors DVR 607.37 4.27%Auto Ancillaries Apollo Tyres 357.05 2.51%Banks ICICI Bank 755.05 5.31%Jammu & Kashmir Bank 601.61 4.23%Karnataka Bank 411.55 2.90%Dena Bank 285.92 2.01%Union Bank of India 271.57 1.91%United Bank of India 153.22 1.08%CementEverest Industries 488.89 3.44%HIL 253.08 1.78%ConstructionNational Buildings Construction Corporation 675.84 4.76%IRB Infrastructure Developers 628.63 4.42%Construction ProjectGammon Infrastructure Projects 195.21 1.37%Larsen & Toubro 190.81 1.34%Finance Rural Electrification Corporation 644.04 4.53%GasGujarat State Petronet 171.00 1.20%Industrial Capital GoodsBEML 493.48 3.47%Industrial Products FAG Bearings India 805.16 5.67%Minerals/MiningGujarat Mineral Development Corporation 386.33 2.72%Petroleum Products Hindustan Petroleum Corporation 989.28 6.96%Indian Oil Corporation 241.52 1.70%Power JSW Energy 448.70 3.16%Reliance Infrastructure 444.06 3.13%Power Grid Corporation of India 355.30 2.50%CESC 292.11 2.06%PTC India 279.81 1.97%Textile - Cotton Vardhman Textiles 198.48 1.40%TransportationGateway Distriparks 1,068.26 7.52%Gujarat Pipavav Port 710.33 5.00%Adani Ports and Special Economic Zone 574.19 4.04%Total 98.36%
HSBC Progressive Themes Fund (HPTF) August 2014
12

Issuer Market Value(` in Lacs)
% to NetAssets
Other Equity Investments 256.38 1.80%CBLOs 43.12 0.30%Reverse Repos 52.91 0.37%Net Current Assets -120.61 -0.84%Total Net Assets as on 31 August 2014 14,209.60 100.00%
Asset AllocationAuto 4.27%Auto Ancillaries 2.51%Banks 17.44%Cement 5.22%Construction 9.18%Construction Project 2.71%Finance 4.53%Gas 1.20%Industrial Capital Goods 3.47%Industrial Products 5.67%Minerals/Mining 2.72%Petroleum Products 8.66%Power 12.82%Textiles - Cotton 1.40%Transportation 16.56%Other Equity Investments 1.80%Reverse Repos/CBLOs 0.68%Net Current Assets -0.84%Total Net Assets 100.00%
Dividend DeclarationRecord Date / period of
dividend declaredDividend (` per unit)
Non-InstitutionalDividend (` per unit)
InstitutionalNAV (`) per unit(cum dividend)
HSBC Progressive Themes Dividend11-May-07 1.00 1.00 12.239026-May-08 1.00 1.00 13.7160
Date of Allotment 23-Feb-06Benchmark S&P BSE 200NAV (Growth) per unit(as on 28.08.14)
` 15.4143
Fund Manager Dhiraj SachdevSIP AvailableMinimumApplicationAmount
` 10,000` 1,000 p.m.(SIP)
Exit Load@ NilStatistical Ratios
Standard Deviation 1.19%R-Squared 0.7718Beta (Slope) 1.1798Sharpe Ratio** 0.0044Total Expense Ratio as on August 31, 2014
Regular 2.63% Direct Plan 1.93% Excludes service tax on Investment Management fees of 0.19% of Total Net Assets. Annualised Expense Ratio from 1st April 2014 onwards
Regular 2.64% Direct Plan 1.93% Excludes service tax on Investment Management fees of 0.20% of Total Net Assets. Portfolio Turnover 0.13
Statistical ratios disclosed as per daily returns of the last 3 years/since inception, whichever is later. @ Effective from March 1, 2013 for prospective investments. **Risk free rate: 10 yr Gsec: 8.56% as on August 31, 2014.
HSBC Progressive Themes Fund (HPTF) August 2014
13
Upon payment of dividend, the NAV per unit falls to the extent of payout and statutory levy, if any. Face value: `10 per unit.
This Product is suitable for investors who are seeking* :l To create wealth over long terml Invests in equity and equity related securities, primarily in themes that play an important role in India’s economic developmentl High risk (Brown)*Investors should consult their financial advisers if in doubt about whether the product is suitable for them.Note: Risk may be represented as: (BLUE) investors understand that their principal will be at low risk (YELLOW) investors understand that their principal will be at medium risk (BROWN) investors understand that their principal will be at high risk

An Open Ended Equity Linked Savings Scheme (ELSS)Investment Objective: Aims to provide long term capital appreciation by investing in a diversified portfolio of equity & equity related instruments of companies across various sectors and industries, with no capitalisation bias. The Fund may also invest in fixed income securities.
Issuer Market Value(` in Lacs)
% to NetAssets
Auto Maruti Suzuki India 816.78 4.13%Tata Motors 215.27 1.09%Auto Ancillaries Motherson Sumi Systems 650.40 3.29%Amara Raja Batteries 455.72 2.31%MRF 396.03 2.00%Banks ICICI Bank 1,371.54 6.94%Indusind Bank 679.12 3.44%Axis Bank 649.50 3.29%Jammu & Kashmir Bank 587.92 2.97%Federal Bank 575.45 2.91%South Indian Bank 352.43 1.78%Cement Shree Cements 867.61 4.39%The Ramco Cements 583.28 2.95%Construction ProjectLarsen & Toubro 804.47 4.07%Consumer DurablesWhirlpool of India 418.79 2.12%Bajaj Electricals 280.92 1.42%Consumer Non DurablesI T C 813.99 4.12%McLeod Russel India 514.29 2.60%Britannia Industries 386.41 1.95%Ferrous MetalsJindal Steel & Power 253.97 1.28%Finance LIC Housing Finance 530.93 2.69%Sundaram Finance 402.98 2.04%GasPetronet LNG 340.59 1.72%Industrial Capital GoodsCrompton Greaves 451.82 2.29%Industrial ProductsSupreme Industries 434.10 2.20%Orient Refractories 349.02 1.77%Finolex Industries 288.10 1.46%OilOil & Natural Gas Corporation 587.25 2.97%Pharmaceuticals Ipca Laboratories 536.32 2.71%Lupin 340.63 1.72%PowerCESC 479.90 2.43%Software Infosys 726.96 3.68%Tech Mahindra 725.44 3.67%Mindtree 552.06 2.79%Textile ProductsArvind 619.27 3.13%TransportationGateway Distriparks 387.79 1.96%Total 98.28%
HSBC Tax Saver Equity Fund (HTSF) August 2014
14

Date of Allotment 05-Jan-07Benchmark S&P BSE 200NAV (Growth) per unit(as on 28.08.14)
` 24.0574
Fund Manager Aditya KhemaniSIP AvailableMinimumApplicationAmount
` 500(Lumpsum & SIP)
Exit Load@ NilStatistical Ratios
Standard Deviation 0.80%R-Squared 0.8950Beta (Slope) 0.8532Sharpe Ratio** 0.0544Total Expense Ratio as on August 31, 2014
Regular 2.58% Direct Plan 1.88% Excludes service tax on Investment Management fees of 0.19% of Total Net Assets.Annualised Expense Ratio from 1st April 2014 onwards
Regular 2.58% Direct Plan 1.88% Excludes service tax on Investment Management fees of 0.19% of Total Net Assets. Portfolio Turnover 0.69
Statistical ratios disclosed as per daily returns of the last 3 years/since inception, whichever is later. @ Effective from March 1, 2013 for prospective investments. **Risk free rate: 10 yr Gsec: 8.56% as on August 31, 2014.
Issuer Market Value(` in Lacs)
% to NetAssets
Other Equity Investments 340.46 1.72%CBLOs 29.22 0.15%Reverse Repos 35.85 0.18%Net Current Assets -63.19 -0.33%Total Net Assets as on 31 August 2014 19,769.36 100.00%
Asset AllocationAuto 5.22%Auto Ancillaries 7.60%Banks 21.33%Cement 7.34%Construction Project 4.07%Consumer Durables 3.54%Consumer Non Durables 8.67%Ferrous Metals 1.28%Finance 4.73%Gas 1.72%Industrial Capital Goods 2.29%Industrial Products 5.43%Oil 2.97%Pharmaceuticals 4.43%Power 2.43%Software 10.14%Textile Products 3.13%Transportation 1.96%Other Equity Investments 1.72%Reverse Repos/CBLOs 0.33%Net Current Assets -0.33%Total Net Assets 100.00%
Dividend DeclarationRecord Date / period of
dividend declaredDividend (` per unit)
Non-InstitutionalDividend (` per unit)
InstitutionalNAV (`) per unit(cum dividend)
HSBC Tax Saver Equity Fund Dividend19-Feb-10 1.00 1.00 12.8713
HSBC Tax Saver Equity Fund (HTSF) August 2014
15
Upon payment of dividend, the NAV per unit falls to the extent of payout and statutory levy, if any. Face value: `10 per unit.
This Product is suitable for investors who are seeking* :l To create wealth over long terml Invests in equity and equity related securities with no market capitilastion biasl High risk (Brown)*Investors should consult their financial advisers if in doubt about whether the product is suitable for them.
Note: Risk may be represented as: (BLUE) investors understand that their principal will be at low risk (YELLOW) investors understand that their principal will be at medium risk (BROWN) investors understand that their principal will be at high risk

An Open Ended Equity SchemeInvestment Objective: To provide long-term capital growth from a diversified portfolio of equity and equity related instruments. The focus would be to invest in stocks of companies facing “out-of-ordinary” conditions.
Issuer Market Value(` in Lacs)
% to NetAssets
Auto Maruti Suzuki India 116.53 2.40%Tata Motors 81.87 1.68%Hero Motocorp 61.21 1.26%Auto Ancillaries Motherson Sumi System 122.00 2.51%Amara Raja Batteries 111.53 2.29%MRF 98.05 2.02%Banks ICICI Bank 383.28 7.88%Axis Bank 156.91 3.23%Karur Vysya Bank 155.61 3.20%Federal Bank 132.83 2.73%Bank of Baroda 132.03 2.72%Jammu & Kashmir Bank 107.39 2.21%HDFC Bank 58.37 1.20%CementShree Cements 86.78 1.78%ACC 75.37 1.55%ConstructionIRB Infrastructure Developers 100.08 2.06%Construction ProjectLarsen & Toubro 157.61 3.24%Consumer Non DurablesI T C 273.98 5.64%McLeod Russel India 102.57 2.11%Hindustan Unilever 75.75 1.56%Ferrous MetalsTata Steel 77.87 1.60%FinanceIndiabulls Housing Finance 90.60 1.86%Industrial Products Finolex Industries 72.03 1.48%Supreme Industries 67.39 1.39%Media & EntertainmentSun TV Network 73.87 1.52%Minerals/MiningNMDC 76.30 1.57%Non - Ferrous Metals Hindustan Zinc 116.19 2.39%Oil Oil & Natural Gas Corporation 271.88 5.59%Petroleum Products Bharat Petroleum Corporation 156.22 3.21%Reliance Industries 80.89 1.66%Pharmaceuticals Lupin 139.16 2.86%Power Power Grid Corporation of India 64.60 1.33%NTPC 64.30 1.32%Software Infosys 317.23 6.52%Wipro 123.79 2.55%HCL Technologies 82.92 1.71%Eclerx Services 81.62 1.68%Tech Mahindra 66.87 1.38%TransportationGateway Distriparks 106.75 2.20%Total 97.09%
HSBC Dividend Yield Equity Fund (HDYEF) August 2014
16

Issuer Market Value(` in Lacs)
% to NetAssets
Other Equity Investments 68.70 1.41%CBLOs 46.42 0.95%Reverse Repos 56.96 1.17%Net Current Assets -30.40 -0.63%Total Net Assets as on 31 August 2014 4,861.94 100.00%
Asset AllocationAuto 5.34%Auto Ancillaries 6.82%Banks 23.17%Cement 3.33%Construction 2.06%Construction Project 3.24%Consumer Non Durables 9.31%Ferrous Metals 1.60%Finance 1.86%Industrial Products 2.87%Media & Entertainment 1.52%Minerals/Mining 1.57%Non - Ferrous Metals 2.39%Oil 5.59%Petroleum Products 4.87%Pharmaceuticals 2.86%Power 2.65%Software 13.84%Transportation 2.20%Other Equity Investments 1.41%Reverse Repos/Cblos 2.13%Net Current Assets -0.63%Total Net Assets 100.00%
Date of Allotment 21-Mar-07Benchmark S&P BSE 200NAV (Growth) per unit(as on 28.08.14)
` 15.2198
Fund Manager Gaurav Mehrotra & Amaresh Mishra
SIP AvailableMinimumApplicationAmount
` 10,000` 1,000 p.m.(SIP)
Exit Load@ NilStatistical Ratios
Standard Deviation 0.82%R-Squared,m 0.9331Beta (Slope) 0.8944Sharpe Ratio** 0.0385Total Expense Ratio as on August 31, 2014
Regular 2.35% Direct Plan 1.65% Excludes service tax on Investment Management fees of 0.16% of Total Net Assets.Annualised Expense Ratio from 1st April 2014 onwards
Regular 2.60% Direct Plan 1.87% Excludes service tax on Investment Management fees of 0.19% of Total Net Assets.Portfolio Turnover 0.44
Statistical ratios disclosed as per daily returns of the last 3 years/since inception, whichever is later. @ Effective from March 1, 2013 for prospective investments. **Risk free rate: 10 yr Gsec: 8.56% as on August 31, 2014.
HSBC Dividend Yield Equity Fund (HDYEF) August 2014
17
This Product is suitable for investors who are seeking* :l To create wealth over long terml Invests in equity and equity related securities of companies facing “out-of-ordinary” conditionsl High risk (Brown)*Investors should consult their financial advisers if in doubt about whether the product is suitable for them.Note: Risk may be represented as: (BLUE) investors understand that their principal will be at low risk (YELLOW) investors understand that their principal will be at medium risk (BROWN) investors understand that their principal will be at high risk

An Open Ended SchemeInvestment Objective: To provide long term capital appreciation by allocating funds in equity and equity related instruments. It also has the flexibility to move, entirely if required, into debt instruments in times that the view on equity markets seems negative.
Issuer Market Value(` in Lacs)
% to NetAssets
Auto Tata Motors 288.78 4.19%Maruti Suzuki India 180.99 2.63%Banks ICICI Bank 498.18 7.23%Axis Bank 337.66 4.90%HDFC Bank 210.89 3.06%State Bank of India 147.64 2.14%CementACC 119.40 1.73%Construction ProjectLarsen & Toubro 244.24 3.55%Consumer Non DurablesI T C 390.83 5.68%Ferrous MetalsJindal Steel & Power 93.20 1.35%Minerals/Mining Sesa Sterlite 138.58 2.01%Oil Oil & Natural Gas Corporation 295.80 4.30%Petroleum Products Bharat Petroleum Corporation 173.58 2.52%Pharmaceuticals Dr Reddys Laboratories 294.79 4.28%PowerPower Grid Corporation Of India 155.04 2.25%Software Tata Consultancy Services 277.46 4.03%HCL Technologies 269.07 3.91%Telecom ServicesBharti Airtel 99.85 1.45%Transportation Adani Ports and Special Economic Zone 84.86 1.23%Total 62.44%
HSBC Dynamic Fund (HDF) August 2014
18

Issuer Market Value(` in Lacs)
% to NetAssets
CBLOs 1,180.09 17.14%Reverse Repos 1,448.13 21.03%Net Current Assets -43.21 -0.61%Total Net Assets as on 31 August 2014 6,885.84 100.00%
Asset AllocationAuto 6.82%Banks 17.33%Cement 1.73%Construction Project 3.55%Consumer Non Durables 5.68%Ferrous Metals 1.35%Minerals/Mining 2.01%Oil 4.30%Petroleum Products 2.52%Pharmaceuticals 4.28%Power 2.25%Software 7.94%Telecom Services 1.45%Transportation 1.23%Reverse Repos/CBLOs 38.17%Net Current Assets -0.61%Total Net Assets 100.00%
Date of Allotment 24-Sep-07Benchmark S&P BSE 200NAV (Growth) per unit(as on 28.08.14)
` 12.9967
Fund Manager Neelotpal Sahai(for Equity portion)Sanjay Shah (for Fixed Income portion)
SIP AvailableMinimumApplicationAmount
` 10,000` 1,000 p.m.(SIP)
Exit Load@ NilStatistical Ratios
Standard Deviation 0.77%R-Squared 0.9465Beta (Slope) 0.8502Sharpe Ratio** 0.0236Total Expense Ratio as on August 31, 2014
Regular 2.70% Direct Plan 2.00% Excludes service tax on Investment Management fees of 0.20% of Total Net Assets. Annualised Expense Ratio from 1st April 2014 onwards
Regular 2.70% Direct Plan 2.00% Excludes service tax on Investment Management fees of 0.20% of Total Net Assets. Portfolio Turnover 0.55
Statistical ratios disclosed as per daily returns of the last 3 years/since inception, whichever is later. @ Effective from March 1, 2013 for prospective investments. **Risk free rate: 10 yr Gsec: 8.56% as on August 31, 2014.
HSBC Dynamic Fund (HDF) August 2014
19
This Product is suitable for investors who are seeking* :l To create wealth over long terml Invests in equity and equity related securities and in debt instruments when view on equity markets is negativel High risk (Brown)*Investors should consult their financial advisers if in doubt about whether the product is suitable for them.Note: Risk may be represented as: (BLUE) investors understand that their principal will be at low risk (YELLOW) investors understand that their principal will be at medium risk (BROWN) investors understand that their principal will be at high risk

Date of Allotment 17-Mar-08Benchmark MSCI Emerging
Markets IndexNAV (Growth) per unit(as on 28.08.14)
` 12.2156
Fund Manager Piyush Harlalka (Dedicated fund manager for overseas investments)
SIP AvailableMinimumApplicationAmount
` 10,000` 1,000 p.m.(SIP)
Exit Load@ NilStatistical Ratios
Standard Deviation 1.53%R-Squared 0.2430Beta (Slope) 1.1070Sharpe Ratio** 0.0120Total Expense Ratio as on August 31, 2014
Regular 2.70% Direct Plan 2.00% (inclusive of underlying scheme’s expenses) Excludes service tax on Investment Management fees of 0.11% of Total Net Assets.Annualised Expense Ratio from 1st April 2014 onwards
Regular 2.70% Direct Plan 2.00% (inclusive of underlying scheme’s expenses) Excludes service tax on Investment Management fees of 0.11% of Total Net Assets. Statistical ratios disclosed as per daily returns of the last 3 years/since inception, whichever is later. @ Effective from March 1, 2013 for prospective investments. **Risk free rate: 10 yr Gsec: 8.56% as on August 31, 2014.
Asset AllocationOverseas Mutual Fund 98.99%Reverse Repos/CBLOs 0.77%Net Current Assets 0.24%Total Net Assets 100.00%
Issuer Market Value(` in Lacs)
% to NetAssets
Overseas Mutual FundHSBC GIF Glob Emerg Mkts Eq S1 Dis 1,312.68 98.99%CBLOs 4.58 0.35%Reverse Repos 5.63 0.42%Net Current Assets 3.16 0.24%Total Net Assets as on 31 August 2014 1,326.05 100.00%
An Open Ended SchemeInvestment Objective: To provide long term capital appreciation by investing in India and in the emerging markets, in equity and equity related instruments, share classes and units/securities issued by overseas mutual funds or unit trusts. The fund may also invest a limited proportion in domestic debt and money market instruments.
HSBC Emerging Markets Fund (HEMF) August 2014
20
This Product is suitable for investors who are seeking* :l To create wealth over long terml Investment in equity and equity related securities of Emerging economiesl High risk (Brown)*Investors should consult their financial advisers if in doubt about whether the product is suitable for them.
Note: Risk may be represented as: (BLUE) investors understand that their principal will be at low risk (YELLOW) investors understand that their principal will be at medium risk (BROWN) investors understand that their principal will be at high risk
Record Date / period of dividend declared
Dividend (` per unit)Non-Institutional
Dividend (` per unit) Institutional
NAV (`) per unit(cum dividend)
HSBC - Emerging Market Fund - Dividend27-Jun-14 0.50000 0.50000 11.5335HSBC - Emerging Market Fund - Dividend - Direct Plan27-Jun-14 0.50000 0.50000 11.6656
Dividend Declaration

Date of Allotment 06-May-11Benchmark MSCI Brazil
10/40 IndexNAV (Growth) per unit(as on 28.08.14)
` 10.1043
Fund Manager Piyush Harlalka (Dedicated fund manager for overseas investments)
SIP AvailableMinimumApplicationAmount
` 10,000` 1,000 p.m.(SIP)
Exit Load@ NilStatistical Ratios
Standard Deviation 1.37% R-Squared 0.2790Beta (Slope) 0.5410Sharpe Ratio** -0.0100Total Expense Ratio as on August 31, 2014
Regular 2.70% Direct Plan 2.00% (inclusive of underlying scheme’s expenses) Excludes service tax on Investment Management fees of 0.11% of Total Net Assets.Annualised Expense Ratio from 1st April 2014 onwards
Regular 2.70% Direct Plan 2.00% (inclusive of underlying scheme’s expenses) Excludes service tax on Investment Managementfees of 0.11% of Total Net Assets. Statistical ratios disclosed as per daily returns of the last 3 years/since inception, whichever is later. @ Effective from March 1, 2013 for prospective investments. **Risk free rate: 10 yr Gsec: 8.56% as on August 31, 2014.
Asset AllocationOverseas Mutual Fund 101.65%Reverse Repos/CBLOs 1.62%Net Current Assets -3.27%Total Net Assets 100.00%
Issuer Market Value(` in Lacs)
% to NetAssets
Overseas Mutual FundHSBC GIF BRAZIL EQUITY S3D 8,183.05 101.65%CBLOs 58.73 0.73%
Reverse Repos 72.07 0.90%
Net Current Assets -263.62 -3.27%
Total Net Assets as on 31 August 2014 8,050.23 100.00%
An Open-Ended Fund of Funds SchemeInvestment Objective: The primary investment objective of the Scheme is to provide long term capital appreciation by investing predominantly in units/shares of HSBC Global Investment Funds (HGIF) Brazil Equity Fund. The Scheme may, at the discretion of the Investment Manager, also invest in the units of other similar overseas mutual fund schemes, which may constitute a significant part of its corpus. The Scheme may also invest a certain proportion of its corpus in money market instruments and/or units of liquid mutual fund schemes, in order to meet liquidity requirements from time to time.
HSBC Brazil Fund (HBF) August 2014
21
This Product is suitable for investors who are seeking* :l To create wealth over long terml Invests in equity and equity related securities through feeder route in Brazilian marketsl High risk (Brown)*Investors should consult their financial advisers if in doubt about whether the product is suitable for them.Note: Risk may be represented as: (BLUE) investors understand that their principal will be at low risk (YELLOW) investors understand that their principal will be at medium risk (BROWN) investors understand that their principal will be at high risk

Date of Allotment 24-Feb-2014Benchmark MSCI AC Asia
Pacific ex JapanNAV (Growth) per unit(as on 28.08.14)
` 11.1492
Fund Manager Piyush Harlalka (for overseas investments), Sanjay Shah (for investments in Indian Market)
SIP AvailableMinimumApplicationAmount
` 10,000` 1,000 p.m.(SIP)
Exit Load@ NilStatistical Ratios
Standard Deviation 0.44%R-Squared 0.4360Beta (Slope) 0.6140Sharpe Ratio** 0.0690Total Expense Ratio as on August 31, 2014
Regular 2.30% Direct Plan 1.60% (inclusive of underlying scheme’s expenses) Excludes service tax on Investment Management fees of 0.09% of Total Net Assets.Annualised Expense Ratio from 1st April 2014 onwards
Regular 2.30% Direct Plan 1.60%(inclusive of underlying scheme’s expenses) Excludes service tax on Investment Managementfees of 0.09% of Total Net Assets. Statistical ratios disclosed as per daily returns of the last 3 years/since inception, whichever is later. @ Effective from March 1, 2013 for prospective investments.**Risk free rate: 10 yr Gsec: 8.56% as on August 31, 2014.
Asset AllocationOverseas Mutual Fund 98.56%Reverse Repos/CBLOs 2.01%Net Current Assets -0.57%Total Net Assets 100.00%
Issuer Market Value(` in Lacs)
% to NetAssets
Overseas Mutual FundHSBC GIF Asia Pacific (Ex Japan) EQ HD-S9D 5,245.46 98.56%CBLOs 48.10 0.90%
Reverse Repos 59.03 1.11%
Net Current Assets -30.29 -0.57%
Total Net Assets as on 31 August 2014 5,322.30 100.00%
An Open Ended Fund of Funds Scheme Investment Objective: The primary investment objective of the Scheme is to provide long term capital appreciation by investing predominantly in units of HSBC Global Investment Funds (HGIF) Asia Pacific Ex Japan Equity High Dividend Fund (HEHDF). The Scheme may also invest a certain proportion of its corpus in money market instruments and / or units of liquid mutual fund schemes, in order to meet liquidity requirements from time to time. However, there is no assurance that the investment objective of the Scheme will be achieved.
HSBC Asia Pacific (Ex Japan)Dividend Yield Fund (HAPDF)
August 2014
22
This Product is suitable for investors who are seeking* :l To create wealth over long terml Investment in equity and equity related securities of Asia Pacific countries (excluding Japan) through fund of funds routel High risk (Brown)*Investors should consult their financial advisers if in doubt about whether the product is suitable for them.Note: Risk may be represented as: (BLUE) investors understand that their principal will be at low risk (YELLOW) investors understand that their principal will be at medium risk (BROWN) investors understand that their principal will be at high risk

Issuer Market Value(` in Lacs)
% to NetAssets
Mutual FundHSBC Equity Fund - Growth Direct 5,197.66 56.41%HSBC Midcap Equity Fund - Growth Direct 1,321.46 14.34%HSBC Income Fund Inv Plan Growth Direct 994.18 10.79%HSBC Flexi Debt Fund - Growth Direct 473.42 5.14%Overseas Mutual FundHSBC MSCI World Ucits ETF 857.06 9.30%Total 95.98%CBLOs 213.84 2.32%Reverse Repos 262.41 2.85%Net Current Assets -106.55 -1.15%Total Net Assets as on 31 August 2014 9,213.50 100.00%
An Open Ended Fund of Funds Scheme Investment Objective: The objective of the Plan is to provide long term total return primarily by seeking capital appreciation through an active asset allocation with diversification commensurate with the risk profile of investments by investing predominantly in units of equity mutual funds as well as in a basket of debt mutual funds gold exchange traded funds (ETFs) and other ETFs, offshore mutual funds and money market instruments.
HSBC Managed Solutions India - Growth August 2014
23
Asset Allocation Mutual Fund 86.68%Overseas Mutual Fund 9.30%Reverse Repos/CBLOs 5.17%Net Current Assets -1.15%Total Net Assets 100.00%
Date of Allotment 30-Apr-2014Benchmark Composite Index con-
stituting 80% of BSE 200 Index and 20% of CRISIL Composite Bond Index
NAV (Growth) per unit(as on 28.08.14)
` 11.6869
Fund Manager Piyush Harlalka (Dedicated Fund Manager for investments in foreign securities)Gaurav Mehrotra (For managing investments in Indian Market – Equity Portion) Sanjay Shah (For managing investments in Indian Market – Fixed Income Portion)
SIP AvailableMinimumApplicationAmount
` 5,000` 1,000 p.m.(SIP)
Exit Load@ NilStatistical Ratios
Standard Deviation 0.70%R-Squared 0.9304Beta (Slope) 0.8187Sharpe Ratio** 0.0554Total Expense Ratio as on August 31, 2014
Regular 2.27% Direct Plan 2.00% (inclusive of underlying scheme’s expenses) Excludes service tax on Investment Management fees of 0.00% of Total Net Assets and of 0.16% on the underlying scheme’s in which the fund of fund invests.Annualised Expense Ratio from 1st April 2014 onwards
Regular 2.32% Direct Plan 2.05%(inclusive of underlying scheme’s expenses) Excludes service tax on Investment Management fees of 0.00% of Total Net Assets and of 0.16% on the underlying scheme’s in which the fund of fund invests. Statistical ratios disclosed as per daily returns of the last 3 years/since inception, whichever is later.@ Effective from March 1, 2013 for prospective investments.**Risk free rate: 10 yr Gsec: 8.56% as on August 31, 2014.
This Product is suitable for investors who are seeking* l To create wealth over long terml Investing predominantly in units of equity mutual funds as well as in a basket of debt mutual funds, gold & exchange traded funds, offshore mutual funds and money market instruments.l High risk (Brown)*Investors should consult their financial advisers if in doubt about whether the product is suitable for them.Note: Risk may be represented as: (BLUE) investors understand that their principal will be at low risk (YELLOW) investors understand that their principal will be at medium risk (BROWN) investors understand that their principal will be at high risk

Issuer Market Value(` in Lacs)
% to NetAssets
Mutual FundHSBC Equity Fund - Growth Direct 5,420.49 38.60%HSBC Flexi Debt Fund Growth Direct 3,538.68 25.20%HSBC Income Fund Inv Plan Growth Direct 1,902.97 13.55%HSBC Midcap Equity Fund - Growth Direct 1,452.81 10.35%HSBC Inc Fund Short Term - Growth Direct 409.10 2.91%
Overseas Mutual FundHSBC MSCI World Ucits ETF 1,013.66 7.22%Total 97.83%CBLOs 162.86 1.16%Reverse Repos 199.85 1.42%Net Current Assets -58.91 -0.41%Total Net Assets as on 31 August 2014 14,041.54 100.00%
An Open Ended Fund of Funds Scheme Investment Objective: The objective of the fund is to provide long term total return aimed at capital appreciation and providing income through an active asset allocation with diversification commensurate with the risk profile of investments by investing in a basket of debt mutual funds, equity mutual funds, gold ETFs and other ETFs, offshore mutual funds and money market instruments.
HSBC Managed Solutions India - Moderate August 2014
24
Date of Allotment 30-Apr-2014Benchmark CRISIL Balanced
Fund Index NAV (Growth) per unit(as on 28.08.14)
` 11.2471
Fund Manager Piyush Harlalka (Dedicated Fund Manager for investments in foreign securities)Gaurav Mehrotra (For managing investments in Indian Market – Equity Portion) Sanjay Shah (For managing investments in Indian Market – Fixed Income Portion)
SIP AvailableMinimumApplicationAmount
` 5,000` 1,000 p.m.(SIP)
Exit Load@ NilStatistical Ratios
Standard Deviation 0.50%R-Squared 0.6725Beta (Slope) 0.7014Sharpe Ratio** 0.0572Total Expense Ratio as on August 31, 2014
Regular 2.23% Direct Plan 1.98% (inclusive of underlying scheme’s expenses) Excludes service tax on Investment Management fees of 0.00% of Total Net Assets and of 0.14% on the underlying scheme’s in which the fund of fund invests.Annualised Expense Ratio from 1st April 2014 onwards
Regular 2.19% Direct Plan 1.94%(inclusive of underlying scheme’s expenses) Excludes service tax on Investment Management fees of 0.00% of Total Net Assets and of 0.13% on the underlying scheme’s in which the fund of fund invests. Statistical ratios disclosed as per daily returns of the last 3 years/since inception, whichever is later. @ Effective from March 1, 2013 for prospective investments.**Risk free rate: 10 yr Gsec: 8.56% as on August 31, 2014.
Asset Allocation Mutual Fund 90.61%Overseas Mutual Fund 7.22%Reverse Repos/CBLOs 2.58%Net Current Assets -0.41%Total Net Assets 100.00%
This Product is suitable for investors who are seeking* l To create wealth and provide income over the long-terml Investments in a basket of debt mutual funds, equity mutual funds, gold & exchange traded funds, offshore mutual funds and money market instruments.l Medium risk (Yellow)*Investors should consult their financial advisers if in doubt about whether the product is suitable for them.Note: Risk may be represented as: (BLUE) investors understand that their principal will be at low risk (YELLOW) investors understand that their principal will be at medium risk (BROWN) investors understand that their principal will be at high risk

Issuer Market Value(` in Lacs)
% to NetAssets
Mutual FundHSBC Inc Fund Short Term - Growth Direct 13,852.93 42.91%HSBC Flexi Debt Fund Growth Direct 9,116.94 28.24%HSBC Equity Fund - Growth Direct 3,746.84 11.61%HDFC Income Fund Plan Growth Direct 2,513.07 7.78%HSBC Income Fund Inv Plan Growth Direct 1,926.74 5.97%HSBC Midcap Equity Fund - Growth Direct 1,107.02 3.43%Total 99.94%CBLOs 261.30 0.81%Reverse Repos 320.65 0.99%Net Current Assets -559.95 -1.74%Total Net Assets as on 31 August 2014 32,285.54 100.00%
An Open Ended Fund of Funds Scheme Investment Objective: The objective of the Plan is to provide long term total return aimed at providing income through an active asset allocation with diversification commensurate with the risk profile of investments by predominantly investing in units of debt mutual funds as well as in a basket of equity mutual funds, gold ETFs and other ETFs and money market instruments.
HSBC Managed Solutions India - Conservative August 2014
25
Date of Allotment 30-Apr-2014Benchmark Composite Index
constituting of 90% into CRISIL Composite Bond Index and 10% of BSE 200 Index
NAV (Growth) per unit(as on 28.08.14)
` 10.5581
Fund Manager Piyush Harlalka (Dedicated Fund Manager for investments in foreign securities)Gaurav Mehrotra (For managing investments in Indian Market – Equity Portion) Sanjay Shah (For managing investments in Indian Market – Fixed Income Portion) SIP AvailableMinimumApplicationAmount
` 5,000` 1,000 p.m.(SIP)
Exit Load@ NilStatistical Ratios
Standard Deviation 0.18%R-Squared 0.8182Beta (Slope) 0.2040Sharpe Ratio** 0.0477Total Expense Ratio as on August 31, 2014
Regular 1.70% Direct Plan 1.45% (inclusive of underlying scheme’s expenses) Excludes service tax on Investment Management fees of 0.00% of Total Net Assets and of 0.09% on the underlying scheme’s in which the fund of fund invests.Annualised Expense Ratio from 1st April 2014 onwards
Regular 1.60% Direct Plan 1.39%(inclusive of underlying scheme’s expenses) Excludes service tax on Investment Management fees of 0.00% of Total Net Assets and of 0.08% on the underlying scheme’s in which the fund of fund invests. Statistical ratios disclosed as per daily returns of the last 3 years/since inception, whichever is later. @ Effective from March 1, 2013 for prospective investments.**Risk free rate: 10 yr Gsec: 8.56% as on August 31, 2014.
Asset Allocation Mutual Fund 99.94%Reverse Repos/CBLOs 1.80%Net Current Assets -1.74%Total Net Assets 100.00%
Note: Risk may be represented as: (BLUE) investors understand that their principal will be at low risk (YELLOW) investors understand that their principal will be at medium risk (BROWN) investors understand that their principal will be at high risk
This Product is suitable for investors who are seeking*l To provide income over long-terml Investing predominantly in units of debt mutual funds as well as in a basket of equity mutual funds, gold & other exchange traded funds and money market instruments.l Medium risk (Yellow)* Investing predominantly in units of debt mutual funds as well as in a basket of equity mutual funds, gold & other exchange traded funds and money market instruments.

Name of Scheme Fund Manager
HSBC Equity Fund Neelotpal Sahai (from 27 May 2013)
HSBC India Opportunities Fund Neelotpal Sahai (from 27 May 2013)
HSBC Midcap Equity Fund Dhiraj Sachdev (from 01 December 2009)
HSBC Progressive Themes Fund Dhiraj Sachdev (from 01 December 2009)
HSBC Tax Saver Equity Fund Aditya Khemani (from 24 February 2009)
HSBC Dividend Yield Equity Fund Gaurav Mehrotra and Amaresh Mishra (from 02 July 2012)
HSBC Dynamic Fund For Equity portion: Neelotpal Sahai (from 27 May 2013) & For Debt portion: Sanjay Shah (from 14 August 2009)
HSBC Emerging Markets Fund Piyush Harlalka (from 02 July 2012)
HSBC Brazil Fund Piyush Harlalka (from 02 July 2012)
HSBC Asia Pacific (Ex Japan) Dividend Yield Fund
For overseas investments: Piyush Harlalka (from 24 February 2014) & For investment in Indian markets: Sanjay Shah (from 24 February 2014)
HSBC Managed Solutions For overseas investment : Piyush Harlalka (April 2014) , For Investments in Indian Mar-ket - Equity Portion : Gaurav Mehrotra (April 2014) & For Investments in Indian Market - Debt Portion : Sanjay Shah (April 2014)
Fund Manager’s ExperienceDhiraj Sachdev Senior Vice President and Fund Manager - EquitiesB.Com., ACA, Grad CWA, Diploma in Foreign Trade Management (DFTM)Experience:Over 17 years experience in Equity Research and Fund Management. l HSBC Asset Management (India) Private Ltd Senior Vice President & Fund Manager, from October 2011 to present, Senior Fund Manager from 1 December 2009 to September 2011, Head of Equity-Portfolio Management Services from October 2005 to November 2009 l ASK Raymond James Securities India Private Ltd Portfolio Manager from October 2003 to September 2005 l HDFC Bank Ltd Senior Manager Equities from November 1999 to September 2003 l DSQ Software Ltd Business Analyst from June 1999 to November 1999 l Probity Research & Services Ltd (India Infoline Ltd) Research Analyst from November 1998 to May 1999 l Ford Brothers Capital Services (P) Ltd Manager Research from July 1996 to Sept 1998 Gaurav MehrotraVice President & Assistant Fund ManagerPost Graduate Diploma in Business Management, Bachelor of EngineeringExperience: Over 8 years experience in research. l HSBC Asset Management (India) Private Ltd Vice President & Assistant Fund Manager, from April 2012 to present, Associate Vice President, Investment Management from September 2007 to March 2012 l JPMorgan Services India Private Ltd Equity Research from August 2005 to September 2007 l Tata Consultancy Services Ltd Business Analyst from June 2004 to July 2005
Fund Managers - Equity August 2014
26

Neelotpal Sahai Senior Fund Manager - EquitiesB.Tech, PGDM (IIM Kolkata) Experience:Over 18 years of experience in Research and Fund Management. l HSBC Asset Management (India) Private Ltd Senior Fund Manager – Equities from April 2013 onwards. l IDFC Asset Management Company Ltd. Director from February 2006 to April 2013 l Motilal Oswal Securities Ltd Senior Research Analyst from March 2005 to January 2006 l Infosys Ltd Senior Project Manager from June 1999 to March 2005 l Vickers Ballas Securities Ltd Analyst from September 1998 to June 1999 l SBC Warburg Analyst from May 1997 to May 1998 l UTI Securities Ltd Equity Analyst from June 1995 to May 1997
Aditya KhemaniVice President & Fund Manager - EquitiesB.Com. (Hons.), Post Graduate Diploma in Business ManagementExperience: Over 8 years experience in research. l HSBC Asset Management (India) Private Ltd Vice President & Fund Manager (Equity), from April 2012 to present, Assistant Fund Manager, Equities from February 2009 to March 2012; Associate Vice President - Investment Management from October 2007 to February 2009. l SBI Funds Management India Private Ltd Senior Manager - Equity Research from March 2007 to September 2007 l Prudential ICICI Asset Management Company India Private Ltd Assistant Manager - Equity Research from December 2005 to February 2007 l Morgan Stanley Advantage Services India Private Ltd Research Associate from May 2005 to November 2005
Amaresh Mishra Vice President & Assistant Fund ManagerPost Graduate Diploma in Business Manager Management Bachelor of Engineering (Chemical) Experience: Over 8 years of experience in Equities & Sales l HSBC Asset Management (India) Private Ltd Vice President & Assistant Fund Manager, from April 2012 to present, Associate Vice President, Investment Management from April 2008 to March 2012, Associate Vice President, Equities from October 2007 to March 2008; Associate Vice President, Sales and Distribution from March 2005 to September 2007 l Centre for Science and Environment Trainee Researcher from July 2001 to July 2002
Piyush Harlalka Vice President - Fixed Income M.B.A, (Finance), C.A., C.S. Experience:Over 7 years of experience in Research l HSBC Asset Management (India) Private Ltd
Vice President - Fixed Income from April 2012 to present; Associate Vice President - Fixed Income, from October 2010 to March 2012; Assistant Vice President, Investment Management, PMS, from December 2008 to October 2010; Research Analyst, from, July 2007 to November 2008. l Batlivala & Karanai Securities Pvt. Ltd., Research Analyst from April 2006 to June 2007
Fund Managers - Equity August 2014
27

Funds Managed by Neelotpal Sahai.
Comparative Performance of Equity Schemes August 2014
HSBC Equity Fund Date of Inception : 10 Dec 02Scheme Name & Benchmarks July 13 -
June 14July 12 - June 13
July 11 - June 12
Since Inception
HSBC Equity Fund - Growth 37.45% 6.20% -7.72% 25.60%S&P BSE 200 (Scheme Benchmark) 32.58% 8.52% -7.63% 19.85%CNX Nifty (Standard Benchmark) 29.03% 10.70% -6.19% 18.56%`10,000, if invested in HEF, would have become `13,745 `10,620 `9,228 `1,40,285
`10,000, if invested in S&P BSE 200, would have become `13,258 `10,852 `9,237 `81,561
`10,000, if invested in CNX Nifty, would have become `12,903 `11,070 `9,381 `71,890
HSBC India Opportunities Fund Date of Inception : 24 Feb 04Scheme Name & Benchmarks July 13 -
June 14July 12 - June 13
July 11 - June 12
Since Inception
HSBC India Opportunities Fund - Growth 53.83% 3.10% -2.19% 17.87%S&P BSE 500 (Scheme Benchmark) 34.74% 6.98% -8.08% 15.24%CNX Nifty (Standard Benchmark) 29.03% 10.70% -6.19% 14.81%`10,000, if invested in HIOF, would have become `15,383 `10,310 `9,781 `54,865
`10,000, if invested in S&P BSE 500, would have become `13,474 `10,698 `9,192 `43,444
`10,000, if invested in CNX Nifty, would have become `12,903 `11,070 `9,381 `41,806
28
Data for the period July to June has been considered in all cases, except for ‘Since Inception’ returns. ‘Since Inception’ (%) returns are compounded annualised, other % returns are absolute. ‘Since inception’ returns are calculated on `10 invested at inception. Standard benchmark is prescribed by SEBI for long-term equity schemes and is used for comparison purposes. Returns on `10,000 are point-to-point returns for the specific time period, invested at the start of the period. The returns provided above have been rounded off and hence there may be minor differences between point-to-point returns vis-a-vis returns indicated above.
Past performance may or may not be sustained in the future. Refer note below.
Past performance may or may not be sustained in the future. Refer note below.
Past performance may or may not be sustained in the future. Refer note below.
HSBC Dynamic Fund Date of Inception : 24 Sep 07Scheme Name & Benchmarks July 13 -
June 14July 12 - June 13
July 11 - June 12
Since Inception
HSBC Dynamic Fund - Growth 26.17% 2.87% -5.69% 3.44%S&P BSE 200 (Scheme Benchmark) 32.58% 8.52% -7.63% 6.26%CNX Nifty (Standard Benchmark) 29.03% 10.70% -6.19% 6.62%`10,000, if invested in HDF, would have become `12,617 `10,287 `9,431 `12,575
`10,000, if invested in S&P BSE 200, would have become `13,258 `10,852 `9,237 `15,090
`10,000, if invested in CNX Nifty, would have become `12,903 `11,070 `9,381 `15,435
Fund Managed by Neelotpal Sahai (for Equity portion)Sanjay Shah (for Fixed Income portion)
Comparative Performance of Equity Schemes August 2014
29
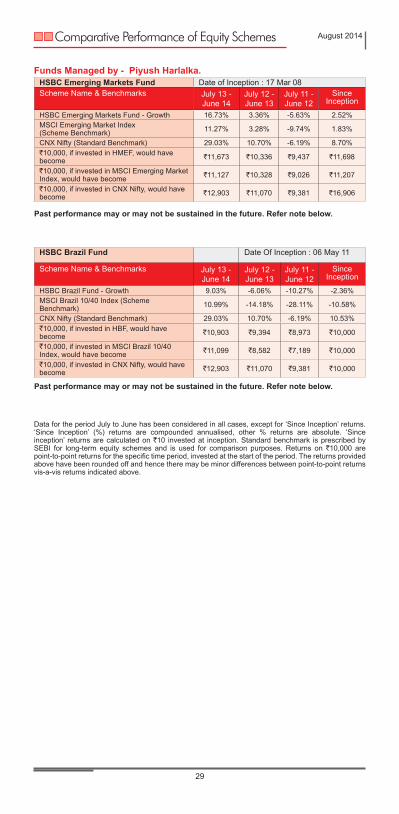
HSBC Brazil Fund Date Of Inception : 06 May 11
Scheme Name & Benchmarks July 13 - June 14
July 12 - June 13
July 11 - June 12
Since Inception
HSBC Brazil Fund - Growth 9.03% -6.06% -10.27% -2.36%MSCI Brazil 10/40 Index (Scheme Benchmark) 10.99% -14.18% -28.11% -10.58%
CNX Nifty (Standard Benchmark) 29.03% 10.70% -6.19% 10.53%`10,000, if invested in HBF, would have become `10,903 `9,394 `8,973 `10,000
`10,000, if invested in MSCI Brazil 10/40 Index, would have become `11,099 `8,582 `7,189 `10,000
`10,000, if invested in CNX Nifty, would have become `12,903 `11,070 `9,381 `10,000
Past performance may or may not be sustained in the future. Refer note below.
HSBC Emerging Markets Fund Date of Inception : 17 Mar 08Scheme Name & Benchmarks July 13 -
June 14July 12 - June 13
July 11 - June 12
Since Inception
HSBC Emerging Markets Fund - Growth 16.73% 3.36% -5.63% 2.52%MSCI Emerging Market Index (Scheme Benchmark) 11.27% 3.28% -9.74% 1.83%
CNX Nifty (Standard Benchmark) 29.03% 10.70% -6.19% 8.70%`10,000, if invested in HMEF, would have become `11,673 `10,336 `9,437 `11,698
`10,000, if invested in MSCI Emerging Market Index, would have become `11,127 `10,328 `9,026 `11,207
`10,000, if invested in CNX Nifty, would have become `12,903 `11,070 `9,381 `16,906
Past performance may or may not be sustained in the future. Refer note below.
Funds Managed by - Piyush Harlalka.
Data for the period July to June has been considered in all cases, except for ‘Since Inception’ returns. ‘Since Inception’ (%) returns are compounded annualised, other % returns are absolute. ‘Since inception’ returns are calculated on `10 invested at inception. Standard benchmark is prescribed by SEBI for long-term equity schemes and is used for comparison purposes. Returns on `10,000 are point-to-point returns for the specific time period, invested at the start of the period. The returns provided above have been rounded off and hence there may be minor differences between point-to-point returns vis-a-vis returns indicated above.
Comparative Performance of Equity Schemes August 2014
30
Past performance may or may not be sustained in the future. Refer note below.
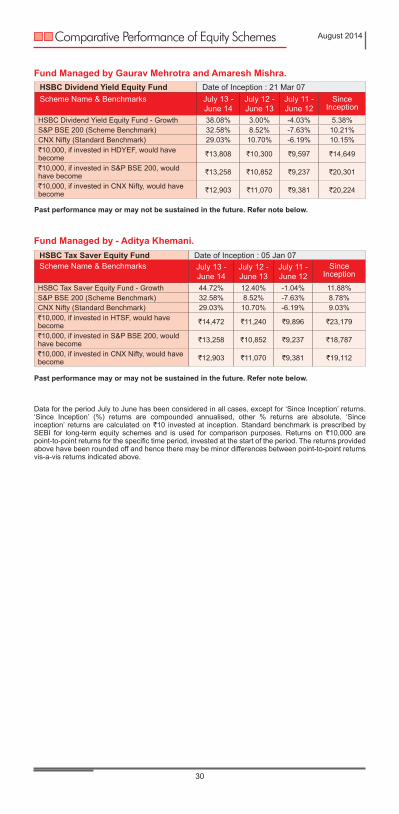
Fund Managed by Gaurav Mehrotra and Amaresh Mishra.
Data for the period July to June has been considered in all cases, except for ‘Since Inception’ returns. ‘Since Inception’ (%) returns are compounded annualised, other % returns are absolute. ‘Since inception’ returns are calculated on `10 invested at inception. Standard benchmark is prescribed by SEBI for long-term equity schemes and is used for comparison purposes. Returns on `10,000 are point-to-point returns for the specific time period, invested at the start of the period. The returns provided above have been rounded off and hence there may be minor differences between point-to-point returns vis-a-vis returns indicated above.
HSBC Dividend Yield Equity Fund Date of Inception : 21 Mar 07Scheme Name & Benchmarks July 13 -
June 14July 12 - June 13
July 11 - June 12
Since Inception
HSBC Dividend Yield Equity Fund - Growth 38.08% 3.00% -4.03% 5.38%S&P BSE 200 (Scheme Benchmark) 32.58% 8.52% -7.63% 10.21%CNX Nifty (Standard Benchmark) 29.03% 10.70% -6.19% 10.15%`10,000, if invested in HDYEF, would have become `13,808 `10,300 `9,597 `14,649
`10,000, if invested in S&P BSE 200, would have become `13,258 `10,852 `9,237 `20,301
`10,000, if invested in CNX Nifty, would have become `12,903 `11,070 `9,381 `20,224
HSBC Tax Saver Equity Fund Date of Inception : 05 Jan 07Scheme Name & Benchmarks July 13 -
June 14July 12 - June 13
July 11 - June 12
Since Inception
HSBC Tax Saver Equity Fund - Growth 44.72% 12.40% -1.04% 11.88%S&P BSE 200 (Scheme Benchmark) 32.58% 8.52% -7.63% 8.78%CNX Nifty (Standard Benchmark) 29.03% 10.70% -6.19% 9.03%`10,000, if invested in HTSF, would have become `14,472 `11,240 `9,896 `23,179
`10,000, if invested in S&P BSE 200, would have become `13,258 `10,852 `9,237 `18,787
`10,000, if invested in CNX Nifty, would have become `12,903 `11,070 `9,381 `19,112
Past performance may or may not be sustained in the future. Refer note below.
Fund Managed by - Aditya Khemani.

Comparative Performance of Equity Schemes August 2014
31
Data for the period July to June has been considered in all cases, except for ‘Since Inception’ returns. ‘Since Inception’ (%) returns are compounded annualised, other % returns are absolute. ‘Since inception’ returns are calculated on `10 invested at inception. Standard benchmark is prescribed by SEBI for long-term equity schemes and is used for comparison purposes. Returns on `10,000 are point-to-point returns for the specific time period, invested at the start of the period. The returns provided above have been rounded off and hence there may be minor differences between point-to-point returns vis-a-vis returns indicated above.
HSBC Progressive Themes Fund Date of Inception : 23 Feb 06Scheme Name & Benchmarks July 13 -
June 14July 12 - June 13
July 11 - June 12
Since Inception
HSBC Progressive Themes Fund - Growth 67.89% -13.86% -8.34% 5.34%S&P BSE 200 (Scheme Benchmark) 32.58% 8.52% -7.63% 11.28%CNX Nifty (Standard Benchmark) 29.03% 10.70% -6.19% 11.52%`10,000, if invested in HPTF, would have become `16,789 `8,614 `9,166 `15,450
`10,000, if invested in S&P BSE 200, would have become `13,258 `10,852 `9,237 `24,426
`10,000, if invested in CNX Nifty, would have become `12,903 `11,070 `9,381 `24,864
Past performance may or may not be sustained in the future. Refer note below.
Funds Managed by - Dhiraj Sachdev.
HSBC Midcap Equity Fund Date of Inception : 19 May 05Scheme Name & Benchmarks July 13 -
June 14July 12 - June 13
July 11 - June 12
Since Inception
HSBC Midcap Equity Fund - Growth 97.40% -15.11% -8.10% 13.01%S&P BSE Midcap (Scheme Benchmark) 54.45% -3.97% -10.84% 12.33%CNX Nifty (Standard Benchmark) 29.03% 10.70% -6.19% 15.84%`10,000, if invested in HMEF, would have become `19,740 `8,489 `9,190 `30,531
`10,000, if invested in S&P BSE Midcap, would have become `15,445 `9,603 `8,916 `28,893
`10,000, if invested in CNX Nifty, would have become `12,903 `11,070 `9,381 `38,247
Past performance may or may not be sustained in the future. Refer note below.

An Open Ended Fund with Regular & Savings Plans.Monthly income is not assured and is subject to availability of distributable surplus.Investment Objective: Seeks to generate reasonable returns through investments in Debt and Money Market Instruments. The secondary objective of the scheme is to invest in equity and equity related instruments to seek capital appreciation.
Issuer
MarketValue(` in
Lacs)
% toNet
AssetsRating
Money Market InstrumentsCertificate of DepositCanara Bank 955.37 5.54% CRISIL A1+Punjab National Bank 621.18 3.60% [ICRA]A1+Punjab National Bank 383.07 2.22% Fitch A1+Commercial PaperAditya Birla Finance 500.00 2.90% [ICRA]A1+Corporate/PSU DebtCorporate Bonds / DebenturesRural Electrification Corporation 504.81 2.93% CRISIL AAAPower Finance Corporation 499.75 2.90% CRISIL AAALIC Housing Finance 493.47 2.86% CRISIL AAABajaj Finance 300.06 1.74% [ICRA]AA+Power Finance Corporation 222.95 1.29% CRISIL AAAEquityEquitiesICICI Bank 287.23 1.66%Larsen & Toubro 251.87 1.46%Shree Cements 247.10 1.43%McLeod Russel India 240.77 1.40%Oil & Natural Gas Corporation 239.25 1.39%The Ramco Cements 227.19 1.32%Axis Bank 222.46 1.29%Maruti Suzuki India 215.80 1.25%Crompton Greaves 188.91 1.09%ITC 186.53 1.08%Motherson Sumi Systems 181.41 1.05%IndusInd Bank 178.56 1.03% N.ALIC Housing Finance 172.51 1.00%Supreme Industries 169.24 0.98%Amara Raja Batteries 152.42 0.88%Tech Mahindra 148.87 0.86%IPCA Laboratories 139.54 0.81%Grasim Industries 137.59 0.80%Arvind 100.35 0.58%MRF 98.53 0.57%The Jammu & Kashmir Bank 89.30 0.52%Karur Vysya Bank 87.19 0.51%Jaiprakash Associates 65.10 0.38%Orient Refractories 64.79 0.38%Hindustan Dorr-Oliver 27.00 0.16%Government Securities8.35% GOVT OF INDIA RED 14-05-2022 1,572.97 9.12% Sovereign8.40% GOVT OF INDIA RED 28-07-2024 1,409.90 8.17% Sovereign9.20% GOVT OF INDIA RED 30-09-2030 1,161.22 6.73% Sovereign8.60% GOVT OF INDIA RED 02-06-2028 1,153.79 6.69% Sovereign9.14% KARNATAKA SDL RED 28-05-2024 757.54 4.39% Sovereign8.83% GOVT OF INDIA RED 25-11-2023 573.93 3.33% Sovereign8.27% GOVT OF INDIA RED- 09-06-2020 565.51 3.28% Sovereign8.12% GOVT OF INDIA RED 10-12-2020 505.18 2.93% Sovereign8.30% GOVT OF INDIA RED 31-12-2042 342.54 1.99% SovereignTotal 96.49%Cash EquivalentsCBLOs 323.90 1.88%Reverse Repos 397.46 2.30%Net Current Assets -110.67 -0.67%Total Net Assets as on 31 August 2014 17,253.44 100.00%
HSBC MIP - Savings Plan (HMIP-S) August 2014
32

Date of Allotment 24-Feb-04Benchmark CRISIL MIP
Blended IndexNAV (Growth) per unit(as on 28.08.14)
` 26.5648
Average Maturity of Portfolio
89.84 months
Modified Durationof Portfolio
53.81 months
Fund Manager Aditya Khemani(for Equity portion)Sanjay Shah &Ruchir Parekh(for Debt portion)
SIP AvailableMinimum Application AmountGrowth `10,000Quarterly Dividend `10,000Monthly Dividend `25,000SIP `1,000 p.m.Exit Load@ NilTotal Expense Ratio as on August 31, 2014
Regular 2.34% Direct Plan 1.84% Excludes service tax on Investment Management fees of 0.14% of Total Net Assets. Annualised Expense Ratio from 1st April 2014 onwards
Regular 2.34% Direct Plan 1.84% Excludes service tax on Investment Management fees of 0.07% of Total Net Assets. @ Effective from March 1, 2013 for prospective investments.
Asset AllocationGovernment Securities 46.63%Equity 23.88%Money Market Instrument 14.26%Corporate/ PSU Debt 11.72%Cash Equivalents 4.18%Net Current Assets -0.67%Total Net Assets 100.00%
Rating ProfileSovereign 46.63%AAA and equivalents 24.24%Equity 23.88%Reverse Repos/ CBLOs 4.18%AA+/ AA-/ AA and equivalents 1.74%Net Current Assets -0.67%Total Net Assets 100.00%
HSBC MIP - Savings Plan (HMIP-S) August 2014
33
Dividend DeclarationRecord Date / period of
dividend declaredDividend (` per unit)
Non-InstitutionalDividend (` per unit)
InstitutionalNAV (`) per unit(cum dividend)
HSBC MIP - Savings Plan - Monthly Dividend25-Jun-14 0.05845 0.05597 13.127125-Jul-14 0.05845 0.05597 13.109725-Aug-14 0.05845 0.05597 13.1188HSBC MIP - Savings Plan - Monthly Dividend - Direct Plan25-Jun-14 0.05845 0.05597 13.479025-Jul-14 0.05845 0.05597 13.468725-Aug-14 0.05845 0.05597 13.4859HSBC MIP - Savings Plan - Quarterly Dividend13-Dec-13 0.15585 0.14926 12.093314-Mar-14 0.15585 0.14926 12.365725-Jun-14 0.17534 0.16792 13.2284HSBC MIP - Savings Plan - Quarterly Dividend - Direct Plan13-Dec-13 0.11689 0.11195 12.470314-Mar-14 0.15585 0.14926 12.826025-Jun-14 0.17534 0.16792 13.7475
Upon payment of dividend, the NAV per unit falls to the extent of payout and statutory levy, if any. Face value: `10 per unit.
This Product is suitable for investors who are seeking* :l Regular Income over medium terml Investment in fixed income (debt and money market instruments) as well as equity and equity related securitiesl Medium risk (Yellow)*Investors should consult their financial advisers if in doubt about whether the product is suitable for them.Note: Risk may be represented as: (BLUE) investors understand that their principal will be at low risk (YELLOW) investors understand that their principal will be at medium risk (BROWN) investors understand that their principal will be at high risk

An Open Ended Fund with Regular & Savings Plans. Monthly income is not assured and is subject to availability of distributable surplus.Investment Objective: Seeks to generate reasonable returns through investments in Debt and Money Market Instruments. The secondary objective of the scheme is to invest in equity and equity related instruments to seek capital appreciation.
Issuer
MarketValue(` in
Lacs)
% toNet
AssetsRating
Money Market InstrumentsCertificate of DepositPunjab National Bank 238.92 2.66% [ICRA]A1+Canara Bank 238.84 2.66% CRISIL A1+Corporate/PSU DebtCorporate Bonds / DebenturesRural Electrification Corporation 504.81 5.62% CRISIL AAAPower Finance Corporation 499.75 5.56% CRISIL AAALIC Housing Finance 493.47 5.49% CRISIL AAABajaj Finance 200.04 2.23% [ICRA]AA+Power Finance Corporation 50.67 0.56% CRISIL AAAEquityEquitiesICICI Bank 91.07 1.01%Tech Mahindra 83.89 0.93%Maruti Suzuki India 82.62 0.92%Shree Cements 81.66 0.91%McLeod Russel India 81.20 0.90%Larsen & Toubro 80.90 0.90%Axis Bank 79.45 0.88%Oil & Natural Gas Corporation 73.95 0.82%Karur Vysya Bank 67.92 0.76%Motherson Sumi Systems 64.11 0.71%ITC 56.84 0.63%IPCA Laboratories 50.00 0.56% N.A.HDFC 49.96 0.56%Supreme Industries 44.76 0.50%Grasim Industries 44.17 0.49%Arvind 43.01 0.48%The Jammu & Kashmir Bank 41.68 0.46%Crompton Greaves 38.95 0.43%Amara Raja Batteries 36.53 0.41%LIC Housing Finance 36.32 0.40%MRF 36.05 0.40%Orient Refractories 30.16 0.34%Jaiprakash Associates 23.25 0.26%Hindustan Dorr-Oliver 8.10 0.09%Government Securities8.35% GOVT OF INDIA RED 14-05-2022 1,035.62 11.52% Sovereign9.20% GOVT OF INDIA RED 30-09-2030 938.30 10.44% Sovereign8.40% GOVT OF INDIA RED 28-07-2024 766.79 8.53% Sovereign8.60% GOVT OF INDIA RED 02-06-2028 475.38 5.29% Sovereign9.14% KARNATAKA SDL RED 28-05-2024 353.52 3.93% Sovereign8.83% GOVT OF INDIA RED 25-11-2023 337.31 3.75% Sovereign8.12% GOVT OF INDIA RED 10-12-2020 306.02 3.40% Sovereign8.27% GOVT OF INDIA RED- 09-06-2020 221.29 2.46% Sovereign8.30% GOVT OF INDIA RED 31-12-2042 190.30 2.12% SovereignTotal 90.97%
HSBC MIP - Regular Plan (HMIP-R) August 2014
34

Date of Allotment 24-Feb-04Benchmark CRISIL MIP
Blended IndexNAV (Growth) per unit(as on 28.08.14)
` 22.3839
Average Maturity of Portfolio
92.67 months
Modified Durationof Portfolio
55.45 months
Fund Manager Aditya Khemani(for Equity portion)Sanjay Shah &Ruchir Parekh(for Debt portion)
SIP AvailableMinimum Application AmountGrowth `10,000Quarterly Dividend `10,000Monthly Dividend `25,000SIP `1,000 p.m.Exit Load@ NilTotal Expense Ratio as on August 31, 2014
Regular 2.35% Direct Plan 1.80% Excludes service tax on Investment Management fees of 0.14% of Total Net Assets. Annualised Expense Ratio from 1st April 2014 onwards
Regular 2.42% Direct Plan 1.86% Excludes service tax on Investment Management fees of 0.07% of Total Net Assets.@ Effective from March 1, 2013 for prospective investments.
Asset AllocationGovernment Securities 51.44%Corporate/ PSU Debt 19.46%Equity 14.75%Cash Equivalents 8.72%Money Market Instruments 5.32%Net Current Assets 0.31%Total Net Assets 100.00%
Issuer
MarketValue(` in
Lacs)
% toNet
AssetsRating
Cash EquivalentsCBLOs 351.83 3.91%Reverse Repos 431.74 4.80%Net Current Assets 28.18 0.31%Total Net Assets as on 31 August 2014 8,989.32 100.00%
Rating ProfileSovereign 51.44%AAA and equivalents 22.55%Equity 14.75%Reverse Repos/ CBLOs 8.72%AA+/ AA-/ AA and equivalents 2.23%Net Current Assets 0.31%Total Net Assets 100.00%
HSBC MIP - Regular Plan (HMIP-R) August 2014
35
Dividend DeclarationRecord Date / period of
dividend declaredDividend (` per unit)
Non-InstitutionalDividend (` per unit)
InstitutionalNAV (`) per unit(cum dividend)
HSBC MIP - Regular Plan - Monthly Dividend25-Jun-14 0.05455 0.05224 11.576225-Jul-14 0.05455 0.05224 11.581225-Aug-14 0.05455 0.05224 11.5447HSBC MIP - Regular Plan - Monthly Dividend - Direct Plan31-Jan-14 0.05065 0.04851 10.979128-Feb-14 0.05065 0.04851 11.0079HSBC MIP - Regular Plan - Quarterly Dividend13-Dec-13 0.15585 0.14926 11.309714-Mar-14 0.15585 0.14926 11.451625-Jun-14 0.17534 0.16792 11.9555
Upon payment of dividend, the NAV per unit falls to the extent of payout and statutory levy, if any. Face value: `10 per unit.
This Product is suitable for investors who are seeking* :l Regular Income over medium terml Investment in fixed income (debt and money market instruments) as well as equity and equity related securitiesl Medium risk (Yellow)*Investors should consult their financial advisers if in doubt about whether the product is suitable for them.Note: Risk may be represented as: (BLUE) investors understand that their principal will be at low risk (YELLOW) investors understand that their principal will be at medium risk (BROWN) investors understand that their principal will be at high risk

An Open Ended Income SchemeInvestment Objective: Aims to provide reasonable income through a diversified portfolio of fixed income securities. The AMC’s view of interest rate trends and the nature of the Plans will be reflected in the type and maturities of securities in which the Short Term and Investment Plans are invested.
Issuer
MarketValue(` in
Lacs)
% toNet
AssetsRating
Securitised DebtInvestments - Asset Back Security
India MBS 2002 Series I 16.95 0.17% CRISIL AAA (SO)
Money Market InstrumentsCertificate of DepositCanara Bank 238.84 2.43% CRISIL A1+Punjab National Bank 191.13 1.95% [ICRA]A1+Commercial PaperAditya Birla Finance 500.00 5.09% [ICRA]A1+Corporate/PSU DebtCorporate Bonds / DebenturesExport Import Bank of India 510.81 5.20% CRISIL AAARural Electrification Corporation 504.81 5.14% CRISIL AAAHDFC 243.14 2.48% CRISIL AAAPower Finance Corporation 81.07 0.83% CRISIL AAAGovernment Securities9.20% GOVT OF INDIA RED 30-09-2030 1,575.94 16.05% Sovereign8.60% GOVT OF INDIA RED 02-06-2028 1,381.57 14.07% Sovereign8.35% GOVT OF INDIA RED 14-05-2022 1,235.91 12.59% Sovereign8.40% GOVT OF INDIA RED 28-07-2024 1,033.92 10.53% Sovereign8.83% GOVT OF INDIA RED 25-11-2023 584.00 5.95% Sovereign8.30% GOVT OF INDIA RED 31-12-2042 447.21 4.56% Sovereign9.14% KARNATAKA SDL RED 28-05-2024 313.12 3.19% Sovereign8.12% GOVT OF INDIA RED 10-12-2020 296.31 3.02% Sovereign8.27% GOVT OF INDIA RED- 09-06-2020 147.53 1.50% Sovereign5.59% GOVT OF INDIA RED 04-06-2016 0.38 0.00% SovereignTotal 94.75%Cash EquivalentsCBLOs 190.04 1.94%Reverse Repos 233.20 2.38%Net Current Assets 91.83 0.94%Total Net Assets as on 31 August 2014 9,817.71 100.00%
HSBC Income Fund - Investment Plan (HIF-IP) August 2014
36

Date of Allotment 10-Dec-02Benchmark CRISIL Composite
Bond Fund IndexNAV (Growth) per unit(as on 28.08.14)
` 21.6268
Average Maturity of Portfolio
119.73 months
Modified Durationof Portfolio
67.48 months
Yield To Maturity* 8.78%Fund Manager Ruchir Parekh &
Sanjay ShahSIP AvailableMinimumApplicationAmount
` 10,000` 1,000 p.m.(SIP)
Exit Load@ NilTotal Expense Ratio as on August 31, 2014 Regular 1.85%Direct Plan 1.10%Excludes service tax on Investment Management fees of 0.12% of Total Net Assets.
Annualised Expense Ratio from 1st April 2014 onwards Regular 1.85%Direct Plan 1.10%Excludes service tax on Investment Management fees of 0.12% of Total Net Assets.
@ Effective from March 1, 2013 for prospective investments.* Based on invested Amount
Asset AllocationGovernment Securities 71.46%Corporate/ PSU Debt 13.65%Money Market Instruments 9.47%Cash Equivalents 4.31%Net Current Assets 0.94%Securitised Debt 0.17%
Dividend DeclarationRecord Date / period of
dividend declaredDividend (` per unit)
Non-InstitutionalDividend (` per unit)
InstitutionalNAV (`) per unit(cum dividend)
HSBC Income Fund - Investment Plan - Regular Option - Quarterly Dividend13-Dec-13 0.15585 0.14926 10.819414-Mar-14 0.15585 0.14926 10.844825-Jun-14 0.15585 0.14926 11.0590HSBC Income Fund - Investment Plan - Institutional Option - Quarterly Dividend12-Jun-09 0.11387 0.10598 11.029411-Sep-09 0.11387 0.10598 10.996011-Dec-09 0.11387 0.10598 11.0973
Rating ProfileSovereign 71.46%AAA and equivalents 23.29%Reverse Repos/ CBLOs 4.31%Net Current Assets 0.94%
HSBC Income Fund - Investment Plan (HIF-IP) August 2014
37
Upon payment of dividend, the NAV per unit falls to the extent of payout and statutory levy, if any. Face value: `10 per unit.
This Product is suitable for investors who are seeking* :l Regular Income over long terml Investment in diversified portfolio of fixed income securitiesl Low risk (Blue)*Investors should consult their financial advisers if in doubt about whether the product is suitable for them.Note: Risk may be represented as: (BLUE) investors understand that their principal will be at low risk (YELLOW) investors understand that their principal will be at medium risk (BROWN) investors understand that their principal will be at high risk
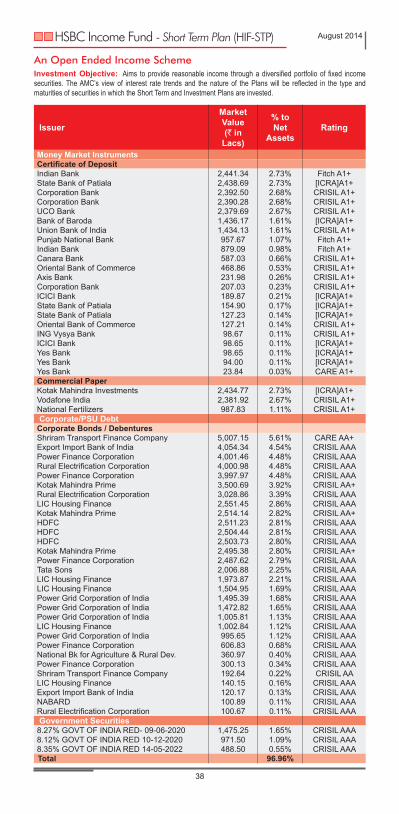
An Open Ended Income SchemeInvestment Objective: Aims to provide reasonable income through a diversified portfolio of fixed income securities. The AMC’s view of interest rate trends and the nature of the Plans will be reflected in the type and maturities of securities in which the Short Term and Investment Plans are invested.
Issuer
MarketValue(` in
Lacs)
% toNet
AssetsRating
Money Market InstrumentsCertificate of DepositIndian Bank 2,441.34 2.73% Fitch A1+State Bank of Patiala 2,438.69 2.73% [ICRA]A1+Corporation Bank 2,392.50 2.68% CRISIL A1+Corporation Bank 2,390.28 2.68% CRISIL A1+UCO Bank 2,379.69 2.67% CRISIL A1+Bank of Baroda 1,436.17 1.61% [ICRA]A1+Union Bank of India 1,434.13 1.61% CRISIL A1+Punjab National Bank 957.67 1.07% Fitch A1+Indian Bank 879.09 0.98% Fitch A1+Canara Bank 587.03 0.66% CRISIL A1+Oriental Bank of Commerce 468.86 0.53% CRISIL A1+Axis Bank 231.98 0.26% CRISIL A1+Corporation Bank 207.03 0.23% CRISIL A1+ICICI Bank 189.87 0.21% [ICRA]A1+State Bank of Patiala 154.90 0.17% [ICRA]A1+State Bank of Patiala 127.23 0.14% [ICRA]A1+Oriental Bank of Commerce 127.21 0.14% CRISIL A1+ING Vysya Bank 98.67 0.11% CRISIL A1+ICICI Bank 98.65 0.11% [ICRA]A1+Yes Bank 98.65 0.11% [ICRA]A1+Yes Bank 94.00 0.11% [ICRA]A1+Yes Bank 23.84 0.03% CARE A1+Commercial PaperKotak Mahindra Investments 2,434.77 2.73% [ICRA]A1+Vodafone India 2,381.92 2.67% CRISIL A1+National Fertilizers 987.83 1.11% CRISIL A1+Corporate/PSU Debt
Corporate Bonds / DebenturesShriram Transport Finance Company 5,007.15 5.61% CARE AA+Export Import Bank of India 4,054.34 4.54% CRISIL AAAPower Finance Corporation 4,001.46 4.48% CRISIL AAARural Electrification Corporation 4,000.98 4.48% CRISIL AAAPower Finance Corporation 3,997.97 4.48% CRISIL AAAKotak Mahindra Prime 3,500.69 3.92% CRISIL AA+Rural Electrification Corporation 3,028.86 3.39% CRISIL AAALIC Housing Finance 2,551.45 2.86% CRISIL AAAKotak Mahindra Prime 2,514.14 2.82% CRISIL AA+HDFC 2,511.23 2.81% CRISIL AAAHDFC 2,504.44 2.81% CRISIL AAAHDFC 2,503.73 2.80% CRISIL AAAKotak Mahindra Prime 2,495.38 2.80% CRISIL AA+Power Finance Corporation 2,487.62 2.79% CRISIL AAATata Sons 2,006.88 2.25% CRISIL AAALIC Housing Finance 1,973.87 2.21% CRISIL AAALIC Housing Finance 1,504.95 1.69% CRISIL AAAPower Grid Corporation of India 1,495.39 1.68% CRISIL AAAPower Grid Corporation of India 1,472.82 1.65% CRISIL AAAPower Grid Corporation of India 1,005.81 1.13% CRISIL AAALIC Housing Finance 1,002.84 1.12% CRISIL AAAPower Grid Corporation of India 995.65 1.12% CRISIL AAAPower Finance Corporation 606.83 0.68% CRISIL AAANational Bk for Agriculture & Rural Dev. 360.97 0.40% CRISIL AAAPower Finance Corporation 300.13 0.34% CRISIL AAAShriram Transport Finance Company 192.64 0.22% CRISIL AALIC Housing Finance 140.15 0.16% CRISIL AAAExport Import Bank of India 120.17 0.13% CRISIL AAANABARD 100.89 0.11% CRISIL AAARural Electrification Corporation 100.67 0.11% CRISIL AAAGovernment Securities
8.27% GOVT OF INDIA RED- 09-06-2020 1,475.25 1.65% CRISIL AAA8.12% GOVT OF INDIA RED 10-12-2020 971.50 1.09% CRISIL AAA8.35% GOVT OF INDIA RED 14-05-2022 488.50 0.55% CRISIL AAATotal 96.96%
HSBC Income Fund - Short Term Plan (HIF-STP) August 2014
38
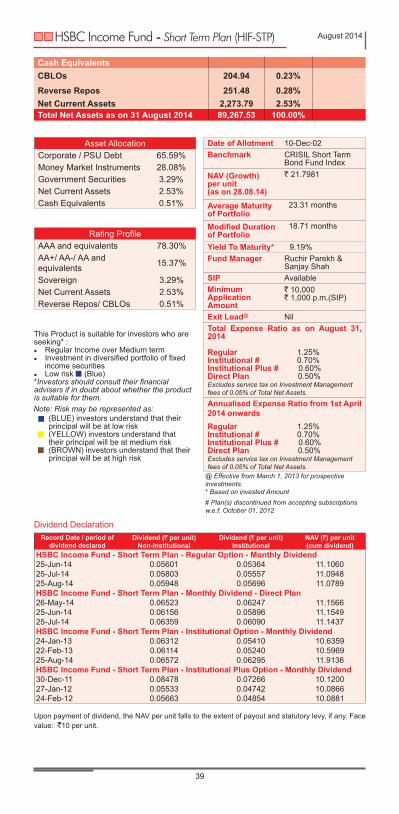
Date of Allotment 10-Dec-02Benchmark CRISIL Short Term
Bond Fund IndexNAV (Growth) per unit(as on 28.08.14)
` 21.7981
Average Maturity of Portfolio
23.31 months
Modified Durationof Portfolio
18.71 months
Yield To Maturity* 9.19%Fund Manager Ruchir Parekh &
Sanjay ShahSIP AvailableMinimumApplicationAmount
` 10,000` 1,000 p.m.(SIP)
Exit Load@ NilTotal Expense Ratio as on August 31, 2014 Regular 1.25%Institutional # 0.70%Institutional Plus # 0.60%Direct Plan 0.50%Excludes service tax on Investment Management fees of 0.05% of Total Net Assets.
Annualised Expense Ratio from 1st April 2014 onwards Regular 1.25%Institutional # 0.70%Institutional Plus # 0.60%Direct Plan 0.50%Excludes service tax on Investment Management fees of 0.05% of Total Net Assets.
@ Effective from March 1, 2013 for prospective investments.* Based on invested Amount# Plan(s) discontinued from accepting subscriptions w.e.f. October 01, 2012
Asset AllocationCorporate / PSU Debt 65.59%Money Market Instruments 28.08%Government Securities 3.29%Net Current Assets 2.53%Cash Equivalents 0.51%
Rating ProfileAAA and equivalents 78.30%AA+/ AA-/ AA and equivalents 15.37%
Sovereign 3.29%Net Current Assets 2.53%Reverse Repos/ CBLOs 0.51%
Dividend DeclarationRecord Date / period of
dividend declaredDividend (` per unit)
Non-InstitutionalDividend (` per unit)
InstitutionalNAV (`) per unit(cum dividend)
HSBC Income Fund - Short Term Plan - Regular Option - Monthly Dividend25-Jun-14 0.05601 0.05364 11.106025-Jul-14 0.05803 0.05557 11.094825-Aug-14 0.05948 0.05696 11.0789HSBC Income Fund - Short Term Plan - Monthly Dividend - Direct Plan26-May-14 0.06523 0.06247 11.156625-Jun-14 0.06156 0.05896 11.154925-Jul-14 0.06359 0.06090 11.1437HSBC Income Fund - Short Term Plan - Institutional Option - Monthly Dividend24-Jan-13 0.06312 0.05410 10.635922-Feb-13 0.06114 0.05240 10.596925-Aug-14 0.06572 0.06295 11.9136HSBC Income Fund - Short Term Plan - Institutional Plus Option - Monthly Dividend30-Dec-11 0.08478 0.07266 10.120027-Jan-12 0.05533 0.04742 10.086624-Feb-12 0.05663 0.04854 10.0881
HSBC Income Fund - Short Term Plan (HIF-STP) August 2014
39
Cash EquivalentsCBLOs 204.94 0.23%Reverse Repos 251.48 0.28%Net Current Assets 2,273.79 2.53%Total Net Assets as on 31 August 2014 89,267.53 100.00%
Upon payment of dividend, the NAV per unit falls to the extent of payout and statutory levy, if any. Face value: `10 per unit.
This Product is suitable for investors who are seeking* :l Regular Income over Medium terml Investment in diversified portfolio of fixed income securitiesl Low risk (Blue)*Investors should consult their financial advisers if in doubt about whether the product is suitable for them.Note: Risk may be represented as: (BLUE) investors understand that their principal will be at low risk (YELLOW) investors understand that their principal will be at medium risk (BROWN) investors understand that their principal will be at high risk

An Open Ended Income SchemeInvestment Objective: Seeks to generate a reasonable return with commensurate risk through investments in floating rate debt instruments and fixed rate debt instruments swapped for floating rate returns. The Scheme may also invest in fixed rate money market and debt instruments.
Issuer
MarketValue(` in
Lacs)
% toNet
AssetsRating
Money Market InstrumentsCertificate of DepositIndian Bank 976.77 10.51% Fitch A1+Bank of India 956.78 10.30% CRISIL A1+Canara Bank 489.19 5.27% CRISIL A1+Punjab National Bank 191.53 2.06% Fitch A1+Commercial PaperKotak Mahindra Investments 1,369.69 14.74% [ICRA]A1+India Infoline Finance 990.01 10.66% [ICRA]A1+National Fertilizers 987.83 10.63% CRISIL A1+Sundaram BNP Paribas Home Finance 976.81 10.52% CRISIL A1+Vodafone India 952.77 10.26% CRISIL A1+Fixed DepositFixed DepositAndhra Bank 1,100.00 11.84% Fixed DepositTotal 96.79%Cash EquivalentsCBLOs 184.26 1.98%Reverse Repos 226.11 2.43%Net Current Assets -112.11 -1.21%Total Net Assets as on 31 August 2014 9,289.65 100.00%
HSBC Floating Rate Fund - Long Term Plan (HFRF-LTP)
August 2014
40

Date of Allotment 16-Nov-04Benchmark CRISIL Liquid Fund
IndexNAV (Growth) per unit(as on 28.08.14)
` 20.7387
Average Maturity of Portfolio
3.11 months
Modified Durationof Portfolio
2.86 months
Yield To Maturity* 8.99%Fund Manager Sanjay Shah &
Ruchir ParekhSIP AvailableMinimumApplicationAmount
` 10,000` 1,000 p.m.(SIP)
Sub OptionsGrowth, Daily Dividend, Reinvestment Weekly Dividend, Reinvestment, Monthly Dividend (Payout & Reinvestment)Exit Load@ Nil
Total Expense Ratio as on August 31, 2014 Regular # 1.28% Institutional 0.73%Direct Plan 0.18% Excludes service tax on Investment Management fees of 0.02% of Total Net Assets. Annualised Expense Ratio from 1st April 2014 onwards Regular # 1.29% Institutional 0.74%Direct Plan 0.19% Excludes service tax on Investment Management fees of 0.01% of Total Net Assets. @ Effective from March 1, 2013 for prospective investments.* Based on invested Amount# Plan(s) discontinued from accepting subscriptions w.e.f. October 01, 2012
Asset AllocationMoney Market Instruments 84.95%Fixed Deposit 11.84%Cash Equivalents 4.42%Net Current Assets -1.21%
Dividend DeclarationRecord Date / period of
dividend declaredDividend (` per unit)
Non-InstitutionalDividend (` per unit)
InstitutionalNAV (`) per unit(cum dividend)
HSBC Floating Rate Fund - Long Term Plan - Regular Option - Monthly Dividend25-Jun-14 0.05028 0.04815 10.064525-Jul-14 0.04621 0.04426 10.059425-Aug-14 0.04981 0.04770 10.0640HSBC Floating Rate Fund - Long Term Plan - Monthly Dividend - Direct Plan25-Jul-14 0.05363 0.05136 10.069525-Aug-14 0.05706 0.05464 10.0739HSBC Floating Rate Fund - Long Term Plan - Institutional Option - Monthly Dividend28-Mar-14 0.17909 0.17152 10.699625-Apr-14 0.05133 0.04916 10.535625-Aug-14 0.06294 0.06028 10.7639
Rating ProfileAAA and equivalents 84.95%Fixed Deposit 11.84%Reverse Repos/ CBLOs 4.42%Net Current Assets -1.21%
HSBC Floating Rate Fund - Long Term Plan (HFRF-LTP)
August 2014
41
Upon payment of dividend, the NAV per unit falls to the extent of payout and statutory levy, if any. Face value: `10 per unit.
This Product is suitable for investors who are seeking* :l Liquidity over short terml Investment in floating rate and fixed rate Debt and Money Market Instrumentsl Low risk (Blue)*Investors should consult their financial advisers if in doubt about whether the product is suitable for them.
Note: Risk may be represented as: (BLUE) investors understand that their principal will be at low risk (YELLOW) investors understand that their principal will be at medium risk (BROWN) investors understand that their principal will be at high risk

An Open Ended Liquid SchemeInvestment Objective: Aims to provide reasonable returns, commensurate with low risk while providing a high level of liquidity, through a portfolio of money market and debt securities.
IssuerMarketValue
(` in Lacs)
% toNet
AssetsRating
Money Market InstrumentsCertificate of DepositOriental Bank of Commerce 10,000.00 3.61% CRISIL A1+Punjab & Sind Bank 9,997.74 3.61% [ICRA]A1+Allahabad Bank 9,867.77 3.56% [ICRA]A1+Indian Bank 7,495.02 2.71% Fitch A1+Canara Bank 4,995.57 1.80% CRISIL A1+Oriental Bank of Commerce 4,995.38 1.80% CRISIL A1+Union Bank of India 4,989.92 1.80% CRISIL A1+Oriental Bank of Commerce 4,984.33 1.80% CRISIL A1+Andhra Bank 4,964.66 1.79% CARE A1+Canara Bank 4,957.70 1.79% CRISIL A1+Indian Overseas Bank 4,945.44 1.79% [ICRA]A1+Punjab & Sind Bank 4,945.42 1.79% [ICRA]A1+Allahabad Bank 4,940.68 1.78% [ICRA]A1+UCO Bank 4,940.49 1.78% CRISIL A1+Bank of India 2,498.89 0.90% CRISIL A1+Bank of Baroda 2,498.88 0.90% [ICRA]A1+IDBI Bank 2,498.32 0.90% CRISIL A1+IndusInd Bank 2,495.37 0.90% CRISIL A1+IDBI Bank 495.48 0.18% CRISIL A1+Commercial PaperSREI Equipment Finance 13,304.25 4.80% [ICRA]A1+India Infoline Finance 10,890.15 3.93% [ICRA]A1+Edelweiss Financial Services 9,973.57 3.60% CRISIL A1+National Fertilizers 8,890.50 3.21% CRISIL A1+Magma Fincorp 7,390.06 2.67% CARE A1+Edelweiss Financial Services 6,465.25 2.33% CRISIL A1+Indiabulls Housing Finance 5,000.00 1.81% CRISIL A1+L&T Finance 4,986.93 1.80% CARE A1+Redington (India) 4,978.89 1.80% [ICRA]A1+Adani Ports & Special Economic Zone 4,973.59 1.80% [ICRA]A1+Redington (India) 4,970.43 1.79% [ICRA]A1+Indiabulls Housing Finance 4,476.82 1.62% CRISIL A1+L&T Finance 4,473.98 1.62% CARE A1+India Infoline Finance 3,985.50 1.44% [ICRA]A1+Indiabulls Housing Finance 3,982.79 1.44% CRISIL A1+Indiabulls Housing Finance 2,497.68 0.90% CRISIL A1+Godrej Properties 2,497.63 0.90% [ICRA]A1+Aditya Birla Finance 2,494.80 0.90% [ICRA]A1+Indiabulls Housing Finance 2,487.44 0.90% CRISIL A1+Redington (India) 2,487.15 0.90% [ICRA]A1+Redington (India) 2,477.58 0.89% [ICRA]A1+Aditya Birla Finance 2,468.87 0.89% [ICRA]A1+NABARD 500.00 0.18% CRISIL A1+Fixed DepositFixed DepositSyndicate Bank 19,500.00 7.04% Fixed DepositAllahabad Bank 10,000.00 3.61% Fixed DepositAndhra Bank 10,000.00 3.61% Fixed DepositAndhra Bank 7,500.00 2.71% Fixed DepositTreasury Bill91 DAYS TREASURY BILL RED 04-09-2014 11,492.26 4.15% Sovereign
91 DAYS TREASURY BILL RED 25-09-2014 1,491.72 0.54% Sovereign
91 DAYS TREASURY BILL RED 18-09-2014 996.09 0.36% Sovereign
Total 99.33 %
HSBC Cash Fund (HCF) August 2014
42

Date of Allotment 04-Dec-02Benchmark CRISIL Liquid Fund
IndexNAV (Growth) per unit(as on 28.08.14)
` 1326.4649
Average Maturity of Portfolio
0.74 months
Modified Durationof Portfolio
0.69 months
Yield To Maturity* 8.61%Fund Manager Ruchir Parekh &
Kapil PunjabiSIP AvailableMinimumApplicationAmount
` 10,000` 1,000 p.m.(SIP)
Sub OptionsGrowth, Daily Dividend, Reinvestment Weekly Dividend, Reinvestment, Monthly Dividend (Payout & Reinvestment) Exit Load@ Nil
Total Expense Ratio as on August 31, 2014 Regular # 1.00% Institutional # 0.35%Institutional Plus 0.12%Direct Plan 0.04%Currently there is no Service Tax levied due to nil Investment Management Fees being charged.Annualised Expense Ratio from 1st April 2014 onwards Regular # 1.00% Institutional # 0.35%Institutional Plus 0.11%Direct Plan 0.05%Currently there is no Service Tax levied due to nil Investment Management Fees being charged.@ Effective from March 1, 2013 for prospective investments.* Based on invested Amount# Plan(s) discontinued from accepting subscriptions w.e.f. October 01, 2012
Dividend DeclarationRecord Date / period of
dividend declaredDividend (` per unit)
Non-InstitutionalDividend (` per unit)
InstitutionalNAV (`) per unit(cum dividend)
HSBC Cash Fund - Institutional Option - Monthly Dividend25-Jun-14 5.55741 5.32244 1007.188025-Jul-14 5.48427 5.25240 1007.094225-Aug-14 5.59544 5.35887 1007.2368HSBC Cash Fund - Monthly Dividend - Direct Plan25-Jun-14 5.57474 5.33904 1007.154825-Jul-14 5.52088 5.28746 1007.085725-Aug-14 5.65111 5.41218 1007.2528HSBC Cash Fund - Institutional Plus Option - Monthly Dividend26-Aug-11 0.04886 0.04686 10.138329-Sep-11 0.05876 0.05636 10.150928-Oct-11 0.05244 0.05030 10.1428
Asset AllocationMoney Market Instruments 77.31%Fixed Deposit 16.97%Treasury Bill 5.05%Cash Equivalents 3.96%Net Current Assets -3.29%
Rating ProfileAAA and equivalents 77.31%Fixed Deposit 16.97%Sovereign 5.05%Reverse Repos/ CBLOs 3.96%Net Current Assets -3.29%
HSBC Cash Fund (HCF) August 2014
43
Upon payment of dividend, the NAV per unit falls to the extent of payout and statutory levy, if any. Face value: `1,000 per unit.
This Product is suitable for investors who are seeking* :l Overnight Liquidity over short terml Invests in Money Market Instrumentsl Low risk (Blue)*Investors should consult their financial advisers if in doubt about whether the product is suitable for them.
Note: Risk may be represented as: (BLUE) investors understand that their principal will be at low risk (YELLOW) investors understand that their principal will be at medium risk (BROWN) investors understand that their principal will be at high risk
HSBC Cash Fund
01 Aug 2014 to 03 Aug 2014***
04 Aug 2014 to 11 Aug 2014***
12 Aug 2014 to 31Aug 2014***
Average for the Month
Normal (erst-while insti-plus)
0.15 0.15 0.12 0.13
Direct 0.03 0.10 0.04 0.05
*** Service tax on AMC fees is charged in addition to the above stated TERs.
IssuerMarketValue
(` in Lacs)
% toNet
AssetsRating
Cash EquivalentsCBLOs 4,920.36 1.78%Reverse Repos 6,037.93 2.18%Net Current Assets -9,124.96 -3.29%
Total Net Assets as on 31 August 2014 2,76,974.30 100.00%

Date of Allotment 05-Dec-03Benchmark I-Sec Composite
IndexNAV (Growth) per unit(as on 28.08.14)
` 16.1683
Average Maturity of Portfolio
131.63 months
Modified Durationof Portfolio
72.49 months
Yield To Maturity* 8.65%Fund Manager Sanjay ShahSIP AvailableMinimum ` 10,000Application ` 1,000 p.m.(SIP)AmountExit Load@ Nil
Total Expense Ratio as on August 31, 2014 Regular 1.00% Direct Plan 0.50% Excludes service tax on Investment Management fees of 0.06% of Total Net Assets. Annualised Expense Ratio from 1st April 2014 onwards Regular 1.00% Direct Plan 0.50% Excludes service tax on Investment Management fees of 0.06% of Total Net Assets. @ Effective from March 1, 2013 for prospective investments.* Based on invested Amount
An Open Ended Gilt SchemeInvestment Objective: Aims to generate reasonable returns through investments in Government Securities of various maturities. The AMC’s view of interest rate trends and the nature of the plans will be reflected in the maturities of securities in which the Plans are invested.
Issuer
MarketValue(` in
Lacs)
% toNet
AssetsRating
Government Securities8.40% GOVT OF INDIA RED 28-07-2024 54.42 20.25% Sovereign8.60% GOVT OF INDIA RED 02-06-2028 39.62 14.74% Sovereign8.35% GOVT OF INDIA RED 14-05-2022 29.31 10.91% Sovereign9.20% GOVT OF INDIA RED 30-09-2030 25.92 9.65% Sovereign8.30% GOVT OF INDIA RED 31-12-2042 23.79 8.85% Sovereign9.14% KARNATAKA SDL RED 28-05-2024 20.20 7.52% Sovereign8.83% GOVT OF INDIA RED 25-11-2023 20.14 7.49% Sovereign8.12% GOVT OF INDIA RED 10-12-2020 19.43 7.23% SovereignTotal 86.64%Cash EquivalentsCBLOs 13.90 5.17%Reverse Repos 17.06 6.35%Net Current Assets 4.95 1.84%Total Net Assets as on 31 August 2014 268.73 100.00%
Dividend DeclarationRecord Date / period of
dividend declaredDividend (` per unit)
Non-InstitutionalDividend (` per unit)
InstitutionalNAV (`) per unit(cum dividend)
HSBC Gilt Fund - Monthly Dividend31-Oct-08 0.06136 0.05711 10.807728-Nov-08 0.04193 0.03903 10.785526-Dec-08 0.03400 0.03164 10.7764
Asset AllocationGovernment Securities 86.64%Cash Equivalents 11.52%Net Current Assets 1.84%
Rating ProfileSovereign 86.64%Reverse Repos/ CBLOs 11.52%Net Current Assets 1.84%
HSBC Gilt Fund (HGF) August 2014
44
Upon payment of dividend, the NAV per unit falls to the extent of payout and statutory levy, if any. Face value: `10 per unit.
This Product is suitable for investors who are seeking* :l Regular Income over long terml Investment in Government Securitiesl Low risk (Blue)*Investors should consult their financial advisers if in doubt about whether the product is suitable for them.
Note: Risk may be represented as: (BLUE) investors understand that their principal will be at low risk (YELLOW) investors understand that their principal will be at medium risk (BROWN) investors understand that their principal will be at high risk

An Open Ended Debt SchemeInvestment Objective: Seeks to provide liquidity and reasonable returns by investing primarily in a mix of short term debt and money market instruments.
Issuer
MarketValue(` in
Lacs)
% toNet
AssetsRating
Money Market InstrumentsCertificate of DepositPunjab National Bank 3,256.07 14.19% Fitch A1+Bank of India 1,435.17 6.26% CRISIL A1+Canara Bank 1,369.74 5.97% CRISIL A1+Bank of Baroda 957.45 4.17% [ICRA]A1+Union Bank of India 956.09 4.17% CRISIL A1+Indian Bank 586.06 2.55% Fitch A1+Commercial PaperNational Fertilizers 1,481.75 6.46% CRISIL A1+Sundaram BNP Paribas Home Finance 1,465.22 6.39% CRISIL A1+Vodafone India 1,429.15 6.23% CRISIL A1+Kotak Mahindra Investments 1,076.18 4.69% [ICRA]A1+Edelweiss Financial Services 994.65 4.34% CRISIL A1+Kotak Mahindra Investments 681.74 2.97% [ICRA]A1+India Infoline Finance 495.01 2.16% [ICRA]A1+Corporate/ PSU DebtCorporate Bonds / DebenturesLIC Housing Finance 1,020.58 4.45% CRISIL AAAKotak Mahindra Prime 1,000.20 4.36% CRISIL AA+Kotak Mahindra Prime 502.83 2.19% CRISIL AA+Tata Sons 501.72 2.19% CRISIL AAAHDFC 501.04 2.18% CRISIL AAAShriram Transport Finance Company 60.77 0.26% CARE AA+Fixed DepositFixed DepositAndhra Bank 2,000.00 8.72% Fixed DepositTotal 94.90%Cash EquivalentsCBLOs 463.20 2.02%Reverse Repos 568.41 2.48%Net Current Assets 135.64 0.60%Total Net Assets as on 31 August 2014 22,938.64 100.00%
HSBC Ultra Short Term Bond Fund (HUSBF) August 2014
45
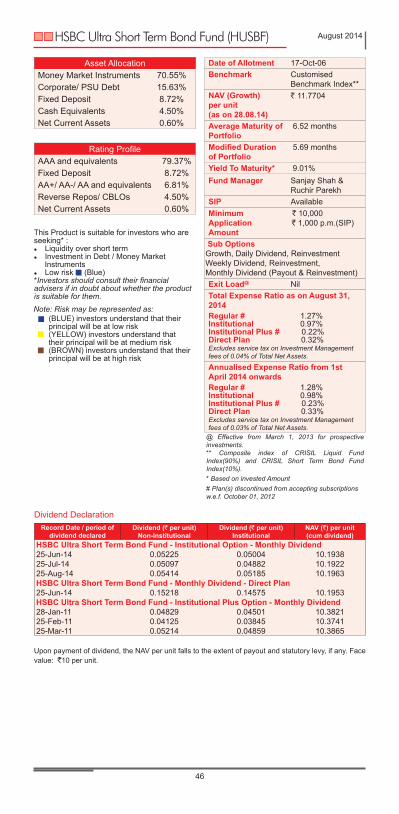
Date of Allotment 17-Oct-06Benchmark Customised
Benchmark Index**NAV (Growth) per unit(as on 28.08.14)
` 11.7704
Average Maturity of Portfolio
6.52 months
Modified Durationof Portfolio
5.69 months
Yield To Maturity* 9.01%Fund Manager Sanjay Shah &
Ruchir ParekhSIP AvailableMinimum ` 10,000Application ` 1,000 p.m.(SIP)Amount
Sub OptionsGrowth, Daily Dividend, Reinvestment Weekly Dividend, Reinvestment, Monthly Dividend (Payout & Reinvestment)Exit Load@ NilTotal Expense Ratio as on August 31, 2014 Regular # 1.27% Institutional 0.97%Institutional Plus # 0.22%Direct Plan 0.32%Excludes service tax on Investment Management fees of 0.04% of Total Net Assets.
Annualised Expense Ratio from 1st April 2014 onwards Regular # 1.28% Institutional 0.98%Institutional Plus # 0.23%Direct Plan 0.33%Excludes service tax on Investment Management fees of 0.03% of Total Net Assets.
@ Effective from March 1, 2013 for prospective investments.** Composite index of CRISIL Liquid Fund Index(90%) and CRISIL Short Term Bond Fund Index(10%).* Based on invested Amount# Plan(s) discontinued from accepting subscriptions w.e.f. October 01, 2012
Asset AllocationMoney Market Instruments 70.55%Corporate/ PSU Debt 15.63%Fixed Deposit 8.72%Cash Equivalents 4.50%Net Current Assets 0.60%
Rating ProfileAAA and equivalents 79.37%Fixed Deposit 8.72%AA+/ AA-/ AA and equivalents 6.81%Reverse Repos/ CBLOs 4.50%Net Current Assets 0.60%
Dividend DeclarationRecord Date / period of
dividend declaredDividend (` per unit)
Non-InstitutionalDividend (` per unit)
InstitutionalNAV (`) per unit(cum dividend)
HSBC Ultra Short Term Bond Fund - Institutional Option - Monthly Dividend25-Jun-14 0.05225 0.05004 10.193825-Jul-14 0.05097 0.04882 10.192225-Aug-14 0.05414 0.05185 10.1963HSBC Ultra Short Term Bond Fund - Monthly Dividend - Direct Plan25-Jun-14 0.15218 0.14575 10.1953HSBC Ultra Short Term Bond Fund - Institutional Plus Option - Monthly Dividend28-Jan-11 0.04829 0.04501 10.382125-Feb-11 0.04125 0.03845 10.374125-Mar-11 0.05214 0.04859 10.3865
HSBC Ultra Short Term Bond Fund (HUSBF) August 2014
46
Upon payment of dividend, the NAV per unit falls to the extent of payout and statutory levy, if any. Face value: `10 per unit.
This Product is suitable for investors who are seeking* :l Liquidity over short terml Investment in Debt / Money Market Instrumentsl Low risk (Blue)*Investors should consult their financial advisers if in doubt about whether the product is suitable for them.Note: Risk may be represented as: (BLUE) investors understand that their principal will be at low risk (YELLOW) investors understand that their principal will be at medium risk (BROWN) investors understand that their principal will be at high risk

An Open Ended Debt SchemeInvestment Objective: Seeks to deliver returns in the form of interest income and capital gains, along with high liquidity, commensurate with the current view on the markets and the interest rate cycle, through active invest-ment in debt and money market instruments.
IssuerMarketValue
(` in Lacs)
% toNet
AssetsRating
Money Market InstrumentsCertificate of DepositPunjab National Bank 1,337.93 2.94% [ICRA]A1+
Canara Bank 955.37 2.10% CRISIL A1+
Commercial PaperAditya Birla Finance 1,500.00 3.30% [ICRA]A1+
Corporate/PSU DebtCorporate Bonds / DebenturesHDFC 2,188.28 4.81% CRISIL AAA
Rural Electrification Corporation 1,472.22 3.23% CARE AAA
Power Finance Corporation 1,165.44 2.56% CRISIL AAA
Government Securities9.20% GOVT OF INDIA RED 30-09-2030 7,703.42 16.93% Sovereign
8.40% GOVT OF INDIA RED 28-07-2024 7,123.68 15.65% Sovereign
8.60% GOVT OF INDIA RED 02-06-2028 4,872.65 10.71% Sovereign
8.35% GOVT OF INDIA RED 14-05-2022 4,430.70 9.74% Sovereign
8.30% GOVT OF INDIA RED 31-12-2042 3,277.92 7.20% Sovereign
8.12% GOVT OF INDIA RED 10-12-2020 2,759.06 6.06% Sovereign
8.83% GOVT OF INDIA RED 25-11-2023 2,512.22 5.52% Sovereign
9.14% KARNATAKA SDL RED 28-05-2024 2,090.82 4.59% Sovereign
8.27% GOVT OF INDIA RED- 09-06-2020 1,524.43 3.35% Sovereign
Total 98.69%Cash EquivalentsCBLOs 323.79 0.71%Reverse Repos 397.34 0.87%Net Current Assets -124.00 -0.27%Total Net Assets as on 31 August 2014 45,511.26 100.00%
HSBC Flexi Debt Fund (HFDF) August 2014
47
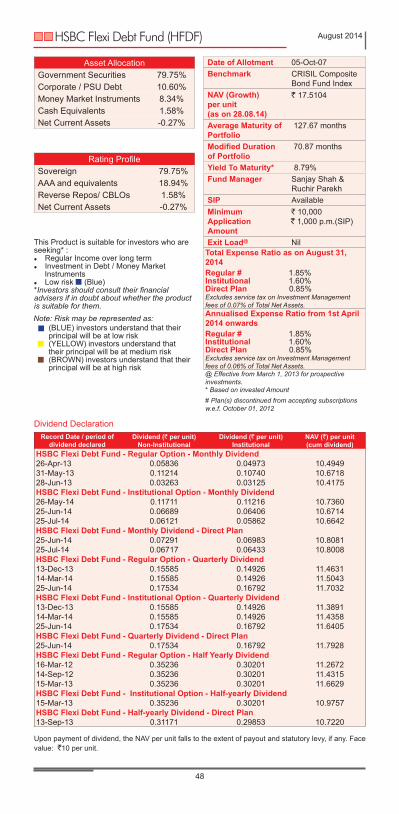
Date of Allotment 05-Oct-07Benchmark CRISIL Composite
Bond Fund IndexNAV (Growth) per unit(as on 28.08.14)
` 17.5104
Average Maturity of Portfolio
127.67 months
Modified Durationof Portfolio
70.87 months
Yield To Maturity* 8.79%Fund Manager Sanjay Shah &
Ruchir ParekhSIP AvailableMinimum ` 10,000Application ` 1,000 p.m.(SIP)AmountExit Load@ Nil
Total Expense Ratio as on August 31, 2014 Regular # 1.85%Institutional 1.60% Direct Plan 0.85%Excludes service tax on Investment Management fees of 0.07% of Total Net Assets.Annualised Expense Ratio from 1st April 2014 onwards Regular # 1.85%Institutional 1.60% Direct Plan 0.85%Excludes service tax on Investment Management fees of 0.06% of Total Net Assets.@ Effective from March 1, 2013 for prospective investments.* Based on invested Amount# Plan(s) discontinued from accepting subscriptions w.e.f. October 01, 2012
Dividend DeclarationRecord Date / period of
dividend declaredDividend (` per unit)
Non-InstitutionalDividend (` per unit)
InstitutionalNAV (`) per unit(cum dividend)
HSBC Flexi Debt Fund - Regular Option - Monthly Dividend26-Apr-13 0.05836 0.04973 10.494931-May-13 0.11214 0.10740 10.671828-Jun-13 0.03263 0.03125 10.4175HSBC Flexi Debt Fund - Institutional Option - Monthly Dividend26-May-14 0.11711 0.11216 10.736025-Jun-14 0.06689 0.06406 10.671425-Jul-14 0.06121 0.05862 10.6642HSBC Flexi Debt Fund - Monthly Dividend - Direct Plan25-Jun-14 0.07291 0.06983 10.808125-Jul-14 0.06717 0.06433 10.8008HSBC Flexi Debt Fund - Regular Option - Quarterly Dividend13-Dec-13 0.15585 0.14926 11.463114-Mar-14 0.15585 0.14926 11.504325-Jun-14 0.17534 0.16792 11.7032HSBC Flexi Debt Fund - Institutional Option - Quarterly Dividend13-Dec-13 0.15585 0.14926 11.389114-Mar-14 0.15585 0.14926 11.435825-Jun-14 0.17534 0.16792 11.6405HSBC Flexi Debt Fund - Quarterly Dividend - Direct Plan25-Jun-14 0.17534 0.16792 11.7928HSBC Flexi Debt Fund - Regular Option - Half Yearly Dividend16-Mar-12 0.35236 0.30201 11.267214-Sep-12 0.35236 0.30201 11.431515-Mar-13 0.35236 0.30201 11.6629HSBC Flexi Debt Fund - Institutional Option - Half-yearly Dividend15-Mar-13 0.35236 0.30201 10.9757HSBC Flexi Debt Fund - Half-yearly Dividend - Direct Plan13-Sep-13 0.31171 0.29853 10.7220
Asset AllocationGovernment Securities 79.75%Corporate / PSU Debt 10.60%Money Market Instruments 8.34%Cash Equivalents 1.58%Net Current Assets -0.27%
Rating ProfileSovereign 79.75%AAA and equivalents 18.94%Reverse Repos/ CBLOs 1.58%Net Current Assets -0.27%
HSBC Flexi Debt Fund (HFDF) August 2014
48
Upon payment of dividend, the NAV per unit falls to the extent of payout and statutory levy, if any. Face value: `10 per unit.
This Product is suitable for investors who are seeking* :l Regular Income over long terml Investment in Debt / Money Market Instrumentsl Low risk (Blue)*Investors should consult their financial advisers if in doubt about whether the product is suitable for them.Note: Risk may be represented as: (BLUE) investors understand that their principal will be at low risk (YELLOW) investors understand that their principal will be at medium risk (BROWN) investors understand that their principal will be at high risk

Name of Scheme Fund Manager
HSBC MIP - Savings & Regular Plan
For Debt portion: Sanjay Shah (from 14 August 2009) & Ruchir Parekh (from 25 January 2011) & For Equity portion: Aditya Khemani (from 24 February 2009)
HSBC Income Fund - Investment Plan
Ruchir Parekh (from 25 January 2011) &Sanjay Shah (from 09 January 2009)
HSBC Income Fund - Short Term Plan
Ruchir Parekh (from 25 January 2011) &Sanjay Shah (from 09 January 2009)
HSBC Floating Rate Fund Long Term Plan
Sanjay Shah (from 09 January 2009) & Ruchir Parekh (from 22 September 2012)
HSBC Cash Fund Ruchir Parekh (from 25 January 2011) &Kapil Punjabi (from 14 March 2014)
HSBC Gilt Fund Sanjay Shah (from 09 January 2009)
HSBC Ultra Short Term Bond Fund
Sanjay Shah (from 22 September 2012) & Ruchir Parekh (from 22 September 2012)
HSBC Flexi Debt Fund Sanjay Shah (from 09 January 2009) &Ruchir Parekh (from 25 January 2011)
Fund Managers - MIP & Debt August 2014
49
Fund Manager’s Experience
Sanjay Shah Senior Vice President Head - Fixed IncomeB. Com, A.C.A., Post Graduate Diploma in ManagementExperience:Over 14 years of experience in research and risk l HSBC Asset Management (India) Private Ltd Senior Vice President & Fund Manager, Fixed Income since October 2011 to present, Vice President & Fund Manager, Fixed Income since December 2008 to September 2011. l FIL Fund Management Private Ltd Credit Analyst from September 2008 to December 2008 l Lehman Brothers Structured Financial Services Private Ltd Vice President, Convertible Products from September 2006 to Sep tember 2008 l Rabo India Finance Private Ltd Senior Manager – Credit Risk from July 2004 to September 2006 l ICICI Bank Ltd Manager, Credit Risk from January 2003 to June 2004 l SBI Funds Management Private Ltd Chief Manager, Debt Funds from June 1999 to January 2003

Fund Managers - MIP & Debt August 2014
50
Kapil Punjabi Vice President & Fund Manager - Fixed Income B.M.S, M.M.S (Mumbai University) Experience:Over 7 years of experience in research and Fund Management l HSBC Asset Management (India) Private Ltd. Vice President & Fund Manager - Fixed Income from March 04, 2014 onwards. l Taurus Asset Management Company Limited Fund Manager Fixed Income from June 07, 2012 to February 27, 2014. l Edelweiss Asset Management Limited Fund Manager Fixed Income from December 05, 2009 to June 06, 2012. l Edelweiss Securities Limited Manager - Investments from October 2007 to November 2009 l Trans Market Group Research (India) Private Limited Research Analyst and Proprietary Trader from May 2006 to October 2007.
Ruchir ParekhSenior Vice President and Fund Manager - Fixed IncomeMBA, B.ComExperience:Over 16 years of experience in research and fixed income management l HSBC Asset Management (India) Private Ltd Senior Vice President & Fund Manager, Fixed Income since September 2011 to present, Vice President & Fund Manager, Fixed Income since January 2011 to September 2011. l AIG Global Asset Management (India) Private Ltd Fund Manager, Fixed Income from April 2007 - January 2011 l HDFC Asset Management Company Ltd Sr. Manager, Fixed Income Analyst from February 2003 - April 2007 l Bear Stearns & Co., New York, NY Fixed Income Analyst from October 2000 - March 2002 l Moodys Investors Service, New York, NY Senior Associate from June 1997 - October 2000
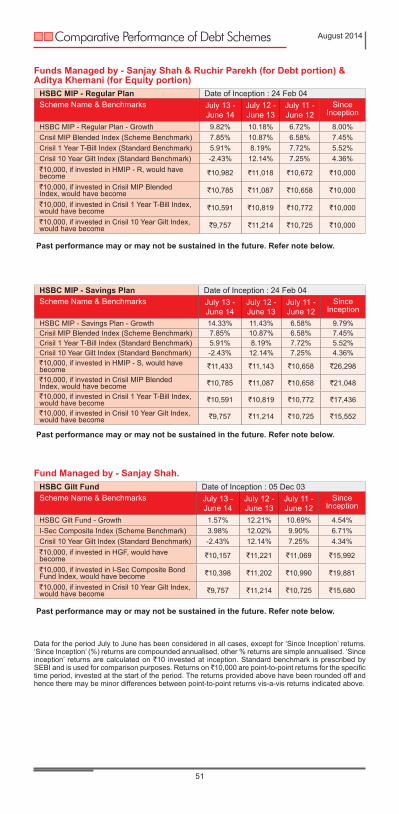
Comparative Performance of Debt Schemes August 2014
51
Data for the period July to June has been considered in all cases, except for ‘Since Inception’ returns. ‘Since Inception’ (%) returns are compounded annualised, other % returns are simple annualised. ‘Since inception’ returns are calculated on `10 invested at inception. Standard benchmark is prescribed by SEBI and is used for comparison purposes. Returns on ̀ 10,000 are point-to-point returns for the specific time period, invested at the start of the period. The returns provided above have been rounded off and hence there may be minor differences between point-to-point returns vis-a-vis returns indicated above.
HSBC MIP - Regular Plan Date of Inception : 24 Feb 04Scheme Name & Benchmarks July 13 -
June 14July 12 - June 13
July 11 - June 12
Since Inception
HSBC MIP - Regular Plan - Growth 9.82% 10.18% 6.72% 8.00%Crisil MIP Blended Index (Scheme Benchmark) 7.85% 10.87% 6.58% 7.45%Crisil 1 Year T-Bill Index (Standard Benchmark) 5.91% 8.19% 7.72% 5.52%Crisil 10 Year Gilt Index (Standard Benchmark) -2.43% 12.14% 7.25% 4.36%`10,000, if invested in HMIP - R, would have become `10,982 `11,018 `10,672 `10,000
`10,000, if invested in Crisil MIP Blended Index, would have become `10,785 `11,087 `10,658 `10,000
`10,000, if invested in Crisil 1 Year T-Bill Index, would have become `10,591 `10,819 `10,772 `10,000
`10,000, if invested in Crisil 10 Year Gilt Index, would have become `9,757 `11,214 `10,725 `10,000
HSBC MIP - Savings Plan Date of Inception : 24 Feb 04Scheme Name & Benchmarks July 13 -
June 14July 12 - June 13
July 11 - June 12
Since Inception
HSBC MIP - Savings Plan - Growth 14.33% 11.43% 6.58% 9.79%Crisil MIP Blended Index (Scheme Benchmark) 7.85% 10.87% 6.58% 7.45%Crisil 1 Year T-Bill Index (Standard Benchmark) 5.91% 8.19% 7.72% 5.52%Crisil 10 Year Gilt Index (Standard Benchmark) -2.43% 12.14% 7.25% 4.36%`10,000, if invested in HMIP - S, would have become `11,433 `11,143 `10,658 `26,298
`10,000, if invested in Crisil MIP Blended Index, would have become `10,785 `11,087 `10,658 `21,048
`10,000, if invested in Crisil 1 Year T-Bill Index, would have become `10,591 `10,819 `10,772 `17,436
`10,000, if invested in Crisil 10 Year Gilt Index, would have become `9,757 `11,214 `10,725 `15,552
Funds Managed by - Sanjay Shah & Ruchir Parekh (for Debt portion) &Aditya Khemani (for Equity portion)
Past performance may or may not be sustained in the future. Refer note below.
Past performance may or may not be sustained in the future. Refer note below.
HSBC Gilt Fund Date of Inception : 05 Dec 03Scheme Name & Benchmarks July 13 -
June 14July 12 - June 13
July 11 - June 12
Since Inception
HSBC Gilt Fund - Growth 1.57% 12.21% 10.69% 4.54%I-Sec Composite Index (Scheme Benchmark) 3.98% 12.02% 9.90% 6.71%Crisil 10 Year Gilt Index (Standard Benchmark) -2.43% 12.14% 7.25% 4.34%`10,000, if invested in HGF, would have become `10,157 `11,221 `11,069 `15,992
`10,000, if invested in I-Sec Composite Bond Fund Index, would have become `10,398 `11,202 `10,990 `19,881
`10,000, if invested in Crisil 10 Year Gilt Index, would have become `9,757 `11,214 `10,725 `15,680
Fund Managed by - Sanjay Shah.
Past performance may or may not be sustained in the future. Refer note below.

Comparative Performance of Debt Schemes August 2014
52
Data for the period July to June has been considered in all cases, except for ‘Since Inception’ returns. ‘Since Inception’ (%) returns are compounded annualised, other % returns are simple annualised. ‘Since inception’ returns are calculated on `10 invested at inception. Standard benchmark is prescribed by SEBI and is used for comparison purposes. Returns on ̀ 10,000 are point-to-point returns for the specific time period, invested at the start of the period. The returns provided above have been rounded off and hence there may be minor differences between point-to-point returns vis-a-vis returns indicated above.
47
HSBC FRF - LTP - Regular Plan Date of Inception : 16 Nov 04Scheme Name & Benchmarks July 13 -
June 14July 12 - June 13
July 11 - June 12
Since Inception
HSBC FRF - LTP - Growth 9.39% 8.68% 9.00% 7.71%Crisil Liquid Fund Index (Scheme Benchmark) 9.64% 8.14% 8.67% 7.02%Crisil 1 Year T-Bill Index (Standard Benchmark) 5.91% 8.19% 7.72% 5.74%
`10,000, if invested HFRF - LTP, would have become `10,939 `10,868 `10,900 `20,447
`10,000, if invested in Crisil Liquid Fund Index, would have become `10,964 `10,814 `10,867 `19,214
`10,000, if invested in Crisil 1 Year T-Bill Index, would have become `10,591 `10,819 `10,772 `17,115
Funds Managed by - Sanjay Shah & Ruchir Parekh.
Past performance may or may not be sustained in the future. Refer note below.
HSBC Ultra Short Term Bond Fund$ Date of Inception : 17 Oct 06Scheme Name & Benchmarks July 13 - June 14 Since InceptionHSBC Ultra Short Term Bond Fund - Growth 9.32% 9.00%Customised Benchmark Index (Scheme Benchmark)* 9.55% 8.18%
Crisil 1 Year T-Bill Index (Standard Benchmark) 5.91% 9.00%
`10,000, if invested in HUSTBF, would have become `10,932 `11,626
`10,000, if invested in Customised Benchmark Index, would have become `10,955 `11,473
`10,000, if invested in Crisil 1 Year T-Bill Index, would have become `10,591 `11,626
Past performance may or may not be sustained in the future. Refer note below.
HSBC Flexi Debt Fund Date of Inception: 05 Oct 07Scheme Name & Benchmarks July 13 -
June 14July 12 - June 13
July 11 - June 12
Since Inception
HSBC Flexi Debt Fund - Growth 3.88% 11.44% 9.91% 8.55%Crisil Composite Bond Fund Index (Scheme Benchmark) 4.51% 10.73% 8.67% 6.88%
Crisil 10 Year Gilt Index (Standard Benchmark) -2.43% 12.14% 7.25% 5.67%`10,000, if invested in HFDF, would have become `10,388 `11,144 `10,991 `17,392
`10,000, if invested in Crisil Composite Bond Fund Index, would have become `10,451 `11,073 `10,867 `15,658
`10,000, if invested in Crisil 10 Year Gilt Index, would have become `9,757 `11,214 `10,725 `14,503
Past performance may or may not be sustained in the future. Refer note below.
*Composite index of Crisil Liquid Fund Index(90%) and Crisil Short Term Bond Fund Index(10%).
$Pursuant to SEBI circular dated Sept 13, 2012, certain Plans/options within the schemes have been discontinued to comply with a single plan structure. Since there was no continuous NAV history available for the surviving Plan prior to 1 October 2012, returns since the said date have been considered for calculating performance. The inception date of HSBC Ultra Short Term Bond Fund however is 17 October 2006.
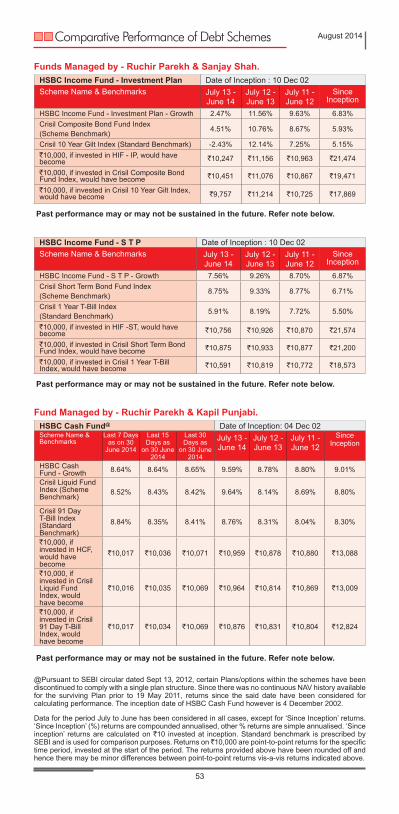
Comparative Performance of Debt Schemes August 2014
53
Data for the period July to June has been considered in all cases, except for ‘Since Inception’ returns. ‘Since Inception’ (%) returns are compounded annualised, other % returns are simple annualised. ‘Since inception’ returns are calculated on `10 invested at inception. Standard benchmark is prescribed by SEBI and is used for comparison purposes. Returns on ̀ 10,000 are point-to-point returns for the specific time period, invested at the start of the period. The returns provided above have been rounded off and hence there may be minor differences between point-to-point returns vis-a-vis returns indicated above.
HSBC Income Fund - Investment Plan Date of Inception : 10 Dec 02Scheme Name & Benchmarks July 13 -
June 14July 12 - June 13
July 11 - June 12
Since Inception
HSBC Income Fund - Investment Plan - Growth 2.47% 11.56% 9.63% 6.83%Crisil Composite Bond Fund Index (Scheme Benchmark) 4.51% 10.76% 8.67% 5.93%
Crisil 10 Year Gilt Index (Standard Benchmark) -2.43% 12.14% 7.25% 5.15%`10,000, if invested in HIF - IP, would have become `10,247 `11,156 `10,963 `21,474
`10,000, if invested in Crisil Composite Bond Fund Index, would have become `10,451 `11,076 `10,867 `19,471
`10,000, if invested in Crisil 10 Year Gilt Index, would have become `9,757 `11,214 `10,725 `17,869
HSBC Income Fund - S T P Date of Inception : 10 Dec 02Scheme Name & Benchmarks July 13 -
June 14July 12 - June 13
July 11 - June 12
Since Inception
HSBC Income Fund - S T P - Growth 7.56% 9.26% 8.70% 6.87%Crisil Short Term Bond Fund Index (Scheme Benchmark) 8.75% 9.33% 8.77% 6.71%
Crisil 1 Year T-Bill Index (Standard Benchmark) 5.91% 8.19% 7.72% 5.50%
`10,000, if invested in HIF -ST, would have become `10,756 `10,926 `10,870 `21,574
`10,000, if invested in Crisil Short Term Bond Fund Index, would have become `10,875 `10,933 `10,877 `21,200
`10,000, if invested in Crisil 1 Year T-Bill Index, would have become `10,591 `10,819 `10,772 `18,573
Funds Managed by - Ruchir Parekh & Sanjay Shah.
Past performance may or may not be sustained in the future. Refer note below.
Past performance may or may not be sustained in the future. Refer note below.
HSBC Cash Fund@ Date of Inception: 04 Dec 02Scheme Name & Benchmarks
Last 7 Days as on 30
June 2014
Last 15 Days as
on 30 June 2014
Last 30Days as
on 30 June 2014
July 13 - June 14
July 12 - June 13
July 11 - June 12
Since Inception
HSBC Cash Fund - Growth 8.64% 8.64% 8.65% 9.59% 8.78% 8.80% 9.01%
Crisil Liquid Fund Index (Scheme Benchmark) 8.52% 8.43% 8.42% 9.64% 8.14% 8.69% 8.80%
Crisil 91 Day T-Bill Index (Standard Benchmark)
8.84% 8.35% 8.41% 8.76% 8.31% 8.04% 8.30%
`10,000, if invested in HCF, would have become
`10,017 `10,036 `10,071 `10,959 `10,878 `10,880 `13,088
`10,000, if invested in Crisil Liquid Fund Index, would have become
`10,016 `10,035 `10,069 `10,964 `10,814 `10,869 `13,009
`10,000, if invested in Crisil 91 Day T-Bill Index, would have become
`10,017 `10,034 `10,069 `10,876 `10,831 `10,804 `12,824
Past performance may or may not be sustained in the future. Refer note below.
@Pursuant to SEBI circular dated Sept 13, 2012, certain Plans/options within the schemes have been discontinued to comply with a single plan structure. Since there was no continuous NAV history available for the surviving Plan prior to 19 May 2011, returns since the said date have been considered for calculating performance. The inception date of HSBC Cash Fund however is 4 December 2002.
Fund Managed by - Ruchir Parekh & Kapil Punjabi.

Statutory Details & Disclaimers
All returns have been sourced from MutualFundsIndia Explorer software unless otherwise stated. With regard to equity schemes (including the equity component of MIPs), Fund performance is calculated on a total return basis (i.e. it includes dividends re-invested) while the benchmark is calculated on a price return basis (i.e. it does not consider dividends re-invested). This document has been prepared by HSBC Asset Management (India) Private Ltd (HSBC) for information purposes only and should not be construed as an offer or solicitation of an offer for purchase of any of the funds of HSBC Mutual Fund. All information contained in this document (including that sourced from third parties), is obtained from sources HSBC, the third party believes to be reliable but which it has not independently verified and HSBC, the third party makes no guarantee, representation or warranty and accepts no responsibility or liability as to the accuracy or completeness of such information. The information and opinions contained within the document are based upon publicly available information and rates of taxation applicable at the time of publication, which are subject to change from time to time. Expressions of opinion are those of HSBC only and are subject to change without notice. It does not have regard to specific investment objectives, financial situation and the particular needs of any specific person who may receive this document. Investors should seek financial advice regarding the appropriateness of investing in any securities or investment strategies that may have been discussed or recommended in this report and should understand that the views regarding future prospects may or may not be realized. Neither this document nor the units of HSBC Mutual Fund have been registered in any jurisdiction. The distribution of this document in certain jurisdictions may be restricted or totally prohibited and accordingly, persons who come into possession of this document are required to inform themselves about, and to observe, any such restrictions. Mutual fund investments are subject to market risks. Please read the Scheme Information Document carefully before investing.
Investors should not invest in the Scheme solely based on the information provided in this document and should read the Combined Scheme Information Document and, Statement of Additional Information of the Fund for details. This document does not constitute an offering document. No part of this publication may be reproduced, stored in a retrieval system, or transmitted, on any form or by any means, electronic, mechanical, photocopying, recording, or otherwise, with-out the prior written permission of HSBC Asset Management (India) Private Ltd.
Mutual Fund investments are subject to market risks, read all scheme related documents carefully.
HSBC Asset Management (India) Private Limited, 16, V.N. Road, Fort, Mumbai-400001 Email: [email protected] Website: www.assetmanagement.hsbc.com/in