Embed Size (px)
Citation preview

AUDITOR-CLIENT COMPATIBILITY AND AUDIT FIRM SELECTION
Stephen V. Brown *
Arizona State University
W. Robert Knechel
University of Florida
March 12, 2013
* Corresponding Author
Acknowledgements
We are grateful for feedback from Stephen Asare, Ryan Cerf, Praveen Pathak, and Jennifer Wu
Tucker. We would also like to thank workshop participants at Arizona State University, Florida
International University, Southern Methodist University, the University of Florida, the
University of Illinois at Urbana–Champaign, the University of Kentucky, the University of South
Carolina, and the University of Virginia for their feedback on portions of this paper.
AUDITOR-CLIENT COMPATIBILITY AND AUDIT FIRM SELECTION
Abstract
We examine the degree of compatibility between clients and their auditors to test whether
companies systematically prefer specific auditors based on this criterion. Using both financial
statements and narrative disclosures, we introduce two new measures of compatibility based on
how similar a client is to other clients of the same auditor. Our results strongly support the idea
that auditor-client compatibility can predict auditor-client alignment. When compatibility is
lower, clients are more likely to change auditors and are more likely to pick a replacement
auditor with relatively high auditor-client fit. Interquartile changes in compatibility increase the
probability of switching auditors by as much as 19 percent. Further, audit quality, as captured by
discretionary accruals, increases as compatibility increases. Finally, we simulate a mandatory
audit rotation regime in which clients base their choice of auditor on compatibility, finding
changes in market share of as much as 9.7% from a first-best baseline.
Key Words: Audit markets, Auditor switching

1
AUDITOR-CLIENT COMPATIBILITY AND AUDIT FIRM SELECTION
1. Introduction
The process by which a client selects an auditor can be complex and may be influenced
by a number of factors. Some of the factors that might affect the degree of compatibility
between an auditor and a client includes pricing, expertise, location, interpersonal associations
and the extent of agency problems in the client (Chaney et al. [1997], Johnson and Lys [1990],
Knechel et al. [2008]). Some of these attributes are obviously more relevant than others for
determining the overall quality of the resulting audit. A limited amount of research has
examined alignment between clients and types of auditors, based on factors such as the size of
the audit firm (Shu [2000], Landsman et al. [2009]) or degree of specialization. There is even
less research on the compatibility of specific auditors and a specific client. What literature exists
tends to be narrowly focused, such as research on the effects of a client hiring a former audit
partner (e.g., Lennox and Park [2007]). In general, clients may have preferences about the audit
process, its outcomes, and the nature of the relationship with their auditor. In this paper, we
define auditor-client compatibility as the ability of the auditor to satisfy these preferences, given
its own preferences and constraints.1 If client preferences vary from company to company, and
the ability of an auditor to meet a client’s needs varies from firm to firm, the degree of fit
between any two entities will also vary. In this paper, we develop a unique measure of auditor-
client compatibility for Big 4 firms and use it to evaluate the nature of long term client
relationships and changes in auditors.
The degree to which a client and a specific auditor are compatible is not observable.
However, to the extent a company has similar audit preferences as other companies, they would
1 In this paper, we use the term “fit” interchangeably with “compatibility.”

2
presumably choose a similar auditor, subject to various choice constraints (e.g., location). In this
study, we compare the similarity of a company to the current clients of a specific auditor to
generate a proxy for how well that company fits into the auditor’s client base. When a company
appears similar to other clients of the same auditor, ceteris paribus, we presume that the auditor
is likely to have developed expertise and cost advantages related to that “type” of client.
Therefore, we consider clients and auditors compatible when similarity to other clients of the
audit firm is high; and we consider low compatibility to occur when there is very low similarity
between the company and the audit firm’s existing clients.
We introduce two measures of inter-company similarity within an industry, one based on
a client’s financial statements and one based on their narrative disclosures. Each source of
information reveals variation in what managers are disclosing and how they choose to disclose it.
The financial statement similarity proxy relies on the Mahalanobis distance which is used in
cluster analysis to divide objects into groups based on a vector of numeric measures associated
with each object. The vector used in this paper incorporates financial statement components
known to be important in an audit context, i.e., financial proxies for audit complexity, audit risk
and auditor effort. The narrative disclosure similarity measure extends the similarity score
introduced in Brown and Tucker [2011] which was based on year-on-year changes in
Management’s Discussion and Analysis (MD&A). In this paper, we consider narrative
disclosures contained in the annual report including the company’s business description,
footnotes, and MD&A. Using each measure, we calculate the similarity of each client to other
clients of an audit firm in the same industry and year (the “reference group”).
In general, we find that clients tend to hire auditors where compatibility is better.
Depending on the proxy used, up to 59 percent of clients employ one of the two best-fitting

3
auditors among the Big 4. We also observe that the poorer the fit with an existing auditor, the
greater the probability the client will choose to switch to a new auditor. Further, when a client
switches auditors, the successor auditor is generally the one of the three remaining firms that has
the best fit. Extending the analysis of compatibility, we also examine the association between fit
and audit quality. We find that discretionary accruals are lower when the auditor-client
compatibility is better.
The primary contribution of this study is the introduction of two measures of how similar
a company is to a reference group of other companies clustered by audit firm and industry. The
financial statement measure (Mahalanobis distance) has been used in other contexts before, but
not in the accounting literature. While the financial statement similarity score is used in Brown
and Tucker [2011], we extend their pairwise, year-on-year, measure to allow for comparison of
entities within a specified group. Within the audit context, we provide insight into the manner in
which auditors and clients gravitate to each other. We add to the limited literature on auditor-
client fit by considering the suitability of a specific auditor for a specific client. Such insight can
be potentially useful in considering what might happen if mandatory audit firm rotation is
adopted by the PCAOB or European Union since forcing an auditor change could have negative
implications for the engagement if the client is currently served by a highly compatible auditor.
The rest of the paper proceeds as follows. The next section develops the hypotheses and
discusses prior literature. Following that section is the rationale and foundation for the similarity
measures, a demonstration of how they are calculated, and a discussion of observed trends. A
description of the design and results of the empirical tests follows, while the next section
examines these results for their sensitivity to changes in the similarity measures. The final
section contains the conclusion.

4
2. Hypotheses and Prior Literature
2.1. Auditor-Client Compatibility and Selection of Auditor
To make predictions about the choice of an auditor based on auditor-client compatibility
requires two conditions: (1) variation in client preferences regarding the audit and auditor and (2)
variation across auditors in their ability to satisfy those preferences. If auditors are all essentially
equivalent (no auditor variation), clients could randomly choose between them. On the other
hand, if auditors vary but clients all have the same preferences, then all the clients would prefer
the same auditor subject to capacity constraints. The audit literature has documented substantial
evidence of variation in client preferences and auditor capability. For example, a large,
multinational client is more likely to choose a Big N auditor (Chaney et al. [2004]), at least in
part because a smaller auditor does not have the resources and capability of auditing such a
company. Therefore, the US audit market has enough variation to suggest that auditor-client
compatibility is an issue worth examining (Numan and Willekens [2012]).
In a related vein, a large number of studies have also focused on industry specialization
as a differentiator of both demand and supply. Industry specialists are those auditors that have
invested significantly in expertise in auditing a particular industry, typically reflected by larger
market shares in an industry. Specialists are considered to deliver higher quality, e.g., they are
better at detecting errors (Owhoso et al. [2002]), and are associated with clients having higher
earnings response coefficients (Balsam et al. [2003], Gul et al. [2009]) and lower discretionary
accruals (Krishnan [2003]). They are also better at improving audit quality through knowledge
spillovers from non-audit services (Lim and Tan [2008]). Beyond variation in quality, there are
also cost structure differences among specialists. While most studies have found specialists
charge higher audit fees (Gramling and Stone [2001]), there is also the possibility of cost savings

5
through the leveraging of expertise (Cahan et al. [2008], Craswell et al. [1995], Willenborg
[2002]). Further, audits by industry specialists tend to be more efficient (Cairney and Young
[2006]). As a result, client preferences for certain levels of cost and quality will lead them to
choose an auditor with structural characteristics that best meet their needs.2
While most prior literature has focused on broad categories of auditors (e.g., Big 4 or
non-Big 4, specialist or non-specialist), a handful of studies have examined client selection at a
more micro level. For instance, Lennox and Park [2007] find that a company is more likely to
engage a particular auditor when a former employee of that auditor is on the management team
of the client. Research on client-auditor disagreements finds that a client is more likely to switch
auditors in the presence of more conservative accounting treatments, presumably in an effort to
find an auditor who is more amenable to the company’s preferences
(DeFond and Subramanyam [1998]; Krishnan [1994]). Bamber and Iyer [2007] find that auditors
who more strongly identify with the client will be more likely to allow the desired accounting
treatment. While this “opinion shopping” may sound disreputable, Dye [1991] shows that the
firm may simply be trying to better communicate its internal information to the market. The
broad conclusion is that interpersonal relationships and opinion shopping are just two ways a
client can find one auditor to be a more “compatible” than others.
In sum, given sufficient variation among clients and auditors, each is likely to choose a
counterparty that best matches its preferences and needs. While auditors can appear very similar
on the surface, there are likely to be subtle differences that make one auditor a better fit than
2 Investor preference can also play a role in the decision. Switches to larger auditors and specialist auditors are
associated with positive market reactions (Fried and Schiff [1981], Knechel et al. [2007], Nichols and Smith
[1983]).
6
another. Considering all a client’s needs and preferences, one specific auditor will likely provide
a higher net benefit to the client, leading to our first hypothesis:3
H1: The auditor used by a client will tend to be more compatible with the client
than other auditors in the market.
2.2. Auditor-Client Compatibility and Auditor Switching
Under H1, clients will prefer higher compatibility with their auditors. If a client has low
compatibility with their current auditor, it is likely they will eventually consider a change in
auditor to increase the level of fit in the audit. Johnson and Lys [1990] demonstrate companies
are more likely to switch auditors as the client’s operating, investing, and financing activities
change over time. They interpret the increased likelihood of switching as a rational, efficient
response to temporal changes in the company’s audit preferences. In effect, the auditor-client
compatibility that was utility-maximizing in the past has shifted such that another auditor may
now be a better fit. Shu [2000] examines auditor-client fit based on whether the client is with a
Big N auditor when an empirical model would predict a non-Big N auditor, or vice versa, finding
clients are more likely to change auditors when there is a mismatch between the two. We extend
the concept of auditor-client compatibility to examine whether mismatches with a specific
auditor are more likely to lead to auditor switches. Based on the degree of fit between the auditor
and client, we expect that poor compatibility is more likely to lead to an auditor switch, leading
to our second hypothesis:
H2: Clients having relatively poorer compatibility with their current auditor are
more likely to change auditors than those with high compatibility.
3 The decision is also subject to various constraints. For example, Coca-Cola is unlikely to choose the same auditor
as PepsiCo due to competitive concerns. We do not specifically address this issue in this paper, but the effect will
be to shift a client away from its apparent best fit, thus working against our findings. Further, we are unable to
incorporate the effect of specific partners who might service a client due to lack of partner data in the U.S.

7
Once a client has made the decision to change auditors,4 it will need to choose from the
other available auditors. If the company limits itself to Big 4 auditors, a maximum of three
auditors remain, subject to constraints arising from competitor auditor choices and current non-
audit service providers. If compatibility is low with the present auditor who is to be replaced
(H1), it then follows that a company will generally prefer a new auditor that has a better
compatibility from among the remaining options.5 This perspective leads to our third hypothesis:
H3: A client switching auditors will tend to choose a new auditor that has a
relatively higher degree of compatibility among the non-incumbent auditors.
2.3. Effect of Changes in Auditor-Client Compatibility
While it is relatively intuitive to grasp how auditor-client compatibility can influence the
decision to change or retain an auditor, it is less clear how increases in compatibility would
influence audit quality. In experimental studies, Hammersley [2006] shows “matched”
specialists—defined as those operating within their industry of expertise—are more likely to
process experimental cues regarding misstatements than mismatched specialists, while Low
[2004] shows that an industry-based mismatch affects audit planning and risk assessments. These
studies imply that audit quality will be higher when there is a better fit between the auditor and
client. Johnstone, Li, and Luo [2011] find that clients within the same supply chain—a measure
of relatedness, if not similarity—tend to have higher audit quality. On the other hand, a sizable
literature finds decreased audit quality when the auditor closely identifies with the client. In
essence, the possibility exists that auditor-client compatibility could become so good that an
auditor’s independence is compromised. Lennox [2005] shows that companies are more likely to
4 The decision to actually change auditors is complex and would take into considerations beyond that of fit. For
example, the transaction costs of an auditor change can be quite high so the degree of incompatibility would
probably have to be relatively large to justify an auditor change on a cost/benefit basis. 5 We do not predict that the new auditor will necessarily have a better fit than the previous auditor, primarily
because of the endogenous nature of compatibility —a client may appear to become a better fit for an auditor over
time as the auditor’s preferences modify the client’s observable financial statements and related disclosures.

8
receive a clean audit opinion if the auditor becomes affiliated with the client by hiring its former
auditors. Menon and Williams [2004] find clients employing former audit partners in executive
positions tend to report higher levels of discretionary accruals. Taken together, these potentially
offsetting effects lead to our fourth (nondirectional) hypothesis:
H4: Audit quality is associated with auditor-client compatibility.
3. Measurement of Auditor-Client Compatibility
When clients are similar to each other in terms of industry, operations, risks or
transactions, auditors have the opportunity to specialize in those companies for both reputational
and audit production reasons.6 While prior literature typically uses an “all-or-nothing” industry
membership test to organize clients into similar groups, we develop two continuous proxies for
the degree of compatibility between a company and an auditor’s existing client base. The first
proxy is based on cluster analysis and is derived by grouping similar entities together based on a
small set of numeric data (e.g., financial statement accounts). The second proxy is based on
information (text) retrieval which uses narrative-based documents as the underlying data.
The two proxies facilitate the development of measures of client-auditor similarity for
both financial statement and narrative textual disclosures. While the accounting systems and
underlying economics of multiple organizations are not separately observable, their joint effect is
presumed to be reflected in the financial statements and related narrative disclosures. The
narrative disclosures are especially flexible, giving management the opportunity to communicate
firm-specific information or to influence the market’s view of the company. In general, the
numeric proxy and the text-based proxy serve the same purpose, namely, they provide an
indication of how similar a specific client is to all of the other clients audited by a specific
6 Gramling and Stone [2001] summarize the industry specialization literature, which generally finds differences in
both quality and audit fees for industry specialists versus non-specialists.

9
accounting firm on a year and industry basis (i.e., each metric is specific to a firm-year-industry
nexus).
3.1. Financial Statement Similarity
Algorithms used in cluster analysis of numeric data include the Euclidean distance, city-
block distance, Chebychev distance, and Mahalanobis distance (Hair et al. [2006]). Of these, the
Mahalanobis distance-squared (D2) is particularly sophisticated in its ability to weight each
variable according to its individual scale, as well as account for covariances among the various
components. Further, the D2 statistic imposes few restrictions on the underlying variables
(Mahalanobis [1936]). After scaling and accounting for covariance of the variables, an
observation’s distance from the group is larger when the variables for the observation are jointly
more “unusual.” The D2 measure is the generally preferred algorithm in cluster analysis (Hair et
al. [2006])7 but there has been limited use of the D
2 measure in the accounting literature. Rege
[1984] uses it to test the effectiveness of a discriminant function in classifying data into likely
and unlikely takeover targets. If the distance between the two groups is significant then the
discriminant function is considered effective. Iyer [1998] employs the statistic in the context of
distinguishing audit firm alumni that can help the firm market its services. Guilding and
McManus [2002] use the measure to test for potentially influential outlying observations.
However, all these studies use the measure in a statistical context and do not examine the
7 Outside the accounting literature, D
2 has been used in management to compare the distance between countries
along multiple dimensions, including economic, financial, political, cultural, demographic, and geographic location
(Berry et al. [2010]). Climatologists have used the measure to look for boundaries between different regional
climates (Mimmack et al. [2001]). And chemists have used it for multivariate calibration, pattern recognition and
process control (De Maesschalck et al. [2000]).
10
properties of the distance itself.8 We use the D
2 measure in this paper to capture financial
statement similarity.
We use five financial variables that are generally believed to be important in an audit
context (Hay et al. [2006]) to construct our measure of financial similarity: (1) company size
measured as the log of total assets (SIZE) to capture the scope and potential importance of the
client, (2) the combination of inventory and receivables as a proxy for inherent risk (IRISK), (3)
total accruals as an indicator of audit quality (TACC, as calculated by DeFond and Subramanyam
[1998]), (4) cash and equivalents (CASH) as a proxy for liquidity, and (5) return on assets (ROA)
as a measure of profitability. All measures except SIZE are scaled by total assets.9 To calculate
the D2 distance for the sample, these five variables are gathered from Compustat for companies
having assets greater than $1 million and a consistent fiscal year end throughout the sample
period. We exclude utilities or financial services industries due to inherent differences in the
structure of their financial statements. The sample begins in 1997, when EDGAR data is first
widely available and ends in 2009. Former Arthur Andersen clients are included but only after
they have not engaged Andersen for at least one year to limit the potential confounding effect of
changes due to the collapse of Andersen.
A similarity metric can be calculated for a single company by comparing it to some well-
defined group of other companies called the reference group. In this paper, we define the
reference group to be all other clients of an accounting firm in the same industry and same
year.10
We use industries to define our reference groups because of potential systematic
8 The abnormal accrual model could be conceptualized as a distance measure. It empirically models the relationship
between total accruals and various explanatory variables to attempt detection of accrual levels that are unusual-
looking relative to peer companies. 9 Other potential inputs, various permutations of those inputs, and alternative measurement approaches are described
in the robustness section. 10
Hogan and Jeter [1999] document the increasing importance of auditor restructuring along industry lines at the
national level to take better advantage of internal teams of experts. While client compatibility may vary at the office

11
differences and a lack of comparability in the structure of financial statements and narrative
disclosures across different industries. We exclude any reference groups that do not have at least
five observations because the similarity score is unlikely to be reliable in small groups. Further,
possible reference groups are rarely large enough for non-Big 4 auditors so we explicitly limit
the sample to Big 4 clients. Finally, a company is omitted from the reference group in the year
that they switch auditors.
Each observation in the sample consists of a vector of five financial statement variables
(n=5), xT = (x1, x2, …, xn) = (SIZE, IRISK, TACC, CASH, ROA). The mean of these same
financial statements variables for the entire auditor-industry-year is contained in the vector, μT =
(μ1, μ2, …, μn). Finally, the group has a covariance matrix, Σ, for the five inputs. The
Mahalanobis distance-squared is then calculated as:11
( ) ( )
The (x – μ) portion of the measure is calculated by subtracting the mean values of the five
financial variables of the reference group (i.e., auditor-industry-year combination) from the
values for the company-year being analyzed. The Σ covariance matrix is calculated at the
industry-year level to account for different scales and covariances across industries and over time
that are unlikely to vary much across auditors.12
Because D2 is a measure of dissimilarity, it is
converted to a similarity measure by calculating its inverse. Finally, the natural log
level, there are few offices with enough clients to calculate similarity measures within an industry. Calculating the
scores at the office-industry level would lead to a 63% reduction in sample size (and a 30% reduction if calculated at
the office-sector level). 11
The Euclidian distance between observations is a special case of the Mahalanobis distance. If the covariance
matrix (Σ) is the identity matrix, the square root of D2 simplifies to the familiar [(x-μ)
T(x-μ)]
½, which is the
Pythagorean theorem if the vector has length two. 12
Multicollinearity is not problematic as it would be in a regression. However, as the variables approach nearly
perfect multicollinearity, the covariance matrix will not be invertible, which can be a concern when using a small
vector of variables in a small industry. While unusual in the sample, we exclude industry-years that do not have at
least ten company-year observations (twice the number of variables). This restriction is almost always met given the
earlier restriction of at least five observations with an auditor-industry-year.

12
transformation reduces skewness and outliers, yielding our measure of financial statement
similarity:
(
)
3.2. Narrative Disclosure Similarity
The information retrieval literature has developed numerous methods for measuring the
similarity of two documents, often in the context of matching a user’s Internet search query to
the closest applicable web pages (Singhal [2001]).13
A common method for analyzing text
documents is the Vector Space Model (VSM) from the document retrieval literature. The VSM
maps a document into a numeric vector (Salton et al. [1975]). There are numerous ways to
calculate the similarity of document vectors. The most common approach is to calculate the
cosine of the angle between any two vectors (Singhal [2001]), an approach used in the
accounting literature by Brown and Tucker [2011]. They use the VSM cosine statistic to measure
year-on-year dissimilarities in MD&A as a proxy for changes in narrative disclosure. Because
Brown and Tucker [2011] were interested in the differences between just two documents at a
time, they only calculate pairwise similarity scores. In contrast, for this paper, we aggregate these
pairwise scores to get a measure of the similarity between one company’s narrative disclosure
and the disclosures issued by a reference group of clients within the same auditor-industry-year.
13
In theory, the D2 measure can be used in a document context, however, practical considerations limit its
usefulness in such a setting. When mapping a list of words from narrative text into variable vectors, the high
dimensionality makes calculation of the D2 measure impractical. The problem is that the size of the covariance
matrix depends on the unique words used in the documents being analyzed rather than the number of documents.
For example, a covariance matrix using the 98,519 unique words for the MD&A in the sample would contain 9.7
billion elements. This matrix would need to be inverted in the computational process, making the approach
obviously impractical.

13
The VSM-based similarity score for narrative disclosure similarity is calculated based on
three different types of text disclosure in a company’s annual 10-K.14
We select annual report
disclosures that are common to virtually all 10-K’s, reviewed by the auditor, not voluntary, and
considered important by the capital markets and regulators. It is preferable to use more than one
disclosure item because there is considerable variation in the characteristics of different
disclosures in terms of subject matter, time-horizon, and audit requirements. As a result, we
examine the company’s business description,15
management discussion and analysis (MD&A),16
and financial footnotes17
because they are usually the longest disclosure items in the 10-K.
Excluding exhibits, there are an average of 6,338 words in the business description, 7,054 in the
MD&A, and 8,623 in the footnotes (see Table B-1), comprising 17, 18, and 21 percent,
respectively, of the length of the typical 10-K.18
The data for the narrative disclosure score is taken from 10-K’s filed electronically via
the SEC’s EDGAR system for fiscal years 1997 through 2009 for the clients of Big 4 audit firms
14
While it is not feasible to calculate the D2 statistic for documents, it is feasible to calculate the VSM similarity for
financial statements. Using such an approach, Jaffe [1986] uses vectors of different categories of patent applications
to examine the overlap of R&D spending within industries. However, the D2 statistic is superior for numeric data
because VSM does not account for variances and covariances of the variable components, which reduces its
statistical power. 15
Item 101 of Regulation S-K requires the 10-K item 1 contain a detailed narrative description of the business,
including industrial and geographic segments, principal products and services, R&D spending, and competitive
conditions. This is the disclosure that is likely to have the least formal structure but may not change much over
time. 16
Item 303(a) requires that the MD&A contain a discussion of liquidity, capital resources, results of operations, off-
balance sheet arrangements, and contractual obligations. The MD&A is intended to be an interpretation of past and
future operations “through the eyes of management” (SEC [2003]). Given certain conditions, any forward-looking
statements receive Safe Harbor protection (Item 303(c) of Regulation S-K). This is the only disclosure that is
specifically forward-looking to some extent. 17
Although there is some topical overlap with the other two disclosures, footnote content is the only disclosure
specifically determined by GAAP. This is the only disclosure that is formally audited while the other disclosures are
reviewed by the auditor (AU Sections 550; 551) 18
The footnotes and MD&A are particularly important to stakeholders, given the large number of accounting
standards requiring or encouraging specific footnote disclosures and the relatively frequent guidance by the SEC on
MD&A (e.g., SEC [1987], [1989], [2003]). Prior studies have demonstrated the usefulness of footnotes (e.g.,
Shevlin [1991], Amir [1993], Wahlen [1994], Riedl and Srinivasan [2010]). Other research has shown some of the
potential information contained in MD&A (e.g., Feldman et al. [2010], Feng Li [2010], Sun [2010]). Of the three
narrative disclosures, the business description is relatively unexplored except in studies of the full 10-K as a single
document (e.g., Li [2008]).

14
having at least five other observations available for comparison within the same auditor-industry-
year reference group. Appendix A describes the selection and extraction process, which yields
33,355 business description, 31,280 MD&A, and 14,439 footnote observations. Treating the
three narrative disclosure items of the annual report as separate data sets, the similarity score for
each is calculated using an extension of the approach in Brown and Tucker [2011] that allows for
a comparison of a company to its peers (reference group). The process, summarized in Appendix
B, produces three variables—SIMBUS, SIMMD&A, and SIMNOTES—that proxy for the degree of
similarity between one client and all other clients in the same auditor-industry-year. Higher
similarity scores correspond to greater auditor-client compatibility.
3.3. Patterns in Client Similarity
Panel A of Table 1 contains descriptive statistics for the financial statement and narrative
disclosure similarity measures. The sample size is largest for SIMFS (57,035), smallest for
SIMNOTES (14,439), and similar for SIMBUS (33,355) and SIMMDA (31,280). SIMFS is always
negative because of the log transformation. Higher similarity scores indicate greater similarity in
relation to the reference group.19
The narrative disclosure similarities (SIMBUS, SIMMD&A, and
SIMNOTES) are approximately centered around zero.20
Similarity scores are significantly higher
for companies in the top quartile of size than for those in the bottom quartile (untabulated),
indicating that bigger clients tend to be at the “core” of the auditor’s portfolio in terms of their
similarity.
<<<<< Insert Table 1 about here >>>>>
19
The average auditor-industry-year reference group size is 38 clients for financial statements, 23 for the business
description, 22 for MD&A, and 12 for the footnotes. 20
As noted in Appendix B, we maximize the sample size for making the length adjustment by using all available
observations, including non-Big 4 auditors. After restricting the study sample to Big 4 clients, the mean is slightly
above zero.

15
The four similarity scores are not directly comparable to one another because of
variations in how they are calculated (e.g., a score of 0.20 for MD&A is not necessarily larger
than a score of 0.15 for footnotes). To compare across measures, the scores are standardized to
have a mean of zero and standard deviation of one. Figure 1 plots the similarity scores against
auditor tenure—the number of years with the current auditor. A tenure of zero corresponds to the
year prior to the current auditor obtaining the client, while a value of one indicates the first year
of a successor auditor’s tenure (i.e., the first year after an auditor switch). For visual
comparability, all scores are adjusted to begin at zero when auditor tenure is zero. The graph
only presents tenure up to year ten, after which the decreasing number of observations leads to
heightened volatility in the scores. All similarity measures increase over the length of the
auditor-client relationship, indicating that auditor-client compatibility improves over time.
Auditors might find this trend beneficial to the extent that it improves the quality or reduces the
effort involved in the audit engagement. Likewise, clients might benefit from adopting best
practices arising from the auditor’s expertise developed in similar client engagements.
<<<<< Insert Figure 1 about here >>>>>
The business description experiences a rapid increase in similarity during the first two
years of the engagement, after which point the similarity becomes more stable. MD&A similarity
also increases quickly in the first two years and then rises more slowly until approximately year
seven. The trends in financial statement and footnote similarities are highly correlated, which is
not surprising since those disclosures are intended to be closely aligned by regulation. Both of
these measures increase gradually over time with less of a sudden jump in the early years. To
test for the statistical significance of these trends, we compare the similarity scores for short
tenure (less than four years) and long tenure (nine or more years) engagements. In all cases, the
16
similarity scores are significantly higher for longer-tenure clients than for shorter ones. We
perform a related test using year-on-year changes in similarity and find that the annual changes
for long-tenure clients are not as large as the changes seen in newer clients.21
These patterns all
demonstrate that auditor-client compatibility is not a static component of the relationship, but is
partially a function of auditor tenure.
3.4. Validation of Similarity Measures
Table 2 reports the Pearson pairwise correlations among the similarity measures. The
reported correlations are limited to observations with scores available for all four disclosures
(narrative and financial), although the unrestricted correlations are similar. The four similarity
scores are all positively correlated with one another, indicating they measure related constructs.
The correlations are higher among the three narrative disclosures (ranging from 0.61 to 0.72)
than they are with the financial statements (from 0.05 to 0.11).
<<<<< Insert Table 2 about here >>>>>
As a means of validation, the table also contains the correlations between the similarity
measures and various proxies for client differences. For each variable used to produce SIMFS, we
calculate the client’s absolute difference from the mean for the reference group (auditor-client-
year), i.e., |SIZEDIFF|, |IRISKDIFF|, |TACCDIFF|, |CASHDIFF|, and |ROADIFF|.22
We expect
the correlation with the similarity scores to be negative in all cases. The correlations with SIMFS,
range from -0.25 to -0.42 and all are significant. More importantly, the significant correlations
between these difference variables and the narrative disclosure scores are all negative, indicating
the proper functioning of the narrative scores even though they did not explicitly include any
21
The t-statistics for the difference in means between long and short tenure clients of the financial statements,
business description, MD&A, and footnotes are: 24.10, 4.61, 5.13, and 8.72, respectively. The corresponding t-
statistics for the difference in annual changes are: 6.55, 2.94, 2.29, and 1.63. 22
These difference variables should be negatively correlated with SIMFS by design, but these correlations document
the SIMFS measure is working as expected. Performing a series of univariate correlation tests is also substantially
different from the joint difference measure produced using the D2 technique.

17
financial statement variables. Of the difference variables, |ROADIFF| and |TACCDIFF| have the
highest negative correlation with SIMFS, so client profitability and accruals could be important
determinants of financial statement similarity. On the other hand, |IRISKDIFF| has the most
negative correlation with the three narrative scores.23
We also consider the absolute value of unexpected discretionary accruals as a measure of
client differences. Following DeFond and Jiambalvo [1994], accruals are estimated using a
cross-sectional modified Jones model run within SIC 2-digit industries. The residual from this
model is DACC, the unexpected discretionary accruals. As expected, the similarity scores are
negatively correlated with the absolute value of DACC. Finally, we examine the stability of the
similarity scores since it would be expected that auditor-client compatibility will not change
dramatically over short time periods due to the relative stability in financial statements, related
disclosures, and client portfolios from year to year. In untabulated analysis, we find that the
autocorrelation coefficients for SIMFS (0.55), SIMBUS (0.93), SIMMD&A (0.92), and SIMNOTES
(0.92) are high, demonstrating a high degree of time-series stability in all four measures.
4. Analysis of Auditor-Client Alignment
4.1. Sample
For the hypotheses tests, data is collected from Compustat for each observation with at
least one similarity score available. The variables used in our testing are summarized in Table 1
(Panel B). The earliest data come from 1997, corresponding with the earliest availability of the
narrative disclosure data, and end in 2009. Auditor tenure is calculated based on the current
auditor information in Compustat beginning in 1974.
23
This is consistent with the importance of the numerous risk-related disclosures in annual report items (e.g., Kravet
and Muslu [2010], Campbell et al. [2010]).

18
4.2. Auditor-Client Alignment
If clients and auditors randomly choose to enter into an audit engagement without regard
to auditor-client alignment, one would expect a relatively equal distribution of clients across
firms when sorting on the compatibility score (i.e., approximately a 25% market share to each
firm after omitting clients of non-Big 4 firms). According to the first hypothesis, a client is more
likely to use an auditor that also has other clients similar to itself, and are least likely to use an
auditor having a less similar set of clients. Table 3, Panel A summarizes auditor-client alignment
using each of the similarity scores.24
In each case, the probability of using a specific auditor
monotonically declines as auditor-client alignment decreases. For financial statements, slightly
more clients use an auditor having the best fit (26%) than with the worst fit (24%). When
examining the business description, 27% of clients use the auditor with which they are best
aligned, while only 23% use the auditor with which they are least aligned. The MD&A pattern is
even stronger, with 30% of clients using the most aligned auditor and just 21% using the least
aligned auditor. The strongest pattern occurs based on similarity within the footnotes, where 32%
of clients use the most similar auditor and only 20% use the least similar auditor. In
combination, these results suggest that clients are indeed associated with highly compatible
auditors.
<<<<< Insert Table 3 about here >>>>>
To evaluate the statistical significance of these patterns, we assign a rank between one
and four, where one corresponds to the most compatible auditor and four to the least compatible.
The average auditor-client alignment rank is then compared to the expected rank under the null
24
We do not expect to see extremely large differences from an equal distribution for existing client-auditor
combinations because of the costs of auditor switching and the duration of auditor tenure in the sample. Many
factors can influence auditor-client alignment when the relationship is stable, i.e., fit as measured by our
compatibility score is just one dimension to alignment. As a result, we feel that the best test of auditor-client
compatibility relates to auditor switches (to be discussed) since that is the point in time when one alignment would
be most salient to a client and we would expect the best match between an auditor and a client.

19
of a random distribution (i.e., the average rank with four options is 2.5). Comparing the average
rank of each score to the null provides a test of the tendency of clients to be associated with a
more closely aligned auditor than with a less aligned one, without requiring that they be with the
most similar auditor. Table 3, Panel B shows the average rank of the incumbent auditor based on
auditor-client alignment. The average ranks are 2.47 (t = 5.67) when using the financial
statements, 2.43 (t = 10.86) for the business description, 2.36 (t = 21.42) for MD&A, and 2.29 (t
= 19.56) for the footnotes, all of which are significantly less than 2.5. Based on the content of
their disclosures, the overall conclusion is that clients are significantly more likely to be
associated with more compatible auditors.
4.3. Likelihood of Auditor Change
In a stable client-auditor relationship, we see that clients are more likely to be aligned
with compatible auditors (H1). However, such alignment at any point in time may reflect legacy
costs and inertia as much as it does a desire for “fit.” Further, the simple descriptive analysis in
the previous section does not address whether this pattern occurs because clients and auditors
jointly choose an engagement that already has a higher alignment, or whether clients merely
become more similar to their auditor over time as a side effect of the audit process. As
previously noted, a client is likely to search out the most compatible auditor when going through
a change in auditors (H2). Therefore, this section presents several analyses surrounding auditor
switches. First, we develop a model of auditor change based on variables from the existing
literature on auditor switching, augmented with the auditor-client similarity measures. We use
the following logit model to analyze auditor switches based on a company’s attributes in the year
prior to the switch (firm and year subscripts are suppressed):
20
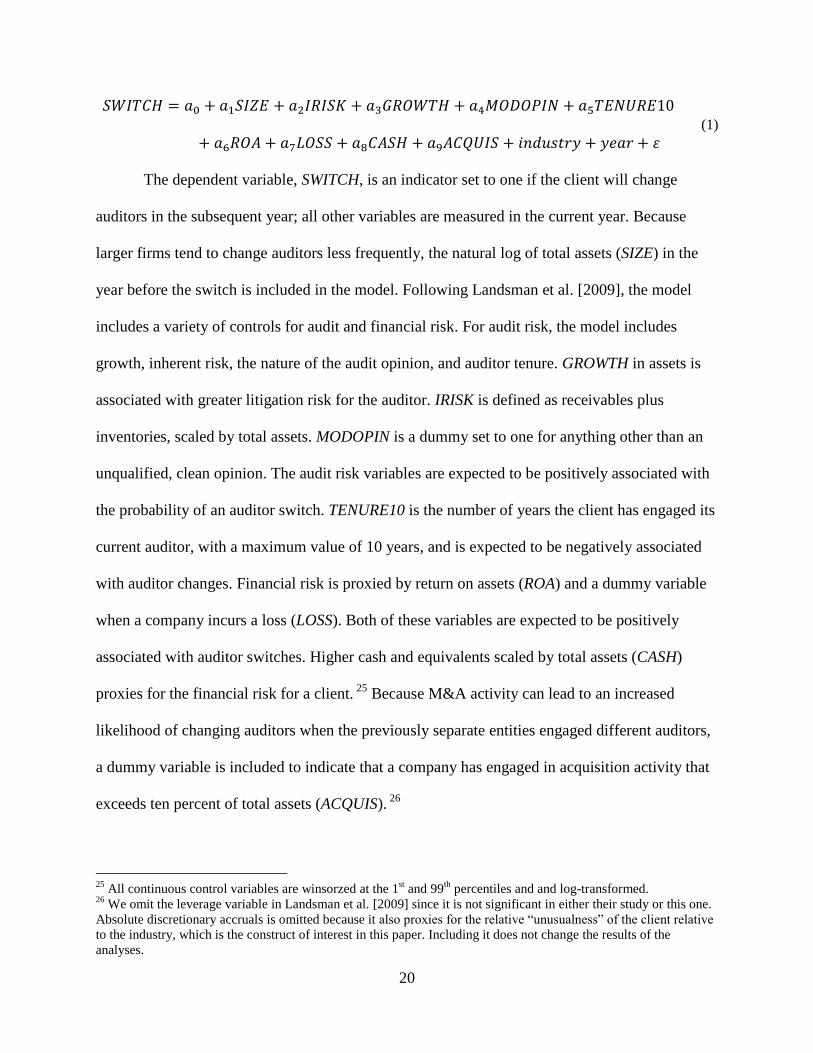
(1)
The dependent variable, SWITCH, is an indicator set to one if the client will change
auditors in the subsequent year; all other variables are measured in the current year. Because
larger firms tend to change auditors less frequently, the natural log of total assets (SIZE) in the
year before the switch is included in the model. Following Landsman et al. [2009], the model
includes a variety of controls for audit and financial risk. For audit risk, the model includes
growth, inherent risk, the nature of the audit opinion, and auditor tenure. GROWTH in assets is
associated with greater litigation risk for the auditor. IRISK is defined as receivables plus
inventories, scaled by total assets. MODOPIN is a dummy set to one for anything other than an
unqualified, clean opinion. The audit risk variables are expected to be positively associated with
the probability of an auditor switch. TENURE10 is the number of years the client has engaged its
current auditor, with a maximum value of 10 years, and is expected to be negatively associated
with auditor changes. Financial risk is proxied by return on assets (ROA) and a dummy variable
when a company incurs a loss (LOSS). Both of these variables are expected to be positively
associated with auditor switches. Higher cash and equivalents scaled by total assets (CASH)
proxies for the financial risk for a client. 25
Because M&A activity can lead to an increased
likelihood of changing auditors when the previously separate entities engaged different auditors,
a dummy variable is included to indicate that a company has engaged in acquisition activity that
exceeds ten percent of total assets (ACQUIS). 26
25
All continuous control variables are winsorzed at the 1st and 99
th percentiles and and log-transformed.
26 We omit the leverage variable in Landsman et al. [2009] since it is not significant in either their study or this one.
Absolute discretionary accruals is omitted because it also proxies for the relative “unusualness” of the client relative
to the industry, which is the construct of interest in this paper. Including it does not change the results of the
analyses.

21
The correlations among these variables and the similarity scores are presented in Panel A
of Table 4. The correlations with the similarity scores imply larger (SIZE), more profitable
(ROA), and less risky companies (IRISK) are more likely to have a better fit with their auditor.
This suggests that smaller, less profitable, and more risky companies may be constrained in their
auditor selection (i.e., may not be able to engage their first-best choice) if that auditor declines
the engagement due to concerns about audit or financial risk.
<<<<< Insert Table 4 about here >>>>>
Model (1) is augmented with each of the proxies for auditor-client fit introduced
separately. The results are presented in Table 4, Panel B. The controls are generally consistent
with prior literature. All similarity measures except for SIMBUS are negatively related to auditor
switches. SIMFS (t = 4.72), SIMMD&A (t = 3.40) and SIMNOTES (t = 3.78) have negative
coefficients, supporting H2 that clients having a poorer auditor fit are more likely to switch to a
new auditor.27
Holding all the other variables at their means, an interquartile decrease in
financial statement similarity is associated with a 9.2 percent higher probability of switching.
The increase for MD&A is 11.8 percent and for footnotes is 18.9 percent. This result explains
one of the mechanisms through which the patterns in Table 3 may occur: clients tend to utilize a
better-fitting auditor because they are more likely to change auditors when the fit is poor.
4.4. Auditor Choice Conditional on Decision to Switch Auditors
Hypothesis H3 predicts that a company that hires a new auditor will select the firm that is
most compatible from the set of firms available (i.e., excluding the incumbent that has been
replaced). Since the company has already decided the net benefits of a change outweigh the
27
As an alternative composite test, all similarity scores are converted to quintile rankings and then summed across
the four similarity scores (result ranges from 4 (maximum similarity) to 16 (minimum similarity). We then use this
variable in the auditor switch model. The coefficient is negative as expected (p<.0001).

22
switching costs—possibly due to fee or service considerations rather than compatibility—it is
expected that the new auditor, on average, will be the most compatible of the non-incumbent
firms. Table 3, Panel C, summarizes the average compatibility rank of the new auditor (with 1
being most similar, 3 least similar). Consistent with the earlier results for incumbent auditors, we
see that the likelihood that a firm is selected is a strictly decreasing function of the similarity
scores in all cases. Further, these clients generally choose a new auditor with better auditor-
client fit. To test the statistical significance of this pattern, the average rank of the new auditor is
compared to what the average rank would be if a new auditor was randomly selected from the
remaining 3 firms (i.e., 2.0).28
In Table 3, Panel D, the average rank of the financial statements is
1.96 (t = 1.91; p-value = 0.028), the business description is 1.94 (t = 2.11; p-value = 0.018), the
MD&A is 1.86 (t = 4.85; p-value < 0.001), and the footnotes is 1.89 (t = 2.19; p-value = 0.015).
All four are significantly different from the rank expected for random selection. Thus, all
similarity measures imply clients are significantly more likely to choose a better-fitting auditor
when switching among the Big 4.
Taken together, these tests provide insight into whether the commonly observed pattern is
due to (1) a decision made by clients to choose an auditor with better fit or (2) clients gradually
becoming more aligned with their auditors as the auditors influence the clients’ disclosures over
time. The results in Table 3 support the argument that auditor-client compatibility is partially the
result of the auditor selection process, i.e., when a company decides to change its auditor, it tends
to gravitate to one that is relatively compatible. The pattern in Figure 1 then suggests that the
compatibility continues to grow over the tenure of the auditor. Presumably this evolution
28
A random choice among auditors would imply a rank of (1 + 2 + 3)/3 = 2.

23
continues absent some kind of exogenous shock that would cause companies to change auditors
again.
4.5. Similarity Based on the Entire 10-K
In the primary analysis we use four different similarity scores which are defined in a
rather narrow manner in order to maximize the comparability across different companies within
an industry. Mathematically, it is also possible to run our analysis on the entire 10-K. We do not
include this as our primary analysis because of the likelihood that variations in presentation of so
much different information may disguise the similarity that occurs in specific disclosure items.
The full 10-K narrative yields a similarity score that is highly correlated with the disaggregated
scores, ranging from 0.73 to 0.81. In untabulated analysis, we find results that are fully consistent
with our primary analyses. Specifically, we continue to find companies tend to be associated
with the auditor that is most compatible, with an average rank of 2.34 (t = 25.92, p-value <
0.001). Further, they are significantly more likely to switch auditors when compatibility is low (z
= 3.48, p-value < 0.001). After switching auditors, they also tend to choose a new auditor with
better compatibility (rank = 1.9, t = 3.57, p-value < 0.001).
4.6. Similarity and Discretionary accruals
Higher auditor-client compatibility may be beneficial for a number of reasons including
audit efficiency and auditor-client relationships. However, it is possible that excessive
compatibility could lead to a loss of professional skepticism that might undermine audit quality.
To test whether audit quality is affected by auditor-client fit (H4), we compare the quality of
engagements with better fit to those with poorer fit using discretionary accruals. Signed
discretionary accruals are often used as a proxy for audit quality, with income-decreasing
accruals representing conservatism and income-increasing accruals corresponding to aggressive
accounting practices. The measure of discretionary accruals (DACC) used in this paper follows
24
DeFond and Subramanyam [1998]. Based on univariate correlations (untabulated), SIMFS is the
only similarity score that has a positive correlation with DACC (0.10). The other similarity
scores are uncorrelated. Considering the differences in discretionary accruals between clients
having the best auditor-client fit (i.e., a rank of one in Table 3) and those having the worst fit,
DACC is lower for better-fitting auditors based on the business description (t = 1.50; p-value =
0.067) and MD&A (t = 1.73; p-value = 0.042). Discretionary accruals are also lower for the
financial statement and footnote samples but the results are not statistically significant. Finally,
looking at changes in accruals in the first year after an auditor switch, we observe a significantly
larger decrease in discretionary accruals for better-fitting auditors than for less compatible ones.
However, this pattern only occurs for the financial statement measure; the other measures are
insignificant. On balance, the analysis of accruals provides weak evidence in support of H4 and
suggests that increased compatibility between an auditor and client improves—or does not
harm—audit quality.
5. Supplemental and Robustness Analyses
5.1. Audit Market Equilibrium under Mandatory Audit Firm Rotation
With a few assumptions, we can use the compatibility scores to estimate what would
happen if the PCAOB were to introduce a system of mandatory audit firm rotation for registrants
as it has proposed (PCAOB [2011]). Table 5 provides estimates of market share under such a
system of rotation assuming that clients were forced to change auditors. Panel A indicates the
market share of each audit firm based on the number of clients, assuming that each client would
change to its most compatible auditor with zero switching costs. Panel C does the same thing,
but based on market share of audit revenues. These two panels serve as a first-best baseline as
they represent clients’ choices in a fictionalized world of no switching costs under a non-
mandatory regime in which clients solely consider auditor-client compatibility in their decision.

25
Panel B and D then predict what the respective market shares would be if clients are
forced to move from their current auditor to a new auditor having the highest possible
compatibility out of the remaining three auditors. This prediction simulates a mandatory rotation
regime in which clients make their choices primarily based on auditor-client compatibility. The
“Dev” columns of Panels B and D indicate the deviation in market shares, as a percentage of the
first-best market share, for each firm. The final column provides the market share and deviation
averaged across the four compatibility measures. We see that Deloitte and KPMG would
increase their number of clients by 4.4% and 2.4%, respectively, while E&Y and PwC would
lose 5.6% and 1.2%, respectively. The gains and losses are more extreme when measured by
revenue, although the directional conclusions are identical. Deloitte and KPMG would see a
8.4% and 9.7% increase in audit fees, respectively, but E&Y and PwC would lose 3.6% and
9.6%, respectively. Note, these are the effects of the first time mandatory changes—firms would
have the ability to return to an earlier audit firm in the future.
<<<<< Insert Table 5 about here >>>>>
5.2. Alternative Inputs for Financial Statement Similarity
To test the robustness of the financial statement similarity score used in this paper, we
vary the inputs in the calculation of SIMFS. First, because small- and mid-sized companies are
empirically more frequent than large companies, including SIZE in the analysis could cause the
similarity measure to proxy for client size rather than similarity more generally. To reflect this,
we re-run our analysis leaving SIZE out of the model and leaving the four other inputs in place.
Second, we include return volatility as an additional input in the model to capture risk from a
market perspective. Finally, we include the number of non-missing/non-zero financial statement
variables in Compustat as a measure of audit effort and complexity, since additional financial

26
statement items are likely to increase the scope and intricacy of the audit.29
None of these
independent changes makes a difference in our results.
5.3. Auditor Switching Involving non-Big 4 Firms
Conditional on switching auditors, Hypothesis 3 predicts clients will prefer a better-
fitting auditor. The primary test only examined switches between Big 4 auditors and explicitly
excludes clients switching from or to a non-Big 4 auditor. In a separate analysis, we consider
clients switching from a non-Big N auditor to a Big 4 auditor (i.e., “upward switches”), ignoring
the forced changes by Arthur Andersen clients. Because these clients have four auditors from
which to choose, the null would predict an average rank of 2.5. Only the footnote sample mean
of 2.25 (t = 2.26; p-value = 0.01) implies upward switchers are more likely to choose a better-
fitting auditor. None of the other measures are significant. However, in all cases, the magnitudes
of the average auditor ranks are similar to those observed in Panel C of Table 3. This result
suggests that the decision to move to a Big 4 auditor is driven by factors other than compatibility.
It may also suggest that there are some constraints on an upward-switcher’s ability to identify or
choose the best-fitting auditor.30
5.4. Auditor Switching Involving ex-Andersen Clients
Another form of switching observed during the time period of the sample were former
Arthur Andersen clients switching to new auditors after the firm’s collapse. The patterns in this
subsample seem the most random of the subsets. In this case, none of the similarity scores are
statistically significant at conventional levels for the new auditor (SIMMDA has a p-value of 0.09).
Because the sample sizes are not dramatically smaller than those in Table 3, the former Andersen
29
The number of reporting segments is frequently used to proxy for audit complexity but is unavailable for many
companies in Compustat. Counting the number of variables serves as a broadly available alternative.
30 Alternatively, the similar magnitudes of the ranks between this test and Table 3, Panel C imply the insignificant
result could be driven by the small sample size available for this test.

27
clients appear unlikely to have chosen a new auditor with greater compatibility. This result may
be driven by the capacity constraints induced by the rapid auditor turnover affecting so many
large clients at once. While the sample sizes are small (ranging from 26 to 132 depending on the
similarity score), we also look at ex-Andersen clients that switched a second time in the sample
period. For the second switches, we compare the similarity rank of the new auditor to 2
(reflecting a choice from 3 non-incumbents). We find that the rank of the new auditor is less
than 2 for all four similarity scores but only significant for the business description (p=.017).
The lack of statistical significance for the other three similarity scores may be due to a lack of
power.
5.5. Accounting System Comparability
In a related line of research, De Franco et al. [2011] examine the comparability of
accounting systems between companies. However, their metric is not based on financial
disclosures or narrative text. For each company in their sample, they regress 16 quarters of
earnings (considered to be an accounting system output) on returns (a measure of the net effect
of economic events) to estimate the “accounting function” for that company. To determine the
similarity between any two observations, they use the fitted accounting function to predict
earnings for each observation using actual returns. They interpret the difference between the two
predicted earnings values as a measure of the difference in accounting systems. Aggregating
these differences for all pairs of observations gives a measure of accounting system similarity for
each company within an industry-year (COMPACCT-IND). They construct an alternative
measure using only earnings by regressing 16 quarters of earnings of one company on the
earnings of another. Aggregating the R2 from each regression also gives a proxy for accounting
system similarity (COMPACCT-R2). As a sensitivity test for the D2 metric used in this paper, we
28
calculate these measures as described in more detail in De Franco et al. [2011] as an alternative
to SIMFS.
The COMPACCT-IND variable is uncorrelated with the four primary similarity scores
used in this study, nor is it correlated with most of the alternative proxies for client differences
(|SIZEDIFF|, |IRISKDIFF|, |TACCDIFF|, |CASHDIFF|, and DACC), with the exception of a -
0.06 correlation with |ROADIFF|. In contrast, COMPACCT-R2 has correlations of 0.07, 0.08,
and 0.04 with SIMBUS, SIMMD&A and SIMNOTES, respectively. As an alternative test of auditor
changes, we separately include the two accounting comparability measures in the model for
auditor switches. They are both negative but insignificant.
6. Conclusion
We find strong evidence that auditor-client compatibility helps predict which auditor a
client will choose to engage. When the fit is poorer, clients are more likely to change auditors
and choose a compatible auditor from among their remaining options. An interquartile shift in
similarity with the current auditor’s client base can change the probability of switching auditors
by as much as 19 percent. Descriptively, auditor-client fit is a concave function of auditor tenure;
compatibility with the incumbent auditor increases over time, but at a decreasing rate. Based on
discretionary accruals, overall audit quality increases as auditor-client compatibility increases.
The similarity measures we introduce have additional applications within accounting
research. For example, the measures could serve as an alternative measure of industry
specialization based on the degree of overlap within an auditor’s client base. Beyond auditing,
the measures can be used to isolate firm-specific disclosures from disclosures that are similar
among a set of companies. Econometrically, it is possible to implement a matched-pair design

29
based on having similar narrative disclosures.31
Another possibility is studying how disclosures
propagate throughout an industry by monitoring when a specific disclosure becomes similar to
other existing disclosures of peer firms. The similarity measures have potential usefulness in any
context in which the relationships among a set of companies’ disclosures is of interest.
Our findings have several implications for both regulators and researchers. With the
PCAOB continuing to consider requiring mandatory auditor rotation (PCAOB [2011]), requiring
an auditor change could force auditors and clients into less compatible engagements, which will
potentially lead to changes in audit quality. For researchers, prior literature has directly examined
the effect of auditor type, such as auditor size and specialization, implicitly assuming auditors are
indistinguishable within these groups (i.e., all BigN auditors are essentially the same). Our
findings indicate more heterogeneity among a particular category of auditors than perhaps
previously thought. Therefore, depending on the nature of the research question, it may be
worthwhile to consider the differential effects of specific audit firms rather than examining them
in broad categories.
31
The Mahalanobis measure is already used for this purpose. For example, the psmatch2 Stata library.

30
APPENDIX A
EXTRACTION OF ANNUAL REPORT ITEMS
To gather the business description, MD&A, and footnotes sample, we begin by
downloading all 10-K’s and 10-K405’s available on the SEC’s EDGAR system that meet the
following requirements: (1) fiscal years between 1997 and 2009, (2) assets greater than $1
million, (3) no change in fiscal year-end, (4) not in the utilities or financial services industries,
and (5) engaging a Big4 auditor. As described in Table A1, this initial screen leaves 41,782
annual reports. We next screen out any unusually short annual reports since these typically
belong to holding companies, firms that are winding down, and other atypical observations. We
use a cutoff of 50,000 characters for this purpose (approximately the 4th
percentile of 10-K
length). This filters out most of the unwanted observations without losing a substantial number
of reports. We use characters instead of words because the tables and numbers contained in the
report make it difficult to split the document into “words” at this point in the process. This leaves
40,149 annual reports.
Next, we strip all HTML formatting and data tables as in Li ([2008], [2010]) and split
each annual report into its component items, keeping only the business description, MD&A, and
footnotes (the financial statements are removed when data tables are discarded). We remove any
narrative disclosures that contain language indicating the relevant section has been omitted as
permitted by regulation and skip disclosures that are included by reference, either to an external
document or an attached exhibit, since the variety of alternate locations dramatically increases
the difficulty in obtaining that data. The footnotes, in particular, are frequently included by
reference. We drop any remaining items that do not contain at least 150 characters. Items shorter

31
than this cutoff have typically been omitted or included by reference, but do so using somewhat
unusual wording that the initial string search may not have recognized.
We then split each item into words, keeping disclosures with at least 500 words. Items
shorter than this length are relatively unusual and are unlikely to provide a meaningful
comparison to disclosures by peers in the auditor-industry-year reference group. Finally, we
exclude items exceeding 20,000 words because these frequently indicate problems splitting the
10-K into separate items. For example, the extraction process might erroneously treat the entire
annual report as the business description due to misspellings and other idiosyncratic document
features. Archival studies frequently handle outliers such as these through deletion,
winsorization, or robust techniques during the empirical analysis. However, doing so in the
current study would allow these outliers to be in reference groups and therefore have an
undesirable influence on the calculation of the similarity scores.
The overall sample selection is summarized in Table A-1. There are fewer observations
in the narrative disclosure samples than in the financial statement sample, primarily due to
unavailable reports on EDGAR, items included by reference to other locations, and textual
idiosyncrasies that lead to problems extracting the 10-K items of interest. The substantial drop in
the number of footnote observations, as compared to the business description and MD&A
samples, is because many companies attach financial statements and footnotes as an exhibit to
the report in a variety of unpredictable ways, making their automated extraction difficult.
<<<<< Insert Table A-1 about here >>>>>

32
Table A-1. Narrative Disclosure Sample Selection Process
Reports
10-K available on EDGAR; fiscal years 1997-2009; Compustat assets
> $1M; no FYE change; excl. financials and utilities; Big4 auditor
41,782
Less: Short reports (<50,000 characters)
(1,633)
Total annual reports available
40,149
Bus Desc
MD&A
Footnotes
Less: Item not successfully extracted
(1,918)
(936)
(1,166)
Less: Item specifically omitted
(10)
(41)
(117)
Less: Item included by reference
(23)
(2,840)
(10,516)
Less: Short items (<150 characters)
(1,277)
(1,173)
(3,415)
Less: < 500 or > 20,000 words
(886)
(1,257)
(7,227)
Less: < 5 other clients in auditor-industry-year
(2,680)
(2,622)
(3,269)
Total items available
33,355
31,280
14,439
33
APPENDIX B
CALCULATION OF NARRATIVE DISCLOSURE SIMILARITY SCORE
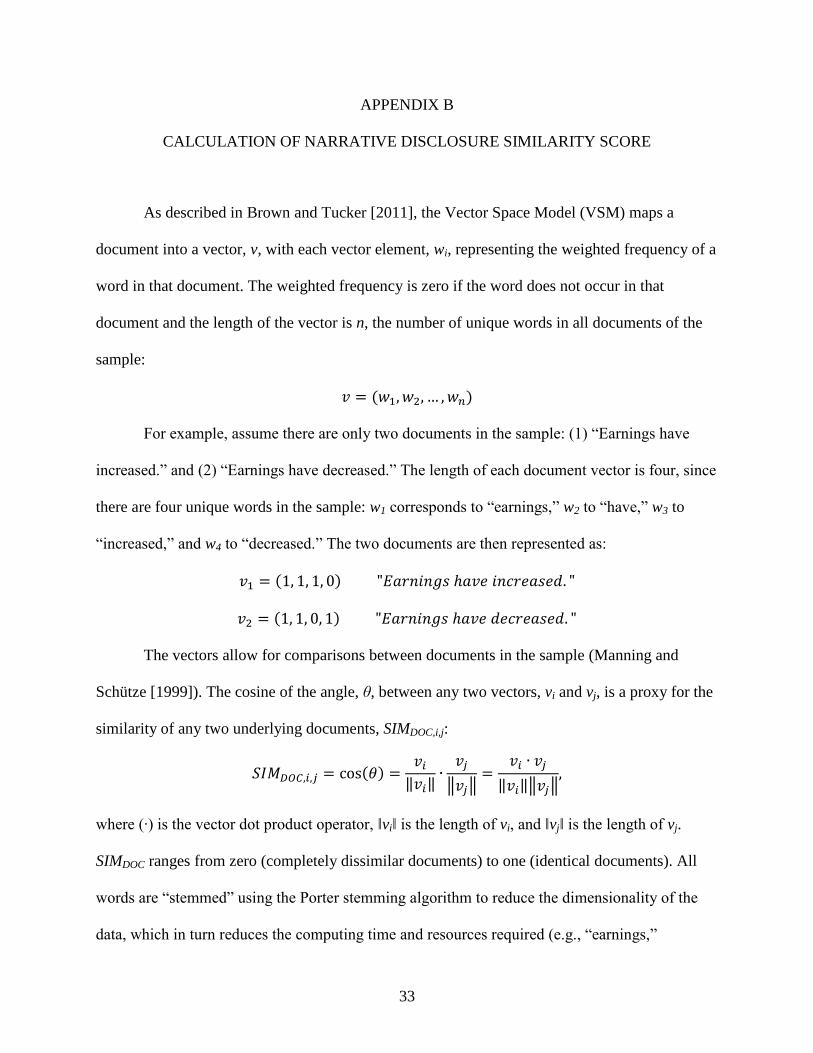
As described in Brown and Tucker [2011], the Vector Space Model (VSM) maps a
document into a vector, v, with each vector element, wi, representing the weighted frequency of a
word in that document. The weighted frequency is zero if the word does not occur in that
document and the length of the vector is n, the number of unique words in all documents of the
sample:
( )
For example, assume there are only two documents in the sample: (1) “Earnings have
increased.” and (2) “Earnings have decreased.” The length of each document vector is four, since
there are four unique words in the sample: w1 corresponds to “earnings,” w2 to “have,” w3 to
“increased,” and w4 to “decreased.” The two documents are then represented as:
( )
( )
The vectors allow for comparisons between documents in the sample (Manning and
Schütze [1999]). The cosine of the angle, θ, between any two vectors, vi and vj, is a proxy for the
similarity of any two underlying documents, SIMDOC,i,j:
( ) ‖ ‖
‖ ‖
‖ ‖‖ ‖
where (∙) is the vector dot product operator, ‖vi‖ is the length of vi, and ‖vj‖ is the length of vj.
SIMDOC ranges from zero (completely dissimilar documents) to one (identical documents). All
words are “stemmed” using the Porter stemming algorithm to reduce the dimensionality of the
data, which in turn reduces the computing time and resources required (e.g., “earnings,”

34
“earned,” and “earn” are all converted to “earn”).32
Consistent with Brown and Tucker [2011],
the term frequency-inverse document frequency (TF-IDF) algorithm is used to decrease the
weight on frequently used words and increase the weight on uncommon words.33
Therefore,
instead of a raw frequency count, each document vector element is the frequency count of the
word multiplied by a weight based on the relative prominence of that word in the entire sample.
Because Brown and Tucker [2011] were interested in differences between just two
documents at a time, they only calculate pairwise similarity scores. In contrast, in this paper the
pairwise scores are aggregated to get a measure of the similarity between one narrative
disclosure and the disclosures issued by the client reference group. As with the financial
statement similarities, the reference group contains other clients of the same auditor, within the
same GICS industry and year. To combine the pairwise SIMDOC,i,j scores between client i and all
other clients j in the same auditor, industry, and year, the pairwise similarities are averaged to get
SIMDOC,i for each observation in the sample.
The SIMDOC,i similarity measure is calculated for each observation in the business
description (RAWSIMBUS), MD&A (RAWSIMMD&A) and footnote (RAWSIMNOTES) samples.
Brown and Tucker [2011] show that these raw scores are positively related to document length
because of the mechanics of the calculation. They control for this relationship by regressing the
raw similarity on the first five powers of the number of words in the observation i document
(LENBUS, LENMD&A, and LENNOTES in the current study). In the current study we use the first
32
Even with the reduced dimensions, the calculations take over one week to run on a 2.66 GHz, quad-core machine,
while occupying most of the 6 gigabytes of working memory. 33
We do not use a “stop word” list to remove extremely common (i.e., unimportant) words, such as “the” and “a,”
from the sample as in Li [2010]. These words will receive a weight of zero, or very close to it, via the TF-IDF
weighting procedure. Brown and Tucker [2011] find no substantial difference in their conclusions between using the
TF-IDF approach and a simple frequency count combined with a stop word list. The TF-IDF weights are generated
independently for each type of narrative disclosure.

35
three powers because the magnitudes of the coefficients rapidly approach zero after this point.34
In order to maximize the sample size for making this adjustment, we use all available
observations, including those from non-Big 4 auditors.
Regressing the raw similarity scores on the first three powers of the document length
yields a residual that represents the variation in the raw similarity scores that cannot be explained
by these factors. These residuals are labelled SIMBUS, SIMMD&A, and SIMNOTES, producing the
similarity scores used in the analysis. Descriptive data for these measure components are in
Table B-1.
<<<<< Insert Table B-1 about here >>>>>
34
Hanley and Hoberg [2012] use the VSM to measure the similarity of an IPO prospectus to all the recent IPO’s
experiencing litigation problems. However, they do not control for document length, making it difficult to ascertain
the validity of their measure.

36
Table B-1. Calculation of Narrative Disclosure Similarity Measures
Variable Mean Std Dev 25% Median 75% Obs
SIMBUS 0.002 0.077 (0.053) (0.017) 0.040 33,355
SIMMD&A 0.002 0.087 (0.057) (0.024) 0.038 31,280
SIMNOTES 0.000 0.048 (0.029) (0.013) 0.011 14,439
RAWSIMBUS 0.108 0.085 0.045 0.087 0.148 36,035
RAWSIMMD&A 0.113 0.095 0.044 0.086 0.155 33,902
RAWSIMNOTES 0.054 0.061 0.021 0.037 0.064 17,708
LENBUS 6,338 3,739 3,602 5,471 8,252 36,253
LENMD&A 7,054 3,870 3,984 6,437 9,401 34,131
LENNOTES 8,623 4,018 5,423 7,934 11,178 18,083 Subscripts: BUS = Business Description, MD&A = Management’s Discussion & Analysis, NOTES = Footnotes to
Financial Statements.
Variables: SIM = similarity of observation to other clients in the reference group, adjusted for LEN; higher value
indicates more similarity. RAWSIM = SIM before adjustment. LEN = # of words in the observation’s text.

37
REFERENCES
Amir, E. “The Market Valuation of Accounting Information: The Case of Postretirement
Benefits Other Than Pensions.” The Accounting Review 68 (1993): 703–724.
Balsam, S., J. Krishnan, and J. S. Yang. “Auditor Industry Specialization and Earnings Quality.”
Auditing 22 (2003): 71–97.
Bamber, E. M., and V. M. Iyer. “Auditors’ Identification with Their Clients and Its Effect on
Auditors’ Objectivity.” Auditing 26 (2007): 1–24.
Berry, H., M. F. Guillén, and N. Zhou. “An Institutional Approach to Cross-National Distance.”
Journal of International Business Studies 41 (2010): 1460–1480.
Brown, S. V., and J. W. Tucker. “Large-Sample Evidence on Firms’ Year-over-Year MD&A
Modifications.” Journal of Accounting Research 49 (2011): 309–346.
Cahan, S., J. Godfrey, J. Hamilton, and D. Jeter. “Auditor Specialization, Auditor Dominance,
and Audit Fees: The Role of Investment Opportunities.” The Accounting Review 83
(2008): 1393–1423.
Cairney, T. D., and G. R. Young. “Homogenous Industries and Auditor Specialization: An
Indication of Production Economies.” Auditing 25 (2006): 49–67.
Campbell, J. L., H. Chen, D. S. Dhaliwal, H.-M. Lu, and L. Steele. “The Information Content of
Mandatory Risk Factor Disclosures in Corporate Filings.” Working Paper (2010).
Chaney, P. K., D. C. Jeter, and P. E. Shaw. “Client-Auditor Realignment and Restrictions on
Auditor Solicitation.” The Accounting Review 72 (1997): 433–453.
Chaney, P. K., D. C. Jeter, and L. Shivakumar. “Self-Selection of Auditors and Audit Pricing in
Private Firms.” The Accounting Review 79 (2004): 51–72.
Craswell, A. T., J. R. Francis, and S. L. Taylor. “Auditor Brand Name Reputations and Industry
Specializations.” Journal of Accounting and Economics 20 (1995): 297–322.
DeFond, M. L., and J. Jiambalvo. “Debt Covenant Violation and Manipulation of Accruals.”
Journal of Accounting and Economics 17 (1994): 145–176.
DeFond, M. L., and K. R. Subramanyam. “Auditor Changes and Discretionary Accruals.”
Journal of Accounting and Economics 25 (1998): 35–67.
Dye, R. A. “Informationally Motivated Auditor Replacement.” Journal of Accounting and
Economics 14 (1991): 347–374.
Feldman, R., S. Govindaraj, J. Livnat, and B. Segal. “Management’s Tone Change, Post
Earnings Announcement Drift and Accruals.” Review of Accounting Studies 15 (2010):
915–953.
De Franco, G., S. P. Kothari, and R. S. Verdi. “The Benefits of Financial Statement
Comparability.” Journal of Accounting Research 49 (2011): 895–931.
Fried, D., and A. Schiff. “CPA Switches and Associated Market Reactions.” The Accounting
Review 56 (1981): 326–341.
Gramling, A. A., and D. N. Stone. “Audit Firm Industry Expertise: A Review and Synthesis of
the Archival Literature.” Journal of Accounting Literature 20 (2001): 1–29.
Guilding, C., and L. McManus. “The Incidence, Perceived Merit and Antecedents of Customer
Accounting: An Exploratory Note.” Accounting, Organizations and Society 27 (2002):
45–59.
Gul, F. A., S. Y. K. Fung, and B. Jaggi. “Earnings Quality: Some Evidence on the Role of
Auditor Tenure and Auditors’ Industry Expertise.” Journal of Accounting and Economics
47 (2009): 265–287.

38
Hair, J. F., W. C. Black, B. J. Babin, R. E. Anderson, and R. L. Tatham. Multivariate Data
Analysis(2006). 6th ed. Upper Saddle River, NJ: Pearson Prentice Hall.
Hammersley, J. S. “Pattern Identification and Industry-Specialist Auditors.” The Accounting
Review 81 (2006): 309–366.
Hanley, K. W., and G. Hoberg. “Litigation Risk, Strategic Disclosure and the Underpricing of
Initial Public Offerings.” Journal of Financial Economics 103 (2012): 235–254.
Hay, D. C., W. R. Knechel, and N. Wong. “Audit Fees: A Meta-analysis of the Effect of Supply
and Demand Attributes.” Contemporary Accounting Research 23 (2006): 141–191.
Hogan, C. E., and D. C. Jeter. “Industry Specialization by Auditors.” Auditing 18 (1999): 1–17.
Iyer, V. M. “Characteristics of Accounting Firm Alumni Who Benefit Their Former Firm.”
Accounting Horizons 12 (1998): 18–30.
Jaffe, A. B. “Technological Opportunity and Spillovers of R&D: Evidence from Firms’ Patents,
Profits, and Market Value.” The American Economic Review 76 (1986): 984–1001.
Johnson, W. B., and T. Lys. “The Market for Audit Services : Evidence from Voluntary Auditor
Changes.” Journal of Accounting and Economics 12 (1990): 281–308.
Johnstone, K. M., C. Li, and S. Luo. “Client Supply Chain Relationships, Audit Firm Selection,
and Implications for Audit Quality and Pricing.” Working Paper (2011).
Knechel, W. R., V. Naiker, and G. Pacheco. “Does Auditor Industry Specialization Matter?
Evidence from Market Reaction to Auditor Switches.” Auditing 26 (2007): 19–45.
Knechel, W. R., L. Niemi, and S. Sundgren. “Determinants of Auditor Choice: Evidence from a
Small Client Market.” International Journal of Auditing 12 (2008): 65–88.
Kravet, T. D., and V. Muslu. “Informativeness of Risk Disclosures in Corporate Annual
Reports.” Working Paper (2010).
Krishnan, G. V. “Does Big 6 Auditor Industry Expertise Constrain Earnings Management?”
Accounting Horizons 17 (2003): 1–16.
Krishnan, J. “Auditor Switching and Conservatism.” The Accounting Review 69 (1994): 200–
215.
Landsman, W., K. Nelson, and B. Rountree. “Auditor Switches in the Pre- and Post-Enron Eras:
Risk or Realignment?” The Accounting Review 84 (2009): 531–558.
Lennox, C. “Audit Quality and Executive Officers’ Affiliations with CPA Firms.” Journal of
Accounting and Economics 39 (2005): 201–231.
Lennox, C., and C. Park. “Audit Firm Appointments, Audit Firm Alumni, and Audit Committee
Independence.” Contemporary Accounting Research 24 (2007): 235–258.
Li, F. “Annual Report Readability, Current Earnings, and Earnings Persistence.” Journal of
Accounting and Economics 45 (2008): 221–247.
———. “The Information Content of Forward‐Looking Statements in Corporate Filings—A
Naïve Bayesian Machine Learning Approach.” Journal of Accounting Research 48
(2010): 1049–1102.
Lim, C.-Y., and H.-T. Tan. “Non-audit Service Fees and Audit Quality: The Impact of Auditor
Specialization.” Journal of Accounting Research 46 (2008): 199–246.
Low, K.-Y. “The Effects of Industry Specialization on Audit Risk Assessments and Audit-
Planning Decisions.” The Accounting Review 79 (2004): 201–219.
De Maesschalck, R., D. Jouan-Rimbaud, and D. L. Massart. “The Mahalanobis Distance.”
Chemometrics and Intelligent Laboratory Systems 50 (2000): 1–18.
Mahalanobis, P. C. “On the Generalized Distance in Statistics.” Proceedings of the National
Institute of Sciences of India 2 (1936): 49–55.

39
Manning, C. D., and H. Schütze. Foundations of Statistical Natural Language Processing(1999).
Cambridge, Mass: MIT Press.
Menon, K., and D. D. Williams. “Former Audit Partners and Abnormal Accruals.” The
Accounting Review 79 (2004): 1095–1118.
Mimmack, G. M., S. J. Mason, and J. S. Galpin. “Choice of Distance Matrices in Cluster
Analysis: Defining Regions.” Journal of Climate 14 (2001): 2790–2797.
Nichols, D. R., and D. B. Smith. “Auditor Credibility and Auditor Changes.” Journal of
Accounting Research 21 (1983): 534–544.
Numan, W., and M. Willekens. “An Empirical Test of Spatial Competition in the Audit Market.”
Journal of Accounting and Economics 53 (2012): 450–465.
Owhoso, V. E., W. F. Messier Jr., and J. G. Lynch Jr. “Error Detection by Industry-Specialized
Teams During Sequential Audit Review.” Journal of Accounting Research 40 (2002):
883–900.
PCAOB. Concept Release on Auditor Independence and Audit Firm RotationPCAOB Release
No. 2011-006(2011).
Rege, U. P. “Accounting Ratios to Locate Take‐Over Targets.” Journal of Business Finance &
Accounting 11 (1984): 301–311.
Riedl, E., and S. Srinivasan. “Signaling Firm Performance Through Financial Statement
Presentation:: An Analysis Using Special Items.” Contemporary Accounting Research 27
(2010): 289–332.
Salton, G., A. Wong, and C. S. Yang. “A Vector Space Model for Automatic Indexing.”
Communications of the ACM 18 (1975): 613–620.
Securities and Exchange Commission. Concept Release on Management’s Discussion and
Analysis of Financial Condition and OperationsRelease No. 33-6711(1987).
———. Management’s Discussion and Analysis of Financial Condition and Results of
Operations; Certain Investment Company DisclosuresRelease No. 33-6835(1989).
———. Commission Guidance Regarding Management’s Discussion and Analysis of Financial
Condition and Results of OperationsRelease No. 33-8350(2003).
Shevlin, T. “The Valuation of R&D Firms with R&D Limited Partnerships.” The Accounting
Review 66 (1991): 1–21.
Shu, S. Z. “Auditor Resignations: Clientele Effects and Legal Liability.” Journal of Accounting
and Economics 29 (2000): 173–205.
Singhal, A. “Modern Information Retrieval: A Brief Overview.” Bulletin of the IEEE Computer
Society Technical Committee on Data Engineering 24 (2001): 35–43.
Sun, Y. “Do MD&A Disclosures Help Users Interpret Disproportionate Inventory Increases?”
The Accounting Review 85 (2010): 1411–1440.
Wahlen, J. M. “The Nature of Information in Commercial Bank Loan Loss Disclosures.” The
Accounting Review 69 (1994): 455–478.
Willenborg, M. “Discussion of ‘Brand Name Audit Pricing, Industry Specialization, and
Leadership Premiums post-Big 8 and Big 6 Mergers’.” Contemporary Accounting
Research 19 (2002): 111–116.
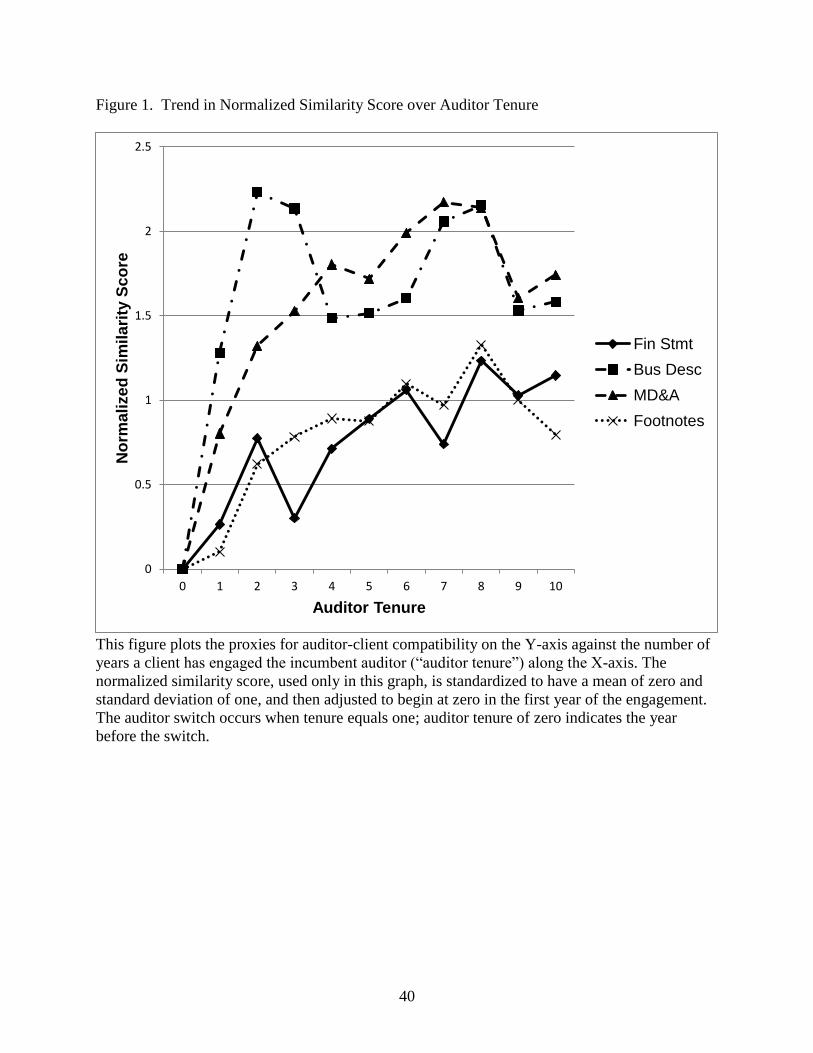
40
Figure 1. Trend in Normalized Similarity Score over Auditor Tenure
This figure plots the proxies for auditor-client compatibility on the Y-axis against the number of
years a client has engaged the incumbent auditor (“auditor tenure”) along the X-axis. The
normalized similarity score, used only in this graph, is standardized to have a mean of zero and
standard deviation of one, and then adjusted to begin at zero in the first year of the engagement.
The auditor switch occurs when tenure equals one; auditor tenure of zero indicates the year
before the switch.
0
0.5
1
1.5
2
2.5
0 1 2 3 4 5 6 7 8 9 10
No
rma
lize
d S
imil
ari
ty S
co
re
Auditor Tenure
Fin Stmt
Bus Desc
MD&A
Footnotes

41
Table 1. Descriptive Statistics
Panel A: Similarity Measures and Components
Variable Mean Std Dev 25% Median 75% N
SIMFS (2.164) 1.235 (2.689) (1.978) (1.402) 57,035
SIMBUS 0.002 0.077 (0.053) (0.017) 0.040 33,355
SIMMD&A 0.002 0.087 (0.057) (0.024) 0.038 31,280
SIMNOTES 0.000 0.048 (0.029) (0.013) 0.011 14,439
SIZE 5.743 2.120 4.256 5.657 7.146 59,110
IRISK 0.249 0.195 0.088 0.213 0.367 58,553
TACC (0.066) 0.476 (0.097) (0.048) (0.004) 57,460
CASH 0.210 0.243 0.026 0.104 0.318 59,106
ROA (0.085) 0.365 (0.082) 0.022 0.069 59,067
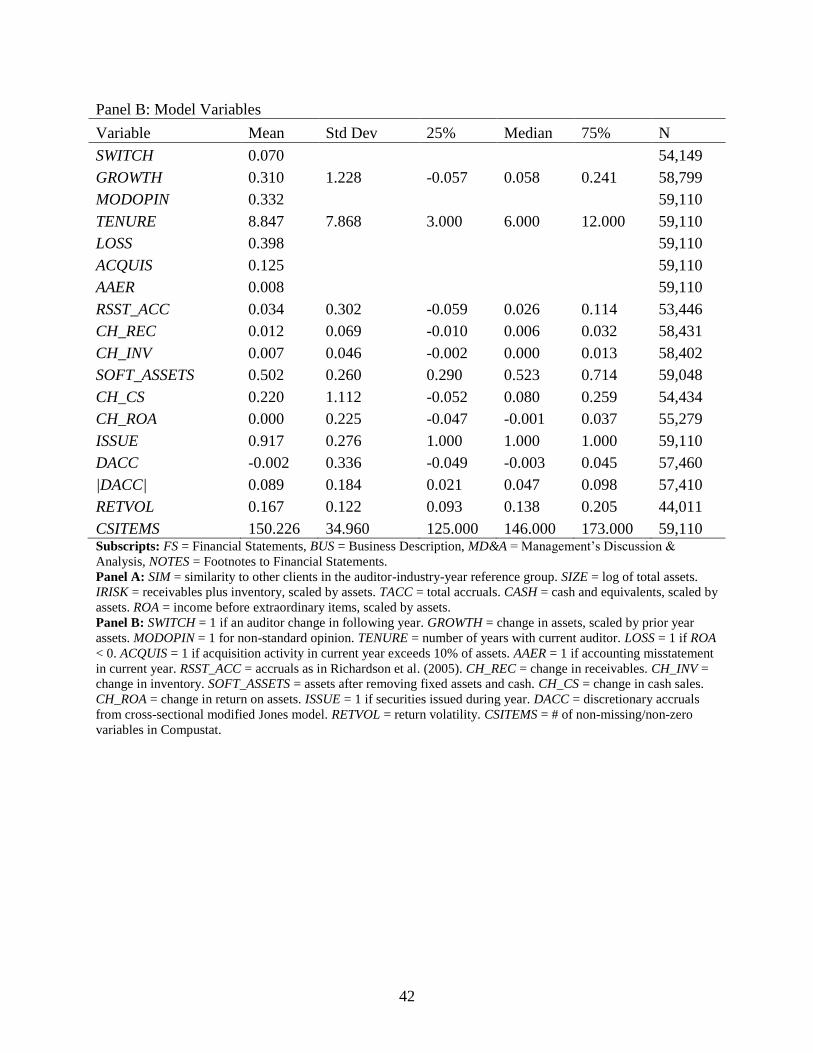
42
Panel B: Model Variables
Variable Mean Std Dev 25% Median 75% N
SWITCH 0.070
54,149
GROWTH 0.310 1.228 -0.057 0.058 0.241 58,799
MODOPIN 0.332
59,110
TENURE 8.847 7.868 3.000 6.000 12.000 59,110
LOSS 0.398
59,110
ACQUIS 0.125
59,110
AAER 0.008
59,110
RSST_ACC 0.034 0.302 -0.059 0.026 0.114 53,446
CH_REC 0.012 0.069 -0.010 0.006 0.032 58,431
CH_INV 0.007 0.046 -0.002 0.000 0.013 58,402
SOFT_ASSETS 0.502 0.260 0.290 0.523 0.714 59,048
CH_CS 0.220 1.112 -0.052 0.080 0.259 54,434
CH_ROA 0.000 0.225 -0.047 -0.001 0.037 55,279
ISSUE 0.917 0.276 1.000 1.000 1.000 59,110
DACC -0.002 0.336 -0.049 -0.003 0.045 57,460
|DACC| 0.089 0.184 0.021 0.047 0.098 57,410
RETVOL 0.167 0.122 0.093 0.138 0.205 44,011
CSITEMS 150.226 34.960 125.000 146.000 173.000 59,110 Subscripts: FS = Financial Statements, BUS = Business Description, MD&A = Management’s Discussion &
Analysis, NOTES = Footnotes to Financial Statements.
Panel A: SIM = similarity to other clients in the auditor-industry-year reference group. SIZE = log of total assets.
IRISK = receivables plus inventory, scaled by assets. TACC = total accruals. CASH = cash and equivalents, scaled by
assets. ROA = income before extraordinary items, scaled by assets.
Panel B: SWITCH = 1 if an auditor change in following year. GROWTH = change in assets, scaled by prior year
assets. MODOPIN = 1 for non-standard opinion. TENURE = number of years with current auditor. LOSS = 1 if ROA
< 0. ACQUIS = 1 if acquisition activity in current year exceeds 10% of assets. AAER = 1 if accounting misstatement
in current year. RSST_ACC = accruals as in Richardson et al. (2005). CH_REC = change in receivables. CH_INV =
change in inventory. SOFT_ASSETS = assets after removing fixed assets and cash. CH_CS = change in cash sales.
CH_ROA = change in return on assets. ISSUE = 1 if securities issued during year. DACC = discretionary accruals
from cross-sectional modified Jones model. RETVOL = return volatility. CSITEMS = # of non-missing/non-zero
variables in Compustat.

43
Table 2. Correlations Between Similarity and Difference Measures
SIMFS SIMBUS SIMMD&A SIMNOTES
SIMBUS 0.10
SIMMD&A 0.11 0.72
SIMNOTES 0.05 0.61 0.66
|SIZEDIFF| -0.25 0.00 -0.06 -0.02
|IRISKDIFF| -0.27 -0.13 -0.11 -0.13
|TACCDIFF| -0.35 -0.06 -0.04 -0.08
|CASHDIFF| -0.31 -0.11 -0.04 -0.12
|ROADIFF| -0.42 -0.08 -0.06 -0.08
|DACC| -0.27 -0.06 -0.05 -0.08 Correlations in bold are significant at the 1% level. Those within dashed box are expected to be negative. Based only
on observations with valid values for all four similarity scores. |SIZEDIFF|, |IRISKDIFF|, |TACCDIFF|,
|CASHDIFF|, |ROADIFF| = absolute difference of the variable from the mean of the auditor-industry-year reference
group. Other variables defined in Table 1.
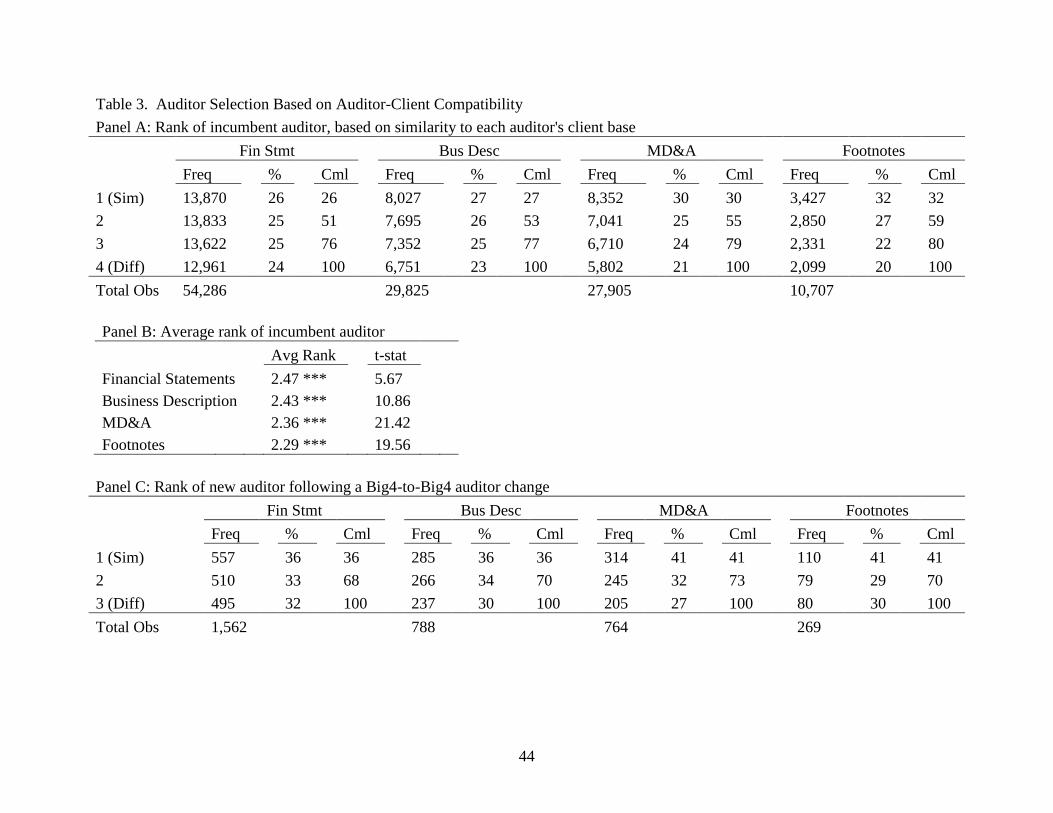
44
Table 3. Auditor Selection Based on Auditor-Client Compatibility
Panel A: Rank of incumbent auditor, based on similarity to each auditor's client base
Fin Stmt Bus Desc MD&A Footnotes
Freq
%
Cml
Freq
%
Cml
Freq
%
Cml
Freq
%
Cml
1 (Sim) 13,870
26
26
8,027
27
27
8,352
30
30
3,427
32
32
2 13,833
25
51
7,695
26
53
7,041
25
55
2,850
27
59
3 13,622
25
76
7,352
25
77
6,710
24
79
2,331
22
80
4 (Diff) 12,961 24 100 6,751 23 100 5,802 21 100 2,099 20 100
Total Obs 54,286
29,825
27,905
10,707
Panel B: Average rank of incumbent auditor
Avg Rank
t-stat
Financial Statements
2.47 ***
5.67
Business Description
2.43 ***
10.86
MD&A
2.36 ***
21.42
Footnotes 2.29 *** 19.56
Panel C: Rank of new auditor following a Big4-to-Big4 auditor change
Fin Stmt Bus Desc MD&A Footnotes
Freq
%
Cml
Freq
%
Cml
Freq
%
Cml
Freq
%
Cml
1 (Sim) 557
36
36
285
36
36
314
41
41
110
41
41
2 510
33
68
266
34
70
245
32
73
79
29
70
3 (Diff) 495 32 100 237 30 100 205 27 100 80 30 100
Total Obs 1,562
788
764
269

45
Panel D: Average rank of new auditor following a Big4-to-Big4 auditor change
Avg Rank
t-stat
Financial Statements
1.96 **
1.91
Business Description
1.94 **
2.11
MD&A
1.86 ***
4.85
Footnotes 1.89 ** 2.19 Panel A: Freq = number of times an auditor of a given rank is engaged by a client. Rank 1 corresponds to the most compatible auditor while rank 4 indicates the
most incompatible auditor. % = percentage of client-years engaging that rank. Cml = cumulative total of the % column.
Panel B: Avg Rank = average rank of the auditor engaged by a client. Random choice (null) is 2.5.
Panel C: Similar to Panel A, but only for clients changing from one Big4 auditor to another Big4 auditor in the year of the change.
Panel D: Similar to Panel B, but only for clients changing auditors.

46
Table 4. Probability of Auditor Change
Panel A: Pairwise Pearson Correlations
SIMFS SIMBUS SIMMD&A SIMNOTES SIZE IRISK GROWTH TENURE10 ROA
SIZE 0.22 0.26 0.10 0.19
IRISK -0.04 -0.21 -0.15 -0.14 -0.11
GROWTH -0.09 -0.03 0.00 -0.03 -0.01 -0.14
TENURE10 0.07 0.04 0.04 0.08 0.22 0.06 -0.17
ROA 0.30 0.06 0.04 0.10 0.40 0.16 0.06 0.11
CASH -0.07 -0.03 0.10 -0.09 -0.37 -0.39 0.20 -0.11 -0.28

47
Panel B: Logit Model of Auditor Switch in Subsequent Year
Fin Stmt Bus Desc MD&A Footnotes
Exp
Coef z-stat
Coef z-stat
Coef z-stat
Coef z-stat
(Intercept)
-1.810 -10.46 ***
-0.681 -2.54 **
-0.489 -1.93 *
-0.440 -0.98
SIZE -
-0.248 -18.87 ***
-0.390 -19.92 ***
-0.390 -19.40 ***
-0.437 -13.90 ***
IRISK +
0.205 1.66 *
-0.018 -0.11
-0.045 -0.27
-0.217 -0.86
GROWTH ?
-0.074 -3.75 ***
-0.053 -2.04 **
-0.040 -1.59
-0.073 -1.81 *
MODOPIN +
0.419 10.14 ***
0.241 4.14 ***
0.243 4.10 ***
0.330 3.70 ***
TENURE10 -
-0.039 -6.42 ***
-0.032 -3.81 ***
-0.031 -3.70 ***
-0.024 -1.89 *
ROA -
-0.042 -0.81
-0.154 -2.22 **
-0.163 -2.32 **
-0.167 -1.57
LOSS +
0.345 7.92 ***
0.437 7.38 ***
0.410 6.80 ***
0.361 3.84 ***
CASH -
-0.596 -5.76 ***
-0.923 -6.34 ***
-0.975 -6.62 ***
-1.270 -5.53 ***
ACQUIS +
0.043 0.74
-0.024 -0.29
0.021 0.26
0.071 0.60
SIMFS -
-0.076 -4.72 ***
SIMBUS -
-0.430 -0.99
SIMMD&A -
-1.324 -3.40 ***
SIMNOTES -
-4.922 -3.78 ***
Year FE Yes Yes Yes Yes
Industry FE
Yes
Yes
Yes
Yes
Obs
52,232
29,778
27,761
12,850
Pseudo-R2 0.07 0.09 0.09 0.11
Panel A: Correlations in bold are significant at the 1% level. TENURE10 = same as TENURE but with a maximum value of 10 years, for compatibility with
Landsman et al. (2009). Other variables defined in Table 1.
Panel B: The results of a logistic regression with dependent variable of SWITCH, indicating an auditor change in the following year. Variables defined in Table
1.

48
Table 5. Choice of Specific Auditor Based on Auditor-Client Compatibility
Panel A: First-Best Choice in a Voluntary Regime with No Switching Costs (Based on Number of Clients)
Fin Stmt Bus Desc MD&A Footnotes Average
Freq %
Freq %
Freq %
Freq %
%
Deloitte 13,262 24.4%
8,404 28.2%
7,102 25.5%
2,268 21.2%
24.8%
E&Y 13,047 24.0%
5,494 18.4%
6,839 24.5%
3,493 32.6%
24.9%
KPMG 13,722 25.3%
7,357 24.7%
5,209 18.7%
2,405 22.5%
22.8%
PwC 14,255 26.3% 8,570 28.7% 8,755 31.4% 2,541 23.7% 27.5%
Total 54,286
29,825
27,905
10,707
Panel B: Choice in a Mandatory Regime (Based on Number of Clients)
Fin Stmt Bus Desc MD&A Footnotes Average
Freq % Dev
Freq % Dev
Freq % Dev
Freq % Dev
% Dev
Deloitte 14,321 26.4% 8.0%
8,558 28.7% 1.8%
7,626 27.3% 7.4%
2,324 21.7% 0.5%
26.0% 4.4%
E&Y 12,361 22.8% -5.3%
5,449 18.3% -0.8%
5,986 21.5% -12.5%
3,099 28.9% -3.7%
22.9% -5.6%
KPMG 13,886 25.6% 1.2%
7,532 25.3% 2.4%
5,384 19.3% 3.4%
2,704 25.3% 2.8%
23.8% 2.4%
PwC 13,718 25.3% -3.8% 8,286 27.8% -3.3% 8,909 31.9% 1.8% 2,580 24.1% 0.4% 27.3% -1.2%
Total 54,286
29,825
27,905
10,707

49
Panel C: First-Best Choice in a Voluntary Regime with No Switching Costs (Based on Audit Fees)
Fin Stmt Bus Desc MD&A Footnotes Average
$ B %
$ B %
$ B %
$ B %
%
Deloitte 9.78 19.6%
8.58 28.9%
6.70 27.1%
2.06 20.9%
24.1%
E&Y 12.16 24.4%
5.31 17.9%
5.60 22.7%
2.89 29.3%
23.6%
KPMG 10.97 22.0%
6.12 20.6%
5.02 20.3%
2.46 25.0%
22.0%
PwC 16.90 33.9% 9.67 32.6% 7.39 29.9% 2.45 24.8% 30.3%
Total 49.82
29.67
24.71
9.86
Panel D: Choice in a Mandatory Regime (Based on Audit Fees)
Fin Stmt Bus Desc MD&A Footnotes Average
$ B % Dev
$ B % Dev
$ B % Dev
$ B % Dev
% Dev
Deloitte 11.45 23.0% 17.1%
9.22 31.1% 7.5%
7.19 29.1% 7.3%
2.09 21.2% 1.6%
26.1% 8.4%
E&Y 11.37 22.8% -6.5%
5.69 19.2% 7.1%
5.14 20.8% -8.2%
2.70 27.3% -6.8%
22.5% -3.6%
KPMG 12.16 24.4% 10.8%
6.97 23.5% 14.0%
5.20 21.0% 3.6%
2.72 27.6% 10.3%
24.1% 9.7%
PwC 14.83 29.8% -12.3% 7.79 26.2% -19.4% 7.18 29.1% -2.9% 2.36 23.9% -3.7% 27.2% -9.6%
Total 49.82
29.67
24.71
9.86
Panel A: Provides a simulated first-best auditor selection for current Big 4 clients, assuming each client could change auditors with no switching costs and would
solely consider compatibility when doing so. For the simulation, each client selects the auditor with the highest compatibility among the Big 4. Thus, some
clients would change from their current auditors while others would not. The Freq column contains the number of clients, with the % column containing the
corresponding market share. The Average % column is the mean of the four individual market shares.
Panel B: Simulates a mandatory regime by forcing each client to change from its current auditor, while assuming it will choose the most compatible auditor
among the remaining three. The Dev column contains the percent deviation of this simulated choice from the first-best choice in Panel A, as a percentage of the
first-best market share. The Average Dev column is the mean of the four individual deviations.
Panel C: Similar to Panel A, but the $B column provides the public client audit fees (in billions) each auditor would receive.
Panel D: Similar to Panel B, but the $B column provides the public client audit fees (in billions) each auditor would receive.


![Internal Audit as a Strategic Business Partnervasai-icai.org/Image/satish shenoy [Compatibility Mode].pdf · Internal Audit as a Strategic Business Partner ... Auditor partnered with](https://img.dokumen.tips/doc/110x75/5aab40b77f8b9ac55c8b98bd/internal-audit-as-a-strategic-business-partnervasai-icaiorgimagesatish-shenoy.jpg)


![AUDITOR GENERAL SEMINAR.ppt Presentations/Northern Ca… · Microsoft PowerPoint - AUDITOR GENERAL SEMINAR.ppt [Compatibility Mode] Author: FlorahS Created Date: 4/1/2016 10:51:20](https://img.dokumen.tips/doc/110x75/5f58284880e5a21c067f2d42/auditor-general-presentationsnorthern-ca-microsoft-powerpoint-auditor-general.jpg)