Embed Size (px)
Citation preview

Auditing the Australian Food Composition Program
Final report Dr Isabel Castanheira
Principal Scientist Instituto Nacional de Saude Dr Ricardo Jorge (INSA), Portugal,

2
Index
1. Acknowledgements ......................................................................................................... 5
2. Abbreviation and Symbols ............................................................................................... 6
3. Summary ......................................................................................................................... 7
4. Scope and Objectives .....................................................................................................10
5. Introduction .....................................................................................................................11
6. Materials and Methods ...................................................................................................14
6.1. Acquisition of documents ..........................................................................................14
7. Results ...........................................................................................................................20
7.1. The compilation process ...........................................................................................20
7.1.1. Part I - Integration of original data in the database ..............................................20
7.1.2. Part II - Production and validation of aggregated and compiled data ...................21
7.1.3. Part III - Dissemination of selected aggregated and compiled data .....................23
7.2. Quality Concepts applied to Australian Tables ..........................................................23
7.3. Selection of Data Sources ........................................................................................27
7.4. Key Foods and Sampling Strategies .........................................................................29
7.5. Selection of Nutrients ................................................................................................31
7.5.1 Bioactive compounds ...........................................................................................34
7.6. Methods of analysis ..................................................................................................35
7.7. Laboratory Selection .................................................................................................44
7.8. Units and Modes of expression .................................................................................46
7.9. Documentation..........................................................................................................48
7.10. Training .................................................................................................................50
8. SWOT (Strengths-Weaknesses-Opportunities-Threats) Analysis ...................................52
9. Conclusions and Recommendations ...............................................................................60
10. References .....................................................................................................................62

3
Index of Tables: Table 1 - Cross Reference Table: Quality Management Essential Requirements and
Management Document in FSANZ (1) ..................................................................25
Table 2 - Cross Reference Table: Quality Management Essential Requirements and Management Document in FSANZ (2) ..................................................................26
Table 3 - Cross Reference Table EuroFIR and FSANZ prioritised nutrients in NUTTAB 2006 (1) .........................................................................................................................32
Table 4 - Cross Reference Table EuroFIR and FSANZ prioritised nutrients in NUTTAB 2006 (2) .........................................................................................................................33
Table 5 - Bioactive Compounds ............................................................................................35
Table 6 - Cross reference table: Components included in AUSNUT 2007 and NUTTAB 2006 and EuroFIR gold standards: Proximates .............................................................37
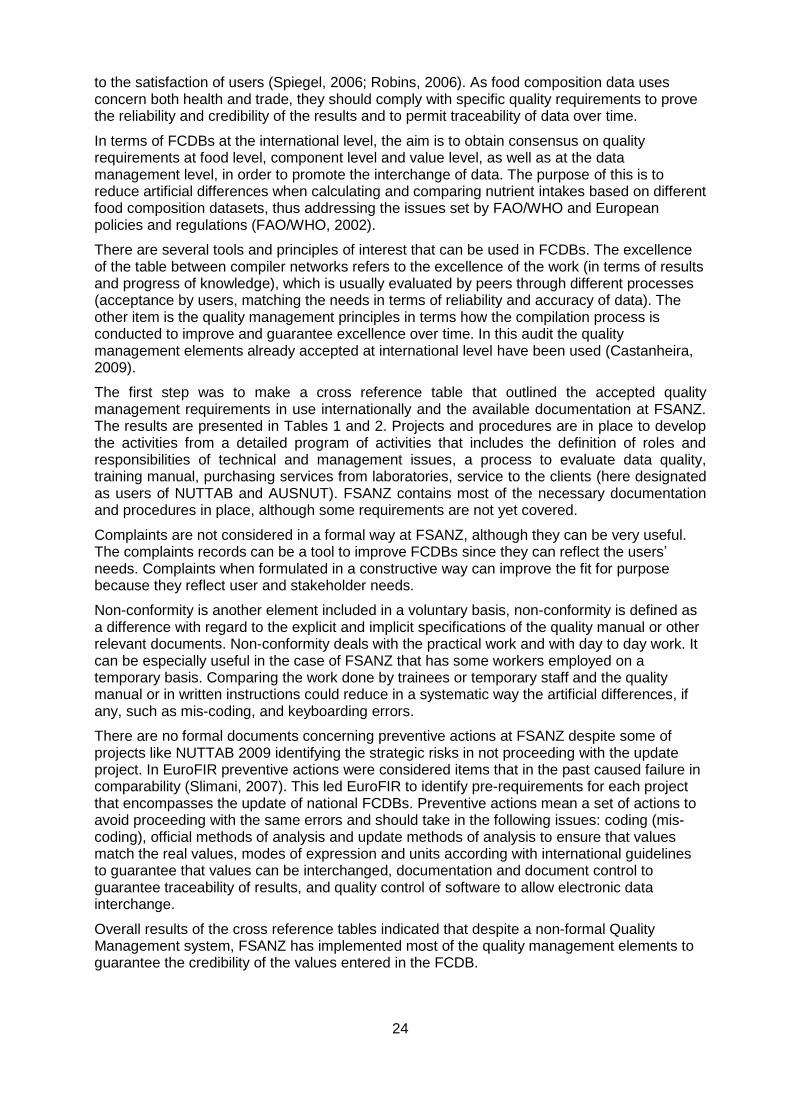
Table 7 - Cross reference table: Components included in AUSNUT2007 and NUTTAB 2006 and EuroFIR gold standards: Fat, Fatty Acids and Cholesterol .............................38
Table 8 - Cross reference table: Components included in AUSNUT 2007 and NUTTAB 2006 and EuroFIR gold standards: Minerals .................................................................39
Table 9 - Cross reference table: Components included in AUSNUT and NUTTAB and EuroFIR gold standards: Minerals ......................................................................................40
Table 10 - Cross reference table: Components included in AUSNUT and NUTTAB and EuroFIR gold standards: Minerals ........................................................................41
Table 11 - Cross reference table: Components included in AUSNUT 2007 and NUTTAB 2006 and EuroFIR gold standards: Vitamins .................................................................42
Table 12 - Cross reference table: Compatibility of methods of analysis according with Deharveng (1999) and Greenfield & Southgate (2003) .........................................43
Table 13 - Cross reference table: Laboratories performance ................................................45
Table 14 - Units and Matrix Units used in Australian Databank ...........................................47
Table 15 - Cross Reference Table EuroFIR Training and FSANZ ........................................51
Table 16 – Analysis of Strengths based on criteria for a comprehensive food composition database, according to Greenfield and Southgate (2003) and EuroFIR guidelines.54
Table 17 - Analysis of weakness based on criteria ...............................................................56
Table 18 - Analysis of opportunities ......................................................................................57
Table 19 – Analysis of threats ..............................................................................................58
4
Index of Figures: Figure 1 - Results concerning the sources of Food Composition Data in NUTTAB 2006. .....28
Figure 2 - Results concerning the sources of Food Composition Data in AUSNUT 2007......28
Figure 3 – Schematic representation of a sampling plan ......................................................30
Figure 4 - Cross reference: documentation ...........................................................................49
Figure 5 - Conclusions of SWOT Analysis – strengths and weaknesses represent internal analysis and opportunities and threats are external analysis ................................................59

5
1. Acknowledgements
First I would like to thank the staff of FSANZ for the fantastic atmosphere that I have met, allowing me to develop the work in a fruitful and profitable way.
I‟m indebted to Janis Baines for coordination of audit plan activities.
The contribution made by Judy Cunningham in the planning and feedback of the audit was invaluable. I would like to acknowledge the participation and interest of Renee Sobolewski, particularly for insights and contributions provided. Their sincere and honest opinions and contributions reflect the importance placed on this review.
A special thanks to the EuroFIR compiler network, consisting of food database organisations in 27 European countries, for their contribution to produce the generic flow chart and EuroFiles guidelines used to assess FSANZ processes.
I would like to express my gratitude to Paul Finglas, EuroFIR Coordinator, for approving my travel to Australia. The travel expenses were funded by EuroFIR under the EU 6th Framework Food Quality and Safety Programme contract number FP6-513944.
Exceptional gratitude is due to Maria Antónia Calhau, Head of INSA Food Nutrition Department, for encouragement and permission to travel to Australia to execute this work.
It is hoped that the report will provide FSANZ with useful information and suggestions.

6
2. Abbreviation and Symbols ABBREVIATIONS DEFINITION
AFGC Australian Food and Grocery Council
ANDB Australian Nutrient Data Bank
AOAC Association of Official Analytical Chemists
AUSNUT Australian Food Supplement & Nutrient Database
CCP Critical Control Point
CRM Certified Reference Material
DIAMOND Dietary Modelling of Nutritional Data
ENDB European Nutrient Database
EPIC European Prospective Investigation into Cancer and Nutrition
EU European Union
EuroFIR European Food Information Resource
FAO/WHO Food and Agriculture Organization of United Union/ World Health Organization
FAPAS Food Analysis Performance Assessment Scheme
FCDBs Food Composition Databanks
FOODCOMP Food Composition Course
FSANZ Food Standards Australia New Zealand
ICP/MS Inductively Coupled Plasma-Mass Spectrometry
ICP-OES Inductively Coupled Plasma-Optical Emission Spectrometry
ILAC International Laboratory Accreditation Cooperation
INFOODS International Network of Food Data Systems
ISO International Organization for Standardization
LOQ Limit of Quantitation
NATA National Association of Testing Authorities
NLG Nutrient Gains and Losses
NoE Network of Excellence
NUTTAB Nutrient Tables
OIML R 22 International Organisation of Legal Metrology nº 22 - Alcoholometry
PT Proficiency Testing
QA Quality Assurance
RMs Reference Materials
SI International System of Units
SOP Standard Operating Procedures
SWOT Strengths – Weakness – Opportunities – Threats
UKAS United Kingdom Accreditation Service
USDA United States Department of Agriculture

7
3. Summary
Terms of reference
As the review is undertaken as part of FSANZ Science Strategy plan it contains the following terms of reference:
a) How data are accepted and rejected
b) The process for compiling and publishing databases (NUTTAB and AUSNUT)
c) Data quality
d) Reviewing documentation.
Methods
The approach used consists of:
a) Interviews with all staff involved in the food composition process
b) Analyses of documentation files provided by the staff (training and review process)
c) Demonstration of ANDB software.
The analyses were developed by comparing the work carried out in FSANZ and in the International arena with special emphasis on work in progress at European countries under the umbrella of EuroFIR. A SWOT analysis (Strengths-Weaknesses-Opportunities-Threats) was chosen since it is considered as one of the best management tools to evaluate strategic plans of scientific organizations. SWOT is adopted in several European organizations having custody of National Food Composition Tables to identify the internal and external factors that are favourable or unfavourable for improving food composition activities.
Results
Strengths:
a) Food composition tables containing more than 80% analytical data from foods consumed in Australia.
b) Selection of laboratories according to international guidelines. This means analysis of nutrients is undertaken by laboratories accredited by NATA, or laboratories that have demonstrated their competence by succeeding in proficiency test programs run by accredited PT providers (such as FAPAS), or university laboratories with reputable skills proved by publications in scientific journals with high impact factor.
c) Similar methodologies are used to compile data for nutrients as for additives and contaminants.
d) Daily dialogue with epidemiologists and dieticians which facilitates the choice and selection of key foods and nutrients and facilitates the design of sampling plans based on sound scientific justification.
e) Personnel well trained in selection of values and with adherence to rigorous rules of data quality control.
f) The program is regarded as an authoritative force in Australia and New Zealand and in the Pacific Region for food composition tables.
g) Selection of foods and nutrients is in accordance with international prioritised lists for nutrients and foods which facilitates the use of Australian food composition tables for international studies and multi-centre epidemiologic studies.
h) List of nutrients covers all European and American prioritised nutrients.

8
Weaknesses:
a) Lack of data quality assessment systems to evaluate data arriving from contract laboratories, scientific literature, industry, or others‟ tables.
b) Lack of compliance with international rules of modes of expressions for beverages and some nutrients.
c) Lack of collaborative studies on recipe calculation and NLG.
d) Some personnel are contracted on a temporary basis. Few people consider the enormous amount of work required to train these staff in data scrutiny and entry of food composition data produced by laboratories under contract to FSANZ for the specific purpose of compiling food composition tables, which requires a sound scientific background, and specific training of personnel involved in selection of data
e) Lack of laboratory facilities to analyse vitamin D for the most important forms vitamin D2 (ergocalciferol), vitamin D3 (cholecalciferol) and 25-hydroxy-vitamin D (25-OH-D).
Opportunities:
a) To invest/prioritise on analytical data for foods to be exported from Australia:
Avoid European compilation organizations reanalysing data from Australian foods consumed by Europeans;
Convince USDA to use Australian data for prioritised nutrients taking into account importing food country nutrient requirements (e,g. Denmark and Netherlands seeking fruits rich in bioactive compounds and meat and biscuits with low levels of trans fatty acids)
Create a strength linkage with organizations in Australia involved in the export of foods (government and private companies).
b) To create a database for bioactive compounds in Australian foods and in the foods of other countries in the Pacific region (fruits, vegetables, meat). There is no country or region in the world with a database on bioactive compounds from foods obtained from animal sources and it is a need, as mentioned by some governmental organisations.
c) To strengthen liaisons with European Organisations (EuroFIR) to disseminate Australian food composition data among European countries.
Threats:
Since FSANZ is the national government organization that holds custody of the national food composition tables a real threat on its core business, as a threat that should be considered in the SWOT, is unlikely to occur. However other threats in the sense of specific hazards or critical actions could occur:
a) Tenders for provision of analytical services or tailor-made software should be prepared carefully taking into the account lessons from the past e.g. laboratories producing data that does not fit the purpose or problems in the contracts for tailor-made software.
b) In spite of FSANZ being a government organization, risks associated with unknown future political and administrative arrangements could occur and possibly affect project funding.
Conclusions

9
On the basis of the SWOT analysis supported by available international guidelines for food composition tables (EuroFIR), FSANZ is considered an excellent organisation. Developing in-country analytical facilities for the most important forms of vitamin D (D2, D3 and 25 OHD) is one of the most important issues in the field of Australian food composition. In order to seek to another area of scientific development, a strength linkage with nutrition/food safety/food labelling and trade is advisable.
Canberra, 26 February 2009
Isabel Castanheira
Principal Scientist
National Institute of Health / EuroFIR Quality Assurance team member

10
4. Scope and Objectives
This audit was conducted under the framework of the FSANZ Science Strategy 2006-2009 to ensure that FSANZ‟s work is:
Carried out with integrity, transparency and objectivity and performance evaluated through measurement of the quality and effectiveness of FSANZ scientific outputs.
Soundly supported by the following principles and elements: performance, integrity, leadership, collaboration, international linkages improvement and responsiveness.
The terms of reference for the audit were to undertake a review of all aspects of FSANZ‟s food composition program, including the following:
comparison of the FSANZ scientific approach with current international best practice
review of the approach FSANZ uses to generate, accept, reject and compile nutrient data, including sampling frames and laboratory requirements
review the format, content and presentation of FSANZ food composition publications and other information provided to stakeholders such as explanatory notes and website material, with a view to making recommendations on possible improvements
identify food composition related issues or developments in methodology that may need to be taken into account by FSANZ in the near to medium term
assess the staffing profile of the team and the training provided to team members.
The following matters fell within the scope of the audit:
a) To assess the level of excellence of the Australian Food Composition Database (ANDB) in compliance with consensus international guidelines for production, management and use, in terms of Organization and Structure, Food description, Nutrient list, Quality of Data Sources, Methods of Analysis, Criteria to select and scrutinise data, Documentation and Personnel.
b) To evaluate the possibility of Australian foods being tracked over time in compliance with international guidelines, to allow the possibility for the data to be used in multi-centre epidemiological studies.
c) To produce a list of strengths and weakness, in the domains of internal issues (data quality, methods of analysis, compilation process, training) and external issues (management reviews, users and advisory group, to review and provide advice on improvements over time).
d) To identify opportunities at the international level supported by identified strengths grouped according with the international quality criteria of data management and interchange.
e) To analyse the possibilities of real threats in terms of core activities such as analytical programs and similar publications.
f) To provide possibilities on the promotion and dissemination of scientific background in the international arena with obvious benefits for the scientific community.
g) To provide recommendations for proceeding with the internationalization of ANDB.

11
5. Introduction
Food Composition Databanks (FCDBs) are used in several areas such as health, trade legislation, environment and agriculture (Egan, 2007). FCDBs can be used to support a government‟s public health policies, or as a reliable guide to be used by consumers in order to assist them to choose healthy foods that contain the most appropriate nutrients (Murphy, 2001). A comprehensive FCDB that has been developed to fit a specific purpose can be considered a useful tool beyond health sciences (Haytowitz, 2008). Data quality has always been considered to be a key feature of FCDBs at the international, regional and national level (Harrison, 2004). FCDBs are considered to be of high quality if they are coupled with the following key concepts: representativeness, completeness, a harmonised approach and documentation (Burlingame, 2004). There are several methods used to select nutrient values entered in FCDBs. These are the direct method which uses analytical data obtained specifically for the FCDBs purpose, the indirect method which uses values obtained from literature and the combination method which includes nutrient values obtained using both methods (Rand, 1991). FCDBs are generally structured according to food groups such as „Beverages‟ and „Dairy‟ and contain prioritised nutrient values according to the FCDB purpose. In some countries they are organised with the goal of ensuring sound scientific support of national and international epidemiological multi-centre studies to evaluate the disease/health relationship with nutrient intake and food consumption over time (Truswell, 1991). A lack of acceptance of nutrient values in FCDBs across countries could be a significant pitfall to epidemiological studies (Pennington, 2007). Confidence in a food composition table‟s compilation methodologies and the overall development of FCDBs cannot be imposed and is developed from mutual respect and transparency at all levels of the process (Pennington, 2008). Based on the concepts and requirements identified above, three main questions need to be answered in order to guarantee the implementation of good scientific practice:
(1) Which international requirements are applicable?
(2) What are, at a national level, the main contributions of an international peer review?
(3) How should the assessment strategies be applied to be effective?
International requirements:
FCDBs are a component of FSANZ scientific activities. As such, the Australian FCDBs were audited according to international principles mainly set out by EuroFIR approaches. This approach guarantees the compliance with FSANZ Science Strategy principles: “to develop and maintain linkages with overseas scientific experts to influence, and gain input from, the international scientific debate relating to food regulatory issues” (FSANZ, 2006). EuroFIR is sponsored by the Sixth Framework Programme for Research and Technological Development under the Food Quality and Safety Priority. The NoE (Network of Excellence) was formally launched in 2005 and is funded up to 2009. EuroFIR is a partnership of 40 members from universities, research institutes and small- to medium-sized enterprises. It brings together partners who carry out laboratory analysis and the national centres (or co-centres) responsible for the compilation and management of national nutrient databases for seventeen EU states, as well as candidate members and other states, in a total of twenty-one countries. EuroFIR aims:

12
a) to improve the compatibility of national tables in order to assist multi-centre studies at the European level
b) to strengthen scientific and technological excellence in FCDB systems by integrating at the European level the critical mass of resources and expertise needed to create European leadership
c) to offer new information on missing data for some nutrients and biologically active compounds with putative health effects - covering all food groups, including traditional, ethnic minority, novel and prepared food; and to develop a Quality Framework for food composition data in order to improve harmonization between compliers, laboratories and stakeholders.
Onwards, EuroFIR will continue as a non profit organisation to fulfil the aims and strategic objectives that bring together the European FCDBs (Denny et al, 2009). In order to develop harmonisation of FCDBs, EuroFIR developed a set of guidelines to guarantee that national online databases are presented, with their metadata, in a homogeneous structure. This is particularly important in the case of multicenter epidemiological studies or borrowed data where foods consumed are imported from another country (Denny et al, 2009). In order to avoid such difficulties and the unnecessary duplication of work through reanalysing foods to include in another FCDB, the criteria used should outline the minimum requirements to ensure that the compilation organisation operates under suitable good scientific practices (Greenfield, 2003). The EuroFIR approach to implementing Quality Systems in FCDBs, describes the general concept of quality principles and practices adopted by EuroFIR and discusses results and recent progress (Castanheira, 2009, Westenbrinck, 2009).
International peer reviews
Audits are defined by ISO as „a systematic, independent and documented process for obtaining evidence and evaluating it objectively to determine the extent to which audit criteria are fulfilled‟ (ISO 9000). Usually audits are systematic, independent and documented processes to examine the elements of the system, carried out by members having no direct responsibility in the areas audited. They determine whether the activities of the organisation are in accordance with the arrangements laid down in standard operating procedures and assess the effectiveness of the systems to guarantee the quality of the process and product (Spiegel, 2003). According to Petit (Petit, 2000) research activities performed as part of Science Strategy Quality plans can be subject to different types of evaluation. To determine if the established requirements are fulfilled a compliance audit can be conducted and to assess the excellence of the research work an operational audit can be conducted. Three different categories of audit are described in literature. These are internal, external and co-operative. An internal audit is conducted by the entity itself to evaluate activities of its core business. External audits are carried out by an external independent organisation that holds certification for the purpose of achieving formal recognition. Co-operative audits are conducted between the organisation and another similar entity for mutual benefits. To collect information of good scientific practice the following three methods are recommended; read, observe and ask. Reading of relevant documents has the purpose of verifying that procedures are complete and accurate. Observation and demonstration of practices will ensure that procedures claimed are incorporated in routine practice. Interviews

13
and meetings are tools to evaluate if each staff member is trained, if they are adhering to procedures and policies and to provide evidence of their level of performance. Horizontal and vertical audits are strategies to implement the audit plan. A horizontal audit is a detailed assessment of each requirement applied to total activities. A vertical audit is a systematic evaluation of all requirements associated with each activity. The recognition and demonstration of competence to fit the purpose and to meet the users‟ needs are the main advantages of a systematic audit process.
SWOT (Strengths-Weaknesses-Opportunities-Threats) Analysis:
The real results of any audit should have impact in the organisation and allow that all fields should be judged impartially. Therefore, assessment is an independent peer-review of activities or documents with respect to a guidance document. The intended outcome is an attestation that the activities performed or the system reviewed conforms to those requirements (Audit). There are two general types of attestation. These are formal recognition of the compliance with the requirements provided by a third party (which presupposes the availability of a standard and excellence) and recognition to and mutual respect among peers. In the first case recognition is an attestation of compliance, whereas in the second is an attestation of competence and mutual respect. Any assessment of competence requires an independent anchor point which is the reference (however assessed). In the field of food composition, excellence is seen as superior to formal recognition, as the end users of food composition data are interested in values that fit the purpose for their specific needs. Therefore standards needs to be specific and elaborated by food composition actors. Therefore, as part of this audit Food Composition specific criteria were used for the assessment of data quality by applying SWOT analysis as a quality tool (Dyson, 2004). SWOT was used in this audit to analyse the FSANZ Food Composition Program, and in particular the FSANZ FCDBs and to formulate an approach that fits into the overall FSANZ science strategy plan. The SWOT is a strategic planned method used to evaluate the favourable and unfavourable internal factors (Strengths – Weakness respectively) and favourable and unfavourable external factors (Opportunities and Threats respectively). In this study, SWOT analysis was used in a qualitative analysis of internal and external factors that could identify suitable strategies and tactics for improvement and to create new capabilities. SWOT analysis allows FCDB factors to categorise factors in order to compare opportunities with strengths and weaknesses with threats. In the absence of accreditation of certification standards for FCDBs, the SWOT analysis was adapted to use FCDB information from international organisations, with the aim to match the requirements defined internationally with the real situation existing in Australia. The purpose was to gather information that assists FSANZ to accomplish its objectives in the generation and publication of nationally representative nutrient values for foods as consumed in Australia to publish in Australian FCDBs.

14
6. Materials and Methods
6.1. Acquisition of documents
FSANZ provided the following information as part of the review:
1. AUSNUT 2007
- Core Excel Files
- Database Files
- Australian Food Supplement & Nutrient Database, 2007 for estimation of population nutrient intakes (explanatory notes)
- Additional Supporting Documentation such as AUSNUT 2007-AUSNUT 1999 Matching file, brand file and measures database
- Web text
2. NUTTAB 2006
- Food Composition Summary Tables
- Online Version
- Database files
- Explanatory notes
- Other Supporting documentation such as NUTTAB 2006- NUTTAB 1995 matching file, measures file, reference list, frequently asked questions etc
- Web text
3. Food Composition Training Manual
- Food composition summary
- Food composition program work plan
- Nutrition Panel Calculator overview
- Introduction to ANDB
- Introduction to nutrients
- Collection of nutrient data including the Australian Key Foods Program
- Limitations of nutrient data
- Process for developing food records in ANDB including recipe calculations
4. Food Composition Data Quality Manual
- This manual identifies the key activities that influence data quality in FSANZ food composition publications. These include: staff training, food and nutrient selection, sampling, analysis, reporting of results, incorporation of data into FSANZ in-house food compositon data managemetn system ANDB and incorporation of data in FSANZ food composition publciations
- Procedures on training personnel
- Procedures on selecting key foods and nutrients for analysis
- Sampling and preparation procedures such as „Sampling and sample preparation protocol for use in FSANZ analytical programs‟
- Procurement procedures (see below)
- Certificates of analysis
- FSANZ data checking procedures
- FSANZ data up-load spreadsheet for incorporating data into ANDB
- Procedures for incorporating data in FSANZ publications
5. Analytical procurement documents

15
- Request for Tender + attachments
- Contract Agreement between FSANZ and an analytical laboratory + attachments such as food and analyte list, sample purchase and preparation procedures
- Certificates of analysis
6. NUTTAB 2009
- Project summary
- Process for developing food records
- Training material provided to staff on the development of NUTTAB 2009
7. Food Composition Data Management System, ANDB
8. Dietary Modelling Program (DIAMOND) (demonstration of its use)
9. Documents available from 1st OCEANIA FOODCOMP course
10. Minerals in Australian fruits and vegetables a comparison of levels between the 1980s and 2000 (available from http://www.foodstandards.gov.au/newsroom/
publications/ minerallevelsinaustr2428.cfm)
Meetings and Interviews
Meeting and interviews were carried out with the Chief Scientist and Risk Assessment General Manager of FSANZ, the food composition Section Manager, the food composition team, the Food Composition Advisory Group, the FSANZ nutrition discipline group and other relevant Stakeholders. These meetings and interviews were organised to give a comprehensive overview of FSANZ, to determine the interaction between the food composition team and other sections within FSANZ and the interaction between FSANZ, stakeholders and EuroFIR.
The review commenced with a general overview of FSANZ Science Strategy (with Dr Paul Brent, Dr Andrew Bartholomaeus, Judy Cunningham and Janis Baines). It covered a presentation and general overview of Audit and International guidelines.
Interviews
The emphasis in interviews was placed on quality improvement. The following members were interviewed:
Janis Baines – Section Manager
Judy Cunningham – Assistant Section Manager
Renee Sobolewski – Food Composition team leader
Jenny Trudinger – Surveillance team leader
Tracy Hambridge – Dietary modelling team leader (provided an overview of FSANZ dietary modelling activities and DIAMOND database demonstration)
Rainer Reuss and David Ormerod – Harvest project – provided an overview of FSANZ Harvest database redevelopment project (the redevelopment and integration of food composition and dietary modelling data systems)
Dorothy Mackerras – FSANZ Chief Public Health Nutritionist
The interviews focussed on:
ANDB demonstration (Shari Tompsett)
Proficiency Testing Programmes (Jacinta Dugbaza)
Harvest (Rainer Reuss and David Ormerod )
DIAMOND Dietary Exposure Assessments demonstration (Tracy Hambridge)

16
NUTTAB on line version demonstration (Renee Sobolewski)
AUSNUT on line version demonstration (Renee Sobolewski)
International References
To evaluate consistency with international data, the management and technical requirements of the standard - ISO 17025 (ISO, 2005) were used to measure what is feasible and what could be realistically achieved in terms of reliability and comparability of Quality Management System for FCDBs.
EuroFIR specific guidelines are applied to analyse FCDBs from the beginning to the end of the entire process. This includes procedures to determine analytical values and deal with missing, zero, trace, imputed and calculated values, as well as nomenclature for foods and nomenclature and conventions for constituents. A detailed analysis of the compilation process was carried out using the EuroFIR flowchart approach to assess data flow and in-house data management. INFOODS and EuroFIR training contents were applied to appreciate the selection and requirements for staff excellence. Consistency with previous data (old and new data) was checked through the evaluation of methodologies over time used by FSANZ to assess data produced by contract laboratories or data imported from different sources. This was done to identify if variation from previous values is due to artificial procedures (improvements in method performance; rounding; modes of expression etc) or natural food variation changes.
EuroFIR guidelines to assess methods of analysis were used to evaluate compatibility of analytical methods chosen by FSANZ contract laboratories to determine nutrient contents in foods. For each prioritised nutrient, base quantities, units, modes of expression, significant digits and rounding procedures were assessed using international guidelines to assess data capture and data documentation (Burlingame, 2004; Becker, 2002; Schlotke, 2000). Research needs identified by Greenfield & Southgate (2003) were compared with the achievements and requirements described in the FSANZ procedures manual and science strategy. Criteria for data scrutiny were compared with those applied by the USDA, EuroFIR, and Greenfield & Southgate (2003) and include the following parameters: Food Identity (Unequivocal identification of food sampled), Sampling protocol (Collection of representative sample), Preparation of food sample (Cooking method; Precautions taken; edible matter), Laboratory and analytical sample preparation and Quality assurance procedures.
Audits techniques
This review used compliance and operational audits to demonstrate the agreement with international guidelines.
Operational Audits:
Operational audits assess which scientific technical and quality management requirements were established by senior management to guarantee the excellence of work. It includes:
Organisation and management requirements of the staff (qualifications, training, experience)
Implementation, planning and documentation of Data Quality
Recording and implementation of procedures (such as analytical programs and publication development such as NUTTAB)
Analytical methods
Security of archives and records/security of computer recorded data
Accommodation safety precautions of archives (disaster recovery procedures).

17
Compliance audits: Compliance audits evaluate the implementation of good scientific practices by all members in both daily and specific work. This was done under guidance from the FSANZ Food Composition team according to the relevant EuroFIR guidelines, Greenfield & Southgate (2003) and general requirements of INFOODS or EUROFOODS for data management and interchange and follows the criteria:
compliance of FCDBs with general criteria laid down on INFOODS/EUROFOODS data management and interchange
contracting of accredited laboratories or laboratories that have quality assurance procedures in place, such as participation in proficiency testing schemes for food analysis that fits the purpose
selecting nutrient values determined by methods of analysis which have been validated according with principles laid down in international guidelines such as ILAC/AOAC
use of internal quality control procedures for scrutiny, aggregation and compilation of data, such as those described in the relevant international guidelines
selection of key foods and prioritisation of nutrients for analysis.
Operational and Compliance audits were operated through horizontal and vertical procedures.
In this work we use compliance and operational audits to demonstrate agreement with international guidelines. This is an external and co-operative process because both EuroFIR and FSANZ can gain from this work. These advantages were assessed by reading available documents at FSANZ, observing how software works, asking all members of FSANZ Food Composition group, and discussing plans with users and advisers. Terms of references were checked using horizontal procedure. Traceability of nutrient values was verified by vertical audit.
Horizontal Audits: Horizontal audits were carried out by using a check list of EuroFIR requirements for the production and management of food composition data; it includes procedures on the:
integration of original data in the database
production and validation of aggregated and compiled data
dissemination of selected aggregated and compiled data
completeness and representativeness of the data
criteria for Data Quality
development of documentation.
Vertical Audits:
Vertical audit was applied to trace back documentation of nutrient values in key foods. This was done using a randomly selected ANDB Food Summary Report and tracing back to raw data and ancillary information (certificate of analysis, or literature data source).
SWOT Analysis
The SWOT analysis method was used in this review to analyse the current situation concerning the production of FCDBs and to formulate a strategy for reducing artificial variation that occurs in FCDB. Each aspect of the information must be sound, so that the best alternative can be selected. SWOT can be used for the analysis of internal and external environments in order to attain a systematic approach and support for decision making and, if used correctly, it can provide a good basis for successful strategy formulation. It was intended that the SWOT analysis would provide: a framework for analysing a situation and developing

18
suitable strategies and tactics; a basis for assessing core capabilities and competencies; the evidence for and the key to change and success; and a stimulus to participate in an international experience. An activity sheet according with international concepts of food composition tables was used, with each of the items considered listed below:
Strengths
Objectives of FCDB program should be effectively described
Database program should be approved, monitored and updated by a committee
Data should be representative
Data should be of sound analytical quality
Coverage of foods should be comprehensive
Coverage of nutrients should be comprehensive
Food descriptions should be clear
Data should be consistently and unambiguously expressed
Origins of data should be provided at nutrient value level
Tables and databases should be easy to use
The content of databases should be compatible at analytical, compilation and electronic level with international databases
Database should have few missing data
Data should reflect the general state of nutritional thinking including nutrients and bioactives
Personnel should be trained in all aspects of food composition processes
Quality control should be in place for all aspects of compilation processes
Food composition data should be updated on a regular basis
Guidelines for the use of food composition data should be available
User feedback should be incorporated in the database.
Weaknesses
Lack of representative data
Inadequate sampling protocols
Improper choice of method of analysis
Presence of missing values
Most of the values do not fit the purpose
Modes of expression inappropriate
Mis-coding
File formats inappropriate for data interchange
Lack of documentation to trace back values to raw data
Lack of trained personnel
Lack of collaborative studies for compilation process
Lack of advisory board to define food composition program
Lack of users feedback
Lack of criteria for scrutiny of data
Lack of guidelines for the use of food composition data
Lack of guidelines for testing the accuracy of data
Incompatibilities with other databases.

19
Analysis of Opportunities:
A developing market
Mergers, joint ventures or strategic alliances
Moving into new market segments that offer improved profits
A market vacated by an ineffective competitor
Threats:
A new competitor in your home market
Price wars with competitors
A competitor has a new, innovative product or service.
Competitors have superior access to channels of distribution
Taxation is introduced on your product or service

20
7. Results
7.1. The compilation process
The principal goals of the three main types of food composition data activities – analysis, compilation, and dissemination – are different, and the corresponding quality requirements relating to laboratories, compilers, and users are different as well. For compilers, adaptation of conventional quality assurance principles and practices is necessary. Therefore EuroFIR have developed a generic flowchart applicable to each national compiler organisation to ensure the quality of the compilation process. These encompass a series of questions listed below. The answers to these questions are the tools to evaluate the compilation process. FSANZ responses to the questionnaire are described below.
7.1.1. Part I - Integration of original data in the database
1. Decision on which foods/nutrients to be included
For FSANZ‟s last two analytical programs (2006, 2008) the food composition team consulted with a stakeholder advisory group, the food industry and with partner organisations in government, about the foods selected for analysis. Generally the foods selected were those that made the greatest contribution to nutrient intakes, which was determined using FSANZ dietary modelling program, DIAMOND.
The nutrients selected for analysis were one or more of:
those that were to be reported in forthcoming national nutrition surveys
those for which FSANZ had an interest from a standards development viewpoint
those for which new Nutrient Reference Values have been established
where a reliable method of analysis is available with a suitable limit of quantification
where gaps in data previously existed.
2. Collection or production of original data from data sources
In addition to collecting nutrient data through nutrient analysis, FSANZ carries out some literature searches. However, in the past there has not been a lot of data published in the literature that relates to Australian foods, for which FSANZ does not already have analysed data. FSANZ does get some data directly from manufacturer analysis, or from labels depending on the situation and how important it is to have accurate data. The decision to borrow or calculate data are made later in the compilation process, once FSANZ has assessed the data it has and decided where there are important gaps in knowledge. The training material produced has more information on how data from external sources is assessed.
3. Identification and comprehension in the data sources
Traceability of data is difficult where data was imported from FSANZ‟s old data management system (pre-1999) and some of the metadata has been lost.
Where data are taken from literature, or from industry or labels, values are converted manually into units expressed as required in ANDB. This is generally g or mg per 100 g edible portion. Conversions are checked by another compiler later in the compilation process.
4. Attribution of quality index

21
Data quality is difficult to determine in the absence of metadata. Quality assurance (QA) information is not recorded with the data nor is a confidence code (quality index) used. This facility does exist in ANDB, the current system, but has not been used due to IT problems.
There is no requirement for industry data to be accompanied by validation data/accreditation/PT scheme. It is likely if FSANZ did this that the industry would not provide data.
Documentation of analytical methods, limits of quantification (LOQ) and QA requirements for analytical programs are not complete on files received from the contracted laboratory and therefore in ANDB, particularly if the analysis is outsourced to a laboratory that is not accredited.
In the past, accurate recording of descriptions, sampling and ingredients has been incomplete but is now greatly improved. Therefore, to overcome lack of information on older data, the completed food includes description and sampling details fields that provide relevant free text information.
5. Coding of original data
Data received from the laboratory have been assigned a lab reference number. Incoming data are arranged by FSANZ into predefined Excel fields in a FSANZ upload spreadsheet. The fields are named as required for the coding in ANDB. This system also allows free text data to be entered in some fields. See also the FSANZ training material for further information.
6/7/8. Original data entry/keyboarding of import of data files/check on original data entry
Most of the information on levels of nutrients is not re-keyed as it is pasted into the upload spreadsheet from the original laboratory results, which are provided as Excel files. Data errors have arisen from spelling mistakes for text fields and other manual data entry for fields not in the necessary format when received. Now all files are checked before upload by a second compiler. There is also a checking process during the upload where fields have to meet field length and alpha or alpha numeric criteria. Errors are then corrected.
All team members do their data compilation within ANDB as multiple users are able to access it at one time.
FSANZ has identified that more effort needs to be made at this early stage to check incoming data against published data, for example to identify major data errors, such as incorrect identification of fatty acids or sugars.
9. Storage of original data coding and data entry
The ANDB system is backed up every night along with all FSANZ files. The original data provided by the laboratory and the upload spreadsheets are stored outside on the FSANZ file server and are also backed up nightly. At present ANDB does not have the functioning capacity to store files of incoming data, but has limited capacity to store photographs of food.
10. Physical storage of original data
Books and paper copies of laboratory and literature reports are stored in a central area. This information is also stored in official paper files when data are compiled for publication.
7.1.2. Part II - Production and validation of aggregated and compiled data
11. Extraction of all original data available

22
ANDB stores all original data in one area. These data can be edited and can be copied. During compilation and aggregation, compilers are supposed to check that the original data are entered correctly (see training materials for further information). It is difficult for staff to access other database tools (such as Microsoft Access) to manipulate data - this is due to lack of staff training as well as incompatibility with the program code in ANDB.
Traceability of data is complicated through the need to copy the original nutrient data for each new publication to change/amend source data. There is no ability to include/exclude individual values are at the FAI nutrient data level (i.e. at the database level where data are stored in records that may contain 20 or more individual nutrient values). There is no ability at the food level (i.e. at the data compilation level), which means it can be difficult to see the layer of copying in the current system. It can be difficult to determine the origin of old data (pre 2000).
12. Selection of original data to produce aggregated data
Further information about the criteria to accept data for inclusion in aggregated data is provided in FSANZ staff training materials. Particular attention is paid to ensuring FSANZ staff aggregate data for the same food. In terms of recipes, a more standardised approach would be an improvement, but the training material provided to staff does provide information on the approach that should be used for recipe development. FSANZ retention factors and yield data could be also be improved.
FSANZ sometimes finds it difficult to determine when to replace old data with new data. In general, FSANZ checks that the formulation, variety, production conditions etc have not changed significantly, and that the method of analysis has not changed, before aggregating old and new data. For example, FSANZ are aware that sodium values have changed substantially in the last 10 years so choose newer data for salted foods, rather than combining the new data with the old data.
13. Selection of algorithms
ANDB contains in-built algorithms for the calculation of mean values, values adjusted to set moisture content, calculation of protein from nitrogen, and fatty acids on a mass basis from fatty acids as a percentage of all fatty acids, for recipe calculation etc. These algorithms have been in place for many years and have been manually verified.
ANDB also allows the writing of equations to calculate, for example, energy or niacin equivalents.
14. Application of algorithms to produce aggregated and compiled data
ANDB does not have any statistical capability beyond calculation of the mean. FSANZ does not have the ability to produce standard deviations or to report ranges from within ANDB.
15. Validation of aggregated and compiled data
All compiled data are checked by the team leader. After all data have been compiled, there are a range of checks applied to the entire data set, such as checking for blank values, checking equated values, checking ranges of values etc. Checking of nutrient intakes happens in a separate process but there is attention paid to the likelihood of a compiled value being representative and accurate (see training materials for further information). Random records will be selected and checked in detail. FSANZ‟s most recent database was sent to the New Zealand food composition team for checking. Some sets of data may also be referred to industry or other experts for assessment.

23
16. Correct errors and inconsistencies identified in step 15
The team leader will ask compilers to fix identified errors. If errors cannot be corrected, the record is generally removed from publication, or some nutrient values may be removed. Once corrected these food records will be checked again. FSANZ also has a process for recording user-identified errors, so that errors can be corrected before the next publication.
17. Determine confidence code of aggregated values
FSANZ does not currently assign confidence codes due to lack of information on old data and difficulties with the operation of this part of ANDB. FSANZ provides text information in the sampling details field to highlight particular problems with the food record. FSANZ also assigns a source code to each published record to indicate the origin of the majority of data (e.g. borrowed, analysed, recipe etc).
18. Storage of aggregated and compiled data
ANDB stores all this information. FSANZ also has copies of released versions of data on the FSANZ file server and website (for the most recent publications only).
7.1.3. Part III - Dissemination of selected aggregated and compiled data
19. Selection of aggregated/compiled data for publication
The selection of nutrients happens early in the publication process, but individual nutrients in individual foods may be excluded during the compilation process if unresolved problems are found in the data during checking.
The selection of foods and nutrients will depend on the nature and purpose of the publication. The range of files produced can be seen on the FSANZ website. All files are checked carefully after production and before release.
20. Storage of data for dissemination
See above.
21. Dissemination of data
The range of files produced can be seen on the FSANZ website. The availability of new data is advertised through a range of means, including email alerts.
7.2. Quality Concepts applied to Australian Tables
The need for quality management systems to be applied to FCDBs has emerged recently due to the success of the quality management principles and tools applied in most areas of food sciences and food industry (Wood, 2004). In fact, the elements of Quality Management have been very useful to reassure the users of the credibility of the work and their transparency. More or less formally, the elements of quality management systems have been implemented worldwide in food industry (Australia).
Quality Systems for FCDBs should be included in the management of activities that design, control, improve and assure the production of high quality FCDBs (Castanheira, 2009; Greenfield, 2003). Quality Systems can be critical, time consuming and even conflicting, and therefore producers of FCDBs need to decide which quality elements are most suitable for their specific activities. Taking into account the contribution of quality systems in other food related areas, quality systems are effective when quality of the final products can be ensured
24
to the satisfaction of users (Spiegel, 2006; Robins, 2006). As food composition data uses concern both health and trade, they should comply with specific quality requirements to prove the reliability and credibility of the results and to permit traceability of data over time.
In terms of FCDBs at the international level, the aim is to obtain consensus on quality requirements at food level, component level and value level, as well as at the data management level, in order to promote the interchange of data. The purpose of this is to reduce artificial differences when calculating and comparing nutrient intakes based on different food composition datasets, thus addressing the issues set by FAO/WHO and European policies and regulations (FAO/WHO, 2002).
There are several tools and principles of interest that can be used in FCDBs. The excellence of the table between compiler networks refers to the excellence of the work (in terms of results and progress of knowledge), which is usually evaluated by peers through different processes (acceptance by users, matching the needs in terms of reliability and accuracy of data). The other item is the quality management principles in terms how the compilation process is conducted to improve and guarantee excellence over time. In this audit the quality management elements already accepted at international level have been used (Castanheira, 2009).
The first step was to make a cross reference table that outlined the accepted quality management requirements in use internationally and the available documentation at FSANZ. The results are presented in Tables 1 and 2. Projects and procedures are in place to develop the activities from a detailed program of activities that includes the definition of roles and responsibilities of technical and management issues, a process to evaluate data quality, training manual, purchasing services from laboratories, service to the clients (here designated as users of NUTTAB and AUSNUT). FSANZ contains most of the necessary documentation and procedures in place, although some requirements are not yet covered.
Complaints are not considered in a formal way at FSANZ, although they can be very useful. The complaints records can be a tool to improve FCDBs since they can reflect the users‟ needs. Complaints when formulated in a constructive way can improve the fit for purpose because they reflect user and stakeholder needs.
Non-conformity is another element included in a voluntary basis, non-conformity is defined as a difference with regard to the explicit and implicit specifications of the quality manual or other relevant documents. Non-conformity deals with the practical work and with day to day work. It can be especially useful in the case of FSANZ that has some workers employed on a temporary basis. Comparing the work done by trainees or temporary staff and the quality manual or in written instructions could reduce in a systematic way the artificial differences, if any, such as mis-coding, and keyboarding errors.
There are no formal documents concerning preventive actions at FSANZ despite some of projects like NUTTAB 2009 identifying the strategic risks in not proceeding with the update project. In EuroFIR preventive actions were considered items that in the past caused failure in comparability (Slimani, 2007). This led EuroFIR to identify pre-requirements for each project that encompasses the update of national FCDBs. Preventive actions mean a set of actions to avoid proceeding with the same errors and should take in the following issues: coding (mis-coding), official methods of analysis and update methods of analysis to ensure that values match the real values, modes of expression and units according with international guidelines to guarantee that values can be interchanged, documentation and document control to guarantee traceability of results, and quality control of software to allow electronic data interchange.
Overall results of the cross reference tables indicated that despite a non-formal Quality Management system, FSANZ has implemented most of the quality management elements to guarantee the credibility of the values entered in the FCDB.

25
Table 1 - Cross Reference Table: Quality Management Essential Requirements and
Management Document in FSANZ (1)
Designation FSANZ Document
ORGANISATION Yes
QUALITY SYSTEM Coherence and structure documentation Defined roles and responsibilities of technical
management
Yes Summary of food composition team projects and responsibilities.
DOCUMENT CONTROL Procedure for control of quality documents
(internal and external) Approval, issue and changes
No Food Composition Program Overview
REVIEW OF REQUESTS, TENDERS AND CONTRACTS Procedure Evaluation aspects, control of contract changes
and records of reviews Coordination of review activities
Yes
Request for Tender, Tender submissions, Contract Agreement (example agreement provided)
SUBCONTRACTING OF TESTS Register of approved subcontractors Records of evidence that subcontractors comply
with the standard
Yes
Information submitted as part of Tender submission and included in Contract Agreement
PURCHASING SERVICES AND SUPPLIES Policy and procedure Inspection/verification of purchased supplies Evaluation of suppliers and records of
evaluations Review and approval of purchasing documents
Yes
Request for Tender, Tender submissions, Contract Agreement provided for Australian Key Foods Program
SERVICE TO THE CLIENT Cooperation with clients if clients request for monitoring the performance
Yes
Email and phone enquiries, online feedback forms. Explanatory notes for use with the on-line databases such as NUTTAB
COMPLAINTS Policy and procedure Records of complaints
No Informal mechanisms are email correspondence and Feedback forms
CONTROL OF NONCONFORMING TESTING Policy and procedure Responsibilities and authorities Evaluation of significance of non conformance
No

26
Table 2 - Cross Reference Table: Quality Management Essential Requirements and
Management Document in FSANZ (2)
Designation FSANZ Comments
CORRECTIVE ACTION Policy and procedure Cause analysis, selection and
implementation, monitoring and additional audits responsibilities and authorities
No
PREVENTIVE ACTION Procedure and action plans
No
CONTROL OF RECORDS Policy and procedure: identification, storage, protection, etc of quality and technical records (also electronic records) Protect and back-up of electronically stored
records; requirements applicable for technical records
Yes
Instructions on how to develop food records using ANDB developed specifically for each publication
INTERNAL AUDITS Procedure: Audit programme Qualified personnel Records of audits Corrective actions
Yes This document
MANAGEMENT REVIEW Procedure: Schedule and records reviews
Yes Publication updates such as NUTTAB 2009
PERSONNEL Policy and procedure for identification of
training needs Training programme Current job descriptions Records of all technical personnel
Yes Training manual Participation in external courses
SAMPLING Procedures and sampling plan Records Procedure for intermediate checks
Yes Sampling and sample preparation protocol for use in FSANZ analytical programs
METHODS AND METHOD VALIDATION Appropriate methods and procedures
Yes Nutrient cheat sheet List of common equations
ASSURING DATA QUALITY Procedures for monitoring the validity of tests and calibrations undertaken
Yes Food Composition – Data quality manual

27
7.3. Selection of Data Sources
In this chapter we have the objective of assessing how FSANZ data are derived. At FSANZ the following methodologies are used: the development of analytical programs; liaison with the food industry; borrowing data from international food tables and databases; label and manufacturer web-site data; imputation/estimation/calculation; equations; and recipes. The derivation of the data will vary according to the publication being developed.
The Australian documents were compared with international guidelines (Williamson, 2007). The results concerning the sources of Food Composition Data are presented in Figure 1 and Figure 2 for NUTTAB 2006 and AUSTNUT 2007 respectively.
Analytical data:
As NUTTAB 2006 is a reference database, more than 80% of the values in the database are assimilated directly from laboratory sources unmodified, or as a selection of aggregate analytical values providing representative final values. Original values such as protein values, fatty acids, are included in this. As AUSNUT 2007 is a national nutrition survey database it contains less analysed data.
Food Industry:
Only a small portion of data is obtained from the food industry. This is important to guarantee the linking with industry and demonstrates FSANZ has quality control procedures to scrutinise data. Data available from industry sources can contain compositional values of different quality levels reflecting different purposes.
Borrowed data:
FSANZ publications contain data borrowed from United States, Danish, British, New Zealand and German databases. This reflects values taken directly from countries for imported food and the values are reliable and original. These tables have the highest level of quality. This avoids duplication of work and guarantees that original sources are preserved.
Calculated/estimated:
Appropriate yield factors and retention factors are applied in FSANZ tables. FSANZ used their own factors based on literature and analytical data in some cases.
Recipes:
Around 11 % of nutrient sources in NUTTAB 2006 are derived from recipe calculation and 37% in AUSNUT 2007. This is consistent with other FCDBs.
Old data: FSANZ considers the update of old data as crucial and less than 5% are data from 1995 or earlier.

28
Figure 1 - Results concerning the sources of Food Composition Data in NUTTAB 2006.
Figure 2 - Results concerning the sources of Food Composition Data in AUSNUT 2007

29
7.4. Key Foods and Sampling Strategies
Conventional criteria to evaluate the data present in FCDBs includes whether the data is fit for the purpose for which it is being used. This incorporates the concept of representativeness (Burlingame, 2004). The development of food sampling strategies implies foods are statistically representative of the universe of values including the food group. This concept encompasses key foods, which are foods consumed by a large proportion of the population and that contain some amount of the component, and more closely related to eating habits.
According to Southgate (Southgate, 2004) sampling is one criterion of Data Quality and this implies that values generated are representative, as close as possible, of the eating habits of that country. The design of sampling protocols using (or not) stratification by region or by population group, has to include the knowledge of how to handle food, information and background on component variability: by season (e.g. vitamin C in some fruits), region (e.g. lamb meat variability according to omega 3 fatty acids content); and representative food in terms of total fat, protein, carbohydrate.
Guidelines and papers (Southgate, 2004; Holden, Bhagwat & Patterson, 2002; Greenfield & Southgate, 2003) were used to assess sampling strategies applied by FSANZ. The sampling protocol to collect foods consumed in Australia defines the responsibilities of the project officer, sample purchasing officer, and sample preparer. The procedures include the selection of the types of food: raw, processed and special foods (infant foods). The manual designated the selection of sampling site, sample and brands of products or labelling products when necessary. Special attention is dedicated to the description of the sample in order to trace back all information. Sample preparation procedures and identification, laboratory handling, cooking, homogenisation, and sample storage and sample photography are other items included in the documents.
The strategies used by FSANZ are collated in Figure 3. The scheme present in figure 3 was elaborated after analysis of FSANZ ancillary files and sampling manual for the Key Foods program. In the way that FSANZ defines protocols in collaboration with epidemiologists, nutritionists and health public organisations, we can conclude that FSANZ has an adequate protocol in terms costs/benefits.

30
Figure 3 – Schematic representation of a sampling plan - Foods that contribute largely to intake of nutrient should be over sampled as compared to foods with low contribution (formalized in procedures)

31
7.5. Selection of Nutrients
Availability of Prioritised Nutrients
The FCDBs include a large variety of nutrients and associated components, in order to obtain comparable nutrient intake values, especially in an international level multi-centre study where standardisation is important. One of the principles of EuroFIR is that there should be no restriction in including compositional data as long as the components are properly defined and described, e.g. included in a thesaurus like definition of fibre or fat or vitamins.
Therefore, a list of prioritised nutrients was created taking into account the nutrient lists existing at European and American Legislation or other reference and normative documents. The list of prioritised nutrients is used widely by the scientific community to monitor food intakes, to conduct nutrition research, to develop food and nutrition policy, or used as the basis of other databases worldwide.
To evaluate if NUTTAB 2006 and AUSNUT 2007 are in accordance with international guidelines concerning availability, a cross reference table was created. We have set up the nutrient list according to the structure of Greenfield & Southgate (2003). The results are presented in Tables 3 and 4.
As we can observe, NUTTAB 2006 and AUSNUT 2007 cover all prioritised nutrients. The most important macronutrients, minerals, vitamins and fatty acids are well covered in NUTTAB 2006, but bioactive compounds are not stated or stated for very few records. As AUSNUT 2007 is a national nutrition survey database it only contains the nutrients of interest as part of the survey.
The results indicate that the Australian list of nutrients is a comprehensive list containing all nutrients with national and international interest to which recommended intakes are stated.
The proximate list covers all nutrients. Alcohol (ethanol) is not presented in EC Directives, DACH and NNR, however FSANZ FCDB covers this component. Most European countries do not have data on polyols or organic acids, and FSANZ does. This is a good opportunity to include these data on European tables of countries that import Australian goods.

32
Table 3 - Cross Reference Table EuroFIR and FSANZ prioritised nutrients in NUTTAB 2006 (1)
Name European countries
EPIC EC
Directives NNR 2004
DACH 2000
US DRI
(1975-2000) FSANZ
Proximates
Alcohol x x x x X
Ash x x X
Carbohydrate available
x x x x x x x
Energy calculated
x x x x x x x
Fat x x x x x x x
Fibre total x x x x x x x
Protein x x x x x x
Starch x x x x
Sugars, total x x x x
Sugars, individual x x x
Organic acids x x
Polyols x x
Water x x x x x x
Fatty acids and Cholesterol
Cholesterol x x x x x x
n-3 fatty acids x x x x
n-6 fatty acids x x x x
Monounsaturated fatty acids, MUFA
x x x x x x x
Polyunsaturated fatty acids PUFA
x x x x x x x
Saturated fatty acids, SFA
x x x x x x x
Trans-fatty acids x x x *
Minerals and trace elements
Calcium x x x x x x x
Copper x x x x x
Chloride x
Chromium x x x
Fluoride x x
Iodine x x x x x
Iron x x x x x x x
Manganese x x x x
Magnesium x x x x x x x
Molybdenum x x x x
Phosphorus x x x x x x x
Potassium x x x x x x
Selenium x x x x x
Sodium x x x x x x x
Zinc x x x x x x
*Trans fatty acids to be included in the next edition of NUTTAB

33
Table 4 - Cross Reference Table EuroFIR and FSANZ prioritised nutrients in NUTTAB 2006 (2)
Name European countries
EPIC EC
Directives
NNR
2004
DACH
2000
US
DRI
(1975-2000)
FSANZ
Vitamins
Beta Carotene
x x x x
Retinol x x x x x x
Riboflavin x x x x x x x
Niacin x x x x x x
Folate x x x x x x
Thiamin x x x x x x x
Vitamin B12 x x x x x x x
Vitamin B6 x x x x x x x
Vitamin C x x x x x x x
Vitamin D x x x x x x x*
Vitamin E x x x x
Vitamin K x x x x x x
Biotin x x x x*
Choline x
Pantothenic acid
x x x x
*Database contains only a small number of records for these nutrients
There is a lack of data on omega 3 and omega 6 fatty acids in some European countries. FSANZ has data for important foods in NUTTAB 2006 and AUSNUT 2007 which is a great advantage.
The list of inorganic elements covered most of the gaps observed in European tables with special case of fluoride and manganese, with most data obtained from analytical sources determined in original Australian foods and beverages.
Vitamin E, and biotin are not part of nutrient lists in several countries. They are included in FSANZ which is a great advantage. From the results presented in Table 4 we can observe that FSANZ has a unique databank that has data for all vitamins, despite vitamin D contents being expressed as a total and not the different forms in AUSNUT1, and where most of them are analytical values obtained from key analytical foods.
1 Note that NUTTAB provides data on the individual vitamin D forms for a limited number of foods

34
7.5.1. Bioactive compounds
There are several definitions published for bioactive compounds. In FCDBs, they are considered to be plant food and edible mushroom constituents with anticipated health promoting effects (Moller, 2007). Bioactive compounds are found in small quantities in foods. They include various classes of phytochemicals: flavonoids, glucosinolates, phenolic acids and carotenoids. Plausible mechanisms for the beneficial health effects of phytochemicals include: the antioxidant capacity; modification of hormonal profile; anti-inflammatory effects; and modification of lipid profile (Ortega, 2006).
Hydroxytyrosol, one of many phenolics in olives and olive oil, is a potent antioxidant. Resveratrol, found in nuts and red wine, has antioxidant, antithrombotic, and anti-inflammatory properties, and may inhibit carcinogenesis. Lycopene, a potent antioxidant carotenoid in tomatoes and other fruits, is thought to protect against prostate and other cancers, and inhibits tumor cell growth in animals. Organosulfur compounds in garlic and onions, isothiocyanates in cruciferous vegetables, and monoterpenes in citrus fruits, cherries, and herbs have anticarcinogenic actions in experimental models, as well as cardioprotective effects (Scalbert, 2005).
The various compounds, sub-classes, and classes, have different properties, but in most cases their precise biological function in humans is as yet unknown. Therefore much scientific research needs to be conducted before governments can begin to make decisions on science-based dietary recommendations (Ferguson, 2009).
Future areas of investigation have been identified in the field of human nutrition and analytical chemistry. Knowledge of the absorption, distribution and metabolism of plant derived substances is crucial to understand their bioavailability (Lichtenstein, 2008). Another problem in getting sufficient evidence to identify the health benefits of bioactive compounds is the lack of information available about the content and concentrations of these substances in foods.
Information about food sources and concentrations of these bioactives is not always easy to find and data are often inconsistent and incomplete. Metrological tools (PT schemes, accredited laboratories and reference materials) are not available (Holden, 2005; Moller, 2007).
To ensure that the available information is easily accessible, America and Europe have built up datasets on bioactive compounds and associated quality indices are presented, on USDA and EuroFIR websites (EuroFIR, 2009; USDA, 2009). The comprehensive databanks are based on scientific publications, most of which are carried out by laboratories and scientists involved in FCDB production (Holden, 2005). The contents of these datasets are listed in Table 5.
The creation of a dataset for Bioactive Compounds in Australian foods is advisable. FSANZ can provide scientific contributions in both areas of food composition, including the creation of datasets to help the scientific community to understand the health benefits of foods containing bioactive compounds and in the field of data quality. The contribution could include a co-operation with an Institute of Functional Foods and with an analytical laboratory to produce in parallel a metrological program to support the analytical data to be included in these datasets (production of certified reference material, method accreditation and PT schemes). This would lead to the creation of dataset with a unique feature in the world.

35
Table 5 - Bioactive Compounds
Name USDA BASIS - EuroFIR FSANZ
Isoflavonoids USDA Database on the Isoflavone Content of Selected Foods
Yes No
Proanthocyanidins Yes Yes No
FLAVONOLS:
Quercetin, Kaempferol, Myricetin, Isorhamnetin
USDA Database for the Flavonoid Content of Selected Foods, Release 2.1 (2007)
Yes No
FLAVONES:
Luteolin, Apigenin
USDA Database for the Flavonoid Content of Selected Foods, Release 2.1 (2007)
Yes No
FLAVANONES: Hesperetin, Naringenin, Eriodictyol
USDA Database for the Flavonoid Content of Selected Foods, Release 2.1 (2007)
Yes No
ANTHOCYANIDINS: Cyanidin, Delphinidin, Malvidin, Pelargonidin, Peonidin, Petunidin
USDA Database for the Flavonoid Content of Selected Foods, Release 2.1 (2007)
Yes No
7.6. Methods of analysis
Food compilation organisations have to demonstrate technical competence in a wide variety of areas including methods of analysis. Previous investigations dedicated to comparison of nutrients available in FCDBs (Southgate, 2000) have identified that the selection of analytical methodology is a key factor in data quality required for interpretation, description and exchange of nutrient food data. This is particularly important in the case of multicenter studies and in the case of imported data from other FCDBs and comparability of national data over time. During the compilation process the aggregation of data from different sources requires compatibility of methods of analysis for values to be aggregated (ENDB, 1999).
For each nutrient several methods are described with different principles. For example, minerals: ICP OES/AAS; iodine: colorimetric versus ICP/MS; total nitrogen: Kjeldahl/Dumas method, Dietary Fiber: Prosky method/ Englyst method (Greenfield & Southgate 2003, Codex standards). This obliges the compiler to demonstrate skills to evaluate the performance of method parameters (reproducibility, repeatability, Limit of Quantification/Detection, selectivity, sensitivity, accuracy, robustness) and the performance of specific laboratories (participation in proficiency tests, the internal quality control procedures and the use of appropriate reference material) in order to decide the suitability of analysis for different food matrices.
Furthermore, auditing methods of analysis has the aim of demonstrating that Australian compilers have flexible tools to evaluate the quality of the data obtained by the so called in-house methods that might include modifications in key method steps, e.g. extraction, separation, detection, quantification. At the global level, compatibility of methods of analysis for macronutrients, minerals, and vitamins is needed to assess diet- disease relationships and to establish preventive dietary practices and to define and monitor nutrient recommended daily intakes (Holden et al, 2002). This is particularly relevant in the case of contracts with a laboratory that offers in house methods. The purpose of this section is to demonstrate that FSANZ has installed capabilities to make a rational evaluation of the scope, principles and key parameters of the methods available to analyse a specific nutrient and to reject or accept data

36
using sound principles to assess the appropriateness or adequacy of method principles, limitations and cost/benefits.
A reference table comparing the methods used by FSANZ contracted laboratories and international available methods (EuroFIR/Castanheira) was created and is presented in Table 6.
As we can observe most of the nutrients have been analysed using an internal method compatible with international methods of analysis. Although for vitamin D, a method with higher selectivity able to separate the three main forms and a lower limit of detection performed by an accredited laboratory is recommended.

37
Table 6 - Cross reference table: Components included in AUSNUT 2007 and NUTTAB 2006 and EuroFIR gold standards: Proximates
Nutrient EuroFIR Gold Standard FSANZ methods
New data (after 2000)
Alcohol
COMMISSION REGULATION (EEC) No 2676/90 of 17 September 1990 determining Community methods for the analysis of wines COMMISSION REGULATION (EC) No 2870/2000 of 19 December 2000 laying down Community reference methods for the analysis of spirits drinks
Not undertaken since 2000
Ash Ash. Gravimetric Determination in Foods. Method No. 173. Oslo: NKML, 2002
Same principle
Protein Nitrogen. Determination in foods and feeds according to Kjeldahl. Method No.6. Oslo: NKML, 1976
Same method
Fibre, total AOAC-AACC Method Codex Adopted Method (AOAC 985.29) Total dietary fiber. Gravimetric determination after enzymatic degradation in foods (AOAC NMKL method).
Same method
Starch
Commission Regulation (EEC) No 4154/87 of 22 December 1987, Starch and glucose. Enzymatic determination in foods. Method No. 145. Oslo: NKML, 1994, 2nd Ed
Same principle
38
Table 7 - Cross reference table: Components included in AUSNUT2007 and NUTTAB 2006 and EuroFIR gold standards: Fat, Fatty Acids and Cholesterol
Nutrient EuroFIR Gold Standard
FSANZ methods New data
(after 2000)
Cholesterol AOAC 994.10 - Cholesterol in Foods Internal method according with AOAC method
Fat
Fat. Determination in foods. Method No 160. Oslo: NKML 1998 Fat. Determination of content in milk by the Gerber Method No 40 Oslo: NKML 1961 Fat. Determination according to SBR in meat and meat products. Method No 131 Oslo: NKML 1989
Internal method based on AS 2300.1.3. AOAC 16
th
Edition 95402,948.15,922.08 or AOAC International.16th Edition, 1995, Sections 920.39, 960.39 and 948.22.
Fatty acids
Reference methods: Bligh & Dwyer, “A Rapid Method of Total Lipid Extraction and Purification”, Can.J. Biochem. Physiol., 37, 911-917 Badings & Dejong (1983). J. Chrom., 279, 493-506. Internal standard not used

39
Table 8 - Cross reference table: Components included in AUSNUT 2007 and NUTTAB 2006 and EuroFIR gold standards: Minerals
Nutrient EuroFIR Gold Standard
FSANZ methods
New data
(after 2000)
Calcium AOAC 984.27 – ICP-OES Calcium, Copper, Iron, Magnesium, Manganese, Phosphorus, Potassium, Sodium, and Zinc in Infant Formula
Internal method according with EUROFIR method
Copper
ISO 17294:2003: Water quality - Application of inductively coupled plasma mass spectrometry (ICP-MS) - Part 2: Determination of 62 elements ISO 11885: 2007 Water quality - Determination of selected elements by inductively coupled plasma optical emission spectrometry (ICP-OES) EN 14084:2003 Foodstuffs - Determination of trace elements - Determination of lead, cadmium, zinc, copper and iron by atomic absorption spectrometry (AAS) after microwave digestion EN 14082:2003 Foodstuffs - Determination of trace elements - Determination of lead, cadmium, zinc, copper, iron and chromium by atomic absorption spectrometry (AAS) after dry ashing
Internal method according with EUROFIR method
Iron
ISO 17294:2003: Water quality - Application of inductively coupled plasma mass spectrometry (ICP-MS) - Part 2: Determination of 62 elements
ISO 11885: 2007 Water quality - Determination of selected elements by inductively coupled plasma optical emission spectrometry (ICP-OES)
AOAC 984.27 – ICP-OES Calcium, Copper, Iron, Magnesium, Manganese, Phosphorus, Potassium, Sodium, and Zinc in Infant Formula
EN 14084:2003 Foodstuffs - Determination of trace elements - Determination of lead, cadmium, zinc, copper and iron by atomic absorption spectrometry (AAS) after microwave digestion
EN 14082:2003 Foodstuffs - Determination of trace elements - Determination of lead, cadmium, zinc, copper, iron and chromium by atomic absorption spectrometry (AAS) after dry ashing
Internal method according with EUROFIR method

40
Table 9 - Cross reference table: Components included in AUSNUT and NUTTAB and EuroFIR gold standards: Minerals
Nutrient EuroFIR Gold Standard
FSANZ methods New data
(after 2000)
Magnesium
ISO 11885: 2007 Water quality - Determination of selected elements by inductively coupled plasma optical emission spectrometry (ICP-OES) AOAC 984.27 – ICP-OES Calcium, Copper, Iron, Magnesium, Manganese, Phosphorus, Potassium, Sodium, and Zinc in Infant Formula ISO 17294:2003: Water quality - Application of inductively coupled plasma mass spectrometry (ICP-MS) - Part 2: Determination of 62 elements prEN 15505 Foodstuffs - Determination of trace elements - Determination of sodium, magnesium and calcium by flame atomic absorption spectrometry (AAS) after microwave digestion
Internal method according with EUROFIR method
Manganese
ISO 11885: 2007 Water quality - Determination of selected elements by inductively coupled plasma optical emission spectrometry (ICP-OES) AOAC 984.27 – ICP-OES Calcium, Copper, Iron, Magnesium, Manganese, Phosphorus, Potassium, Sodium, and Zinc in Infant Formula
Internal method according with EUROFIR method
Potassium
ISO 17294:2003: Water quality - Application of inductively coupled plasma mass spectrometry (ICP-MS) - Part 2: Determination of 62 elements AOAC 984.27 – ICP-OES Calcium, Copper, Iron, Magnesium, Manganese, Phosphorus, Potassium, Sodium, and Zinc in Infant Formula
Internal method according with EUROFIR method
Phosphorus
Phosphorus. Spectophotometric determination after dry ashing in food- Method No. 57. Oslo: NKML, 1994. AOAC 984.27 – ICP-OES Calcium, Copper, Iron, Magnesium, Manganese, Phosphorus, Potassium, Sodium, and Zinc in Infant Formula
Internal method according with EUROFIR method

41
Table 10 - Cross reference table: Components included in AUSNUT and NUTTAB and EuroFIR gold standards: Minerals
Nutrient EuroFIR Gold Standard
FSANZ methods
New data
(after 2000)
Zinc
ISO 17294:2003: Water quality -- Application of inductively coupled plasma mass spectrometry (ICP-MS) -- Part 2: Determination of 62 elements
ISO 11885: 2007 Water quality -- Determination of selected elements by inductively coupled plasma optical emission spectrometry (ICP-OES)
AOAC 984.27 – ICP-OES Calcium, Copper, Iron, Magnesium, Manganese, Phosphorus, Potassium, Sodium, and Zinc in Infant Formula
EN 14084:2003 Foodstuffs - Determination of trace elements - Determination of lead, cadmium, zinc, copper and iron by atomic absorption spectrometry (AAS) after microwave digestion
EN 14082:2003 Foodstuffs - Determination of trace elements - Determination of lead, cadmium, zinc, copper, iron and chromium by atomic absorption spectrometry (AAS) after dry ashing
Internal method according with EUROFIR method

42
Table 11 - Cross reference table: Components included in AUSNUT 2007 and NUTTAB 2006 and EuroFIR gold standards: Vitamins
Nutrient EuroFIR Gold Standard FSANZ methods
New data (after 2000)
β Carotene EN 12823-2:2000 Foodstuffs - Determination of vitamin A by high performance liquid chromatography - Part 2: Measurements of Beta-carotene
Internal method with the same principle (data after 2000) Before 2000 method not comparable
Folate EN 14131:2003 Foodstuffs - Determination of folate by microbiological assay
Same principle
Niacin prEN 15652 Foodstuffs - Determination of niacin by HPLC
Same principle
Retinol EN 12823-1:2000 Determination of vitamin A by HPLC - Part 1: Measurements of all-trans-retinol and 13-cis-retinol
Same principle
Riboflavin EN 14152:2003 - Foodstuffs – Determination of Vitamin B2 by HPLC
Same principle
Thiamin EN 14122:2003 Foodstuffs- Determination of vitamin B1 by HPLC
Same principle
Biotin prEN 15607 Foodstuffs - Determination of d-biotin by HPLC
Not conducted since 2000
Vitamin A EN 12823-1:2000 Determination of vitamin A by HPLC - Part 1: Measurements of all-trans-retinol and 13-cis-retinol
Same principle
Vitamin B6
ENV 14164:2002 Foodstuffs - Determination of vitamin B6 by HPLC ENV 14166:2001 Foodstuffs - Determination of vitamin B6 by microbiological assay EN 14663:2005 - Foodstuffs - Determination of vitamin B6 (including its glycosylated forms) by HPLC
Same principle
Vitamin B12 AOAC 992.07 (Codex recommended method) Pantothenic acid in milk – based infant formula Lactobacillus plantarum
Same principle
Vitamin C EN 14130:2003 Foodstuffs - determination of vitamin C by HPLC
Same principle
Vitamin D
EN 12821: 2000 - Foodstuffs - Determination of vitamin D by high performance liquid chromatography - Measurement of cholecalciferol (D3) and ergocalciferol (D2)
Low resolution method
Vitamin E
EN 12822:2000 Foodstuffs - Determination of vitamin E by high performance liquid chromatography - Measurement of alpha-, beta-, gamma-, and delta-tocopherols
Same principle
Vitamin K EN 14148:2003 Foodstuffs - Determination of vitamin K1 by HPLC
Not conducted by FSANZ

43
Table 12 - Cross reference table: Compatibility of methods of analysis according with Deharveng (1999) and Greenfield & Southgate (2003)
Nutrient Before 2000 comparability with recent
methods Onwards from 2000
Alcohol Valuable Valuable
Ash Valuable Valuable
Calcium Valuable Valuable
β Carotene Values obtained before 1999 not comparable Valuable
Cholesterol Valuable by GC or calculation Valuable by GC or calculation
Copper Valuable Valuable
Fat Valuable Valuable
Iron Valuable Valuable
Fibre, total Valuable if AOAC method Valuable
Folate Values are not comparable Valuable
Potassium Valuable Valuable
Magnesium Valuable Valuable
Sodium Valuable Valuable
Niacin Cyanogen bromide not comparable with HPLC Valuable
Phosphorus Valuable Valuable
Protein Valuable Valuable
Retinol Column chromatography not comparable Valuable
Riboflavin Valuable Valuable
Starch Valuable
Thiamin Valuable
Vitamin B6 Valuable if values for all different forms Valuable
Vitamin B12 Valuable
Vitamin C Titrimetry should give somewhat lower Valuable
Vitamin D Poor resolution Poor resolution
Vitamin E Poor resolution Valuable
Zinc Valuable Valuable
Biotin Not conducted since 2000
Iodine Colourimetry LoD higher ICP-MS Valuable
Manganese Valuable Valuable
Amino acids Valuable
Sugar alcohols
Valuable
44
7.7. Laboratory Selection
The requirements for nutrient measurements are increasing both with regard to the complexity of the requirements used to understand diet-disease inter-relationships (e.g. identification of carotenoids and retinol instead of total vitamin A or food folates and folic acid instead of total folate) and the sophistication of the measurement (e.g. applying chromatographic methods instead of colorimetric or microbiological methods). Moreover the compulsory use of quality management systems in official laboratories for several food components was highlighted by the relevance of traceability measurements to achieve and guarantee compatibility of analytical values produced by several laboratories or by the same laboratory over time in the field of component analysis.
Under the above circumstances the criteria to select laboratories to produce analytical data is crucial. In Europe some countries consider accredited laboratories as compulsory. In America (USA and Canada) the ISO 17025 recognition by a third party is not mandatory although all the technical requirements described in ISO 17025 are required for contract laboratories. Meanwhile in America the Data Quality Assessment System to evaluate data obtained from literature considers laboratory performance as one of the key data quality criteria.
The Australian FCDB have been reviewed considering the above statements and the international guidelines. The results from Table 13 show that two components are analysed by laboratories without accreditation for these methods: Vitamin D and Vitamin B6.
We could observe that the analytical values are obtained from laboratories which hold ISO 17025 NATA accreditation on the appropriate scope. This is a guarantee that values entered in Australian FCDB are in compliance with the metrological principles and practices and quality assurance requirements established at international level.
A good example is the folic acid fortification program; under this a comprehensive set of metrological initiatives to guarantee the Quality Assurance of overall procedures were carried out such as reference materials matrix matching produced by an accredited reference material producer (ISO 34), proficiency schemes launched by an accredited PT provider (ISO/IEC Guide 43-1) and analysis carried out by accredited laboratories using the appropriate reference materials and who successfully participated in proficiency testing schemes with a specific test material dedicated to folic acid fortification program.

45
Table 13 - Cross reference table: Laboratories performance
Nutrient Method Accredited Successful participation in PT schemes
Alcohol Yes Yes
Ash Yes Yes
Calcium Yes Yes
β Carotene Yes Yes
Cholesterol Yes Yes
Copper Yes Yes
Fat Yes Yes
Iron Yes Yes
Fibre, total Yes Yes
Folate Yes Yes
Potassium Yes Yes
Magnesium Yes Yes
Sodium Yes Yes
Niacin Yes Yes
Phosphorus Yes Yes
Protein Yes Yes
Retinol Yes Yes
Riboflavin Yes Yes
Starch Yes Yes
Thiamin Yes Yes
Vitamin A Yes Yes
Vitamin B6 Laboratories not accredited Participation in PT Schemes
Vitamin B12 Yes Yes
Vitamin C Yes Yes
Vitamin D Laboratories not accredited Participation in PT Schemes
Vitamin E Yes Yes
Zinc Yes Yes
Biotin Yes Yes
Iodine Yes Yes
Manganese Yes Yes

46
7.8. Units and Modes of expression
Greenfield & Southgate (2003) consider that long-standing international modes of expression facilitate data interchange. These authors regard teaching of food composition as being facilitated if all modes of expression of nutrient units and matrix units are expressed in SI units and symbols. The need of traceability to SI units have been already recognised in Europe during the EPIC project (Charrondiere, 2002). The use of SI units including symbols and modes of expressions in FCDB should be mandatory for all components. Therefore, the purpose of this audit was to assess if SI units and symbols and modes of expressions are correctly expressed in NUTTAB 2006, AUSNUT 2007 and supporting documentation.
The units and modes of expression have been evaluated following the methodology described in Greenfield & Southgate (2003). The tables were evaluated concerning modes of expressions:
edible versus non-edible portion considering the amount of food, cooked and raw
liquid food (beverages were checked taking into account the more used quantities: mass or volume and if density is stated, because the conversion in both quantities is determined using density as a conversion factor)
the number of significant digits used to evaluate the precision of values and their evaluation. The number of significant digits considering the value (e.g. 10g, 100g, 0.1, 0.01g) and not the number of decimal places. Therefore both 100 or 0.001 are considered to have three significant digits
the number of decimal places (0.1 or 0.01, or 1.2 or 1.25)
the capture of values without rounding and the rounding process according with ISO 1000:1992 was assessed.
As we can observe values are expressed as per 100 g of edible portion food. This is the more usual mode of expression. Beverages should be expressed by volume or by mass, and the conversion factor should be expressed in order to trace back to raw data. Wine should be expressed according with alcolmetriques tables described in OIML R22. Beverages should be expressed by volume because it reflects the real intake form. In the supporting documentation the symbols of units should be written in lower case. Upper case is only applied for name of persons like Joule (J) although kilojoules kJ (kilogram should be written in lower case), except for Litre where both cases upper and lower are admitted).
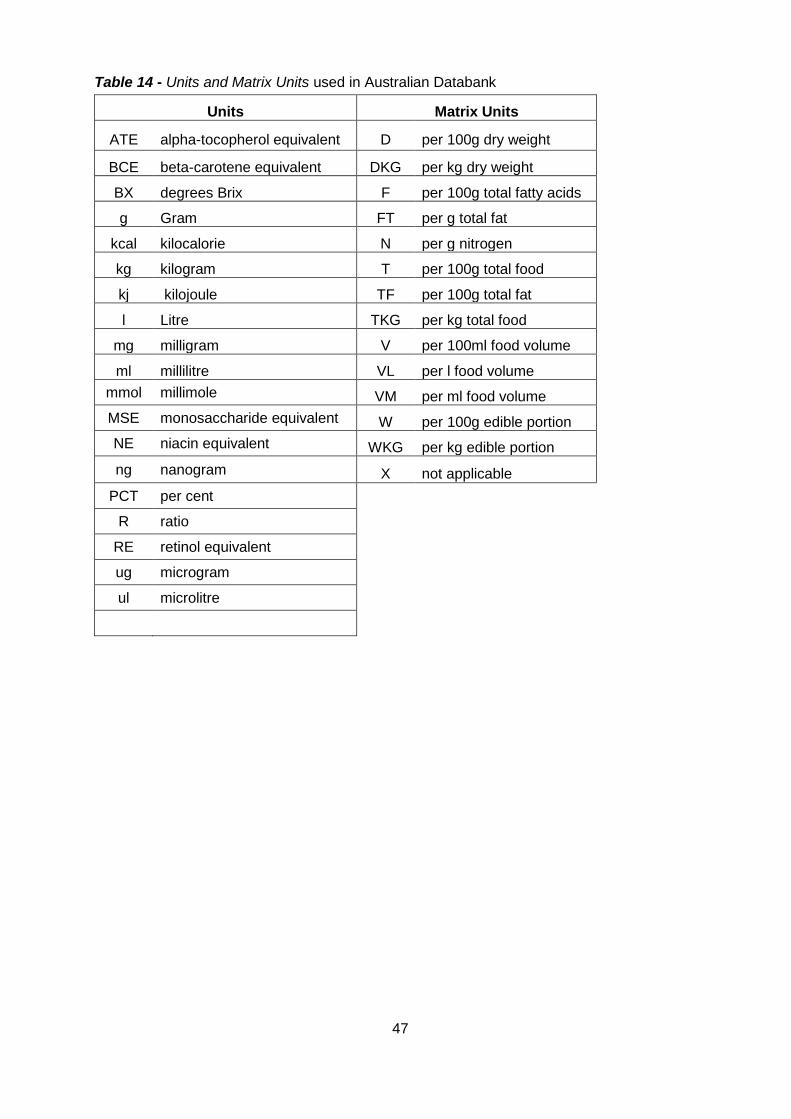
47
Table 14 - Units and Matrix Units used in Australian Databank
Units Matrix Units
ATE alpha-tocopherol equivalent D per 100g dry weight
BCE beta-carotene equivalent DKG per kg dry weight
BX degrees Brix F per 100g total fatty acids
g Gram FT per g total fat
kcal kilocalorie N per g nitrogen
kg kilogram T per 100g total food
kj kilojoule TF per 100g total fat
l Litre TKG per kg total food
mg milligram V per 100ml food volume
ml millilitre VL per l food volume
mmol millimole VM per ml food volume
MSE monosaccharide equivalent W per 100g edible portion
NE niacin equivalent WKG per kg edible portion
ng nanogram X not applicable
PCT per cent
R ratio
RE retinol equivalent
ug microgram
ul microlitre

48
7.9. Documentation
Extensive documentation in FCDBs is crucial, because the user tables cannot contain all the information that supports the analytical, imputed, calculated or borrowed values (Southgate, 2002). Special cases like Indigenous and traditional food systems are often not well documented but their cultural importance cannot be underestimated (Harrison, 2004). EuroFIR and INFOODS are making efforts to improve food descriptions and documentation. The final consideration of quality is documentation, because the records of data are essential to guarantee the transparency of the process and if necessary to recalculate data or demonstrate why certain values were considered as dubious (Barbara Burlingame, 2004).
Furthermore documentation has a complementary function, to guarantee the reliability of values over time and worldwide. Therefore, Quality management documentation requirements are intended to ensure that all members of staff know their assignments and responsibilities and that work undertaken by the compiler organisation is performed in accordance with policies and instructions. This gives surety that staff know who did it, when it was done, how was it done, which source/s were used. It also allows traceability of the values (which documents have been used) in the case of any complaint, user feedback or the update of data to use raw data and.
During the audit we have evaluated the documentation in both situations, using compliance audits to check if the values are according with guidelines and vertical audit using iodine values as a case study.
The results are presented in Figure 4. The approach was in casuistic form and was applied for iodine. The results confirm that the documentation is complete, and it was possible to identify all steps and associated documentation.
Lack of documentation for quality management is observed in some areas. It is necessary to improve this because FSANZ has several personnel engaged on a temporary basis. The use of SOPs could facilitate the integration of these staff in FSANZ, and avoid the time consuming process of permanent staff explaining/teaching extensively with these personnel.

49
Figure 4 - Cross reference: documentation
Note: PEAR refers to a business case assessment system used at FSANZ
50
7.10. Training
Training of compilers is of the utmost importance, because methods and techniques used in the production and management of FCDBs are reasonably complicated. Scrutiny of data are apparently simple to perform, but potentially subject to error because they include manual work like keyboarding of food data, component miscoding and therefore a scientific background is needed to choose values to be entered in the FCDB or that are sufficiently compatible to be aggregated. In such cases staff need to be carefully trained, and periodic checks should be performed to determine if variations are due to staff or caused by natural variations in foods. Therefore appropriate supervision or validation is necessary.
According with international consensus the compilers should have an adequate combination of academic and professional qualifications. At international level it is recommended that any organisation should have a general training program for the compilers and personnel involved in production of FCDB. Usually compiler organisations should have a training manual and update records of curriculum of members and training activities. Three categories of training are defined: initial, ongoing and professional development.
During the audit the training manual was assessed. A cross reference table between training at FSANZ and training matters given at training courses as an initial training for compilers is presented in Table 16. Training at FSANZ covers almost all subjects presented at International Graduate Courses on Production and Use of Food Composition Data in Nutrition and some FSANZ members have attended the course. During interviews it was demonstrated that FSANZ organises on-going training and personnel have participated in conferences and congresses.
According with results of interviews and checking documents we can conclude that training is adequate. It was defined which members have been trained (two staff have attended international training courses in food composition), which have participated in 1st Oceania region FoodComp Course and which have provided lessons in the field of Food Composition table.
Records on training were checked and are kept up to-date on the relevance of qualifications in terms of experience and professional qualifications.

51
Table 15 - Cross Reference Table EuroFIR Training and FSANZ
EuroFIR FSANZ
Where do we need food composition databases? X X
Consequences of random and systematic error in FCDB for nutritional research
X No
Setting priorities and selection of foods and nutrients X X
Introduction to sampling of foods X No
Statistical principles underlying sampling procedures X No
Design of sampling protocols X X/2
Nutrients X X
Choice of analytical methods; analytical process X X
Review of methods of analysis: energy, water, ash, alcohol
X X
Quality Management Systems X No
Data quality evaluation X No
Quality considerations in the compilation process X No
Laboratory data quality X X
Data quality evaluation of published values in literature/existing data
X No
Quality Assurance of Computerized System X/2 No
Collecting data from manufacturers, approaches and pitfalls
X X
Biodiversity, dietary diversity and FCDB X No
Review of methods of analysis all nutrients X No
Approaches to identify food constituents X X
Conventions and modes of expression of food comp data X No
Literature sources of food composition X No
Food nomenclature, classification and description in databases
X No
Recipe calculations X X
Database management systems X X
Documentation and interchange X X

52
8. SWOT (Strengths-Weaknesses-Opportunities-Threats) Analysis
There is no reference standard available for the production of FCDBs. In this absence, results from the audit were analysed by SWOT analysis. This approach was chosen to provide direction and serves as a sound platform to attain defined goals and for the development of future plans in terms of prioritised foods, methods of analysis, new datasets, improvements concerning data management systems, data quality, and software developments. The role of the SWOT analysis was to scrutinise information obtained from the audit process and to separate it into internal and external data management and production issues and to evaluate what was accomplished and whether or not it achieved what it set out to do in terms of recognition of competence to fit the purpose in four main areas: health, environment, trade and agriculture. It makes available information on the position of Australian FCDB to match what is considered as strengths and opportunities/needs and to identify obstacles that must be overcome or minimised to reach the desired national and international purposes.
Strengths
The analysis of strengths is based on internal factors.
In this report we have analysed the strengths observed in the overall process of the Australian FCDB including data production, management and use, using the results of audits as such described in materials and methods.
The results of compliance audit, vertical and horizontal have been compared with the criteria defined at international level as the realistic FCDB.
The results are scored at three levels: poor (zero), reasonable (one) and good or excellent (three). This classification was used to facilitate the assessment of FSANZ. This has the objective to indicate which parameters should be improved as a matter of priority. There are some parameters with a good score but not exceptional level, this we consider as opportunities because at the moment they fit the purpose, although they will need updating. This will be discussed in section considering the opportunities or threats and need to be compared and analysed with the work carried out by others organisations, like USDA, EuroFIR and INFOODS.
The cross reference table is presented at Table 17. The first criteria are the objectives of NUTTAB 2006, and AUSNUT 2007. As we could observe a realistic program has been in place since the 1980s.
The activities of the program are a result of a combination and coordination of activities chaired by FSANZ. The main goal addresses the national public health policies which are in accordance with the consensus international guidelines. The purposes of Australian FCDB are soundly supported by the decisions and supervision of a national advisory committee which helps ensure the FCDB contents and priorities fit their purposes in terms of users and stakeholders satisfaction.
The sampling strategies and sampling protocols used to define key foods are designed according to the inputs from national consumer surveys and epidemiological data available in the country.
During the interviews and assessment of documentation we could observe that is representative and soundly based on analytical data. This is one of the most important strengths, the analytical data held by FSANZ. More than 80% of data in NUTTAB 2006 are original analytical values determined for the purpose of food composition. The close linkage between compilers and laboratories, which in several national databases is a point of concern, is a strong point here. Therefore, it could be used as an example and part of the benchmarking process at international level. Borrowed data are imported from the most established or recognized tables. The references back to original source are available and could be used by the user to recalculate values or used by them in multi-center epidemiological studies to evaluate health/disease status. Assessment to NUTTAB 2006

53
missing data was not detected. Derived procedures are well expressed and fit the purpose of epidemiological studies. Data from industry is well established and criteria comply with Southgate and Greenfield (2003) requirements on data from labelling.
The key foods program to define the top contributors to nutrient intakes is structured in appropriate fashion. Conventions and modes of expressions are mostly expressed according with international guidelines, for food; however beverages need to be expressed in the same way (i.e. by volume).
Despite most analytical methods used by the laboratory being internal methods, they are based on reference analytical methods (minerals, proximates and almost all vitamins). Most new data are obtained by applying state of the art metrological procedures. The criteria used to select laboratories are adequate and encompass the latest criteria on Quality Management decided by international organisations such as ILAC. The procedures for external and internal quality assurance are top level. Examples are: PT schemes dedicated to specific foods and launched by providers with their competence recognized by third party as NATA or UKAS. The use of matrix reference materials produced by the organisation holding ISO 34 is the certification that the nutrient values are accurate.
Personnel background and training is a strength at FSANZ. The fact that the coordinator of the Food Composition databank has a PhD on Food Composition it is one of the highlights and the guarantee that the program has a core group of sound scientific support. It is notable to compare the amount and excellence of work with the small number of staff members. They have the appropriate combination of academic and/or professional qualification, training, experience and skill.
The notes from a questionnaire filled in by Judy Cunningham, reveal that all steps of compilation process are covered by appropriate quality control procedures, despite methods and process not matching the international guidelines like food description using Langual, but it is a voluntary decision based on national decisions.
The explanatory notes to NUTTAB 2006 are user friendly and no complaints from users have been detected so it could be considered as a good sign and strength.
Users and stakeholder feedback are registered and incorporated as feasible or as possible at each new edition of AUSNUT and NUTTAB.
The requirements at electronic level were assessed through an ANDB demonstration. The system is being upgraded and requires checking by all members. This is very important and could be considered a vital parameter. Because it guarantees that all the staff members are sensitive to the compilation process and are fully involved in the new version, what is accomplished and what needs to be set up.
ANDB is well organised and allows data to be manipulated and to create databases such as NPC, NUTTAB 2006, National Nutrition Surveys (AUSNUT 2007) and data for risk assessments, which could be a paradigm and a reference for modern databases around the world. In particular, the common procedures to create databases on contaminant and nutrients which is now under discussion at EFSA and in Europe and allows elaborating dietary intakes with sound scientific support.

54
Table 16 – Analysis of Strengths based on criteria for a comprehensive food composition database, according to Greenfield and Southgate (2003) and EuroFIR guidelines.
Criteria Score
0 1 3
Objectives of food composition database program should be effectively described.
X
Database program should be approved, monitored and updated by a committee.
X
Data should be representative X
Data should be sound analytical quality X
Coverage of foods should be comprehensive X
Coverage of nutrients should be comprehensive X
Food descriptions should be clear X
Data should be consistently and unambiguously expressed X
Origins of data should be provided at nutrient value level X
Tables and databases should be easy to use X
The content of databases should be compatible at analytical, compilation and electronic level with international databases
X
Database should have few missing data X
Data should reflect the general state of nutritional thinking including nutrients and bioactives
X
Personnel should be trained in all aspects of food composition process X
Quality Control should be in place for all aspects of compilation process X
Food Composition Data should have update programmers, established in a regularly basis
X
Guidelines for the use of food composition data should be available X
Users feedback should be incorporated in database X

55
Weakness
A list of weaknesses evaluated for the Australian FCDB is presented in Table 18. These are considered at an international arena as the items crucial to guarantee the credibility of international FCDBs. In this case the scores are considered according to their relevance. Zero score it is not a weakness, one is considered a warning, and 3 is considered an important weakness and danger.
As we can observe the Australian FCDB has three weaknesses, of which the most time consuming is a lack of a Data Quality Assessment System. This is important to improve for the following reasons.
Nowadays with globalisation and an increase in food exports and knowledge and identification of foods and their traceability from farm to fork, the possibility of estimation of intakes is more close to the reality. This means that surveys and FCDB should work in very close collaboration. Despite the limitations of national FCDBs, the use of the internet allows FCDB users to have access to on-line versions of national FCDB overseas.
This could be considered a threat if an update of the FCDB is not recognised as crucial.
If nutrient analysis published in scientific papers of local foods are adopted by a remarkable FCDB (Wines composition is part of USDA databank and are missing at Spanish food composition table despite the fact they are consumed in the United States and in Spain). In the ideal world data on Spanish wines exported to USA should be included in Spanish food composition table and the Americans should trust in the Spanish data and borrow these data. Confidence in the quality of food composition data and in the comparability of data across different databases is essential for data interchange. In accordance with EuroFIR, Quality indices are scores attributed by compilers to original data, based on assessment of the description of the data and aim to reflect the reliability of data as an estimation of the „true‟ value in the food.
lack of data quality assessment systems to evaluate data arriving from contract laboratories, from scientific literature, from industry, or from other tables
lack of compliance with international rules of modes of expressions for beverages and some nutrients
lack of collaborative studies on recipe calculation and nutrient loss and gain
some personnel employed on a temporary basis and few people consider the enormous amount of work, even though most of the data for the food composition tables are produced by laboratories under contract of FSANZ
this is particularly relevant to food composition tables which require a sound scientific background to personnel involved in selection of data
lack of laboratory facilities to analyse vitamin D for the most important forms vitamin D2
(ergocalciferol) vitamin D3 cholecalciferol and 25-hydroxy-vitamin D (25-OH-D)
lack of laboratories accredited or with competence recognised to determine Vitamin B6 in foods
old data for vitamins (before 1990).

56
Table 17 - Analysis of weakness based on criteria
Criteria Score
0 1 3
Lack of representative data X
Inadequate sampling protocols X
Improper choice of method of analysis X
Presence of missing values X
Most of values does not fit the purpose X
Modes of expressions inappropriate X
Mis-coding X
File formats inappropriate for data interchange X
Lack of documentation to trace back values to raw data X
Lack of trained personnel X
Lack of collaborative studies for compilation process X
Lack of advisory board to define food composition program X
Lack of users feedback X
Lack of criteria for scrutiny of data X
Lack guidelines for the use of food composition data X
Lack of guidelines for testing the accuracy of data X
Incompatibilities of other databases X
Opportunities
In the SWOT analysis opportunities are considered the ‘external conditions that are helpful to achieving the objective‟. Here we have designated the external environment as the international organisations involved with the FCDB at international, regional and national level. The criteria used to analyse opportunities and the results of the audit are described below:
A developing market
To create a database for bioactive compounds of Australian foods and other countries in the Pacific regions (fruits, vegetables, meat). There is no country or region in the world with a database on bioactive compounds from foods obtained from animal sources and it is a needed, as mentioned by some governmental organisations.
To communicate with GS1: In Europe EFSA and EuroFIR are putting a lot of effort into the nutritional impact of foods to support consumers‟ decisions on healthy food. This is carried out creating a platform with GS1 and developing efforts so that comprehensive nutrition information appears in the same screen as the price of the foods.
Mergers, joint ventures or strategic alliances
Convince USDA and EuroFIR members to use Australian data. Prioritise nutrients taking into account importing food country nutrient requirements (for example, Denmark and Netherlands seek fruits rich in bioactive compounds and meat and biscuits with low levels of trans fatty acids) to create a strength linkage with organisations in Australia involved in the export of

57
goods (government and private companies). With the liaisons with Europe all members are on line through the same site. This allows FSANZ to demonstrate to other compilers the quality of their values.
Moving into new market segments that offer improved profits
The need for provenance identification of food materials has increased in significance with the expansion of global trade, because it provides confidence in food quality and safety for consumers. In particular, the trade of cattle products such as beef and dairy products has recently been more strictly controlled due to concerns of BSE. The fraud of products is another matter of concern that has lead many countries to protect their origin. Some countries like USA and in Europe EFSA have encouraged exports and trade organisations to add the nutritional information with special emphasis on compounds with putative health effects, since it can be considered as a stamp of their provenance. The type and the amount of bioactive compounds could be considered as a fingerprint.
A new international market
One of the most important aspects of FCDB is the representativeness, although it is impossible to contain all nutrients and foods consumed in the country. Borrowed values from other countries in particular for imported foods could be a way to overcome such difficulties. In the case of values with the same level of quality, values could be borrowed since they correspond to the same food or similar foods and avoid duplication of work. For example, most of the values from American Bioactive datasets are originally from Europe (Holden et al, 2005). Europe could be a very important market for FSANZ in respect to Australian foods consumed by European citizens living in Europe.
A market vacated by an ineffective competitor
Australia should consider that the Pacific region (with the exception of New Zealand) does not have a FCDB with the quality of the Australia FCDB. This can be very important and the advantages and lessons taken from 1st Oceania Food Training Course, should be analysed in terms of market expansion.
Table 18 - Analysis of opportunities
Opportunities FSANZ
A developing market Bioactive compounds
Mergers, joint ventures or strategic alliances EuroFIR
Moving into new market segments that offer improved profits
Linkage with Australian exporters
A new international market Europe
A market vacated by an ineffective competitor Regional – Pacific Region

58
Threats
Threats in the sense of specific hazards or critical actions could occur. For example tenders for the provision of analytical services or tailor made software should be prepared carefully taking into the account lessons from the past e.g. laboratory data does not fit the purpose, problems with tailor made software, contractual problems. FSANZ is a governmental organisation, therefore risks are associated with unknown or changing political or administrative arrangements and anyone involved in project funding should be aware of this.
However a classical analysis of threats was carried out and the criteria and the results are listed below:
A new competitor in your home market
FSANZ is the national organisation that holds custody of the Australian FCDB. A real threat on its core business is difficult or unlikely to occur.
Price wars with competitors
This could be a real threat in the case where a users are required to pay a fee to access FCDBs. In Europe people are required to pay a fee to obtain food composition data. In Australia, price wars are not realistic since FSANZ releases FCDB on the internet free of charge.
A competitor has a new, innovative product or service.
GS1 Bar codes is an emerging issue in Europe. Today a close linkage with GS1 is occurring. And this should be possible. Scientific literature will be published in this matter in coming months.
Table 19 – Analysis of threats
Threats FSANZ
A new competitor in your home market No. FSANZ is the authoritative force in Australia
Price wars with competitors No. Access is free of charge
A competitor has a new, innovative product or service
Yes, GS1- Bar code is associated with EuroFIR
Competitors have superior access to channels of distribution
No. Australian FCDB available via Internet
Taxation is introduced on your product or service
No, data are free of charge

59
Figure 5 - Conclusions of SWOT Analysis – strengths and weaknesses represent internal analysis and opportunities and threats are external analysis
SWOT analysis
Strengths Australian data >80%
Traceability to SI units
User and advisor group
Highly qualified personnel
Strength linkage - producers and users
Weaknesses
Beverages mode of expression non compliant
with OIML
Lack of state of the art methods of analysis for
vitamin D forms
Threats
Lack of updates on a regular basis
Tenders and contracts failure to fit the
purpose
Opportunities
Bioactive compounds datasets
Linkage with Australian exporters
Export food composition data values
Liaisons with GS1
Liaison with IT

60
9. Conclusions and Recommendations Conclusions
The use of FCDBs as one of the pillars of nutrition studies to understand the relationship between health and disease related with food/nutrient intake reveals that FCDBs should be evaluated as scientific instruments. This was taken under consideration by FSANZ‟s Science Strategy 2006-2009.
Auditing the Australian FCDB has been a relevant and timely process. This is one of the first composition databases to be audited internationally and the model and results could be used as an example of good scientific practice according to the concepts defined by Greenfield and Southgate (2003).
Nutrient values incorporated in ANDB are sound, supported in metrological tools and are traceable to SI units, since the validity of nutritional epidemiological studies depends on accuracy of results. This is a valuable tool which makes FSANZ have one of the best FCDB around the world.
Documentation is considered a potential key issue because the electronic format does not incorporate all the available information. Therefore, FSANZ has a set of documentation including the archival data and ancillary files which gather all the information and make it possible to trace the data from compilation for publication back to the raw data, especially for new data.
Old data do not fulfill all the requirements, and some files are missing. This can be suppressed by gradual replacement of old data by data generated according to recent needs. This is one of the reasons which the maintenance of data upgrade programs is necessary and crucial.
On the basis of the SWOT analysis, supported by available international guidelines for food composition tables (EuroFIR), FSANZ is considered an excellent organisation.
However to maintain this level of excellence some recommendations are outlined below, in order of their relevance.
The creation of a dataset on bioactive compounds could be an issue to be considered in the future. Australia has many unique indigenous foods for which bioactive data could be generated.
A number of topics are recommended for development of guidelines.
Developing Australian analytical facilities for the most important forms of vitamin D (D2, D3 and 25 OHD) is one of the utmost issues in the field of Australian FCDB.
SI units have been adopted by FSANZ, although the use of correct symbols and modes of expressions should be incorporated at all levels. Therefore, the expression of beverages in mass fraction and volume fraction is advisable. The use of alcoholic strength in compliance with OIML and official organization for wine is recommended.
Improving quality management documentation is important as some personnel are contracted on a temporary basis. The use of Standard Operating Procedures could help these personnel and will facilitate training, allow staff to know their assignments and responsibilities and perform their tasks in a controlled manner in accordance with policies and instructions, approved by senior management. It avoids dedicated training time and consuming the time of their supervisors.
For international companies, FCDB play a crucial role in consumer trust of label values, and putative effects of foods claim by suppliers. Accurate labelling in terms of analytical and calculated values is essential for consumers to make healthy choices. There is no necessity of duplication of work when good data from industry is available. In some cases Australian FCDB could share with Australian export companies their expertise on methods of analysis and sampling plans according with market shares. Agriculture and companies in the past have only

61
looked for data on geographical origin, not supported by nutrition information of the regional products. This concept is now changing and nutritional information is demanded for regional foods as a stamp of tradition and to support other areas of scientific development as a strength linkage with nutrition/food safety/food labeling and trade is advisable.

62
10. References
Aldai, N., Osoro, K., Barron, L.J.R. and Najera, A.I. (2006). Gas-liquid chromatographic method for analysing complex mixtures of fatty acids including conjugated linoleic acids (cis9trans11 and trans10cis12 isomers) and long-chain (n-3 or n-6) polyunsaturated fatty acids - Application to the intramuscular fat of beef meat. J. Chromatogr. A, 1110, 133-139.
American Society for Quality. Retrieved February 2008 from http://www.asq.org/glossary/q.html
Becker, W. (2002). NORFOODS – recent activities. Journal of Food Composition Analysis, 15(4), 485-489.
Beemster, C.J.M., Hulshof, K.F.A.M., Breedveld, B.C. & S. Westenbrink. (2000). Creation of a Database for the Calculation of Nutrient Intake Over Time. Journal of Food Composition and Analysis, 13(4), 411-417.
Blake, C.J. (2007). Analytical procedures for water-soluble vitamins in foods and dietary supplements: A Review. Anal Bioanal Chem, 389, 63-76.
Brause, A.R., Woollard, D.C., Indyk, H.E. (2003). Determination of Total Vitamin C in Fruit Juices and Related Products by Liquid Chromatography: Interlaboratory Study. Journal of AOAC International, 86, 367-374.
Burlingame, B. (2004). Fostering quality data in food composition databases: visions for the future. Journal of Food Composition and Analysis, 17(3-4), 251-258.
Calvo, M., Whiting, S. (2003). Prevalence of vitamin D insufficiency in Canada and the United States: importance to health status and efficacy of current food fortification and dietary supplement use Nutrition Reviews, 61(3), 107-113.
Castanheira, I., André, C., Oseredczuk, M., Ireland, J., Owen, L., Robb, P., Earnshaw, A. & Calhau, M.A. (2007). Improving data quality in food composition databanks: a EuroFir contribution. Accred Qual Assur, 12, 117-125.
Castanheira, I., Robb, P., Owen, L., Boer, H. den, Schmit, J., Ent, H. & Calhau, M.A. (2007a). A proposal to demonstrate a harmonized quality approach to analytical data production by EuroFIR. Journal of Food Composition and Analysis, 20, 725-732.
Castanheira, I. (2008). Report on evaluation of analytical methods according with compilers needs www.eurofir.net. Retrive on 23 February, 2009.
Charrondiere, U.R., Vignat, J., Møller, A., Ireland, J., Becker, W., Church, S., Farran, A., Holden, J., Klemm, C., Linardou, A. et al. (2002). The European Nutrient Database (ENDB) for nutritional epidemiology. Journal of Food Composition and Analysis, 15(4), 435-451.
Chen, P., Wolf, W.R. (2007). LC/UV/MS-MRM for the simultaneous determination of water-soluble vitamins in multi-vitamin dietary supplements. Anal Bioanal Chem, 387 (7), 2441-8.
Christopher, J. B. (2007). Status of Methodology for the Determination of Fat-Soluble Vitamins in Foods, Dietary Supplements, and Vitamin Premixes. Journal of AOAC International, 90, 897-910.

63
Cubbada, F. (2004). Inductively Coupled Plasma-Mass Spectrometry for the determination of Elements and Elemental Species in Food: A Review. Journal of AOAC International, 87(1), 173-204.
CX/MAS/02/13, Codex Alimentarius Commission. (2002). Codex Commitee on Methods of Analysis and Sampling (FAO/WHO). The use of analytical results: sampling, relationship between the analytical results, the measurement uncertainty, recovery factors and the provisions in Codex Standards. Agenda Item 9 of the 24 the Sessions, Budapest, Hungary, 18-22 November.
Deharveng, G., Charrondiere, U.R., Slimani, N., Southgate, D.A.T. & Riboli, E. (1999). Comparison of nutrients in food composition tables available in the nine European countries participating in EPIC. European Journal of Clinical Nutrition, 53(1), 60-79.
Denny A., Buttriss J., Finglas P. (2009) Second International EuroFIR Congress 2007: The role of food composition data in improving quality, healthiness and safety of European diets. Food Chemistry 113 (3) 733-735)
DeVries, J.W., Silvera, K.R. (2002). Determination of Vitamins A (Retinol) and E (alpha-Tocopherol) in Foods by Liquid Chromatography: Collaborative Study. Journal of AOAC International, 85, 424-434.
DeVries, J.W, Rader, J.I. (2005). Historical perspective as a guide for identifying and developing applicable methods for dietary fiber. Journal of AOAC International, 88(5), 1349-66.
Dyson R. G. (2004)Strategic development and SWOT analysis at the University of Warwick. European Journal of Operational Research, 152, 631-640.
Egan, M.B., Fragodt, A., Raats, M.M., Hodgkins, C., Lumbers, M. (2007). The importance of harmonizing food composition data across Europe. European Journal of Clinical Nutrition, 61, 813-821.
EuroFIR, European Food Information Resource Network, website: http://www.eurofir.net.
FAO/WHO. (2002). Pan-European Conference on Food Safety and Quality: Feb 25-28, Budapest, Hungary . www.fao.Org/docrep/meeting/004. Retrive on 27 February, 2008.
Ferguson, L.R. (2009). Nutrigenomics approaches to functional foods. J. Am. Diet. Assoc. Mar., 109(3), 452-458.
Gnagnarella, P., Parpinel, M., Salvini, S., Franceschi, S., Palli, D., & Boyle, P. (2004). The update of the Italian Food Composition Database. Journal of Food Composition and Analysis, 17(3-4), 509-522.
Greenfield, H., Southgate, D.T.A. (2003). Food Composition Data. Production, Management and Use.. 2nd Edition, FAO Rome, 2003 Available to download as PDF at www.fao.org/infoods/publications retrieved on 27 February, 2009
Hammond, D.A. (2001). Synergy between Liquid Chromatographic–Pulsed Amperometric Detection and Capillary-Gas Chromatographic Methods for the Detection of Juice Adulteration. Journal of AOAC International, 84(3), 964-975.
Harrison, G.G. (2004). Fostering data quality in food composition databases: application and implication for public health. Journal of Food Composition and Analysis, 17, 259-265.

64
Haytowitz, D.B., Pehrsson, P.R. and Holden, J.M. (2008). The National Food and Nutrient Analysis Program: A decade of progress. Journal of Food Composition and Analysis, 21, Supplement 1, S94-S102.
Holden, J.H, Bhagwat, S.A. and Patterson, K.Y. (2002). Development of a multi nutrient data quality evaluation system. Journal of Food Composition and Analysis, 15, 339-348.
Holden, J., Bhagwat, S.A., Haytowitz, D.B., Gebhardt, S., Dwyer, J., Peterson, J., Beecher, G.R., Eldridge, A. & Balentine, D. (2005). Development of a database of critically evaluated flavonoids data: application of USDA‟s data quality evaluation system. Journal of Food Composition and Analysis, 18(8), 829-844.
Hypponen, E., Laara, E., Reunanen, A., Jarvelin, M.R., Virtanen, S.M. (2001). Intake of vitamin D and risk of type 1 diabetes: a birth cohort study. Lancet, 358(9292), 1500–1503.
INFOODS. (2008). The International Network of Food Data Systems. http://www.fao.org/infoods/index_en.stm.
ISO International Standard. (1997). Proficiency testing by interlaboratory comparisons - Part1: Development and operation of proficiency testing schemes. ISO/IEC GUIDE 43-1:1997.
ISO International Standard. (2000). General requirements for the competence of reference material producer. ISO GUIDE 34:2000.
ISO International Standard. (2000). Quality Management Systems - Requirements. ISO 9001:2000.
ISO International Standard. (2003). Quality-management systems - guidelines for quality management in projects. ISO 10006:2003.
ISO/IEC International Standard. (2005). General requirements for the competence of calibration and testing laboratories. ISO/IEC 17025:2005.
Klensin, J.C. (1995). When the metadata exceed the data: Data management with uncertain data. Statistics and computing, 5, 73-84.
Kleyn, D.H, Lynch, J.M, Barbano, D.M, Bloom, M.J, Mitchell, M.W. (2001). Determination of fat in raw and processed milks by the Gerber method: collaborative study. Journal of AOAC International, Sep-Oct, 84(5), 1499-1508.
Konings. Erik, J.M. (2006). Water - Soluble Vitamins. Journal of AOAC International, 89, 285-288.
Kuhnlein, H.V., Soueida, R. (1992). Use and nutrient composition of traditional Baffin Inuit Foods. Journal of Food Composition and Analysis, 5, 112–126.
Kuhnlein, H.V., Chan, H.M. (2000). Environment and contaminants in traditional food systems of northern indigenous peoples. Annual Review of Nutrition, 20, 595–626.
Kuhnlein, H.V., Receveur, O., Soueida, R., Egeland, G. (2004). Arctic indigenous peoples experience the nutrition transition with changing dietary patterns and obesity. Journal of Nutrition, 124, 447-453.
Kuhnlein, H.V., Barthet, V., Farren, A., Falahi, E., Leggee, D., Receveur, O., Berti, P. (2006). Vitamins A, D, and E in Canadian Arctic traditional food and adult diets. Journal of Food Composition and Analysis, 19, 495–506.

65
Lichtenstein, A.U., Yetley, E.A., LauJ. (2008). Application of systematic review methodology to the field of nutrition. J. Nutr. Dec., 138 (12), 2297-2306.
Miller, E.L., Bimbo, A.P., Barlow, S.M., Sheridan, B. (2007). Repeatability and Reproducibility of Determination of the Nitrogen Content of Fishmeal by the Combustion (Dumas) Method and Comparison with the Kjeldahl Method: Interlaboratory Study. Journal of AOAC International, 90(1), 6-2.
Møller, A., Unwin, I.D., Becker, W. & Ireland, J. (2007). EuroFIR's food databank systems for nutrients and bioactives. Trends in Food Science & Technology, 18(8), 428-433.
Murphy, S.P. (2001). Changes in dietary guidance: implications for food and nutrient databases. Journal of Food Composition and Analysis, 14, 269-278.
Noel, ., eblanc, J.C., u rin, T. . Determination of several elements in duplicate
meals from catering establishments using closed vessel microwave digestion with
inductively coupled plasma mass spectrometry detection: Estimation of daily dietary
intake Food Additives and Contaminants, 20 (1), 44-56.
OIML. (1975). R-22 International alcoholometric tables. (www.oiml.org/publications) Retrive on 23 February, 2009.
OIML. (1985). R-44-Alcoholometers and alcohol hydrometers and thermometers for use in alcoholometry. (www.oiml.org/publications) Retrive on 23 February, 2009.
Ortega, R.M. (2006). Importance of functional foods in the Mediterranean diet. Public Health Nutr. Dec., 9(8A), 1136-1140.
Pennington, J.A.T. et al. (2007). Food Composition Data: The Foundation of Dietetic Practice and Research. Journal American Dietetic Association, 107, 2105-2113.
Pennington, J.A.T. (2008). Applications of food composition data: Data sources and considerations for use. Journal of Food Composition and Analysis, 21, S3-S12.
Petit, J.C., Muret, A. (2000). A specific standard for quality in fundamental research. Accreditation Quality Assurance, 5, 28-34.
Rand, W.M., Pennington, J.A.T., Murphy, S.P. & Klensin, J.C. (1991). Compiling data for food composition data bases. Tokyo: INFOODS, United Nations University Press.
Robins, M.M., Scarll, S. J. & Key, P. E. (2006) Quality assurance in research laboratories. Accreditation Quality Assurance, 11(5), 214-223.
Roodenburg, A.J.C. & Leenen, R. (2007). How food composition databases can encourage innovation in the food industry. Trends in Food Science & Technology, 18(8), 445-449.
Rowlands, J.C., Hoadley, J.E. (2006). FDA perspectives on health claims for food labels Toxicology, 221, 35-43.
Scalbert, A., Manach, C., Morand, C., Remecy, C., Jimenez, L. (2005). Dietary Polyphenols and the Prevention of Diseases Critical Reviews in Food Science and Nutrition, 45, 287-306.
Schlotke, F., Becker, W., Ireland, J., Møller, A., Ovaskainen, M.L., Monspart, J. & Unwin, I.D. (2000). EUROFOODS recommendations for food composition database management and data interchange. Journal of Food Composition Analysis, 13(4), 709-744.

66
Seppänen-Laakso, T., Laakso, I. and Hiltunen, R. (2002). Analysis of fatty acids by gas chromatography, and its relevance to research on health and nutrition. Analytica Chimica Acta, 465(1-2), 39-62.
Slimani, N., Charrondie`re, U. R., Staveren, W., van and Riboli, E. (2000). Standardization of Food Composition Databases for the European Prospective Investigation into Cancer and Nutrition (EPIC): General Theoretical Concept. Journal of Food Composition Analysis, 13, 567-584.
Slimani, N., Deharveng, G., Unwin, I.D., Vignat, J., Skeie, G., Salvini, S., Møller, A., Ireland, J., Becker, W. & Southgate, D.A.T. (2007). Standardisation of an European end-user nutrient database for nutritional epidemiology: what can we learn from the EPIC Nutrient Database (ENDB) Project. Trends in Food Science & Technology, 18(8), 407-419.
Southgate, D. A. T. (2002). Data Quality in Sampling, Analysis, and Compilation. Journal of Food Composition Analysis, 15, 507-513.
Spiegel, van der M., Luning, P.A., Ziggers, G.W. & Jongen, W.M.F. (2003). Towards a conceptual model to measure effectiveness of food quality systems. Trends in Food Science & Technology, 14(10), 424-431.
Truswell, A.S., Bateson, D.J., Madafiglio, K.C., Penington, J.A.T., Rand, W.R. & Klensin, J.C. (1991). INFOODS guidelines for describing foods: a systematic approach to describing foods to facilitate international exchange of food composition data. Journal of Food Composition Analysis, 4(1), 18-38.
US Food Composition Tables http://www.nal.usda.gov/fnic/foodcomp/Data/SR17/sr17.html. Retrieved 23 February 2009.
Westenbrinck, S., Oseredczuk, M. & Castanheira, I. (2007). Food composition databases: the EuroFIR approach to develop quality tools to secure the compilation process.
Williamson, C.S. & Buttriss, J.L. (2007). EuroFIR Congress 2007: Food Information Databank Systems - everything you ever wanted to know. Trends in Food Science & Technology, 18(8), 398-406.
Wood, R. (2004). Recent developments at the Codex Alimentarius Commission and the inter-agency meeting with respect to food analysis. Accreditation Quality Assurance, 9, 551-556.
Woolard, D.C., Indyk, H.E., Bertram, Y.F. and Cook, K.K. (2002). Determination of Vitamin K 1 Isomers in Food by liquid Chromatography with C 30 Bonded-Phase Column, Journal of AOAC International, 85, 682-691.