Embed Size (px)
Citation preview

Audited Financial Results – Q4 FY2014-15 & FY 2014-15 (CIN: L45101DL2006PLC148314) May 21, 2015
Safe Harbour Statement
This document contains certain forward‐looking statements based on current expectations of Indiabulls management. Actual results may vary significantly from the forward‐looking statements in this document due to various risks and uncertainties. These risks and uncertainties include the effect of economic and political conditions in India, and outside India, volatility in interest rates and in Securities markets, new regulations and government policies that might impact the business of Indiabulls, the general state of the Indian economy and the management’s ability to implement the company’s strategy. Indiabulls doesn’t undertake any obligation to update these forward‐looking statements.
This document does not constitute an offer or recommendation to buy or sell any securities of Indiabulls or any of its subsidiaries or associate companies. This document also doesn’t constitute an offer or recommendation to buy or sell any financial products offered by Indiabulls.
Investor Contact :
Vijay Nehra
+91 22 6189 1404; +91 9004161064
2

Contents
3
Pg. No.
1. Business Update 4
2. Operational Update 8
3. Indian Real Estate Market 12
4. Financial and Operational Highlights 16
5. Key Ratios, Detailed Financials and Shareholding 33

Business Update
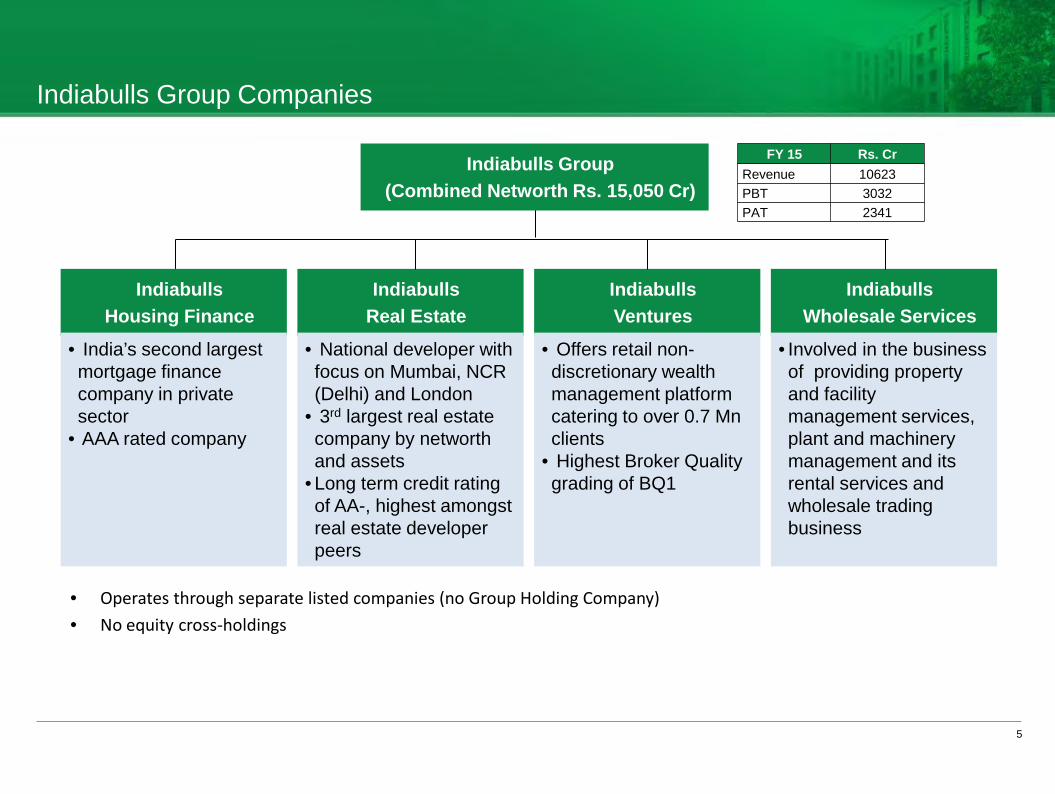
Indiabulls Group Companies
5
Indiabulls Housing Finance
Indiabulls Real Estate
Indiabulls Ventures
Indiabulls Wholesale Services
Indiabulls Group (Combined Networth Rs. 15,050 Cr)
• India’s second largest mortgage finance company in private sector
• AAA rated company
• National developer with focus on Mumbai, NCR (Delhi) and London
• 3rd largest real estate company by networth and assets
• Long term credit rating of AA-, highest amongst real estate developer peers
• Offers retail non-discretionary wealth management platform catering to over 0.7 Mn clients
• Highest Broker Quality grading of BQ1
• Involved in the business of providing property and facility management services, plant and machinery management and its rental services and wholesale trading business
• Operates through separate listed companies (no Group Holding Company) • No equity cross-holdings
FY 15 Rs. Cr Revenue 10623 PBT 3032 PAT 2341
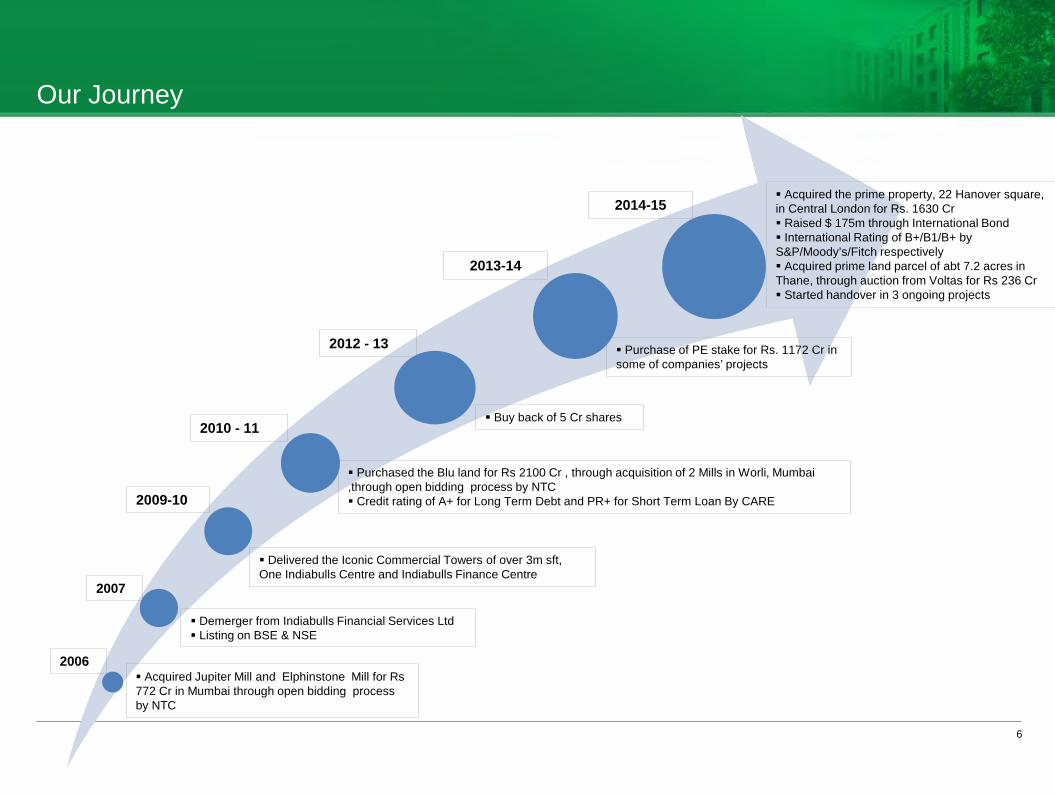
Our Journey
6
2007
Acquired Jupiter Mill and Elphinstone Mill for Rs 772 Cr in Mumbai through open bidding process by NTC
Demerger from Indiabulls Financial Services Ltd Listing on BSE & NSE
2010 - 11
Purchased the Blu land for Rs 2100 Cr , through acquisition of 2 Mills in Worli, Mumbai ,through open bidding process by NTC Credit rating of A+ for Long Term Debt and PR+ for Short Term Loan By CARE
2013-14
Purchase of PE stake for Rs. 1172 Cr in some of companies’ projects
2006
2009-10
Delivered the Iconic Commercial Towers of over 3m sft, One Indiabulls Centre and Indiabulls Finance Centre
2012 - 13
Buy back of 5 Cr shares
Acquired the prime property, 22 Hanover square, in Central London for Rs. 1630 Cr Raised $ 175m through International Bond International Rating of B+/B1/B+ by S&P/Moody’s/Fitch respectively Acquired prime land parcel of abt 7.2 acres in Thane, through auction from Voltas for Rs 236 Cr Started handover in 3 ongoing projects
2014-15

Business Update
7
Quarter-on-Quarter (Q-o-Q) Comparison – Q4 FY14-15 v/s Q4 FY13-14
Key Financial Highlights: FY 2014-15
* Post profit/loss from Associates
FY 14-15 FY 13-14 Growth
Total Revenues (Rs. Cr.) 2736.6 1800.0 52%
PBT* (Rs. Cr.) 351.0 334.1 5%
PAT* (Rs. Cr.) 271.5 202.6 34%
EPS (Rs.) 5.84 5.28
Q4 FY 14-15 Q4 FY 13-14 Growth Total Revenues (Rs. Cr.) 630.7 341.8 84%
PBT* (Rs. Cr.) 104.7 59.9 75%
PAT* (Rs. Cr.) 95.4 35.7 168%
EPS (Rs.) 2.19 0.98
Operational Update

Quarter Update
9
• Sales of Rs. 550 Cr during the quarter; Area sold 6.6 lac sft
• Ramp-up of Construction progress across projects
• Handover started for Centrum Park, Gurgaon
• Our ratings from various rating agencies are tabulated below
Rating Agency Long Term Rating Short Term Rating
S&P B+
Moody's B1 Fitch B+ CARE Ratings A+ A1+ Brickwork Ratings AA-
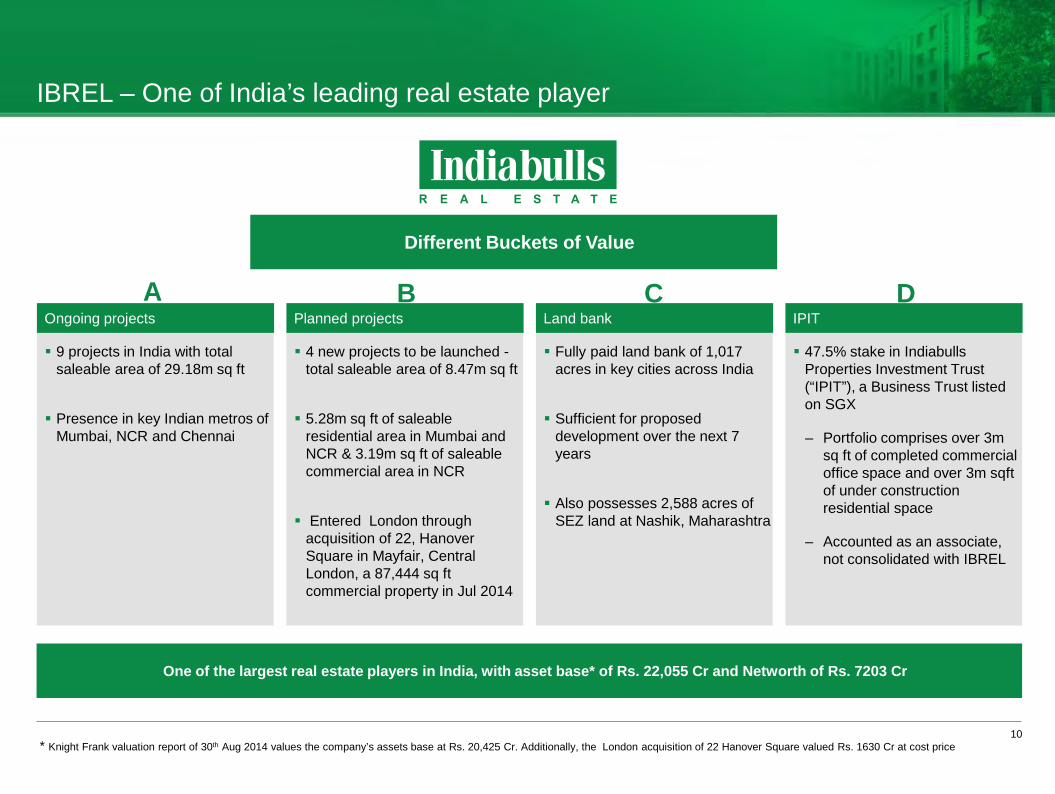
IBREL – One of India’s leading real estate player
Fully paid land bank of 1,017 acres in key cities across India
Sufficient for proposed development over the next 7 years
Also possesses 2,588 acres of SEZ land at Nashik, Maharashtra
9 projects in India with total saleable area of 29.18m sq ft
Presence in key Indian metros of Mumbai, NCR and Chennai
Ongoing projects
4 new projects to be launched - total saleable area of 8.47m sq ft
5.28m sq ft of saleable residential area in Mumbai and NCR & 3.19m sq ft of saleable commercial area in NCR
Entered London through acquisition of 22, Hanover Square in Mayfair, Central London, a 87,444 sq ft commercial property in Jul 2014
Planned projects Land bank
47.5% stake in Indiabulls Properties Investment Trust (“IPIT”), a Business Trust listed on SGX
– Portfolio comprises over 3m sq ft of completed commercial office space and over 3m sqft of under construction residential space
– Accounted as an associate, not consolidated with IBREL
IPIT
10 * Knight Frank valuation report of 30th Aug 2014 values the company’s assets base at Rs. 20,425 Cr. Additionally, the London acquisition of 22 Hanover Square valued Rs. 1630 Cr at cost price
One of the largest real estate players in India, with asset base* of Rs. 22,055 Cr and Networth of Rs. 7203 Cr
A C B D
Different Buckets of Value
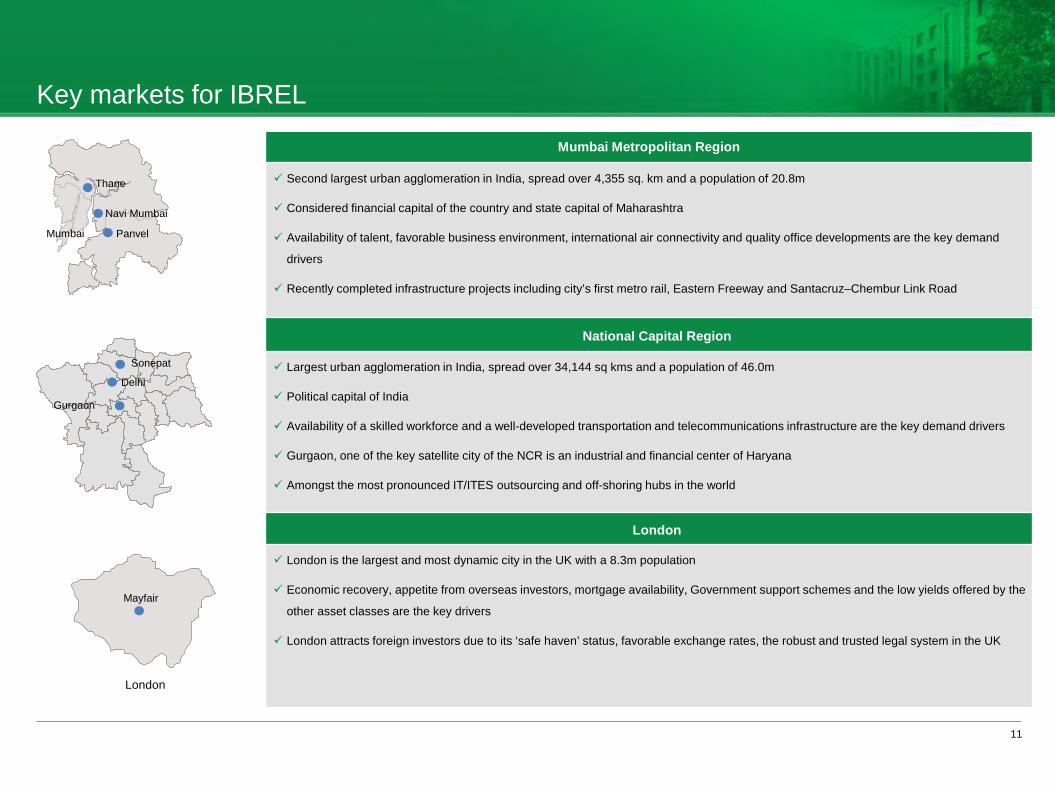
Key markets for IBREL
11
Mumbai Metropolitan Region
Second largest urban agglomeration in India, spread over 4,355 sq. km and a population of 20.8m
Considered financial capital of the country and state capital of Maharashtra
Availability of talent, favorable business environment, international air connectivity and quality office developments are the key demand
drivers
Recently completed infrastructure projects including city’s first metro rail, Eastern Freeway and Santacruz–Chembur Link Road
National Capital Region
Largest urban agglomeration in India, spread over 34,144 sq kms and a population of 46.0m
Political capital of India
Availability of a skilled workforce and a well-developed transportation and telecommunications infrastructure are the key demand drivers
Gurgaon, one of the key satellite city of the NCR is an industrial and financial center of Haryana
Amongst the most pronounced IT/ITES outsourcing and off-shoring hubs in the world
London
London is the largest and most dynamic city in the UK with a 8.3m population
Economic recovery, appetite from overseas investors, mortgage availability, Government support schemes and the low yields offered by the
other asset classes are the key drivers
London attracts foreign investors due to its ‘safe haven’ status, favorable exchange rates, the robust and trusted legal system in the UK
Sonepat
Gurgaon
Delhi
Mumbai
Thane
Navi Mumbai
Panvel
Mayfair
London
Indian Real Estate Market

Indian real estate sector – A snapshot
13
Residential Commercial Retail Hospitality
Sna
psho
t
Fragmented market with few large
players
Demand of over 3.0m units in the seven
major cities in 2010
Demand growth CAGR of c.19%
between 2010 and 2014
Housing shortage in urban and rural
India expected to be 21.7m and 19.7m
units respectively in 2014
Few players with presence across India
Operating model shifting from sales to
lease and maintenance
Mumbai, NCR and Bangalore account
for c.46% of total demand
Tier 1 / Non-metro cities gradually
becoming key growth areas
Fragmented market with few national
players
NCR accounts for c.30% of the total
mall supply
Demand for retail space on high streets
increasing
A competitive market with major players
Over 121,000 hotel rooms in the
country as of 2011
NCR and Mumbai by far the biggest
hospitality markets in India
Government initiatives to promote
tourism in Tier 2 and Tier 3 cities
generating demand for budget hotels
Dem
and
driv
ers
Rapid urbanisation
Rise in number of nuclear families
Rising disposable incomes
Repatriations by NRIs / HNIs
Easy availability of finance
Expected economic growth recovery
Continued growth in IT/ITES and
BFSI sectors
Expanding presence by MNCs in India
Rising disposable incomes
Growing consumerism
Growing organized retail
FDI in multi-brand retail
Increased business travel
Growing tourism
Source: Indian Real Estate Industry Analysis –March 2014, India Brand Equity Foundation (‘IBEF’)
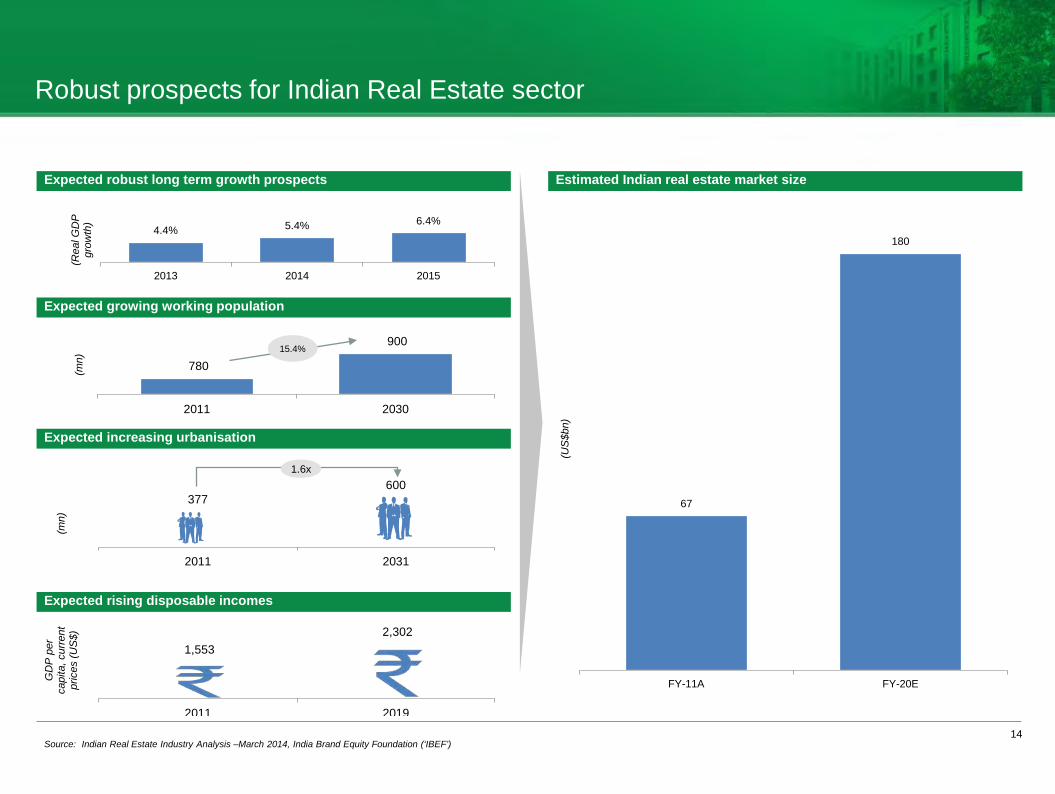
Robust prospects for Indian Real Estate sector
Expected robust long term growth prospects Estimated Indian real estate market size
Expected growing working population
Expected increasing urbanisation
Expected rising disposable incomes
67
180
FY-11A FY-20E
(US
$bn)
4.4% 5.4% 6.4%
2013 2014 2015
(Rea
l GD
P
grow
th)
14 Source: Indian Real Estate Industry Analysis –March 2014, India Brand Equity Foundation (‘IBEF’)
1,553 2,302
2011 2019
GD
P p
er
capi
ta, c
urre
nt
pric
es (U
S$)
377 600
2011 2031
(mn)
1.6x
780
900
2011 2030
(mn)
15.4%
Recent Government Policy Initiatives positive for Real Estate Market
15
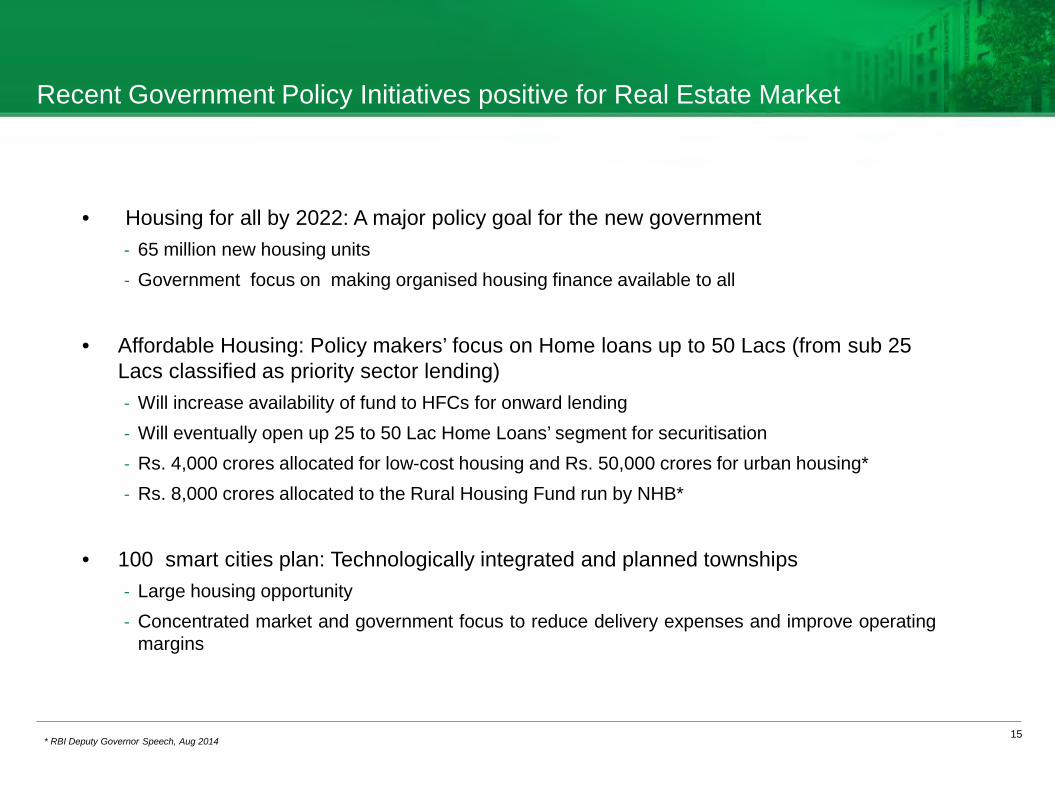
• Housing for all by 2022: A major policy goal for the new government - 65 million new housing units - Government focus on making organised housing finance available to all
• Affordable Housing: Policy makers’ focus on Home loans up to 50 Lacs (from sub 25
Lacs classified as priority sector lending) - Will increase availability of fund to HFCs for onward lending - Will eventually open up 25 to 50 Lac Home Loans’ segment for securitisation - Rs. 4,000 crores allocated for low-cost housing and Rs. 50,000 crores for urban housing* - Rs. 8,000 crores allocated to the Rural Housing Fund run by NHB*
• 100 smart cities plan: Technologically integrated and planned townships
- Large housing opportunity - Concentrated market and government focus to reduce delivery expenses and improve operating
margins
* RBI Deputy Governor Speech, Aug 2014
Financial & Operational Highlights
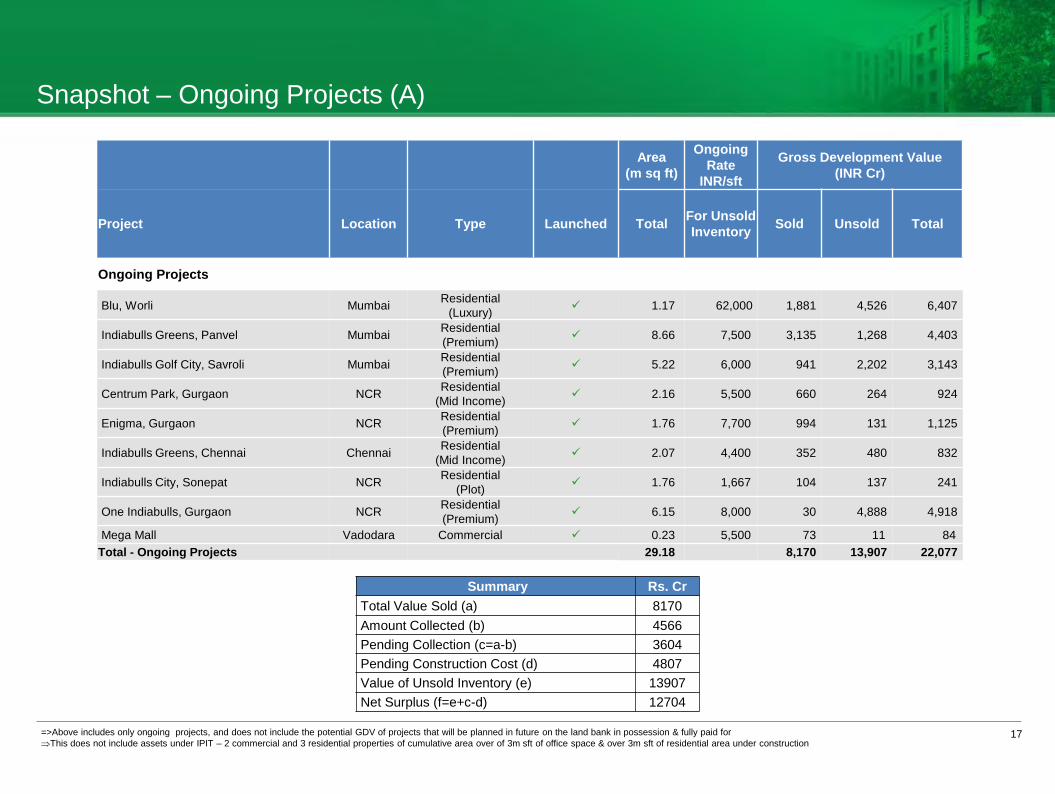
Snapshot – Ongoing Projects (A)
17 =>Above includes only ongoing projects, and does not include the potential GDV of projects that will be planned in future on the land bank in possession & fully paid for ⇒This does not include assets under IPIT – 2 commercial and 3 residential properties of cumulative area over of 3m sft of office space & over 3m sft of residential area under construction
Summary Rs. Cr Total Value Sold (a) 8170 Amount Collected (b) 4566 Pending Collection (c=a-b) 3604 Pending Construction Cost (d) 4807 Value of Unsold Inventory (e) 13907 Net Surplus (f=e+c-d) 12704
Area (m sq ft)
Ongoing Rate
INR/sft
Gross Development Value (INR Cr)
Project Location Type Launched Total For Unsold Inventory Sold Unsold Total
Ongoing Projects
Blu, Worli Mumbai Residential (Luxury) 1.17 62,000 1,881 4,526 6,407
Indiabulls Greens, Panvel Mumbai Residential (Premium) 8.66 7,500 3,135 1,268 4,403
Indiabulls Golf City, Savroli Mumbai Residential (Premium) 5.22 6,000 941 2,202 3,143
Centrum Park, Gurgaon NCR Residential (Mid Income) 2.16 5,500 660 264 924
Enigma, Gurgaon NCR Residential (Premium) 1.76 7,700 994 131 1,125
Indiabulls Greens, Chennai Chennai Residential (Mid Income) 2.07 4,400 352 480 832
Indiabulls City, Sonepat NCR Residential (Plot) 1.76 1,667 104 137 241
One Indiabulls, Gurgaon NCR Residential (Premium) 6.15 8,000 30 4,888 4,918
Mega Mall Vadodara Commercial 0.23 5,500 73 11 84 Total - Ongoing Projects 29.18 8,170 13,907 22,077

Snapshot – Planned Projects (B)
18 => Above includes only planned projects, and does not include the potential GDV of projects that will be planned in future on the land bank in possession & fully paid for =>This does not include assets under IPIT – 2 commercial and 3 residential properties of cumulative area over of 3m sft of office space & over 3m sft of residential area under construction
Summary Rs. Cr
Total Value of Unsold Inventory (a) 12761
Pending Construction Cost (b) 3925
Net Surplus (c=a-b) 8836
Area (m sq ft)
Ongoing Rate
INR/sft
Gross Development Value (INR Cr)
Project Location Type Launched Total For
Unsold Inventory
Sold Unsold Total
Planned Projects Indiabulls Kalina Mumbai Residential (Luxury) - 0.22 25,000 - 550 550
Indiabulls Mint, Gurgaon (Sec 104) NCR Commercial - 0.31 10,000 - 310 310
Indiabulls Imperial, Gurgaon (Sec 106) NCR Residential/ Commercial (Premium) - 6.98 8,500 - 5,933 5,933
Indiabulls Commercial Centre, Gurgaon (Sec 109) NCR Commercial - 0.96 8,000 - 768 768
22 Hanover Square London Residential (Luxury) - 0.10 520,000 - 5,200 5,200
Total - Planned Projects 8.57 - 12,761 12,761
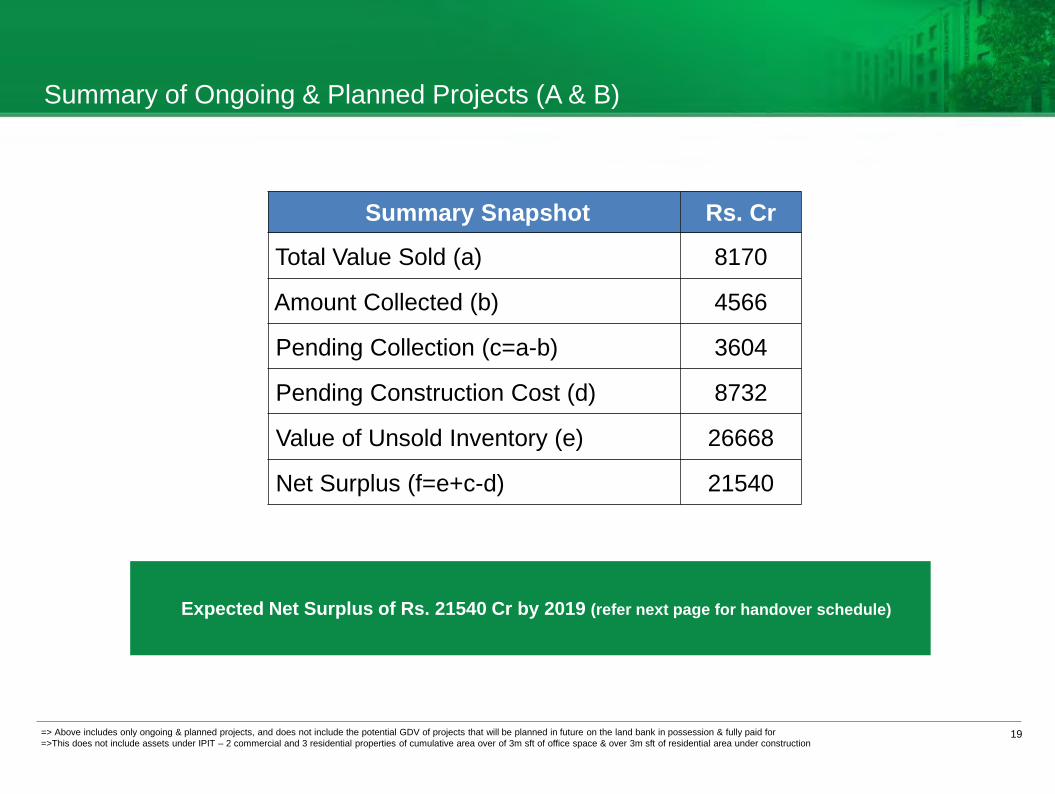
Summary of Ongoing & Planned Projects (A & B)
19 => Above includes only ongoing & planned projects, and does not include the potential GDV of projects that will be planned in future on the land bank in possession & fully paid for =>This does not include assets under IPIT – 2 commercial and 3 residential properties of cumulative area over of 3m sft of office space & over 3m sft of residential area under construction
Summary Snapshot Rs. Cr
Total Value Sold (a) 8170
Amount Collected (b) 4566
Pending Collection (c=a-b) 3604
Pending Construction Cost (d) 8732
Value of Unsold Inventory (e) 26668
Net Surplus (f=e+c-d) 21540
Expected Net Surplus of Rs. 21540 Cr by 2019 (refer next page for handover schedule)
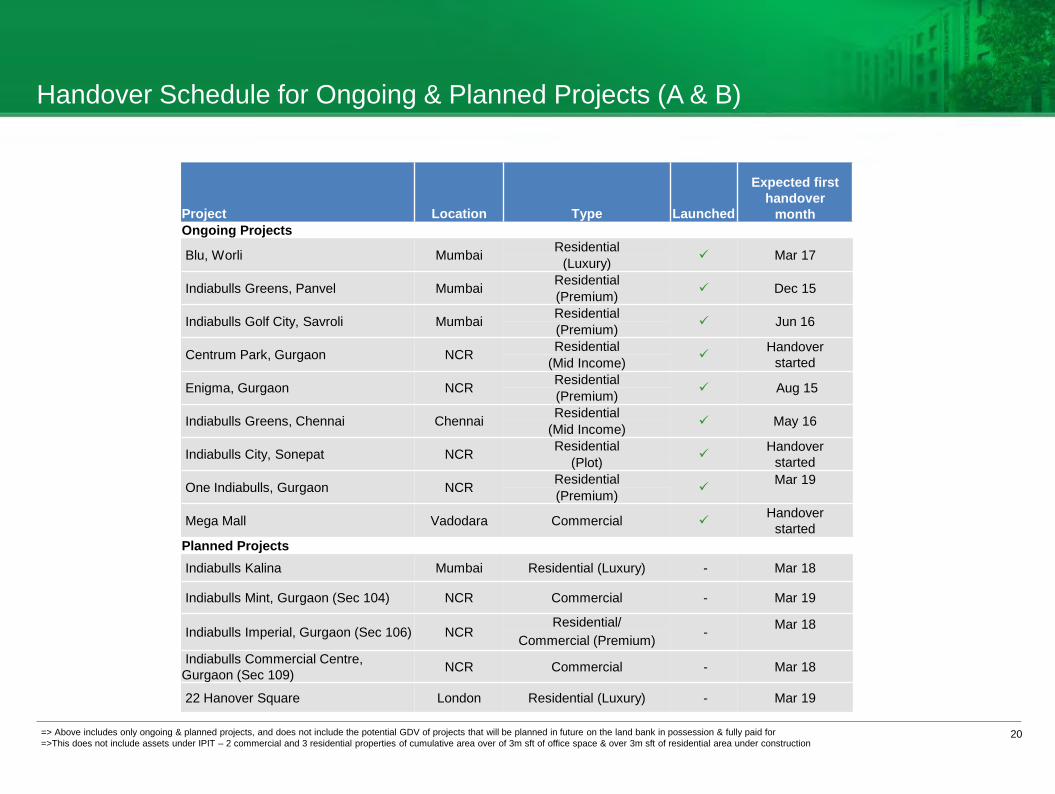
Handover Schedule for Ongoing & Planned Projects (A & B)
20 => Above includes only ongoing & planned projects, and does not include the potential GDV of projects that will be planned in future on the land bank in possession & fully paid for =>This does not include assets under IPIT – 2 commercial and 3 residential properties of cumulative area over of 3m sft of office space & over 3m sft of residential area under construction
Expected first handover
month Project Location Type Launched Ongoing Projects
Blu, Worli Mumbai Residential Mar 17 (Luxury)
Indiabulls Greens, Panvel Mumbai Residential Dec 15 (Premium)
Indiabulls Golf City, Savroli Mumbai Residential Jun 16 (Premium)
Centrum Park, Gurgaon NCR Residential Handover
started (Mid Income)
Enigma, Gurgaon NCR Residential Aug 15 (Premium)
Indiabulls Greens, Chennai Chennai Residential May 16 (Mid Income)
Indiabulls City, Sonepat NCR Residential Handover
started (Plot)
One Indiabulls, Gurgaon NCR Residential Mar 19
(Premium)
Mega Mall Vadodara Commercial Handover started
Planned Projects
Indiabulls Kalina Mumbai Residential (Luxury) - Mar 18
Indiabulls Mint, Gurgaon (Sec 104) NCR Commercial - Mar 19
Indiabulls Imperial, Gurgaon (Sec 106) NCR Residential/
- Mar 18 Commercial (Premium)
Indiabulls Commercial Centre, Gurgaon (Sec 109) NCR Commercial - Mar 18
22 Hanover Square London Residential (Luxury) - Mar 19
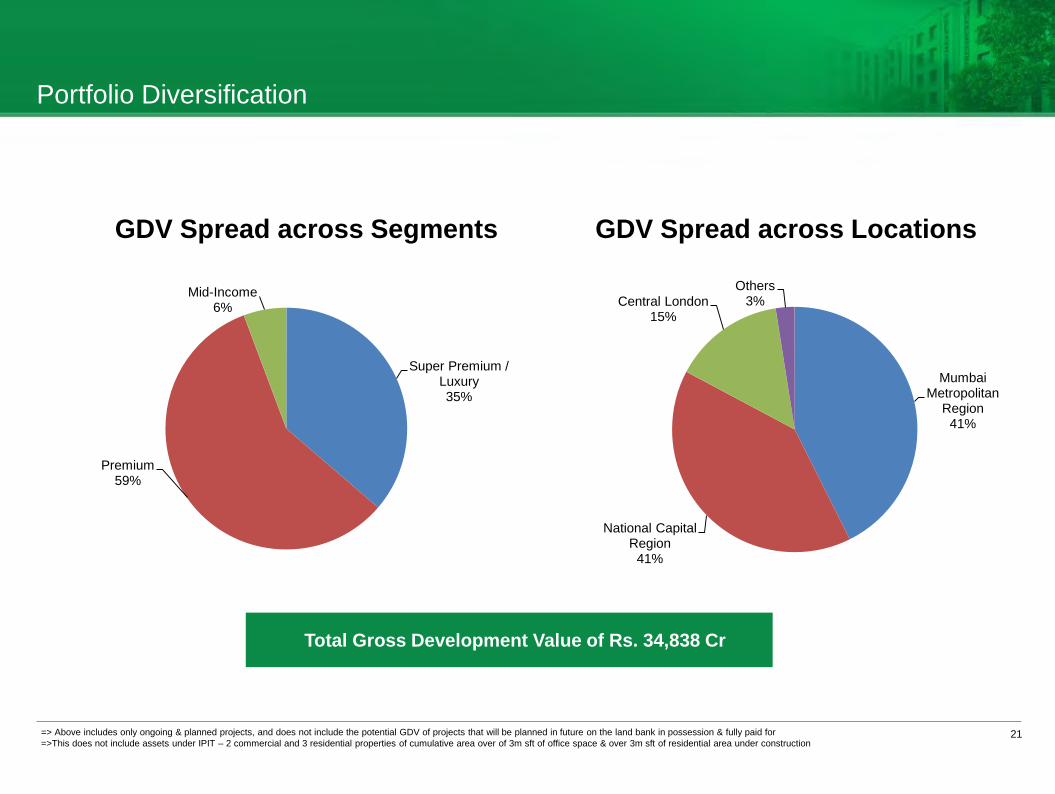
Portfolio Diversification
21
GDV Spread across Locations GDV Spread across Segments
Total Gross Development Value of Rs. 34,838 Cr
Mumbai Metropolitan
Region 41%
National Capital Region
41%
Central London 15%
Others 3%
Super Premium / Luxury 35%
Premium 59%
Mid-Income 6%
=> Above includes only ongoing & planned projects, and does not include the potential GDV of projects that will be planned in future on the land bank in possession & fully paid for =>This does not include assets under IPIT – 2 commercial and 3 residential properties of cumulative area over of 3m sft of office space & over 3m sft of residential area under construction
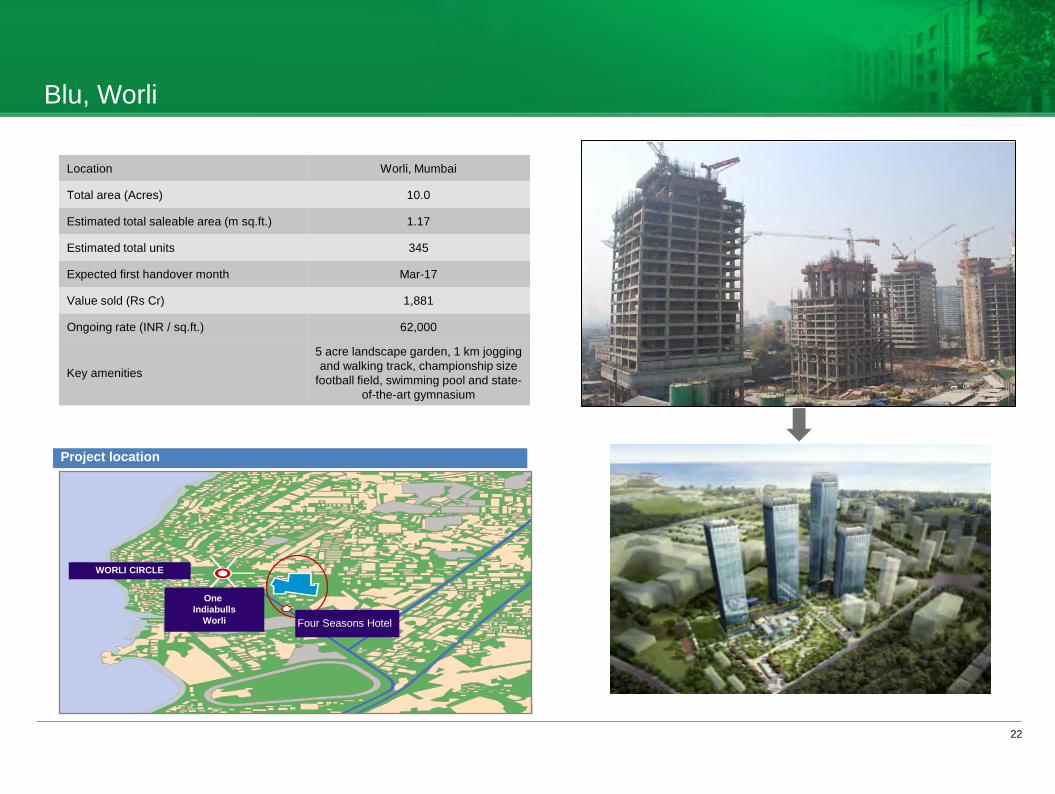
Blu, Worli
Project location
22
WORLI CIRCLE
One Indiabulls
Worli
Location Worli, Mumbai
Total area (Acres) 10.0
Estimated total saleable area (m sq.ft.) 1.17
Estimated total units 345
Expected first handover month Mar-17
Value sold (Rs Cr) 1,881
Ongoing rate (INR / sq.ft.) 62,000
Key amenities
5 acre landscape garden, 1 km jogging and walking track, championship size
football field, swimming pool and state-of-the-art gymnasium
Four Seasons Hotel

Indiabulls Greens, Panvel
Project location
Location Panvel, Navi Mumbai
Total area (Acres) 52.3
Estimated total saleable area (m sq.ft.) 8.66
Estimated total units 6,674
Expected first handover month Dec-15
Value sold (Rs Cr) 3,135
Ongoing rate (INR / sq.ft.) 7,500
Amenities
Dedicated sports facilities, shopping centers, restaurants, banks,
pharmacies & a post office, Spa with Jacuzzi, steam, sauna and
massage room
Proposed International Airport
McDonalds Kalamboli Circle MGM Hospital
Khandeswar Railway Station
Klamboli Railway Station
Panvel Railway Station
Hotal Natraj
To Pune Palaspa Phata
Somathane Railway Station
To Goa
Datta Guru Snacks
To Rasayani
ONGC Colony
To JNPT
23
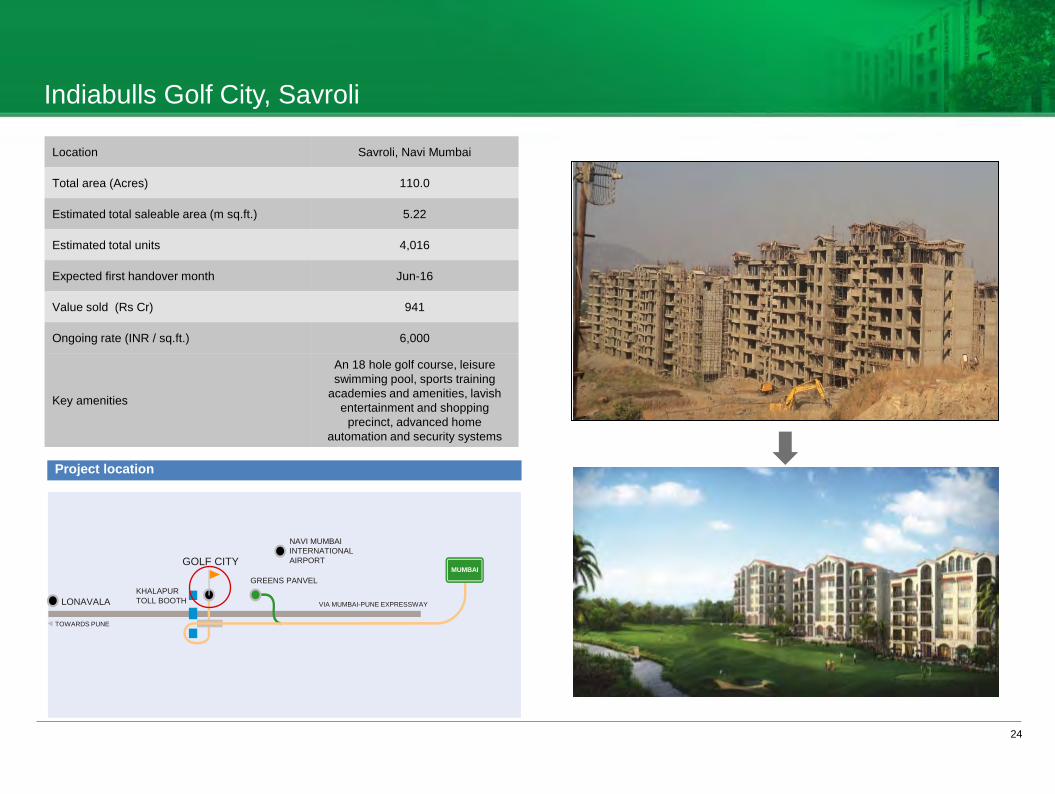
Indiabulls Golf City, Savroli
Project location
24
Location Savroli, Navi Mumbai
Total area (Acres) 110.0
Estimated total saleable area (m sq.ft.) 5.22
Estimated total units 4,016
Expected first handover month Jun-16
Value sold (Rs Cr) 941
Ongoing rate (INR / sq.ft.) 6,000
Key amenities
An 18 hole golf course, leisure swimming pool, sports training
academies and amenities, lavish entertainment and shopping
precinct, advanced home automation and security systems
LONAVALA KHALAPUR TOLL BOOTH
GREENS PANVEL
NAVI MUMBAI INTERNATIONAL AIRPORT GOLF CITY
TOWARDS PUNE
VIA MUMBAI-PUNE EXPRESSWAY
MUMBAI

Centrum Park, Gurgaon
25
Location Gurgaon (Sector 103)
Total area (Acres) 22.1
Estimated total saleable area (m sq.ft.) 2.16
Estimated total units 1,037
Expected first handover month Handover Started
Value sold (Rs Cr) 660
Ongoing (INR / sq.ft.) 5,500
Amenities Clubhouse, fully equipped
gymnasium, yoga and aerobics lounge, salon & spa
Centrum Park
115
114
112
113
109 106
107
108
110 111 105 104 101
102
102A 103
110A
2 1 Palam Vihar
33 23
3
5
6
4
3A
9 7
9A
Amunation Depot
8 12
12A
11
14 17
16
39
22 21
20 18
19
To Delhi
To Delhi
To Delhi
To Delhi
Metro route from Dwarka Along 150 mtr. wide road
24 25
28
27 25
25A
42
44 45
40 41
South City
39
46 47
49
66
32 30 ? ? IFFCO CHOWK
DLF PH-11
DLF PH-11
DLF PH-1
ATUL KATARI CHOWK Fountain Chowk
Proposed DWARKA MANESAR 150mtr. Expressway
?
South City-II
Malibu Town
CHOWK
72 ? 48
77
69 70A
70
74
75
72 A
73
35 34 33
37 36 10A
10
37C
37A 37B
37D
100
99
Honda Chowk
74 A 75
A
77
78
79
87
84
88
89
85
82
81
86
90
97
96 92
91
87
95
98
97
96
M-1
M-1A ?
METRO STATION
M-5
M-6 PROPOSED BIGGEST ISBT
M-15
? ?
M-14
M-13 M-9
M-8
M-3A
M-11 M-10
MANESAR
M-12
GURGAON
DLF PH-IV
SULTANPUR BIRD SANCTUARY
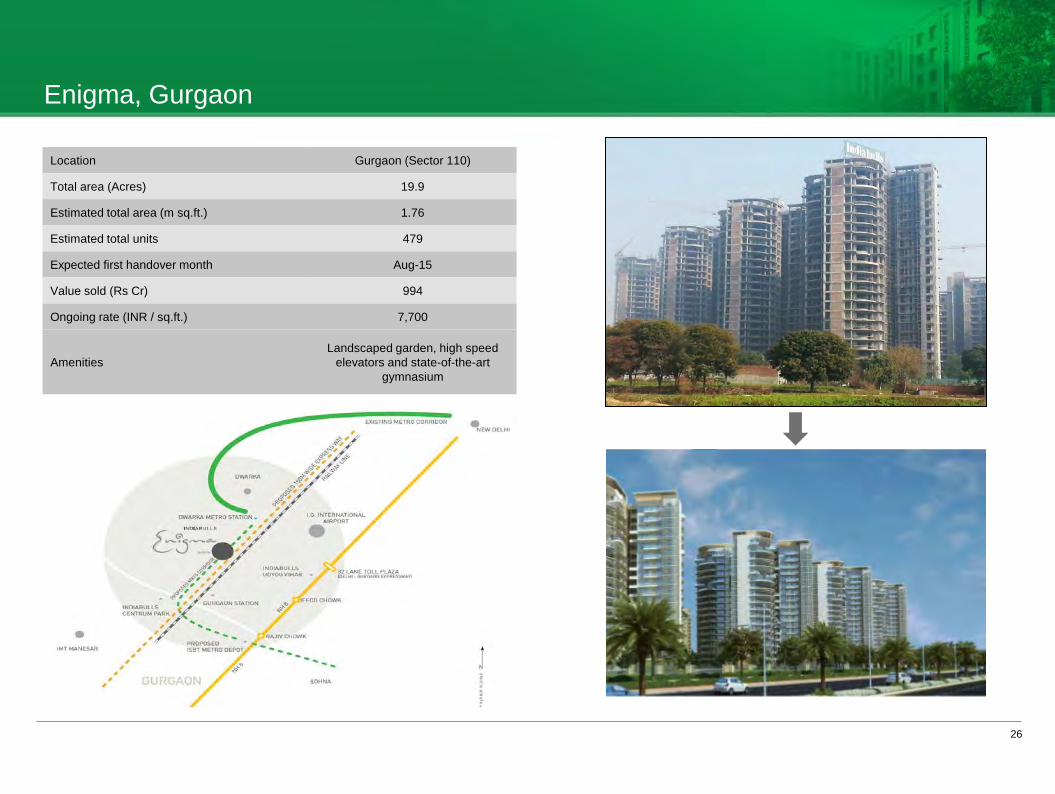
Enigma, Gurgaon
26
Location Gurgaon (Sector 110)
Total area (Acres) 19.9
Estimated total area (m sq.ft.) 1.76
Estimated total units 479
Expected first handover month Aug-15
Value sold (Rs Cr) 994
Ongoing rate (INR / sq.ft.) 7,700
Amenities Landscaped garden, high speed
elevators and state-of-the-art gymnasium
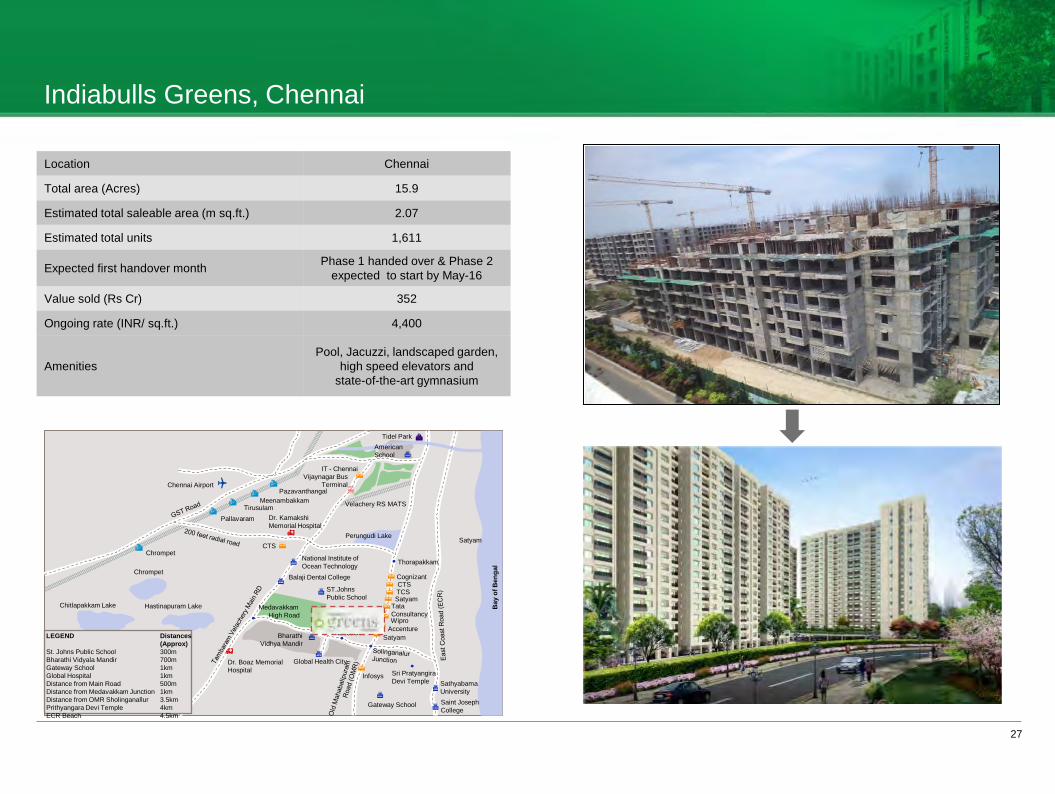
Indiabulls Greens, Chennai
27
Location Chennai
Total area (Acres) 15.9
Estimated total saleable area (m sq.ft.) 2.07
Estimated total units 1,611
Expected first handover month Phase 1 handed over & Phase 2 expected to start by May-16
Value sold (Rs Cr) 352
Ongoing rate (INR/ sq.ft.) 4,400
Amenities Pool, Jacuzzi, landscaped garden,
high speed elevators and state-of-the-art gymnasium
Chennai Airport
Tidel Park American School
IT - Chennai Vijaynagar Bus
Terminal
Velachery RS MATS
Perungudi Lake
Chrompet
Pallavaram Tirusulam
Meenambakkam Pazavanthangal
Chrompet
Chitlapakkam Lake
Dr. Boaz Memorial Hospital
Hastinapuram Lake Medavakkam High Road
Dr. Kamakshi Memorial Hospital
CTS
National Institute of Ocean Technology
Balaji Dental College
ST.Johns Public School
Bharathi Vidhya Mandir
Infosys
Global Health City
Sathyabama University Saint Joseph College
Bay
of B
enga
l
Gateway School
Sri Pratyangira Devi Temple
Elcot Sez
Thorapakkam
Cognizant CTS TCS
Satyam
Tata Consultancy
Accenture Wipro
Satyam
Satyam
LEGEND Distances (Approx) St. Johns Public School 300m Bharathi Vidyala Mandir 700m Gateway School 1km Global Hospital 1km Distance from Main Road 500m Distance from Medavakkam Junction 1km Distance from OMR Sholinganallur 3.5km Prithyangara Devi Temple 4km ECR Beach 4.5km
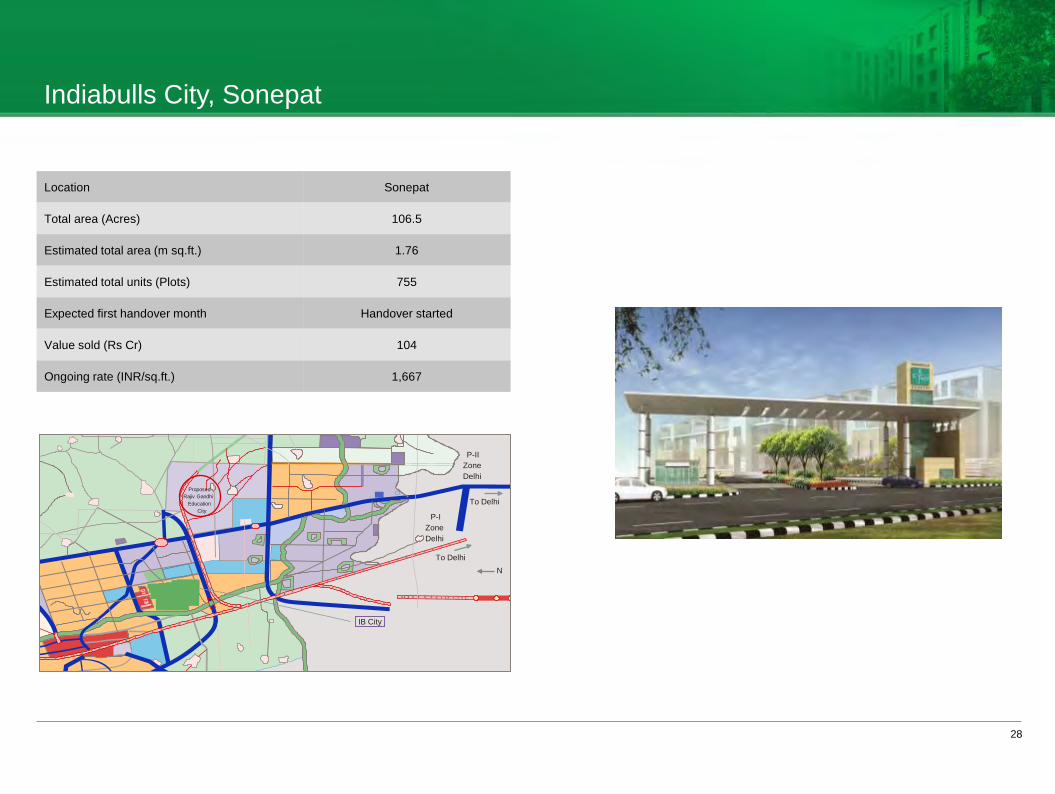
Indiabulls City, Sonepat
28
Location Sonepat
Total area (Acres) 106.5
Estimated total area (m sq.ft.) 1.76
Estimated total units (Plots) 755
Expected first handover month Handover started
Value sold (Rs Cr) 104
Ongoing rate (INR/sq.ft.) 1,667
N
IB City
P-I Zone Delhi
P-II Zone Delhi
To Delhi
To Delhi
Proposed Rajiv Gandhi
Education City
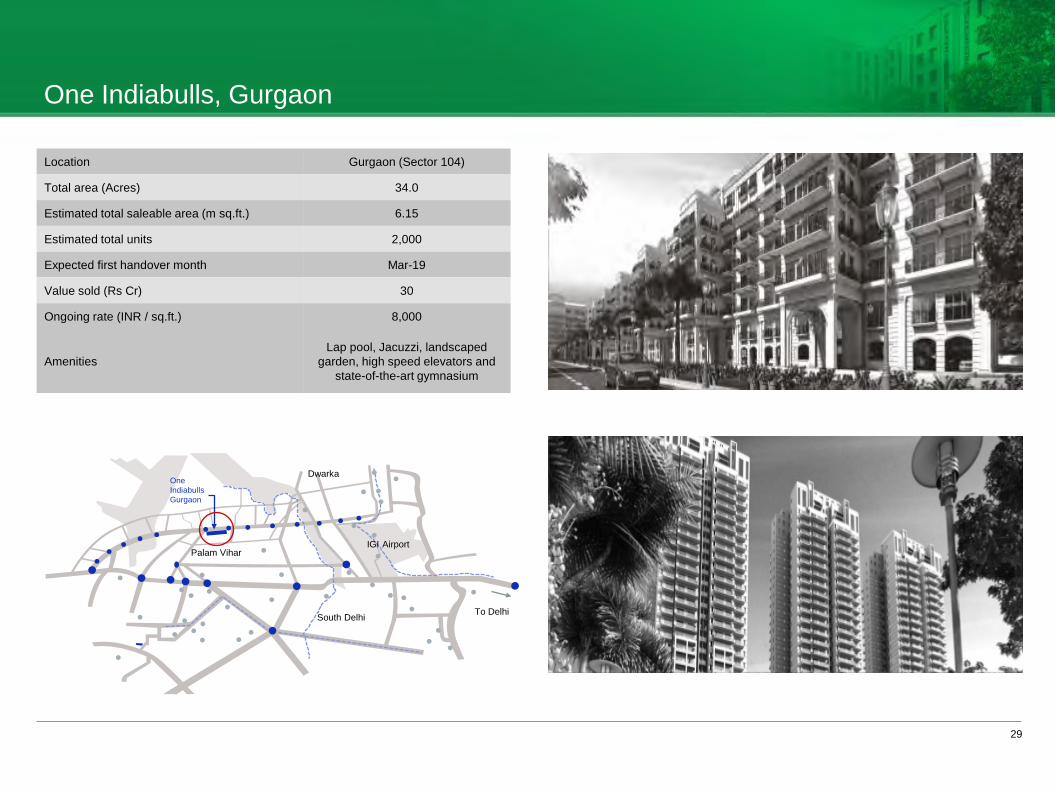
One Indiabulls, Gurgaon
29
Location Gurgaon (Sector 104)
Total area (Acres) 34.0
Estimated total saleable area (m sq.ft.) 6.15
Estimated total units 2,000
Expected first handover month Mar-19
Value sold (Rs Cr) 30
Ongoing rate (INR / sq.ft.) 8,000
Amenities Lap pool, Jacuzzi, landscaped
garden, high speed elevators and state-of-the-art gymnasium
One Indiabulls Gurgaon
South Delhi
Palam Vihar
Dwarka
To Delhi
IGI Airport
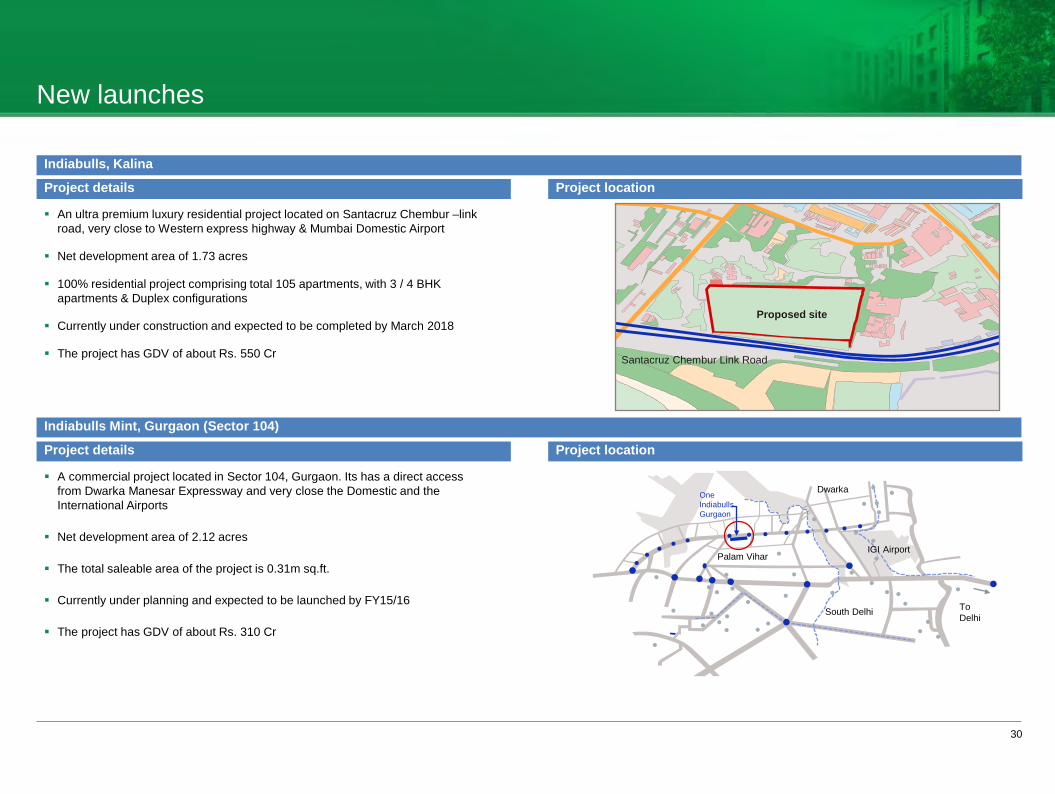
New launches
Project details
An ultra premium luxury residential project located on Santacruz Chembur –link road, very close to Western express highway & Mumbai Domestic Airport
Net development area of 1.73 acres
100% residential project comprising total 105 apartments, with 3 / 4 BHK apartments & Duplex configurations
Currently under construction and expected to be completed by March 2018
The project has GDV of about Rs. 550 Cr
Project location
Project details
A commercial project located in Sector 104, Gurgaon. Its has a direct access from Dwarka Manesar Expressway and very close the Domestic and the International Airports
Net development area of 2.12 acres
The total saleable area of the project is 0.31m sq.ft.
Currently under planning and expected to be launched by FY15/16
The project has GDV of about Rs. 310 Cr
Project location
30
Proposed site
Santacruz Chembur Link Road
One Indiabulls Gurgaon
South Delhi
Palam Vihar
Dwarka
To Delhi
IGI Airport
Indiabulls Mint, Gurgaon (Sector 104)
Indiabulls, Kalina

New launches (continued)
Indiabulls Imperial, Gurgaon (Sector 106)
Includes residential (luxury) and commercial project located in Sector 106, Gurgaon. It has a direct access from 60m wide road and very close to Dwarka Manesar Expressway, Domestic and the International Airport
Net development area of 24.1 acres and 11.1 acres for residential and commercial sections respectively
The residential project includes 1,700 apartments, divided into 2/ 3 / 4 BHK & Penthouses configration and commercial project includes 347 shops and 706 office spaces
Currently under planning and expected to be launched by FY15/16 The project has GDV of about Rs. 5,933 Cr
A Commercial project located in Sector 109, Gurgaon. It has a direct access from Dwarka Manesar Expressway and very close to the Domestic and the International Airports
Net development area of 5.9 acres and a total saleable area of 0.96m sq.ft.
Currently under planning and expected to be launched by FY15/16
The project has GDV of about Rs. 768 Cr
Indiabulls Commercial Centre, Gurgaon (Sector 109)
Project location
31
South Delhi
IGI Airport
Dwarka
Palam Vihar
Sec-42
Metro line Delhi border Proposed development
MG road Qutub Minar IIT
JNU
R a o T u l a r a m
M a r g
Nelson Mandela Road Emporio
Vasant Vihar Ryan International School Radisson
Hotel
Shiv Murti
Rajokri
Sec-27
Sec-28
Mega Mall
Hotel Bristol
Sushant Lok
Courtyard Marriott
Park Plaza
Max Hospital
Artemis Hospital
Delhi Public School
Sec-46 Sec-45 Sec-44
Cyber Park
Sec-40 Huda City Centre Stn
Hotel Crowne Plaza
IFFCO Chowk Stn
Hotel Westin Signature Tower
Rajiv Chowk
Sec-33
Hero Honda Chowk
NH 8
NH 8
Sec-34
Haldiram Toll Plaza
To Jaipur
NH 8
DT City Centre Sikanderpur Metro Stn
Cyber City Hotel Leela Kempinski
Ambience Mall
NH 8 IFFCO Chowk
Sukhrali
The Oberoi Shankar Chowk
Hotel Uppal’s Orchid NH 8
Aero City Hospitality Commercial & Retail Zone
Delhi Cantt
NH 8
Delhi University South Campus
To Delhi
Dhaula Kuan
Centaur Hotel Kapashera Crossing
Terminal 3
Old Delhi Gurgaon Road
Columbia Asia Hospital
Sec-111 Sec-110 Sec-105 Sec-104 Sec-101
Sec-100 Dwarka Expressway
Sec-99 A Sec-99 Sec-88 B
Sec-88 A
Sec-88
Sec-84
Sec-83 Proposed ISBT
N
Mini Secretariat
Bata Chowk
Sec-102 Sec-102A
Sec-103
Sec-106 Sec-109
Sec-112 Sec-113
Golf Course Diplomatic Enclave Sec-22
Sec-21
Sec-23 Sec-20
OPG World School
Sec-8 Sec-9
Sec-5 Sec-10
Sec-3
GD Goenka School
Sec-1
Sec-12
Sec-108 Sec-115
Delhi’s Reserved Green Zone
Residential Area
Fortis Hospital Travel Time
Diplomatic Enclave, Dwaraka IGI Airport NH-8 Dhaula Kuan
5 minutes 10 minutes 15 minutes 20 minutes
32
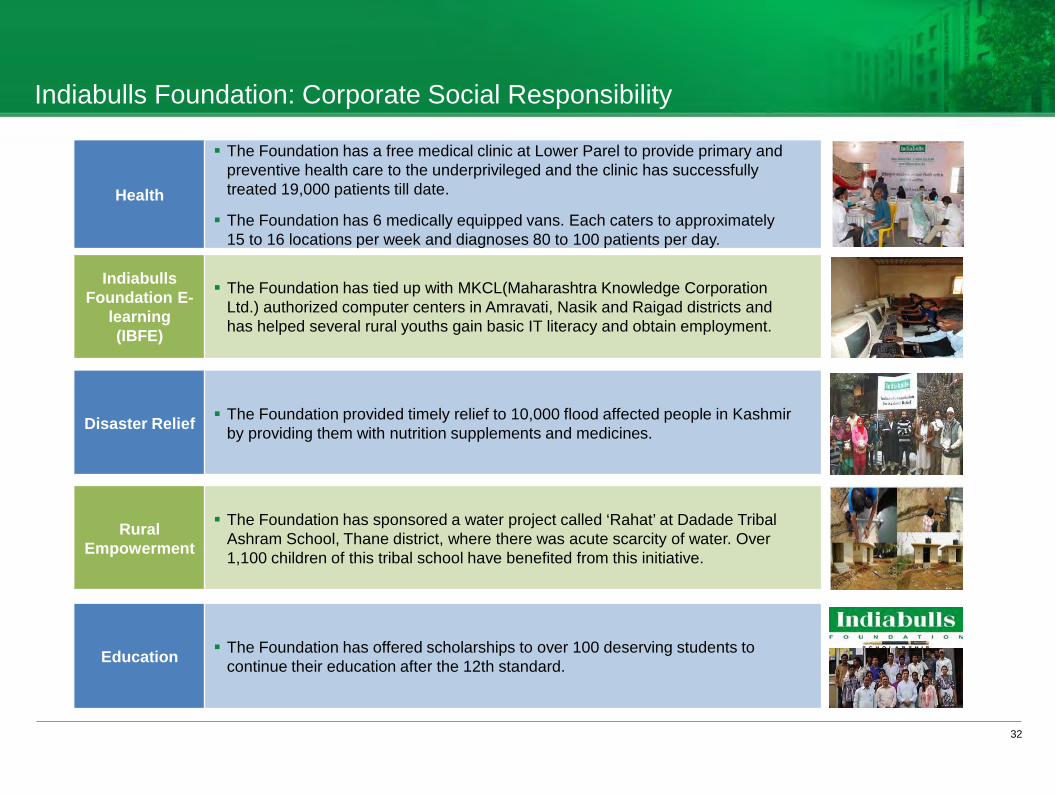
Indiabulls Foundation: Corporate Social Responsibility
Health
The Foundation has a free medical clinic at Lower Parel to provide primary and preventive health care to the underprivileged and the clinic has successfully treated 19,000 patients till date.
The Foundation has 6 medically equipped vans. Each caters to approximately 15 to 16 locations per week and diagnoses 80 to 100 patients per day.
Indiabulls Foundation E-
learning (IBFE)
The Foundation has tied up with MKCL(Maharashtra Knowledge Corporation Ltd.) authorized computer centers in Amravati, Nasik and Raigad districts and has helped several rural youths gain basic IT literacy and obtain employment.
Rural Empowerment
The Foundation has sponsored a water project called ‘Rahat’ at Dadade Tribal Ashram School, Thane district, where there was acute scarcity of water. Over 1,100 children of this tribal school have benefited from this initiative.
Disaster Relief The Foundation provided timely relief to 10,000 flood affected people in Kashmir by providing them with nutrition supplements and medicines.
Education The Foundation has offered scholarships to over 100 deserving students to continue their education after the 12th standard.

Summary Financials

34
Debt Profile
Rs in Cr
* Net Debt = Gross Debt – Cash and Cash Equivalents
IBREL enjoys AA- rating for long term debt and A1+ (highest possible) for short term debt
Bank Debt Mar'15 Dec'14
Gross Debt 6,544 6,992
Net Debt* 5,480 5,337
Ratios
* Fixed Charge Coverage Ratio (FCCR) 2.77
Net Debt/Equity 0.76
* FCCR is the ratio of ‘Consolidated EBITDA’ for last four recent completed quarters to the Consolidated Interest Expense for the period => ‘Consolidated EBITDA’ is calculated by adding back depreciation and amortisation expenses, finance costs and non-cash land and common cost to profit before tax and is a Non Indian GAAP measure.
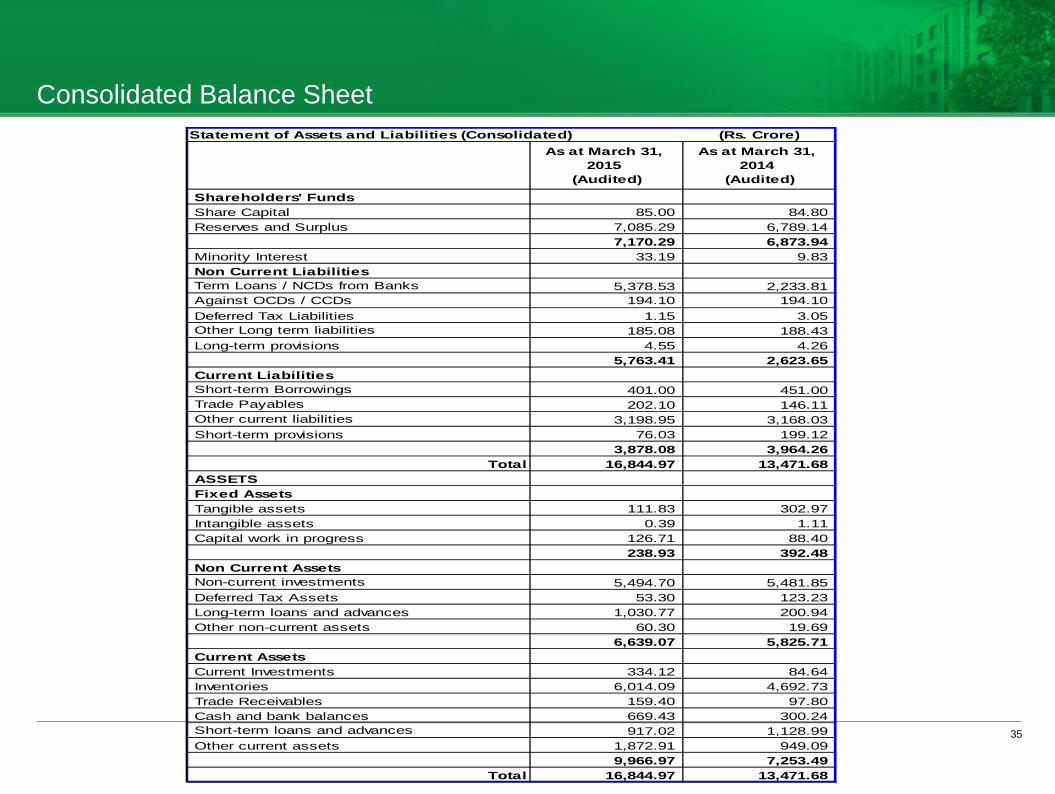
Consolidated Balance Sheet
35
Statement of Assets and Liabilities (Consolidated) (Rs. Crore)As at March 31,
2015 (Audited)
As at March 31, 2014
(Audited)Shareholders' FundsShare Capital 85.00 84.80 Reserves and Surplus 7,085.29 6,789.14
7,170.29 6,873.94 Minority Interest 33.19 9.83 Non Current LiabilitiesTerm Loans / NCDs from Banks 5,378.53 2,233.81 Against OCDs / CCDs 194.10 194.10 Deferred Tax Liabilities 1.15 3.05 Other Long term liabilities 185.08 188.43 Long-term provisions 4.55 4.26
5,763.41 2,623.65 Current LiabilitiesShort-term Borrowings 401.00 451.00 Trade Payables 202.10 146.11 Other current liabilities 3,198.95 3,168.03 Short-term provisions 76.03 199.12
3,878.08 3,964.26 Total 16,844.97 13,471.68
ASSETSFixed AssetsTangible assets 111.83 302.97 Intangible assets 0.39 1.11
Capital work in progress 126.71 88.40 238.93 392.48
Non Current AssetsNon-current investments 5,494.70 5,481.85 Deferred Tax Assets 53.30 123.23 Long-term loans and advances 1,030.77 200.94 Other non-current assets 60.30 19.69
6,639.07 5,825.71 Current AssetsCurrent Investments 334.12 84.64 Inventories 6,014.09 4,692.73 Trade Receivables 159.40 97.80 Cash and bank balances 669.43 300.24 Short-term loans and advances 917.02 1,128.99 Other current assets 1,872.91 949.09
9,966.97 7,253.49 Total 16,844.97 13,471.68
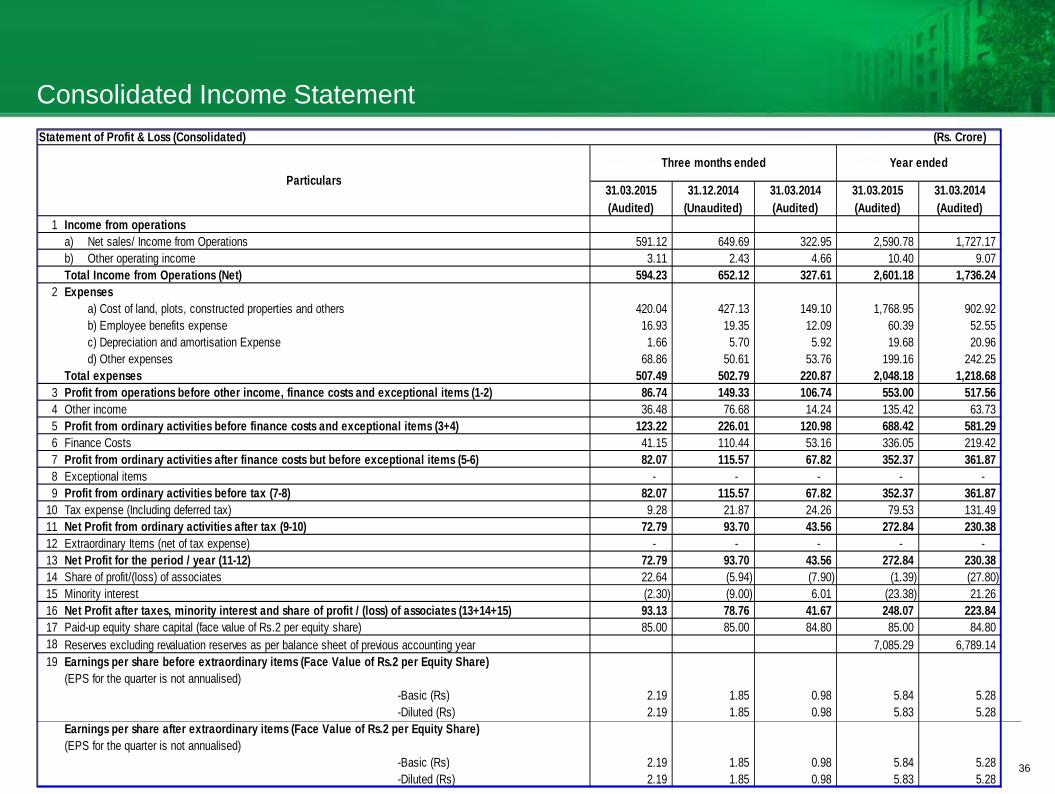
Consolidated Income Statement
36
Statement of Profit & Loss (Consolidated) (Rs. Crore)
31.03.2015 31.12.2014 31.03.2014 31.03.2015 31.03.2014(Audited) (Unaudited) (Audited) (Audited) (Audited)
1 a) Net sales/ Income from Operations 591.12 649.69 322.95 2,590.78 1,727.17 b) Other operating income 3.11 2.43 4.66 10.40 9.07 Total Income from Operations (Net) 594.23 652.12 327.61 2,601.18 1,736.24
2 a) Cost of land, plots, constructed properties and others 420.04 427.13 149.10 1,768.95 902.92 b) Employee benefits expense 16.93 19.35 12.09 60.39 52.55 c) Depreciation and amortisation Expense 1.66 5.70 5.92 19.68 20.96 d) Other expenses 68.86 50.61 53.76 199.16 242.25
507.49 502.79 220.87 2,048.18 1,218.68 3 Profit from operations before other income, finance costs and exceptional items (1-2) 86.74 149.33 106.74 553.00 517.56 4 Other income 36.48 76.68 14.24 135.42 63.73 5 Profit from ordinary activities before finance costs and exceptional items (3+4) 123.22 226.01 120.98 688.42 581.29 6 41.15 110.44 53.16 336.05 219.42 7 Profit from ordinary activities after finance costs but before exceptional items (5-6) 82.07 115.57 67.82 352.37 361.87 8 Exceptional items - - - - - 9 82.07 115.57 67.82 352.37 361.87
10 9.28 21.87 24.26 79.53 131.49 11 72.79 93.70 43.56 272.84 230.38 12 Extraordinary Items (net of tax expense) - - - - - 13 Net Profit for the period / year (11-12) 72.79 93.70 43.56 272.84 230.38 14 22.64 (5.94) (7.90) (1.39) (27.80) 15 (2.30) (9.00) 6.01 (23.38) 21.26 16 Net Profit after taxes, minority interest and share of profit / (loss) of associates (13+14+15) 93.13 78.76 41.67 248.07 223.84 17 85.00 85.00 84.80 85.00 84.80 18 7,085.29 6,789.14 19
(EPS for the quarter is not annualised) -Basic (Rs) 2.19 1.85 0.98 5.84 5.28 -Diluted (Rs) 2.19 1.85 0.98 5.83 5.28
Earnings per share after extraordinary items (Face Value of Rs.2 per Equity Share) (EPS for the quarter is not annualised)
-Basic (Rs) 2.19 1.85 0.98 5.84 5.28 -Diluted (Rs) 2.19 1.85 0.98 5.83 5.28
Year ended
Earnings per share before extraordinary items (Face Value of Rs.2 per Equity Share)
Net Profit from ordinary activities after tax (9-10)
Share of profit/(loss) of associatesMinority interest
Paid-up equity share capital (face value of Rs.2 per equity share) Reserves excluding revaluation reserves as per balance sheet of previous accounting year
Tax expense (Including deferred tax)
ParticularsThree months ended
Income from operations
Expenses
Total expenses
Finance Costs
Profit from ordinary activities before tax (7-8)
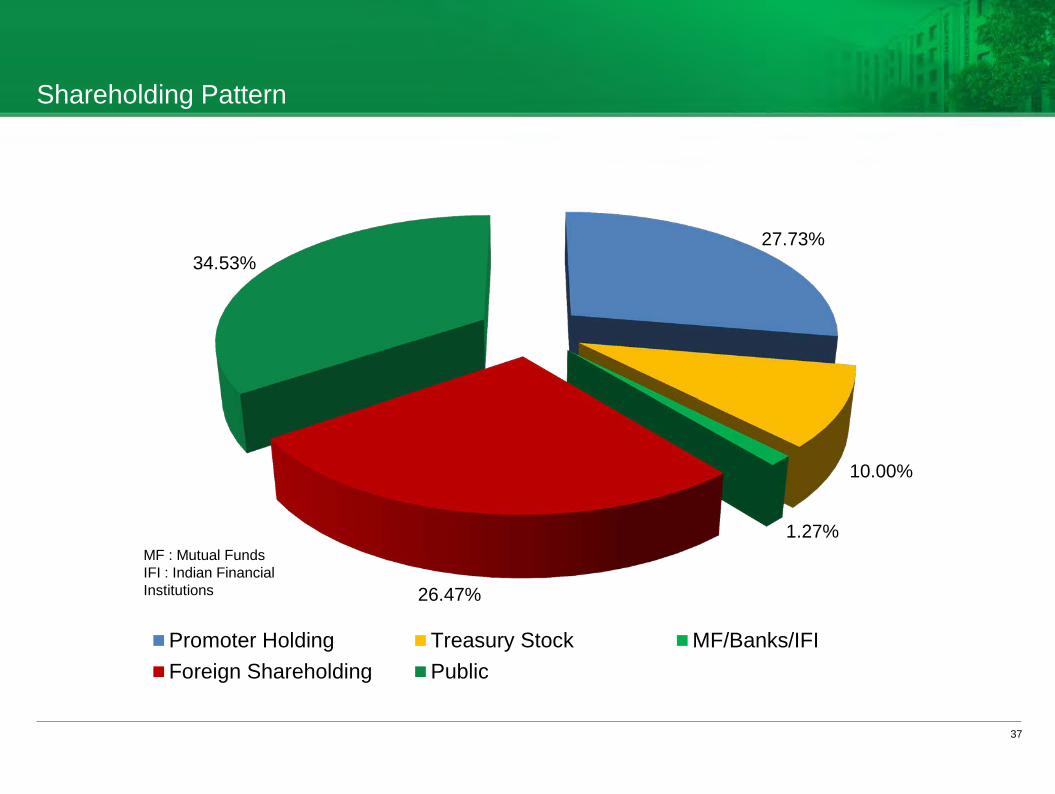
Shareholding Pattern
37
27.73%
10.00%
1.27%
26.47%
34.53%
Promoter Holding Treasury Stock MF/Banks/IFIForeign Shareholding Public
MF : Mutual Funds IFI : Indian Financial Institutions

Thank You