Embed Size (px)
Citation preview

BWBHO Audited Consolidated Financial Statements 2020
AUDITED CONSOLIDATED FINANCIAL STATEMENTS2020

C WBHO Audited Consolidated Financial Statements 2020
1 Statement of responsibility by the Board
2 Statement of compliance by the Audit Committee
2 Statement of compliance by the Company Secretary
3 Directors’ report
5 Independent Auditor’s report
10 Consolidated statement of financial position
11 Consolidated statement of financial performance and other comprehensive income
12 Consolidated statement of changes in equity
14 Consolidated statement of cash flows
15 Significant accounting policies
22 Notes to the consolidated financial statements
58 Annexure 1: Investments in subsidiaries
59 Annexure 2: Interests in joint operations
60 Annexure 3: Shareholders’ analysis
CONTENTS
WILSON BAYLY HOLMES-OVCON LIMITED(Incorporated in the Republic of South Africa)(Registration number 1982/011014/06)Share code: WBOISIN: ZAE000009932(WBHO)
REGISTERED OFFICE AND CONTACT DETAILS53 Andries StreetWynberg, Sandton, 2090PO Box 531Bergvlei, 2012Telephone: +27 11 321 7200Fax: +27 11 887 4364Website: www.wbho.co.zaEmail: [email protected]
COMPANY SECRETARYShereen Vally-KaraACIS
AUDITORSBDO South Africa Incorporated
TRANSFER SECRETARIESComputershare Investor Services (Pty) LimitedRosebank Towers15 Biermann AvenueRosebankJohannesburg 2196South AfricaTelephone: +27 11 370 5000Fax: +27 11 370 5271
SPONSORInvestec Bank Limited
STATUTORY INFORMATION
LEVEL OF ASSURANCE:These consolidated financial statements have been audited in compliance with section 30(2)(a) of the Companies Act of South Africa. The internally prepared consolidated and separate annual financial statements was supervised by the Chief Financial Officer, Charles Henwood CA(SA).
Published: 17 November 2020
1WBHO Audited Consolidated Financial Statements 2020
STATEMENT OF COMPLIANCE The consolidated financial statements are prepared in accordance with International Financial Reporting Standards (IFRS) and the interpretations adopted by the International Accounting Standards Board (IASB) and the International Financial Reporting Interpretations Committee of the IASB. The consolidated financial statements comply with the SAICA Financial Reporting Guides as issued by the Accounting Practices Committee and Financial Reporting Pronouncements as issued the by Financial Reporting Standards Council, the JSE Listings Requirements and the requirements of the Companies Act of South Africa. The directors have also prepared any other information included in the annual report and are responsible for both its accuracy and its consistency with the consolidated financial statements.
The directors acknowledge that, ultimately, they are responsible for the system of internal financial control established by the Group and place considerable importance on maintaining a strong control environment. To enable the directors to meet these responsibilities, the Board of directors (Board) sets standards for internal control aimed at reducing the risk of error or loss in a cost-effective manner. These standards include the proper delegation of responsibilities within a clearly defined framework, effective accounting procedures and adequate segregation of duties to ensure an acceptable level of risk. These controls are monitored throughout the Group and all employees are required to maintain the highest ethical standards in ensuring that the business of the Group is conducted in a manner which, in all reasonable circumstances, is above reproach. The focus of risk management within the Group is to identify, assess and monitor all known forms of risk across the Group. While operating risk cannot be fully eliminated, the Group endeavours to minimise it by ensuring that appropriate infrastructure, controls, systems and ethical behaviour are applied and managed within predetermined procedures and constraints.
Based on the information and explanations given by management and the internal auditors, the directors are of the opinion that the system of internal control provides reasonable assurance that the financial records may be relied on for the preparation of the consolidated financial statements, however, a system of internal control can provide only reasonable, and not absolute, assurance against material misstatement or loss.
STATEMENT OF RESPONSIBILITY BY THE BOARDfor the year ended 30 June 2020
The going concern basis has been applied in preparing the consolidated financial statements based on budgets and forecast cash flows for the period to 30 November 2021. Taking into account the global impact of Coronavirus (COVID-19), the directors have no reason to believe that the Group will not be a going concern in the foreseeable future. The viability of the Group is supported by the consolidated financial statements.
The consolidated financial statements have been audited by the independent auditor, BDO South Africa Incorporated, who was given unrestricted access to all financial records and the related data, including minutes of all meetings of shareholders, the Board and committees of the Board. The directors believe that all representations made to the independent auditors during their audit were valid and appropriate. The unqualified audit report of BDO South Africa Incorporated is presented on pages 5 to 9.
The preparation of the consolidated financial statements was supervised by the Chief Financial Officer, Charles Henwood CA(SA) and approved by the Board of Directors on 13 November 2020 and are signed on its behalf.
Louwtjie Nel Wolfgang NeffChairman Chief Executive Officer
17 November 2020

2 WBHO Audited Consolidated Financial Statements 2020
STATEMENT OF COMPLIANCE BY THE AUDIT COMMITTEEfor the year ended 30 June 2020
STATEMENT OF COMPLIANCE BY THE COMPANY SECRETARYfor the year ended 30 June 2020
MEMBERSAJ Bester (Chairman)KM ForbayR GardinerNS Maziya
Each of the members of the Audit Committee are independent non-executive directors. The committee meets at least four times a year to fulfil its mandate. The internal and external auditors as well as certain members of the executive and senior management attend committee meetings by invitation.
The Audit Committee has executed its duties and responsibilities in accordance with its terms of reference which are informed by the Companies Act and King IV and are approved by the Board of Directors.
The committee performed certain statutory and other duties during the year including:• monitoring the effectiveness and implementation of internal
financial controls and the adequacy of financial reporting;• ensured that the financial reporting of the Group complies with
International Financial Reporting Standards and Companies Act of South Africa;
• considered the effectiveness of the Chief Financial Officer and financial function;
• considered and reviewed the independence of the external auditor and the extent of non-audit services provided;
• reviewed the audit plans for internal and external audit; and• reviewed the key audit matters and work performed thereon
by the external auditors.
Cobus Bester Audit Committee Chairman
17 November 2020
I confirm that the Company has lodged with the Registrar of Companies all returns that are required to be lodged by a public company in terms of the Companies Act of South Africa in respect of the year ended 30 June 2020 and that all such returns are true, correct and up to date.
Shereen Vally-Kara Company Secretary
17 November 2020
3WBHO Audited Consolidated Financial Statements 2020
NATURE OF BUSINESSThe Company is listed on the securities exchange operated by the JSE Limited and is the holding company of a number of subsidiary companies principally engaged in civil engineering and building construction activities in Africa, Australia and the United Kingdom.
GROUP RESULTSRevenue increased by 6,1% to R43,1 billion (2019: R40,6 billion). A operating loss before non-trading items of R541 million (2019: profit R561 million) was recognised after accounting for a further A$82 million (R858 million) loss on the Western Roads Upgrade (WRU) and A$30 million (R314 million) loss on the 443 Queens Street projects in Australia. The total loss attributable to the equity shareholders of the Group amounted to R498 million (2019: earnings of R499 million) and the headline loss attributable to equity shareholders of the Group amounted to R487 million (2019: earnings of R495 million). A full reconciliation between earnings and headline earnings is disclosed in note 20 of the financial statements. The financial statements set out on pages 10 to 59 provide full details of the financial position, results of operations and cash flows for the year ended 30 June 2020.
COVID-19 PANDEMICOn 31 January 2020, the World Health Organisation declared the Coronavirus (COVID-19) a public health emergency. Subsequently, lockdown regulations were imposed to varying degrees in each of the countries within which the Group operates.
The health and safety of our employees has always been non-negotiable and WBHO has gone to great lengths to ensure that both its own operations and the wider industry operate safely under COVID-19 and in compliance with all government legislation and recommendations.
Following the lifting of Alert Level 5 implemented between 27 March and 30 April 2020 in South Africa, the majority of projects within the Roads and earthworks and Civil engineering divisions recommenced operations on 4 May 2020 under Alert Level 4. The remaining projects from these divisions, together with all projects within the Building division, began work on 1 June 2020 under Alert Level 3.
With the exception of specific projects in Mozambique and Botswana, projects in the rest of Africa were largely able to continue working subject to social distancing and other safety regulations. However, the closing of international borders resulted in the restricted movement of people and goods which severely impacted productivity on certain projects.
In both Australia and the United Kingdom (UK), construction was considered an essential service and, other than four client-suspended projects in the UK, operations were able to continue, albeit at reduced levels of productivity. The four projects restarted within weeks of being suspended.
The immediate impacts of COVID-19 manifested in potentially unrecoverable costs (comprising primarily of standing time in respect of unproductive plant and equipment, payroll expenses and specific health, safety and other direct COVID-19 related expenditure) and lengthy project delays as construction activity either reduced, or ceased entirely depending on the severity of the lockdown restrictions imposed.
Management’s immediate response to the pandemic comprised the following actions:• Implementation of strict safety protocols on active sites in
accordance with relevant legislation and internal policies• Notification of contractual claims to all clients
DIRECTORS’ REPORTfor the year ended 30 June 2020
• Immediate containment of all non-essential expenditure• Suspension of all capital expenditure• Withdrawal of interim dividend to shareholders • Suspension of interim bonus payments where applicable• Assessment of future cash flows against predicted activity.
In South Africa, large numbers of personnel were compelled to stay at home for various durations during the lockdown. While certain operational and support staff were able to work from home, most site-based personnel were unable to perform their duties. In the UK and Australia where some projects were suspended by clients or the commencement of new projects were delayed, certain employees were also required to remain at home.
Having reviewed the 12-month forward-looking cash flow forecasts, the Group elected to support its permanent employees as far as practically possible. By utilising annual leave and 13th cheque provisions alongside company contributed salaries for a brief period, all permanent employees were paid in full for the entire lock down period. The Group utilised the Unemployment Insurance Fund Covid-19 Temporary Employer/Employee Relief Scheme to support employees on limited duration contracts. The UK government introduced the Coronavirus Job Retention Scheme, where companies could temporarily place staff on furlough and the government would continue to pay 80% of their salaries up to £2,500. The Group made use of this scheme to support those employees unable to work in the UK.
A breakdown of the unrecoverable costs incurred that are directly attributable to COVID-19 is disclosed in note 31 of the annual financial statements.
The knock-on effect of COVID-19 on the global economy resulted in a number of active projects and imminent awards being either suspended or terminated. The negligible intake of new work over the last quarter of the reporting period has had a significantly detrimental effect on the secured order book at 30 June 2020 as well as the forward-looking pipeline of the Group. The cancellation, suspension and delays to project awards has resulted in a sharp 20,2% decline in the order book level in South Africa. The Australian and UK operations have also faced diminishing order books. Consequently, a significant re-sizing of the business was implemented to ensure that the resources of the Group were aligned with anticipated future activity levels.
SUBSIDIARIESDetails of significant subsidiary companies are included in Annexure 1. A full list of subsidiary companies is available on request from the Company Secretary.
The holding company is an investment company and consequently all profits recognised within the consolidated statement of financial performance were earned by subsidiary companies.
In terms of the shareholder agreements, Probuild Constructions (Aust.) Pty Ltd (Probuild) reacquired a further 0,41% interest from non-controlling shareholders during the period at a cost of AU$758 thousand, while WBHO Infrastructure reacquired a 4,01% from non-controlling shareholders at a cost of AU$1,7 million. The combined effect of these transactions resulted in an increase in the Group’s interest in Probuild from 87,5% to 87,9% and in WBHO Infrastructure from 90,7% to 94,8%.
In January 2020, the non-controlling shareholders of Russells Limited exercised put options in terms of the share purchase agreement. The transaction was concluded on 31 January 2020 for a consideration of £5,5 million (R106 million) and increased the Group’s shareholding in Russells Limited from 70% to 80%. Details of these transactions are included in note 12.

4 WBHO Audited Consolidated Financial Statements 2020
LOSSES IN SUBSIDIARIESIncluded in the Group’s loss before tax of R310 million are pre-tax losses from the following subsidiaries:
SubsidiaryCountry of incorporation
Amount of loss
WBHO Infrastructure Pty Ltd Australia R1 054 million
Probuild Constructions
(Aust.) Pty Ltd Australia R51 million
SHARE CAPITALThe Company has 59 890 514 ordinary shares in issue. There were no changes to the authorised or issued share capital during the current reporting period.
Subject to the regulations of the JSE, 5% of the unissued ordinary shares are under the control of the directors until the next annual general meeting (AGM), at which time shareholders will be requested to grant the directors control over 5% of the unissued ordinary shares until the next AGM.
DIVIDENDSThe Group declares dividends from cash reserves dependent upon profits earned and the availability of cash. Due to losses incurred in the current reporting period, no dividend was declared (2019: 190 cents per ordinary share).
SHARE SCHEMESDetails of transactions undertaken by the share trusts and empowerment vehicles are disclosed in note 27 of the financial statements. There have been no changes to the trustees of the share schemes for the reporting period. In certain of the share schemes, participants are advanced interest-free loans by the trust to enable them to purchase the shares offered.
The trusts are consolidated for the purposes of the consolidated financial statements.
BORROWING POWERSIn terms of the memorandum of incorporation the Company has unlimited borrowing powers.
DIRECTORATEDetails of the Company’s directors are available online at www.wbho.co.za. The business physical address, postal address and Company Secretary details are set out on the first page of the consolidated financial statements.
Mr EL Nel was appointed as executive chairman and Mr WP Neff was appointed as CEO on 20 November 2019.
In terms of the memorandum of incorporation, Ms SN Maziya retires at the forthcoming annual general meeting however, Ms Maziya is eligible for re-election. Also in terms of the memorandum of incorporation, Mr RW Gardiner and Mr H Ntene retire by rotation and offer themselves for re-election.
DIRECTORS’ SHAREHOLDINGThe direct and indirect interests of the directors are disclosed in note 24 of the financial statements.
There have been no changes to directors’ shareholdings between the reporting date and the date of this report.
RELATED PARTY TRANSACTIONSRelated party transactions are disclosed under note 24 of the financial statements.
PROPERTY, PLANT AND EQUIPMENTFull details of the property, plant and equipment are disclosed in note 2 of the financial statements.
SPECIAL RESOLUTIONSThe following special resolutions were passed at the last AGM held on 20 November 2019:
SPECIAL RESOLUTION NUMBER 1Approval of non-executive directors’ fees for the 2020 financial year.
SPECIAL RESOLUTION NUMBER 2Financial assistance to directors, prescribed officers, employee share scheme beneficiaries and related or inter-related companies and corporations.
SPECIAL RESOLUTION NUMBER 3General authority to repurchase company shares.
AUDITORSBDO South Africa Incorporated will continue in office in accordance with section 90(6) of the Companies Act. At the AGM, shareholders will be requested to re-appoint BDO South Africa Incorporated as the Group auditors for the 2021 reporting period and it is noted that Mr J Schoeman will be the individual registered auditor who will undertake the audit.
GOING CONCERNWith such high levels of uncertainty within economic markets, it is exceptionally difficult to predict what the ultimate outcome of COVID-19 on the Group will be. The directors have assessed the going concern of the Group over the next 12 months and are satisfied that the Group has access to adequate resources to continue in operational existence for the foreseeable future. As such, the going concern basis has been applied in preparing the consolidated financial statements. Stakeholders are referred to note 32 of the consolidated financial statements for full details of the going concern assessment.
EVENTS AFTER THE REPORTING DATEOn 3 June 2020 the Group advised stakeholders of an unsolicited indicative, non-binding and conditional proposal from a major international construction and civil services company to acquire the Group’s interest in Probuild Constructions Pty Ltd (Probuild), the Australian building business.
The Board is not aware of any other matter or circumstance arising since the reporting date, not otherwise dealt with in the financial statements, which significantly affects the financial position of the Group as at 30 June 2020 or the results of its operations or cash flows for the year then ended.
Shareholders are referred to note 33 of the consolidated financial statements for the full details of the subsequent events.
DIRECTORS’ REPORT (continued)for the year ended 30 June 2020

5WBHO Audited Consolidated Financial Statements 2020
Key audit matter How our audit addressed the key audit matter
Recognition of contract revenue, contract assets and contract liabilities
The construction industry is characterised by contract risk with significant judgements and estimates involved in the assessment of both current and future contractual financial performance.
IFRS 15: Revenue from Contracts with Customers is recognised over time, measured at the fair value of the consideration received or receivable and includes variations and claims. The output method, being surveys of work performed, is used to determine the progress towards the satisfaction of the performance obligation under long-term contracts with customers. Contract assets and liabilities may arise as a result of the assessment of performance obligations.
Contract modifications and contractual claims to existing performance obligations are considered when measuring the revenue over time.
The status of contracts is updated on a regular basis. In doing so, management are required to exercise significant judgement in their assessment of the valuation of contract variations and claims. Dependent on the level of judgement and estimates in each, the range on each contract can be individually material. In addition, changes in these judgements, and the related estimates as contracts progress, can result in material adjustments to revenue and margin, which can be both positive and negative. Management exercise judgement when recognising the revenue over time which involves assessing the progress made towards completing the specific performance obligation.
Our procedures included amongst others: • We evaluated and tested the operating effectiveness of the relevant
internal and automated IT system controls over the accuracy and timing of revenue recognised in the financial statements.
• For a sample of contracts, we performed the following procedures:– Construction contracts were assessed against the revenue
recognition criteria of IFRS 15: Revenue from Contracts with Customers focusing on contract classification, allocation of income and cost to performance obligations and timing of transfer of control. Where a contract contained multiple elements, management’s judgements and estimates were considered as to whether they comprised performance obligations that should be recognised for separately, and, in such cases, the judgements and estimates made in the allocation of the consideration to each performance obligation were challenged.
– Obtained an understanding of the performance and status of the contracts through enquiries with management and contract directors having oversight over the various contracts.
– Tested the contract status through the examination of externally generated evidence, such as approved variations and customer correspondence.
TO THE SHAREHOLDERS OF WILSON BAYLY HOLMES-OVCON LIMITEDREPORT ON THE AUDIT OF THE CONSOLIDATED FINANCIAL STATEMENTS OPINION We have audited the consolidated financial statements of Wilson Bayly Holmes-Ovcon Limited and its subsidiaries (the Group) set out on pages 10 to 59, which comprise the consolidated statement of financial position as at 30 June 2020, and the consolidated statement of financial performance and other comprehensive income, the consolidated statement of changes in equity and the consolidated statement of cash flows for the year then ended, and notes to the consolidated financial statements, including a summary of significant accounting policies.
In our opinion, the consolidated financial statements present fairly, in all material respects, the consolidated financial position of Wilson Bayly Holmes-Ovcon Limited and its subsidiaries as at 30 June 2020, and its consolidated financial performance and consolidated cash flows for the year then ended in accordance with International Financial Reporting Standards and the requirements of the Companies Act of South Africa.
BASIS FOR OPINIONWe conducted our audit in accordance with International Standards on Auditing (ISAs). Our responsibilities under those standards are further described in the Auditor’s Responsibilities
INDEPENDENT AUDITOR’S REPORT for the year ended 30 June 2020
for the Audit of the Consolidated Financial Statements section of our report. We are independent of the Group in accordance with the Independent Regulatory Board for Auditors’ Code of Professional Conduct for Registered Auditors (IRBA Code) and other independence requirements applicable to performing audits of financial statements in South Africa. We have fulfilled our other ethical responsibilities in accordance with the IRBA Code and in accordance with other ethical requirements applicable to performing audits in South Africa. The IRBA Code is consistent with the corresponding sections of the International Ethics Standards Board for Accountants’ International Code of Ethics for Professional Accountants (including International Independence Standards). We believe that the audit evidence we have obtained is sufficient and appropriate to provide a basis for our opinion.
KEY AUDIT MATTERSKey audit matters are those matters that, in our professional judgement, were of most significance in our audit of the consolidated financial statements of the current period. These matters were addressed in the context of our audit of the consolidated financial statements as a whole, and in forming our opinion thereon, and we do not provide a separate opinion on these matters.

6 WBHO Audited Consolidated Financial Statements 2020
INDEPENDENT AUDITOR’S REPORT (continued)for the year ended 30 June 2020
Key audit matter How our audit addressed the key audit matter
Recognition of contract revenue, contract assets and contract liabilities (continued)
The significance of revenue and the possible impact of changes to revenue recognition together with the significant judgement and estimates involved when recognising contract revenue has resulted in this area being regarded as a Key Audit Matter.
Refer to the significant judgements and critical accounting estimates (E), accounting policies note on page 15 and notes 15, and 8 to the annual financial statements for selected disclosures applicable to this matter.
– Analysed the estimates for total forecast revenue, costs and profit to complete through inspection of contract documentation, including taking into account the historical accuracy of such estimates to perform a reasonability of the estimate made by management of the progress made towards completion of the performance obligation.
– Calculated management’s estimate of the progress made towards completion of the performance obligation based on the input method and compared it to the survey of work performed to assess the reasonability of contract assets and contract liabilities recognised.
– Agreed the recognised construction revenue amounts to the externally approved and signed off revenue certificates.
– Critically assessed the provisions for loss making contracts to determine whether these appropriately reflect the expected contractual positions.
– Tested the recoverability of contract assets and the related receivables.
• We considered and consulted with an auditor expert regarding the adequacy of the disclosure made in the financial statements with reference to the disclosure requirements of IFRS 15: Revenue from Contracts with Customers.
Impairment assessment of goodwill
IAS 36: Impairment of Assets requires management to carry out an annual impairment test on recognised goodwill. The assessment, based on value in use calculations process, is complex and requires significant management judgement and estimates which includes assumptions regarding the estimated cash flows and future profitability for the related businesses against which appropriate long-term growth rates and discount rates must be applied.
The significance of the balance, together with the significant judgement and estimates involved when testing for the impairment of goodwill has resulted in this area being a Key Audit Matter.
Refer to the significant judgements and critical accounting estimates (B), accounting policies note on page 15 and note 4 to the annual financial statements for selected disclosures applicable to this matter
Our procedures included, amongst others: • We obtained the management prepared valuation models used to
determine the recoverable amount of each cash-generating unit, evaluated the appropriateness of the models used in terms of IAS 36 and industry Standards and tested the arithmetical accuracy of the models and related calculations.
• We challenged the assumptions underpinning the models, including the discount rates used, long-term growth rates and cash flow forecasts. This was achieved through: – Enquiries with management; – Challenging management on judgements and estimates applied
in the calculations;– Assessment of the reasonableness of forecast future cash flows
by comparison to historical performance and future outlook; and– Performing a sensitivity analysis considering the historical
forecasting accuracy of the Group.• We also assessed whether the significant assumptions have been
determined and applied consistently year on year and across the Group.
• We considered and consulted with an auditor expert regarding the adequacy of the disclosure made in the financial statements with reference to the disclosure requirements of IAS 36: Impairment of Assets.

7WBHO Audited Consolidated Financial Statements 2020
Key audit matter How our audit addressed the key audit matter
Completeness and adequacy of closed contract provisions and other provisions
The Group holds provisions in respect of claims and construction related provisions that have arisen, or that may arise based on prior experience, after the completion of certain contracts, as well as in relation to other matters of litigation, including current legal disputes.
The determination and valuation of provisions is judgemental by its nature and requires a high degree of estimation and judgement by contract directors and management.
The significant judgement involved when estimating the amount and timing of the provision has resulted in this area being a Key Audit Matter.
Refer to the significant judgements and critical accounting estimates (C), accounting policies note on page 15 and note 14 to the annual financial statements for selected disclosures applicable to this matter.
Our procedures included amongst others:• We enquired from contract directors and management and
inspected board minutes for actual and potential claims arising in the year and challenged the fact whether provisions are required for these claims.
• For all significant known issues and claims recognised, we inspected the calculation of the provision held and compared this to third party evidence, where available.
• In respect of open matters of litigation, we had discussions with the Group’s internal and external legal advisors and reviewed correspondence in respect of these matters.
• We assessed each provision against the requirements of IAS 37: Provisions, Contingent Liabilities and Contingent Assets.
• We considered and consulted with an auditor expert regarding the adequacy of the disclosure made in the financial statements with reference to the disclosure requirements IAS 37: Provisions, Contingent Liabilities and Contingent Assets.
Recognition and measurement of onerous contracts
The Group recognised a material provision in respect of anticipated future losses on the Western Roads Upgrade (WRU) project, as well as the 443 Queen Street project in Australia.
Management continued to assess the completion of the project, which in the six month to December 2019 has deteriorated considerable. To account for the expected final losses on these two projects, a provision of AUS$30,8 million has been recognised on WRU and AUS$20,4 million on 443 Queen Street at 30 June 2020 respectively.
The significant judgement involved when estimating the expected future losses on the WRU project and the 443 Queen Street project has resulted in this area being a Key Audit Matter.
Refer to the significant judgements and critical accounting estimates (D), accounting policies note on page 15 and note 14 to the annual financial statements for selected disclosures applicable to this matter.
Our procedures included amongst others:• Group audit instructions, addressing the significant audit areas in
general, as well as specific information required to be reported on to the Group audit team relating to onerous contracts, was issued to the component auditor. We held various planning, execution and completion meetings and discussions with the component auditor and senior management throughout the engagement.
• We assessed the competence, knowledge and experience of the component audit team and performed a review of the procedures listed below to assess the adequacy of the work performed in respect of the onerous contract.
• The following procedures, amongst others, were performed by the component auditor:– Reviewing management’s Position Paper on the loss-making
project and challenging the assumptions applied by management to agree the accuracy and completeness of the provision recognised.
The review considered:– The robustness of management’s forecasts and budgeted cost
to complete;– Current status of legal activity in relation to the contract;– Recalculation of the adjusted forecast loss to agree the clerical
accuracy of Management’s assessment; and– Review of revenue and cost adjustments included in the forecast
loss position.
• At group level, we performed the following procedures, amongst others:– We reviewed management’s assessment of the loss provision
and calculations for adequacy. – We considered and consulted with an auditor expert regarding
the adequacy of the disclosure made in the financial statements with reference to the disclosure requirements of IAS 37: Provisions, Contingent Liabilities and Contingent Assets.

8 WBHO Audited Consolidated Financial Statements 2020
INDEPENDENT AUDITOR’S REPORT (continued)for the year ended 30 June 2020
OTHER INFORMATIONThe directors are responsible for the other information. The other information comprises the information included in the document titled “Wilson Bayly Holmes-Ovcon Limited Consolidated Financial Statements for the year ended 30 June 2020” and in the document titled “Wilson Bayly Holmes-Ovcon Limited Separate Financial Statements for the year ended 30 June 2020, which includes the Directors’ Report, the Audit Committee’s Report and the Company Secretary’s Certificate as required by the Companies Act of South Africa which we obtained prior to the date of this report, and the Integrated Annual Report, which is expected to be made available to us after that date. The other information does not include the consolidated or the separate financial statements and our auditor’s reports thereon.
Our opinion on the consolidated financial statements does not cover the other information and we do not and will not express an audit opinion or any form of assurance conclusion thereon.
In connection with our audit of the consolidated financial statements, our responsibility is to read the other information and, in doing so, consider whether the other information is materially inconsistent with the consolidated financial statements or our knowledge obtained in the audit, or otherwise appears to be materially misstated. If, based on the work we have performed, we conclude that there is a material misstatement of this other information, we are required to report that fact. We have nothing to report in this regard.
RESPONSIBILITIES OF THE DIRECTORS FOR THE CONSOLIDATED FINANCIAL STATEMENTSThe directors are responsible for the preparation and fair presentation of the consolidated financial statements in accordance with International Financial Reporting Standards and the requirements of the Companies Act of South Africa, and for such internal control as the directors determine is necessary to enable the preparation of consolidated financial statements that are free from material misstatement, whether due to fraud or error.
In preparing the consolidated financial statements, the directors are responsible for assessing the Group’s ability to continue as a going concern, disclosing, as applicable, matters related to going concern and using the going concern basis of accounting unless the directors either intend to liquidate the Group or to cease operations, or have no realistic alternative but to do so.
AUDITOR’S RESPONSIBILITIES FOR THE AUDIT OF THE CONSOLIDATED FINANCIAL STATEMENTSOur objectives are to obtain reasonable assurance about whether the consolidated financial statements as a whole are free from material misstatement, whether due to fraud or error, and to issue an auditor’s report that includes our opinion. Reasonable assurance is a high level of assurance, but is not a guarantee that an audit conducted in accordance with ISAs will always detect a material misstatement when it exists. Misstatements can arise from fraud or error and are considered material if, individually or in the aggregate, they could reasonably be expected to influence the economic decisions of users taken on the basis of these consolidated financial statements.
As part of an audit in accordance with ISAs, we exercise professional judgement and maintain professional scepticism throughout the audit. We also: • Identify and assess the risks of material misstatement of the
consolidated financial statements, whether due to fraud or error, design and perform audit procedures responsive to those risks, and obtain audit evidence that is sufficient and appropriate to provide a basis for our opinion. The risk of not detecting a material misstatement resulting from fraud is higher than for one resulting from error, as fraud may involve collusion, forgery, intentional omissions, misrepresentations, or the override of internal control.
• Obtain an understanding of internal control relevant to the audit in order to design audit procedures that are appropriate in the circumstances, but not for the purpose of expressing an opinion on the effectiveness of the Group’s internal control.
• Evaluate the appropriateness of accounting policies used and the reasonableness of accounting estimates and related disclosures made by the directors.
• Conclude on the appropriateness of the directors’ use of the going concern basis of accounting and based on the audit evidence obtained, whether a material uncertainty exists related to events or conditions that may cast significant doubt on the Group’s ability to continue as a going concern. If we conclude that a material uncertainty exists, we are required to draw attention in our auditor’s report to the related disclosures in the consolidated financial statements or, if such disclosures are inadequate, to modify our opinion. Our conclusions are based on the audit evidence obtained up to the date of our auditor’s report. However, future events or conditions may cause the Group to cease to continue as a going concern.

9WBHO Audited Consolidated Financial Statements 2020
• Evaluate the overall presentation, structure and content of the consolidated financial statements, including the disclosures, and whether the consolidated financial statements represent the underlying transactions and events in a manner that achieves fair presentation.
• Obtain sufficient appropriate audit evidence regarding the financial information of the entities or business activities within the Group to express an opinion on the consolidated financial statements. We are responsible for the direction, supervision and performance of the Group audit. We remain solely responsible for our audit opinion.
We communicate with the directors regarding, among other matters, the planned scope and timing of the audit and significant audit findings, including any significant deficiencies in internal control that we identify during our audit.
We also provide the directors with a statement that we have complied with relevant ethical requirements regarding independence, and to communicate with them all relationships and other matters that may reasonably be thought to bear on our independence, and where applicable, actions taken to eliminate threats or safeguards applied.
From the matters communicated with the directors, we determine those matters that were of most significance in the audit of the consolidated financial statements of the current period and are therefore the key audit matters. We describe these matters in our auditor’s report unless law or regulation precludes public disclosure about the matter or when, in extremely rare circumstances, we determine that a matter should not be communicated in our report because the adverse consequences of doing so would reasonably be expected to outweigh the public interest benefits of such communication.
REPORT ON OTHER LEGAL AND REGULATORY REQUIREMENTSIn terms of the IRBA Rule published in Government Gazette Number 39475 dated 4 December 2015, we report that BDO South Africa Incorporated has been the auditor of Wilson Bayly Holmes-Ovcon Limited for 34 years.
BDO South Africa IncorporatedRegistered AuditorsJ SchoemanDirectorRegistered Auditor
17 November 2020
Wanderers Office Park52 Corlett DriveIllovo2196

10 WBHO Audited Consolidated Financial Statements 2020
CONSOLIDATED STATEMENT OF FINANCIAL POSITIONat 30 June 2020
Note
Audited 2020
R’000
Audited 2019
R’000
ASSETSNon-current assets
Property, plant and equipment 2 2 054 254 1 936 709Right-of-use assets 3 406 690 –Goodwill 4 1 085 894 921 103Equity-accounted investees 5 1 105 159 1 069 822Long-term receivables 6 283 598 346 916Deferred tax 11 733 583 903 657
Total 5 669 178 5 178 207
Current assetsInventories 7 364 992 327 520Contract assets 8 864 638 1 423 218Trade and other receivables 9 6 212 471 6 716 352Current tax assets 199 549 167 546Cash and cash equivalents 29 7 599 344 5 951 985
Total 15 240 994 14 586 621
Total assets 20 910 172 19 764 828
EQUITY AND LIABILITIESCapital and reserves
Share capital 28 565 28 565Reserves 5 647 882 5 843 621
Shareholders’ equity 5 676 447 5 872 186Non-controlling interests 12 205 173 261 645
Total 5 881 620 6 133 831
Non-current liabilitiesLease liabilities 3 352 336 –Long-term liabilities 10 305 984 193 164Deferred tax 11 27 979 174 131
Total 686 299 367 295
Current liabilitiesContract liabilities 8 2 998 037 2 206 511Trade and other payables 13 8 912 917 8 627 016Provisions 14 2 368 563 2 414 682Current tax liabilities 62 736 15 493
Total 14 342 253 13 263 702
Total equity and liabilities 20 910 172 19 764 828

11WBHO Audited Consolidated Financial Statements 2020
CONSOLIDATED STATEMENT OF FINANCIAL PERFORMANCE AND OTHER COMPREHENSIVE INCOMEfor the year ended 30 June 2020
Note
Audited 2020
R’000
Audited 2019
R’000
Revenue 15 43 080 295 40 614 297Operating expenses (42 266 264) (38 645 997)Administrative expenses (1 389 839) (1 423 143)Other income 34 467 16 078
Operating (loss)/profit before non-trading items 16 (541 341) 561 235Share-based payment expense (43 986) (48 394)
Operating (loss)/profit (585 327) 512 841Share of profits and losses from equity-accounted investees 109 284 51 958Finance income 17 200 864 207 012Finance costs 17 (35 013) (23 565)
(Loss)/profit before tax (310 192) 748 246Income tax expense 18 (197 921) (199 253)
(Loss)/profit for the year (508 113) 548 993Other comprehensive incomeItems that may be or have been reclassified to profit or loss:Translation of foreign operations 269 266 (61 679)Translation of foreign operations reclassified through profit or loss on disposal 14 250 –Translation of net investment in a foreign operation 178 549 (10 616)Tax effect of above items (49 994) 2 972Share of other comprehensive income from equity-accounted investees 5 55 476 16 602
Total other comprehensive (loss)/income for the year (40 566) 496 272
(Loss)/profit from operations attributable to:Equity shareholders of Wilson Bayly Holmes-Ovcon Limited (497 827) 498 528Non-controlling interests (NCI) (10 286) 50 465
(508 113) 548 993
Total comprehensive (loss)/income attributable to:Equity shareholders of Wilson Bayly Holmes-Ovcon Limited (53 860) 445 807Non-controlling interests (NCI) 13 294 50 465
(40 566) 496 272
(Loss)/earnings per share (cents) 20Basic (loss)/earnings per share (936,6) 938,7Diluted (loss)/earnings per share (936,4) 938,5

12 WBHO Audited Consolidated Financial Statements 2020
Number ofordinary
shares issued
Number ofshares held by
share trusts
Number of shares
issued tothe public
SharecapitalR’000
Foreigncurrency
translation reserve
R’000
Equity-settled share-based
paymentsR’000
Retained earnings
R’000
Shareholders’ equityR’000
Non-controlling interests
R’000
TotalequityR’000
Balance at 30 June 2018 59 890 514 6 690 393 53 200 121 28 565 213 292 14 312 5 555 470 5 811 639 207 517 6 019 156Vested shares – (4 399) 4 399 – – – – – – –Treasury shares acquired – 33 500 (33 500) – – – – – – –Adoption of IFRS 15 net of tax – – – – – – (36 049) (36 049) (7 751) (43 800)Adoption of IFRS 9 net of tax – – – – – – (57 539) (57 539) (3 428) (60 967)Total comprehensive profit for the year: (69 323) 498 528 429 205 44 220 473 425
Profit for the year – – – – – – 498 528 498 528 50 465 548 993Other comprehensive income for the year – – – – (69 323) – – (69 323) (6 245) (75 568)
Dividend paid (note 19) – – – – – – (184 100) (184 100) (26 850) (210 950)Share of movement in associates equity 16 602 – – 16 602 – 16 602Share-based payment expense – – – – – 48 394 – 48 394 – 48 394Share-based payment settlement – – – – – (81 482) – (81 481) – (81 481)Acquisition of subsidiary with NCI – – – – – – – – 120 388 120 388Acquisition of NCI without a change in control – – – – – – (74 485) (74 485) (72 451) (146 936)
Balance at 30 June 2019 59 890 514 6 719 494 53 171 020 28 565 160 571 (18 776) 5 701 825 5 872 186 261 645 6 133 831
Vested shares – (10 000) 10 000 – – – – – – –Treasury shares acquired – – – – – – – – – –Adoption of IFRS 16 net of tax (note 30) – – – – – – 3 846 3 846 662 4 508Total comprehensive profit for the year: 388 491 (497 827) (109 336) 13 294 (96 042)
Loss for the year – – – – – – (497 827) (497 827) (10 286) (508 113)Other comprehensive income for the year – – – – 388 491 – – 388 491 23 580 412 071
Dividend paid (note 19) – – – – – (109 072) (109 072) (7 875) (116 947)
Share of movement in associates Equity 55 476 – – 55 476 – 55 476Share-based payment expense – – – – 43 986 – 43 986 – 43 986Share-based payment settlement – – – – – (10 750) – (10 750) – (10 750)Acquisition of NCI without a change in control (note 12) – – – – – – (69 889) (69 889) (62 553) (132 442)
Balance at 30 June 2020 58 890 514 6 709 494 53 181 020 28 565 604 538 14 460 5 028 883 5 676 447 205 173 5 881 620
Authorised share capital– ordinary shares of 1 cent each 100 000 000– redeemable preference shares of 5 cents each 20 000 000
There were no changes to the authorised share capital during the current year.
CONSOLIDATED STATEMENT OF CHANGES IN EQUITYfor the year ended 30 June 2020

13WBHO Audited Consolidated Financial Statements 2020
Number ofordinary
shares issued
Number ofshares held by
share trusts
Number of shares
issued tothe public
SharecapitalR’000
Foreigncurrency
translation reserve
R’000
Equity-settled share-based
paymentsR’000
Retained earnings
R’000
Shareholders’ equityR’000
Non-controlling interests
R’000
TotalequityR’000
Balance at 30 June 2018 59 890 514 6 690 393 53 200 121 28 565 213 292 14 312 5 555 470 5 811 639 207 517 6 019 156Vested shares – (4 399) 4 399 – – – – – – –Treasury shares acquired – 33 500 (33 500) – – – – – – –Adoption of IFRS 15 net of tax – – – – – – (36 049) (36 049) (7 751) (43 800)Adoption of IFRS 9 net of tax – – – – – – (57 539) (57 539) (3 428) (60 967)Total comprehensive profit for the year: (69 323) 498 528 429 205 44 220 473 425
Profit for the year – – – – – – 498 528 498 528 50 465 548 993Other comprehensive income for the year – – – – (69 323) – – (69 323) (6 245) (75 568)
Dividend paid (note 19) – – – – – – (184 100) (184 100) (26 850) (210 950)Share of movement in associates equity 16 602 – – 16 602 – 16 602Share-based payment expense – – – – – 48 394 – 48 394 – 48 394Share-based payment settlement – – – – – (81 482) – (81 481) – (81 481)Acquisition of subsidiary with NCI – – – – – – – – 120 388 120 388Acquisition of NCI without a change in control – – – – – – (74 485) (74 485) (72 451) (146 936)
Balance at 30 June 2019 59 890 514 6 719 494 53 171 020 28 565 160 571 (18 776) 5 701 825 5 872 186 261 645 6 133 831
Vested shares – (10 000) 10 000 – – – – – – –Treasury shares acquired – – – – – – – – – –Adoption of IFRS 16 net of tax (note 30) – – – – – – 3 846 3 846 662 4 508Total comprehensive profit for the year: 388 491 (497 827) (109 336) 13 294 (96 042)
Loss for the year – – – – – – (497 827) (497 827) (10 286) (508 113)Other comprehensive income for the year – – – – 388 491 – – 388 491 23 580 412 071
Dividend paid (note 19) – – – – – (109 072) (109 072) (7 875) (116 947)
Share of movement in associates Equity 55 476 – – 55 476 – 55 476Share-based payment expense – – – – 43 986 – 43 986 – 43 986Share-based payment settlement – – – – – (10 750) – (10 750) – (10 750)Acquisition of NCI without a change in control (note 12) – – – – – – (69 889) (69 889) (62 553) (132 442)
Balance at 30 June 2020 58 890 514 6 709 494 53 181 020 28 565 604 538 14 460 5 028 883 5 676 447 205 173 5 881 620
Authorised share capital– ordinary shares of 1 cent each 100 000 000– redeemable preference shares of 5 cents each 20 000 000
There were no changes to the authorised share capital during the current year.

14 WBHO Audited Consolidated Financial Statements 2020
CONSOLIDATED STATEMENT OF CASH FLOWSfor the year ended 30 June 2020
Note
Audited 2020
R’000
Audited 2019
R’000
Cash flows from operating activitiesOperating (loss)/profit before working capital requirements (329 137) 1 433 340Working capital changes 1 119 537 33 448
Cash generated from operating activities 29.1 790 400 1 466 788Dividends received 72 606 –Finance income 181 814 213 806Finance costs (5 895) (12 084)Income tax paid 29.2 (171 438) (327 253)Dividends paid (113 707) (193 351)
Cash retained from operating activities 753 780 1 147 906
Cash flows from investing activitiesAdvance of long-term receivables (25 070) (19 215)Receipts from repayment of long-term receivables 57 148 49 342Acquisition of subsidiary net of cash acquired – (571 670)Additional investment in equity-accounted investees (24 292) (98 301)Acquisition of equity-accounted investees – (56 577)Loans advanced to equity-accounted investees (279 197) –Loans repaid by equity-accounted investees 516 420 10 690Settlement of contingent consideration – (17 778)Proceeds on disposal of property, plant and equipment 30 247 59 607Acquisition of property, plant and equipment (137 044) (223 234)
Cash flows from investing activities 138 212 (867 136)
Cash flows from financing activitiesBank loans received 103 357 –Repayment of bank loans – (36 668)Acquisition of NCI without a change in control (133 033) (146 936)Purchase of shares for equity-settled incentives (11 422) (89 933)Instalments in respect of lease liabilities (2019: finance lease liabilities) 29.3 (189 380) (170 963)
Cash flows from financing activities (230 478) (444 500)
Net increase/(decrease) in cash and cash equivalents 661 514 (163 730)Foreign currency translation effect on cash balances 985 845 (16 254)Cash and cash equivalents at the beginning of the year 5 951 985 5 992 461Cash and cash equivalents acquired – 139 508
Cash and cash equivalents at the end of the year 7 599 344 5 951 985

15WBHO Audited Consolidated Financial Statements 2020
SIGNIFICANT ACCOUNTING POLICIESfor the year ended 30 June 2020
REPORTING ENTITY Wilson Bayly Holmes-Ovcon Limited is a company domiciled in South Africa. The address of the Company is 53 Andries Street, Wynberg, Sandton, 2090. The consolidated financial statements of the Company as at and for the period ended 30 June 2020 comprise the Company and its subsidiaries (together referred to as the Group). The Group is principally engaged in civil engineering and building construction activities in Africa, Australia and the United Kingdom as well as owning a number of subsidiary companies and participating in joint arrangements engaged in similar activities both locally and internationally.
STATEMENT OF COMPLIANCE The consolidated financial statements (financial statements) are prepared in accordance with International Financial Reporting Standards (IFRS) and the interpretations adopted by the International Accounting Standards Board (IASB) and the International Financial Reporting Interpretations Committee of the IASB. The financial statements comply with the SAICA Financial Reporting Guides as issued by the Accounting Practices Committee and Financial Reporting Pronouncements as issued by the Financial Reporting Standards Council, the JSE Listings Requirements and the requirements of the Companies Act of South Africa.
BASIS OF PREPARATION The financial statements have been prepared on the historical cost basis, except for contingent consideration which is measured at fair value. The accounting policies adopted have been consistently applied throughout the Group to all the periods presented except for the adoption of IFRS 16 on lease accounting as set out in note 30. The financial statements have been prepared on the going concern basis.
The financial statements are presented in South African Rands, which is the functional currency of the holding company in the Group.
SIGNIFICANT JUDGEMENTS AND CRITICAL ACCOUNTING ESTIMATES In preparing the financial statements, management is required to make estimates and assumptions that affect the application of the Group’s accounting policies and recognised amounts of assets, liabilities, income and expenses. Judgements and estimates are continually evaluated and are based on historical experience and other factors, including expectations of future events that are believed to be reasonable under the circumstances. Actual results may differ from these estimates. Significant judgements and estimates include:
A) CLASSIFICATION OF INVESTMENTS Judgement has been applied in determining the classification of joint arrangements and equity-accounted investments depending on the contractual rights and obligations of each investor. The judgements used have been disclosed in note 5.
B) IMPAIRMENT OF GOODWILL Estimates are made in determining the recoverable amounts of cash-generating units (CGUs), based on the greater of value-in-use and fair value less costs to sell calculations. The estimates used have been disclosed in note 4.
C) PROVISIONS Estimates are made of the expected cash outflow taking into account that the exact amount and timing of the outflow is uncertain. This has been disclosed in note 14.
D) ONEROUS CONTRACT PROVISION The Group has made provision for the unavoidable costs of meeting its obligations in respect of a contract in Australia, to the extent that such costs exceed the economic benefits expected to be received.
The outcome of pending and future legal, judicial, regulatory and commercial-in-confidence negotiations cannot be predicted with certainty. An adverse outcome of any of these variables could result in additional costs not being recovered, either wholly or partially, under the existing provision. Similarly, if outcomes are more positive, the existing provision disclosed in note 14 may be reduced.
E) REVENUE RECOGNITION: DETERMINING THE TRANSACTION PRICE OF CONSTRUCTION CONTRACTS When determining the transaction price of a contract, management is required to make estimates of the value of unapproved variations and claims as well as the probability that they will not be reversed. Revenue is disclosed in note 15.
F) FAIR VALUE The Group is required to measure fair value for both financial and non-financial assets and liabilities and when recognising identifiable assets and liabilities under business combinations. Judgement and estimates are required when determining the inputs to be used in the various valuation methods used.
G) EXPECTED CREDIT LOSS The Group utilises statistical modelling when calculating probabilities of default and loss-given ratios. These, together with forward-looking macro-economic factors, are applied when determining expected credit losses. Judgement and assumptions are required when determining certain inputs to be used in the model as well as the future impact of forward-looking macro-economic factors on receivables balances. Details of these assessments are disclosed in note 25.
H) LEASES Judgement is applied in determining the lease term for lease contracts in which the Group is a lessee, including whether the Group is reasonably certain to exercise lease options. This has been disclosed in note 3.
I) TAX When recognising a deferred tax asset, the Group assesses the extent to which it is probable that taxable profits will be available against which tax losses and deductible temporary differences can be utilised. This has been disclosed in note 18. The South Africa tax rate of 28% is used as the starting rate for the tax rate reconciliation as this is the tax rate of the parent company and approximates the effective tax rate for the Group.

16 WBHO Audited Consolidated Financial Statements 2020
BASIS OF CONSOLIDATION BUSINESS COMBINATIONS The acquisition method of accounting is used to account for business combinations when control is transferred to the Group. The consideration transferred for the acquisition of a business is measured at fair value, which is calculated as the sum of the net fair values of the assets transferred by the Group. At the acquisition date, the identifiable assets acquired and the liabilities assumed are recognised at their fair value. Transaction costs are expensed in profit or loss.
Any contingent consideration is measured at fair value at the date of acquisition and remeasured at fair value at each reporting date and subsequent changes in the fair value of the contingent consideration are recognised in profit or loss.
If the initial accounting for the business combination is incomplete by the end of the reporting period in which the combination occurs, the Group reports provisional amounts for the items for which the accounting is incomplete. Those provisional amounts are adjusted during the measurement period, or additional assets or liabilities are recognised, to reflect new information obtained about facts and circumstances that existed at the acquisition date that, if known, would have affected the amounts recognised at that date.
TRANSACTIONS ELIMINATED ON CONSOLIDATIONIntra-group balances and transactions, and any unrealised income and expenses arising from intra-group transactions, are eliminated. Unrealised gains arising from transactions with equity-accounted investees are eliminated against the investment to the extent of the Group’s interest in the investee. Unrealised losses are eliminated in the same way as unrealised gains, but only to the extent that there is no evidence of impairment.
SUBSIDIARIESSubsidiaries are entities controlled by the Group. The Group obtains control of a subsidiary when it becomes exposed to, or gains rights to, variable returns from its involvement with the subsidiary and has the ability to affect those returns through its power over the subsidiary. The financial statements of subsidiaries are included in the consolidated financial statements from the date on which control commences until it is classified as held-for-sale or the date on which control ceases. The financial results of subsidiaries are consolidated with similar items on a line-by-line basis.
NON-CONTROLLING INTERESTS Any non-controlling interests in a subsidiary is initially recognised at the non-controlling interests proportionate share of the subsidiary’s net assets. Thereafter the carrying amount of non-controlling interests includes any subsequent changes in the subsidiary’s equity. Total comprehensive income is attributed to non-controlling interest even if this results in the non-controlling interest having a deficit balance.
CHANGES IN SHAREHOLDING Changes in shareholding that do not result in a loss of control are accounted for as equity. The non-controlling interest is adjusted to reflect the changes in their relative interests in the subsidiary. Any difference between this amount and the fair value of the consideration paid or received is recognised directly in equity and attributed to the owners of the parent.
LOSS OF CONTROLWhen the Group loses control over a subsidiary the carrying amount of the subsidiary’s assets and liabilities are derecognised together with any associated non-controlling interests and other components of equity. Any retained interest in the former subsidiary is remeasured at fair value at the date control is lost. Any resulting gain or loss is recognised in profit or loss.
JOINT OPERATIONSJoint operations are arrangements where the parties have joint control of the assets as well as the obligations in respect of liabilities as they pertain to the arrangement. The financial and operating decisions in respect of joint operations require the unanimous consent of all the parties. The Group as a joint operator recognises in relation to its interest in a joint operation:• its assets, including its share of any assets held jointly;• its liabilities, including its share of any liabilities incurred jointly; • its share of the revenue from the sale of the output by the joint
operation; and• its expenses, including its share of any expenses incurred jointly.
EQUITY-ACCOUNTED INVESTEESThe Group’s interests in equity-accounted investees comprise interests in associates and joint ventures.
An associate company is an entity over which the Group has the ability to exercise significant influence. A joint venture is an arrangement in which the Group has joint control, whereby the Group has rights to the net assets of the arrangement, rather than rights to its assets and obligations for its liabilities.
Interests in associates and joint ventures are accounted for using the equity method. They are initially recognised at cost, which includes transaction costs. Subsequent to initial recognition, the financial statements include the Group’s share of the profit or loss and other comprehensive income of equity-accounted investees, up until the date on which significant influence or joint control ceases.
PROPERTY, PLANT AND EQUIPMENTMEASUREMENT Items of property, plant and equipment are measured at cost less accumulated depreciation and any accumulated impairment losses.
SUBSEQUENT COSTS Subsequent costs are capitalised only when it is probable that the future economic benefits associated with the item will flow to the Group and these costs can be measured reliably.
DEPRECIATION Items of property, plant and equipment are depreciated to their estimated residual values over their expected useful lives. Depreciation is recognised in profit or loss, unless it is capitalised to the cost of another asset. Land is not depreciated. The depreciation methods, estimated useful lives and residual values are reviewed at each reporting date and adjusted if appropriate. The depreciation methods and useful lives are set out in note 2.
DERECOGNITION Gains and losses on disposal of property, plant and equipment are determined by deducting the carrying amount from the proceeds and are recognised in profit or loss.
SIGNIFICANT ACCOUNTING POLICIES (continued)for the year ended 30 June 2020

17WBHO Audited Consolidated Financial Statements 2020
LEASES With effect from 1 July 2019, the Group adopted IFRS 16: Leases applying the modified retrospective method. The cumulative effect of initial application has been recognised in retained earnings. As such, the comparative amounts are disclosed using the previous accounting treatment for leases, namely IAS 17: Leases and IFRIC 4: Determining whether an Arrangement contains a Lease. Both accounting policies have been included for the convenience of the users of these financial statements.
ACCOUNTING POLICY APPLICABLE FROM 1 JULY 2019:At inception of the contract, the Group assesses whether a contract is, or contains, a lease. A contract is, or contains, a lease if the contract conveys the right to control the use of an identified asset for a period of time in exchange for consideration. To assess whether a contract conveys the right to control the use of an identified asset, the Group uses the definition of a lease in IFRS 16. This policy is applied to contracts entered into, on or after 1 January 2019.
AS LESSEEThe Group recognises a right-of-use asset and the corresponding lease liability at the commencement of the lease. The recognition exemptions for leases of low value assets and short-term leases have been applied whereby the lease payments associated with these leases are recognised as an expense on a straight-line basis over lease term.
The lease liability is initially measured at the present value of the contractual lease payments due to the lessor over the lease term, discounted using the rate implicit in the lease, or if this rate cannot be readily determined, using the incremental borrowing rate of the Group. Generally, the Group uses its incremental borrowing rate as the discount rate, obtained from various external financing sources, which is specific to each geographical region.
Lease payments consist of:• fixed lease payments less any lease incentives;• variable lease payments depending on an index or a rate initially
measured using the index or rate as at the commencement date; and
• penalties for terminating a lease agreement, if the Group is reasonably certain to exercise termination options.
The lease term is determined as the non-cancellable period of a lease, which includes optional periods where the Group is reasonably certain to exercise lease extensions or reasonably certain not to exercise terminate options.
Subsequently, the lease liability is measured at amortised cost using the effective interest method. A lease liability is remeasured when: • there is a change in the lease term;• there is a change in the Group’s assessment of whether it will
exercise an extension or termination option;• the future lease payments change due to a change in an index or
rate used to determine the lease payments; or• a lease contract is modified and the lease modification is not
accounted for as a separate lease.
When a lease liability is remeasured, an adjustment is made to the corresponding right-of-use asset or is recognised in profit or loss if the carrying amount of the right-of-use asset has been reduced to zero.
A right-of-use asset is initially measured at cost, comprising the initial measurement of the lease liability, adjusted for any lease payments made at, or before the commencement date, plus any
initial direct costs incurred and less any lease incentives received. Right-of-use assets are depreciated on a straight-line basis over the shorter of their estimated useful life and the lease term. In addition, right-of-use assets are subject to impairment, and adjusted for certain remeasurements of the lease liability.
The Group presents right-of-use assets and the non-current portion of lease liabilities as separate line items in the statement of financial position. The non-current portion of lease liabilities previously recognised as finance leases is included as part of long-term liabilities. The current portion of lease liabilities is included in trade and other payables.
AS LESSORThe Group has entered into a lease agreement as a lessor with respect to a property sub-lease.
When the Group acts as a lessor, it determines at lease inception whether each lease is a finance lease or an operating lease.
To classify each lease, the Group makes an overall assessment of whether the lease transfers substantially all of the risks and rewards incidental to ownership of the underlying asset. If this is the case, then the lease is a finance lease; if not, then it is an operating lease. As part of this assessment, the Group considers certain indicators such as whether the lease is for the major part of the economic life of the asset.
When the Group is an intermediate lessor, it accounts for its interests in the head lease and the sub-lease separately. It assesses the lease classification of a sub-lease with reference to the right-of-use asset arising from the head lease, not with reference to the underlying asset.
Amounts due from lessees under finance leases are recognised as a lease receivable. The non-current and current portions of the lease receivable are included in long-term receivables and trade and other receivables respectively. The Group applies the derecognition and impairment requirements in IFRS 9 to the lease receivable.
ACCOUNTING POLICY BEFORE 1 JULY 2019Under IAS 17, leases were required to be classified as either a finance lease or an operating lease.
FINANCE LEASESAssets held under finance leases, where the risks and rewards of ownership had been transferred, were capitalised as property, plant and equipment. Finance lease assets were initially recognised at an amount equal to the lower of the fair value of the leased property and the present value of the minimum lease payments, and depreciated over their useful lives. The capital portion of the lease was included as part of long-term liabilities with the current portion included in trade and other payables in the statement of financial position. The finance costs were recognised in profit or loss.
OPERATING LEASESLeases of assets under which the risks and rewards of ownership were effectively retained by the lessor were classified as operating leases. Operating lease rentals were recognised in profit or loss on a straight-line basis over the period of the lease. The difference between the amount recognised as an expense and the contractual payment was recognised as an operating lease asset or liability. This asset or liability was not discounted.
18 WBHO Audited Consolidated Financial Statements 2020
GOODWILL Goodwill is measured as the excess of the sum of the consideration transferred, the amount of any non-controlling interest in the acquiree, and the fair value of the acquirer’s previously held equity interest in the acquiree over the net of the acquisition-date amounts of the identifiable assets acquired and the liabilities assumed. If, after reassessment, the net of the acquisition-date amounts of the identifiable assets acquired and liabilities assumed exceeds the sum of the consideration transferred, the amount of any non-controlling interests in the acquiree and the fair value of the acquirers’ previously held interest in the acquiree, the excess is recognised immediately in profit or loss as a gain on bargain purchase.
Goodwill arising on the acquisition of subsidiaries is measured at cost less accumulated impairment losses. Goodwill arising on the acquisition of associates or joint ventures is included in the equity-accounted investees.
On disposal of a subsidiary the attributable goodwill is included in the determination of the profit or loss on disposal.
MEASUREMENT OF FAIR VALUES Fair values are categorised into different levels within a fair value hierarchy based on the inputs used in the valuation techniques as follows: • Level 1: quoted prices (unadjusted) in active markets for identical
assets or liabilities; • Level 2: inputs other than quoted prices included in Level 1 that
are observable for the asset or liability, either directly (i.e. as prices) or indirectly (i.e. derived from prices); and
• Level 3: inputs for the asset or liability that are not based on observable market data (unobservable inputs).
Where the inputs used to measure the fair value of an asset or a liability fall into different levels of the fair value hierarchy, the lowest level is used to categorise the fair value measurement in its entirety.
The Group recognises transfers between levels of the fair value hierarchy at the end of the reporting period during which the change has occurred.
FINANCIAL INSTRUMENTS RECOGNITION AND INITIAL MEASUREMENTTrade receivables and debt securities issued are initially recognised when they are originated. All other financial assets and financial liabilities are initially recognised when the Group becomes a party to the contractual provisions of the instrument.
A financial asset (unless it is a trade receivable without a significant financing component) or financial liability is initially measured at fair value. Transaction costs that are directly attributable to its acquisition or issue are recognised when an item is not measured at fair value. A trade receivable without a significant financing component is initially measured at the transaction price.
CLASSIFICATION AND SUBSEQUENT MEASUREMENT OF FINANCIAL ASSETSFinancial assets that meet the following conditions are classified and subsequently measured at amortised cost:• the financial asset (contract assets, contract receivables and
trade and other receivables) is held within a business model where the objective is to hold the financial assets in order to collect contractual cash flows; and
• the contractual terms of the financial asset (long-term receivables and equity loans related to equity-accounted entities) give rise on specified dates to cash flows that are solely payments of principal and interest on the principal amount outstanding.
In assessing whether the contractual cash flows are solely payments of principle and interest, the Group considers the contractual terms of the instrument. This includes assessing whether the financial asset contains a contractual term that could change the timing or amount of contractual cash flows such that it would not meet this condition. In making this assessment, the Group considers contingent events that would change the amount or timing of cash flows and terms that may adjust the amount to be repaid.
All financial assets of the Group are classified as measured at amortised cost.
Financial assets at amortised cost are subsequently measured at amortised cost using the effective interest method. The amortised cost is reduced by impairment losses. Interest income, foreign exchange gains and losses and impairment are recognised in profit or loss. Any gain or loss on derecognition is recognised in profit or loss.
The “effective interest rate” is the rate that exactly discounts estimated future cash receipts through the expected life of the financial instrument to the gross carrying amount of the financial asset. In calculating interest income, the effective interest rate is applied to the gross carrying amount of the asset (when the asset is not credit-impaired).
FINANCIAL LIABILITIESFinancial liabilities of the Group are classified as measured at amortised cost. Financial liabilities are subsequently measured at amortised cost using the effective interest method. Interest expense and foreign exchange gains and losses are recognised in profit or loss. Any gain or loss on derecognition is also recognised in profit or loss.
IMPAIRMENT OF FINANCIAL ASSETSThe Group recognises loss allowances for ECLs for financial assets that are measured at amortised cost.
Loss allowances for financial assets measured at amortised cost are deducted from the gross carrying amount of the financial assets.
MEASUREMENT OF EXPECTED CREDIT LOSSESHistoric ECL percentages are calculated using the probability of default (PD) and loss-given default (LGD) of financial assets. The PD and LGD represent the likelihood of the occurrence of a default and the quantum of any losses arising from that default. The Group considers a default to have occurred when a financial asset is more than 90 days past due.
The PD and LGD are derived from a statistical analysis of historical data (where available). The historic ECL is adjusted after taking into account relevant quantitative and qualitative forward-looking information. The exposure to default represents the gross carrying amount of a financial asset or portfolio of financial assets at the reporting date.
Lifetime ECLs are the ECLs that result from all possible default events over the expected life of a financial instrument.
The maximum period considered when estimating ECLs is the maximum contractual period over which the Group is exposed to credit risk.
ECLs are measured at the present value of cash shortfalls arising from a credit default event, discounted at the effective interest rate of the financial asset.
SIGNIFICANT ACCOUNTING POLICIES (continued)for the year ended 30 June 2020

19WBHO Audited Consolidated Financial Statements 2020
CONTRACT ASSETS, CONTRACT RECEIVABLES AND TRADE AND OTHER RECEIVABLESThe Group recognises lifetime ECLs for contract assets and trade and other receivables that reflect changes to the credit risk profile of either an individual financial asset or a portfolio of financial assets (as appropriate) at each reporting date.
The ECL is measured on a collective basis using the simplified approach.
Financial assets exhibiting similar credit risks and behaviour are grouped together as follows:• General construction;• Subcontractor and supply; and• Sundry receivables.
The PD and LGD ratios are calculated from the average rate of default and actual losses incurred per category over a period of 36 months.
The Group considers a trade receivable to be credit-impaired when one or more detrimental events have occurred such as:• Significant financial difficulty of the customer;• Liquidation, business rescue proceedings or other forms of
financial reorganisation are implemented; or• Any other event where the likelihood of full settlement is remote.
In instances where the Group determines a receivable to be credit-impaired, the receivable is excluded from the portfolio for the purposes of calculating an ECL and a specific credit loss is recognised. A specific credit loss is recognised when a financial asset is greater than 120 days past due and based on an assessment of the individual circumstances relating to the default event.
The gross carrying amount of a financial asset is written off in profit and loss when the Group has no reasonable expectations of recovering a financial asset in its entirety or a portion thereof. The Group expects no significant recovery from amounts written off. However, financial assets that are written off could still be subject to enforcement activities in order to comply with the Group’s procedures for recovery of amounts due.
LONG-TERM RECEIVABLES AND LOANS TO EQUITY-ACCOUNTED INVESTEESThe Group recognises ECLs on long-term receivables and loans to equity-accounted investees that reflect changes to the individual credit risk profile of each financial asset at the reporting date. The PD and LGD ratios, as well as the conversion to account for forward-looking information for these financial assets, are determined using models that take into account payment history, security held, underlying financial information where available, external credit ratings (if applicable), forward-looking macro-economic indicators and the industry and country in which the counterparty operates.
DERECOGNITIONFinancial assets or a portion thereof are derecognised when the Group`s rights to the cash flows expire, when the Group transfers all the risks and rewards related to the financial asset or when the Group loses control of the financial asset.
Financial liabilities or a portion thereof are derecognised when the obligations specified in the contract are discharged, cancelled or expire. On derecognition of a financial liability, the difference between the carrying amount extinguished and the consideration paid (including any non-cash assets transferred or liabilities assumed) is recognised in profit or loss.
INVENTORIES Inventories are measured at the lower of cost or net realisable value. The cost of materials on site, raw materials, consumable stores and trading stock is determined using the weighted-average basis.
IMPAIRMENT OF NON-FINANCIAL ASSETSAt each reporting date, the Group reviews the carrying amounts of its non-financial assets (other than inventories, contract assets and deferred tax assets) to determine whether there is any indication of impairment. If any such indication exists, then the asset’s recoverable amount is estimated. Goodwill is tested annually for impairment.
For impairment testing, assets are grouped together into the smallest group of assets that generates cash inflows from continuing use that are largely independent of the cash inflows of other assets or CGUs. Goodwill arising from a business combination is allocated to CGUs or groups of CGUs that are expected to benefit from the synergies of the combination.
The recoverable amount of an asset or CGU is the greater of its value in use and its fair value less costs to sell. Value in use is based on the estimated future cash flows, discounted to their present value using a pre-tax discount rate that reflects current market assessments of the time value of money and the risks specific to the asset or CGU.
An impairment loss is recognised if the carrying amount of an asset or CGU exceeds its recoverable amount. Impairment losses are recognised in profit or loss. They are allocated first to reduce the carrying amount of any goodwill allocated to the CGU, and then to reduce the carrying amounts of the other assets in the CGU on a pro rata basis.
An impairment loss in respect of goodwill is not reversed. For other assets, an impairment loss is reversed only to the extent that the asset’s carrying amount does not exceed the carrying amount that would have been determined, net of depreciation or amortisation, if no impairment loss had been recognised.
PROVISIONS Provisions are measured by discounting the expected future cash flows at a pre-tax rate that reflects current market assessments of the time value of money and the risk specific to the liability. The unwinding of the discount is recognised as finance costs in profit or loss.
ONEROUS CONTRACTSA provision for onerous contracts is measured at the present value of the lower of the expected cost of terminating the contract and the expected net cost of continuing with the contract. Before a provision is established, the Group recognises any impairment loss on the assets associated with that contract.
REVENUE RECOGNITIONThe Group recognises revenue from the following major sources:• Construction contracts for the construction of buildings, roads
and other infrastructure; • Supply of construction materials including asphalt, bitumen and
long-steel products; and• Sale of properties.

20 WBHO Audited Consolidated Financial Statements 2020
Revenue comprises the consideration received or receivable on contracts entered into with customers in the ordinary course of the Group’s activities and is shown net of amounts collected on behalf of third parties. The amount of revenue recognised is the value of the transaction price allocated to each completed or partially completed performance obligation depicting the consideration the entity is entitled to, in exchange for transferring the goods and services promised within the contract to the customer.
The Group has not entered into any contracts where the period between the transfer of the goods or services to the customer and payment by the customer exceeds one year. Therefore no significant element of financing is present and no adjustment for the time value of money is made to the Group’s transaction prices.
The operating cycle of construction assets and liabilities is considered more than 12 months, as the net assets are continually recycled through working capital distinguishing them from the net assets used in the long-term operations of the Group. Accordingly, construction assets and associated liabilities are classified as current as they are expected to be settled within the same operating cycle.
CONSTRUCTION CONTRACTSThe Group provides construction services embodying single performance obligations under long-term contracts with customers. Revenue is recognised over a period of time where the customer controls the work-in-progress as the asset is constructed, or where the asset being constructed has no alternative use and the Group has an enforceable right to payment for work done to date.
Contract modifications and contractual claims, representing variable revenue, are common within the construction industry. The transaction price is adjusted for approved variations and claims in full. For unapproved variations and claims the transaction price is adjusted only to the extent it is highly probable that a significant reversal in the amount of cumulative revenue recognised will not occur, when the uncertainty associated to the variability is resolved.
Construction contracts regularly contain penalty provisions for late completion. The transaction price is adjusted for penalties on a contract-by-contract basis, only where it is highly probable that the penalties will be implemented.
The output method, incorporating surveys of work performed, is applied to measure performance based on the value of goods and services delivered relative to those undelivered. This method best represents the fair value of the construction works performed and the transfer of control of the goods and services to the customer.
Revenue recognised in accordance with a measure of performance is not necessarily aligned with the payment terms of the contract. In addition, retention monies are often withheld from payment until the performance obligations have been substantially completed. Where performance under the contract exceeds the payment received to date, a contract asset is recognised. Contract assets and construction contract revenue are recognised as a trade receivable once the contractual right to consideration is unconditional, subject only to the passage of time. Uncertified work, retentions, unapproved variation orders and the Group’s assessment of the outcome of contractual claims are recognised as contract assets. Where payment is received in respect of construction work yet to be performed, the revenue attributed thereto is not recognised but accounted for as a contract liability.
SALE OF CONSTRUCTION MATERIALSThe Group recognises revenue at a point in time at which the right to consideration becomes unconditional as only the passage of time is required before payment is due, being when the customer takes possession of the goods, usually on delivery or collection thereof.
SALE OF PROPERTIESRevenue from property sales is recognised at a point in time once legal ownership of the property has transferred to the customer. Payment of the transaction price is due immediately at the point in time.
FOREIGN CURRENCY FOREIGN OPERATIONS The assets and liabilities of foreign operations are translated into the functional currency at the exchange rates at the reporting date. The income and expenses of foreign operations are translated into the functional currency at the average exchange.
Foreign currency differences are recognised in other comprehensive income and accumulated in the foreign currency translation reserve, except to the extent that the translation difference is allocated to non-controlling interest (NCI).
When a foreign operation is disposed of in its entirety or partially such that control, significant influence or joint control is lost, the cumulative amount in the translation reserve related to that foreign operation is reclassified to profit or loss as part of the gain or loss on disposal. If the Group disposes of part of its interest in a subsidiary but retains control, then the relevant proportion of the cumulative amount is reattributed to NCI. When the Group disposes of only part of an associate or joint venture while retaining significant influence or joint control, the relevant proportion of the cumulative amount is reclassified to profit or loss.
FOREIGN CURRENCY TRANSACTIONS Foreign currency transactions are translated into the functional currency using the exchange rates at the transaction dates.
Monetary assets and liabilities denominated in foreign currencies are translated into the functional currency at the exchange rate at the reporting date. Non-monetary assets and liabilities that are measured at fair value in a foreign currency are translated into the functional currency at the exchange rate when the fair value was determined. Non-monetary items that are measured based on historical cost in a foreign currency are translated at the exchange rate at the date of the transaction.
Foreign currency differences are recognised in profit or loss.
OPERATING PROFIT Operating profit is the result generated from the continuing principle revenue-producing activities of the Group as well as other income and expenses related to operating activities. Operating profit excludes net finance costs, share of profit of equity-accounted investees and income taxes.
INCOME TAX Income tax for the period comprises current and deferred tax. It is recognised in profit or loss except to the extent that it relates to a business combination or items directly recognised in equity or in other comprehensive income.
SIGNIFICANT ACCOUNTING POLICIES (continued)for the year ended 30 June 2020

21WBHO Audited Consolidated Financial Statements 2020
CURRENT TAX Current tax comprises the expected tax payable on the taxable income for the year using substantively enacted tax rates and includes any adjustments to tax payable in respect of prior years. The amount of current tax payable or receivable is the best estimate of the tax amount expected to be paid or received that reflects uncertainty related to income taxes, if any. Current tax also includes any tax arising from dividends.
Current tax assets and liabilities are offset only if certain criteria are met.
DEFERRED TAX Deferred taxes recognised in respect of temporary differences between the carrying amounts for financial reporting purposes and the tax base used for tax purposes.
Deferred tax is not recognised on temporary differences relating to: • taxable temporary differences arising on the initial recognition of
goodwill; • temporary differences on the initial recognition of an asset or
liability in a transaction that is not a business combination and that affects neither accounting nor taxable profit or loss ; and
• temporary differences relating to investments in subsidiaries, associates and joint arrangements to the extent they will probably not reverse in the foreseeable future.
A deferred tax asset is recognised to the extent that it is probable that future taxable income will be available against which any unused tax losses and deductible temporary differences can be utilised.
Deferred tax assets are reviewed at each reporting date and are reduced to the extent that it is no longer probable that the related tax benefit will be realised. Such reductions are reversed when the probability of future taxable profits improves. Unrecognised deferred tax assets are reassessed at each reporting date and recognised to the extent that it has become probable that future taxable profits will be available against which they can be used.
Deferred tax is measured at the tax rates that are expected to be applied to temporary differences when they reverse, using tax rates enacted or substantively enacted at the reporting date, and reflects uncertainty related to income taxes, if any.
Deferred tax assets and liabilities are offset only if certain criteria are met.
The Group recognises a net deferred tax asset or liability in respect of temporary differences within individual statutory entities when the same treatment would be applied when preparing the tax returns to the relevant tax authority.
EMPLOYEE BENEFITS DEFINED CONTRIBUTION BENEFITS Under defined contribution plans the Group’s legal or constructive obligation is limited to the amount contributed to the fund. Consequently the risk that assets invested will be insufficient to meet the expected benefits is borne by the employees.
Contributions to a defined contribution plan in respect of the services rendered in a particular period are recognised as an expense in profit or loss in that period.
SHORT-TERM EMPLOYEE BENEFITS Short-term employee benefits are expensed as the related service is provided. A liability is recognised for the amount expected to be paid if the Group has a present or legal or constructive obligation to pay this amount as a result of past service provided by the employee and the obligation can be estimated reliably.
BONUS PLANS A liability for employee benefits in the form of bonus plans is recognised as a provision as past practice has created a valid expectation by employees that they will receive a bonus.
SHARE-BASED PAYMENT ARRANGEMENTSEQUITY-SETTLED The fair value of equity-settled share-based payment arrangements granted to employees is recognised as an expense with a corresponding increase in equity over the vesting period of the awards. The fair value is measured at grant date, taking into account the structure of the grant, and expensed over the period during which the employees are required to provide services in order to become unconditionally entitled to the equity instruments, allowing for an estimate of the number of shares that will eventually vest. The fair value of the instruments granted is measured using generally accepted valuation techniques, taking into account the terms and conditions upon which the instruments are granted. Where an employee resigns from the scheme, the estimated share-based payment expense is adjusted such that on a cumulative basis, no expense is recognised in respect of that employee.
Where services are received by the Group in return for the equity-settled share-based payment arrangements, the fair value of the services received is expensed on a straight-line basis over their vesting periods.
ORDINARY SHARESIncremental costs directly attributable to the issue of ordinary shares are recognised as a deduction from equity.
TREASURY SHARES When shares recognised as equity are repurchased, the amount of the consideration paid, which includes directly attributable costs, is recognised as a deduction from equity. Repurchased shares are classified as treasury shares and are presented in the non-distributable reserve.
When treasury shares are sold or reissued subsequently, the amount received is recognised as an increase in equity and the resulting surplus or deficit on the transaction is presented in other non-distributable reserves.

22 WBHO Audited Consolidated Financial Statements 2020
NOTES TO THE CONSOLIDATED FINANCIAL STATEMENTSfor the year ended 30 June 2020
1. STANDARDS AND INTERPRETATIONS The Group has applied the following standards for the first time for the current reporting period:
Standard
Effective date – annual periods commencing on or after: Description
IFRS 16: Leases 1 January 2019 The standard incorporates all existing standards and interpretations relating to leases under one new standard. It introduces a single lessee accounting model and requires a lessee to recognise assets and liabilities for all leases with a term of more than 12 months, unless the underlying asset is of low value. A lessee is required to recognise a right-of-use asset representing its right to use the underlying leased asset and a lease liability representing its obligation to make lease payments. A lessee measures right-of-use assets similarly to property, plant and equipment and lease liabilities similarly to financial liabilities at amortised cost. Consequently, a lessee recognises depreciation of the right-of-use asset and interest on the lease liability, and classifies cash repayments of the lease liability into a principal portion and an interest portion.
Changes in accounting policies resulting from IFRS 16 have been applied as at 1 July 2019, with no restatement of comparative information for the prior reporting period. The impact on adoption of IFRS 16 is disclosed in note 32.
Long-term interest in associates and joint ventures Amendments to IAS 28
1 January 2019 The amendments clarify that an entity applies IFRS 9 to long-term interest in an associate or joint venture to which the equity method is not applied but that, in substance, form part of the net investment in the associate or joint venture (long-term interest). This clarification is relevant because it implies that the expected credit loss model in IFRS 9 applies to such long-term interest.
The Board also clarified that, in applying IFRS 9, an entity does not take into account any losses of the associate or joint venture, or any impairment losses on the net investment, recognised as adjustments to the net investment in the associate or joint venture that arise from applying IAS 28: Investment in Associates and Joint Ventures.
This amendment has been applied in the current year and the impact is disclosed in note 24.
NEW AND REVISED IFRS IN ISSUE BUT NOT YET EFFECTIVEAt the date of authorisation of these financial statements there are a number of new standards, amendments and interpretations which will only be effective after 30 June 2020 and have not been early adopted by the Group. The following standards and amendments are significant to the Group:
Standard
Effective date – annual periods commencing on or after: Description
Definition of Material Amendments to IAS 1 and IAS 8
1 January 2020 The IASB issued amendments to IAS 1: Presentation of Financial Statements and IAS 8 to align the definition of “material” across the standards and to clarify certain aspects of the definition. The new definition states that, information is material if omitting, misstating or obscuring it could reasonably be expected to influence decisions that the primary users of general purpose financial statements make on the basis of those financial statements, which provide financial information about a specific reporting entity.
The amendments clarify that materiality will depend on the nature or magnitude of information or both. An entity will need to assess whether the information, either individually or in combination with other information, is material in the context of the financial statements.
The amendments to the definition of material is not expected to have a significant impact on the entity’s financial statements, the introduction of the term “obscuring information” in the definition could potentially impact how materiality judgements are made in practice, by elevating the importance of how information is communicated and organised in the financial statements.
The amendments are applied prospectively. Early application is permitted.

23WBHO Audited Consolidated Financial Statements 2020
Standard
Effective date – annual periods commencing on or after: Description
The conceptual Framework for Financial Reporting
1 January 2020 The IASB issued the Conceptual Framework in March 2018. It sets out a comprehensive set of concepts for financial reporting, standard setting, guidance for preparers in developing consistent accounting policies ad assistance to others in their efforts to understand and interpret the standards.
The Conceptual Framework includes some new concepts, provides updated definitions and recognition criteria for assets and liabilities and clarifies some important concepts.
The change in the Conceptual Framework may affect the application of IFRS in situations where no standard applies to a particular transaction or events.
Business Combinations Amendments to IFRS 3
1 January 2020 Definition of a business:The IASB amended the definition of a business to assist preparers in determining whether an acquired set of activities and assets is a business or not.
This amendment:• clarifies that a minimum requirement for a business includes inputs and a substantive
process that together significantly contribute to create outputs; • narrows the definition of a business and outputs by placing emphasis on goods and
services provided to customers and removing the reference to an ability to reduce costs; and
• adds an optional concentration test that permits a simplified assessment of whether an asset or a Group of similar assets is not a business.
Reference to the Conceptual Framework:The amendment:• updates a reference in IFRS 3 to the Conceptual Framework; • adds a requirement that transactions and other events within the scope of IAS 37
must be accounted for per IAS 37 (instead of the Conceptual Framework) to identify the liabilities assumed in a business combination; and
• adds an explicit statement that an acquirer does not recognise contingent assets acquired in a business combination.
The amendments will be evaluated for future acquisitions.
Provisions, Contingent Liabilities and Contingent Assets Amendments to IAS 37
1 January 2022 The IASB issued amendments relating to onerous contracts, which specifies that the “cost of fulfilling” a contract comprises the costs that relate directly to the contract. Costs that relate directly to a contract can either be incremental costs of fulfilling that contract or an allocation of other costs that relate directly to fulfilling contracts.
The Group is currently assessing the impact of this amendment.
Classification of Liabilities as Current or Non-current Amendments to IAS 1
1 January 2023 The IASB issued amendments to IAS 1: Presentation of Financial Statements which clarifies that the classification of liabilities as current or non-current is based on whether an entity has a right at the end of the reporting period to defer settlement of the liability for at least twelve months after the reporting period. It further states that classification is unaffected by an entity’s intention to exercise its right to defer settlement of a liability.
The amendment further clarifies the definition of a settlement to be a transfer to the counterparty that results in the extinguishment of the liability.
The Group is currently assessing the impact of this amendment and whether the terms and conditions attached to liabilities will result in a reclassification once effective.

NOTES TO THE CONSOLIDATED FINANCIAL STATEMENTS (continued)for the year ended 30 June 2020
24 WBHO Audited Consolidated Financial Statements 2020
Land andbuildings
R’000Aircraft
R’000
Plant, vehicles and
equipmentR’000
Office andcomputer
equipmentR’000
TotalR’000
2. PROPERTY, PLANT AND EQUIPMENTCostAt 1 July 2019 472 562 54 298 2 973 629 188 944 3 689 433Additions 2 156 – 237 697 13 331 253 184Disposals (126) – (114 262) (11 772) (126 160)Exchange rate effects 13 410 – 563 932 43 436 620 778
At 30 June 2020 488 002 54 298 3 660 996 233 939 4 437 235
Accumulated depreciation and impairment lossesAt 1 July 2019 124 396 5 072 1 498 116 125 140 1 752 724Depreciation 15 849 150 210 495 23 894 250 388Disposals (125) – (101 842) (10 208) (112 175)Exchange rate effects (14 801) – 489 351 17 494 492 044
At 30 June 2020 125 319 5 222 2 096 120 156 320 2 382 981
Carrying amount at 30 June 2020 362 683 49 076 1 564 876 77 619 2 054 254
CostAt 1 July 2018 449 614 54 298 2 922 610 125 443 3 551 965Additions 9 256 – 344 360 20 644 374 260Acquisition through business combination 18 366 – 10 814 5 457 34 637Disposals (129) – (223 927) (3 805) (227 861)Impairment losses – – (1 178) – (1 178)Exchange rate effects (4 545) – (79 050) 41 205 (42 390)
At 30 June 2019 472 562 54 298 2 973 629 188 944 3 689 433
Accumulated depreciation and impairment lossesAt 1 July 2018 104 351 4 854 1 461 991 97 697 1 668 893Depreciation 21 064 218 244 385 17 622 283 289Acquisitions through business combinations 2 248 1 503 1 281 5 032Disposals (19) – (170 619) (3 223) (173 861)Exchange rate effects (3 248) – (39 144) 11 763 (30 629)
At 30 June 2019 124 396 5 072 1 498 116 125 140 1 752 724
Carrying amount at 30 June 2019 348 166 49 226 1 475 513 63 804 1 936 709
2020R’000
2019R’000
The carrying amount of land and buildings comprise:Land 142 411 129 547Buildings 220 272 218 619
362 683 348 166
The depreciation rates applied are set out below:Aircraft Variable rates based on flying hoursBuildings 2% straight-line or over the lease termPlant and vehicles Variable based on expected production unitsEquipment 33,3% straight-lineOffice and computer equipment 10% – 33,3% straight-line
Plant, vehicles and equipment with a carrying amount of R210 million (2019: R209 million) are secured by lease liabilities (2019: finance lease liabilities) (note 10).
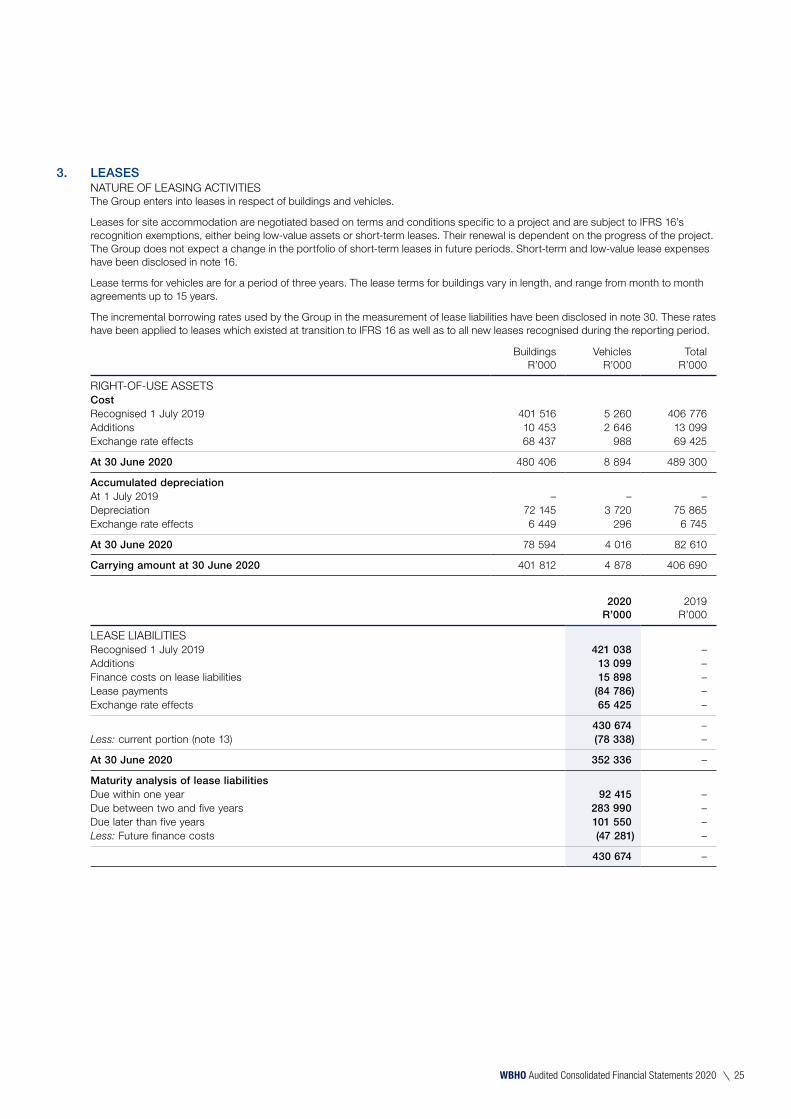
25WBHO Audited Consolidated Financial Statements 2020
3. LEASES NATURE OF LEASING ACTIVITIES
The Group enters into leases in respect of buildings and vehicles.
Leases for site accommodation are negotiated based on terms and conditions specific to a project and are subject to IFRS 16’s recognition exemptions, either being low-value assets or short-term leases. Their renewal is dependent on the progress of the project. The Group does not expect a change in the portfolio of short-term leases in future periods. Short-term and low-value lease expenses have been disclosed in note 16.
Lease terms for vehicles are for a period of three years. The lease terms for buildings vary in length, and range from month to month agreements up to 15 years.
The incremental borrowing rates used by the Group in the measurement of lease liabilities have been disclosed in note 30. These rates have been applied to leases which existed at transition to IFRS 16 as well as to all new leases recognised during the reporting period.
BuildingsR’000
VehiclesR’000
TotalR’000
RIGHT-OF-USE ASSETSCostRecognised 1 July 2019 401 516 5 260 406 776Additions 10 453 2 646 13 099Exchange rate effects 68 437 988 69 425
At 30 June 2020 480 406 8 894 489 300
Accumulated depreciationAt 1 July 2019 – – –Depreciation 72 145 3 720 75 865 Exchange rate effects 6 449 296 6 745
At 30 June 2020 78 594 4 016 82 610
Carrying amount at 30 June 2020 401 812 4 878 406 690
2020R’000
2019R’000
LEASE LIABILITIESRecognised 1 July 2019 421 038 –Additions 13 099 –Finance costs on lease liabilities 15 898 –Lease payments (84 786) –Exchange rate effects 65 425 –
430 674 –Less: current portion (note 13) (78 338) –
At 30 June 2020 352 336 –
Maturity analysis of lease liabilitiesDue within one year 92 415 –Due between two and five years 283 990 –Due later than five years 101 550 –Less: Future finance costs (47 281) –
430 674 –

NOTES TO THE CONSOLIDATED FINANCIAL STATEMENTS (continued)for the year ended 30 June 2020
26 WBHO Audited Consolidated Financial Statements 2020
2020R’000
2019R’000
4. GOODWILLCost 1 153 231 1 153 231 Exchange rate effects (67 337) (232 128)
Carrying amount 1 085 894 921 103
The carrying amount of goodwill is reconciled as follows:Carrying amount at 1 July 2019 921 103 531 117 Goodwill recognised on business combination – 391 087Exchange rate effects 164 791 (1 101)
Carrying amount at 30 June 2020 1 085 894 921 103
Business segment: Cash generating unit: (CGU)Roads and earthworks WBHO Pipelines division 70 545 70 545 Australia Probuild Constructions (Aust) Pty Ltd 537 988 448 683United Kingdom Russells Limited 477 361 401 875
1 085 894 921 103
IMPAIRMENT OF GOODWILLThe recoverable amount of each identified CGU is determined using the value-in-use methodology incorporating discounted cash flows. The fair value measurement was categorised as a level 3 fair value based on the inputs in the valuation technique used.
The growth rates used in the valuation of the recoverable amounts represent management’s assessment of future trends relevant to each CGU using published industry data where available. Discount rates are pre-tax measures taking into account the historical average weighted-average cost of capital for the industry. Cash flow projections include estimates for a five-year period together with a terminal growth calculation thereafter. The terminal growth rates used are consistent with those likely to be used by a market participant.
The table below illustrates the growth and discount rates used in determining the recoverable amounts:
Probuild Constructions (Aust) Pty Ltd Russells Limited WBHO Pipelines division
2020 2019 2020 2019 2020 2019
Growth rate Between -6,6% and 3,8%
Between 0% and 2,8%
Between -2% and 7,5%
4% for FY20 and 10% thereafter
Between -17,2% and 38,8%
Between 8% and 37,8%
Terminal growth rate (1,3%) (2,0%) 3,0% 3,0% 4,0% 3,0%Pre-tax discount rate 10,0% 10,0% 12,4% 7,5% 16,5% 15,4%Pre-tax discount rate resulting in the recoverable amount being equal to carrying amount 69,3% 63,0% 35,0% 39,8% 37,5% 54,3%
2020R’000
2019R’000
5. EQUITY-ACCOUNTED INVESTEESInvestment at cost 213 885 199 306Additional equity contributions 351 302 557 549Loans to equity-accounted investees 244 183 140 281
Total investment 809 370 897 136Attributable post-acquisition profits, losses and equity movements 295 789 172 686
1 105 159 1 069 822

27WBHO Audited Consolidated Financial Statements 2020
2020R’000
2019R’000
The carrying amount of equity-accounted investees is reconciled as follows:Carrying amount at 1 July 1 069 822 745 059Additions – 58 137Share of profits 109 284 51 958Share of other comprehensive income 55 476 16 602Dividends received (64 543) (21 478)Equity (repayments)/drawdowns (168 924) 96 994Acquisition through business combination – 148 280Loans advanced/(repaid) (4 915) (13 676)Loss allowance 4 341 (5 040)Exchange rate effects 104 618 (7 014)
Carrying amount at 30 June 1 105 159 1 069 822
Equity-accounted investees include:
Country of incorporation
Effective interest Investments at costEquity contributions and loans advanced
2020%
2019%
2020R’000
2019R’000
2020R’000
2019R’000
Unlisted associatesGigajoule International (Pty) Ltd# South Africa 26,6 26,6 31 835 31 835 – –Gigajoule Power (Pty) Ltd# South Africa 13,0 13,0 7 657 7 657 106 704 106 704Ilembe Airport Construction Services (Pty) Ltd^ South Africa 29,3 29,3 3 3 – – Dipalopalo Concession (RF) (Pty) Ltd* South Africa 27,7 27,7 – – 57 760 58 325 Dipalopalo FM Solutions (RF) (Pty) Ltd* South Africa 14,6 14,6 – – – –Edwin Construction (Pty) Ltd^ South Africa 49,0 49,0 96 582 96 582 – –iKusasa Rail (SA) (Pty) Ltd^ South Africa 49,0 49,0 5 092 5 092 19 040 17 571 BPG Caulfield Village Pty Ltd† Australia 30,0 30,0 – – 20 012 180 639 The Glen Redevelopment Project† Australia 20,0 20,0 – – 131 042 109 289Russell Homes Limited^ England 31,7 31,7 72 716 58 137 225 142 127 750Joint venturesCatchu Trading (Pty) Ltd† South Africa 50,0 50,0 – – 36 709 102 592
Less: Loss allowance (note 25) – – (924) (5 040)
213 885 199 306 595 485 697 830
The Group has significant influence over Gigajoule Power (Pty) Ltd and Dipalopalo FM Solutions (RF) (Pty) Ltd through its investments in Gigajoule International (Pty) Ltd and Dipalopalo Concession (RF) (Pty) Ltd respectively.
Loans to equity-accounted investees will not be repaid within the next 12 months in terms of the loan agreements and bear interest between 0% and 15% per annum. The equity contributions in respect of BPG Caulfield Village Pty Ltd and Catchu Trading (Pty) Ltd are expected to be repaid in the next 12 months.
The entities listed above are involved in: ^ construction # power generation* serviced accommodation† property development

NOTES TO THE CONSOLIDATED FINANCIAL STATEMENTS (continued)for the year ended 30 June 2020
28 WBHO Audited Consolidated Financial Statements 2020
Russell Homes LimitedR’000
Gigajoule International
GroupR’000
Edwin Construction
(Pty) LtdR’000
BPG Caulfield
Village Pty Ltd
R’000
The Glen Residential
R’000
Catchu Trading (Pty) Ltd
R’000OtherR’000
TotalR’000
5. EQUITY-ACCOUNTED INVESTEES (continued)2020Investment at cost 72 716 39 492 96 582 – – – 5 095 213 885Equity contributions and loans advanced 225 142 106 704 – 20 012 131 042 36 709 75 876 595 485
297 858 146 196 96 582 20 012 131 042 36 709 80 971 809 370
Post-acquisition gains/(losses) and movements in reserves less dividends received 201 264 784 (12 589) 33 182 – 22 617 (12 406) 295 789
Carrying amount at 30 June 298 059 410 980 83 993 53 194 131 042 59 326 68 565 1 105 159
Share of profits/(losses) in equity-accounted investees 186 32 673 3 955 55 650 – 22 617 (5 797) 109 284Dividends received – – 15 668 56 938 – – – 72 606
2019Investment at cost 58 137 39 492 96 582 – – – 5 095 199 306Equity contributions and loans advanced 127 750 106 704 – 180 639 109 289 102 592 70 856 697 830
185 887 146 196 96 582 180 639 109 289 102 592 75 951 897 136Post-acquisition gains/(losses) and movements in reserves less dividends received 2 811 176 635 (875) – – – (5 885) 172 686
Carrying amount at 30 June 188 698 322 831 95 707 180 639 109 289 102 592 70 066 1 069 822
Share of profits/(losses) in equity-accounted investees 4 005 51 986 (383) – – – (3 650) 51 958Dividends received – 17 818 – – – – 3 660 21 478
The summary financial information for material equity-accounted investees is disclosed in the tables below:
Russell Homes LimitedR’000
Catchu Trading
(Pty) LtdR’000
The Glen Residential
R’000
BPGCaulfield
Village Pty Ltd
R’000
Gigajoule International
GroupR’000
Edwin Construction
(Pty) LtdR’000
2020Non-current assets 1 455 4 109 1 844 90 434 3 086 986 53 636Current assets 316 563 143 299 560 849 121 442 1 928 269 265 790
Total assets 318 018 147 408 562 693 211 876 5 015 255 319 426
Shareholders’ equity 47 980 94 540 429 329 206 346 1 362 280 153 113Non-controlling interest – – – – 1 467 406 –Non-current liabilities 225 142 – 103 521 – 1 602 745 25 436Current liabilities 44 896 52 868 29 843 5 530 582 824 140 877
Total equity and liabilities 318 018 147 408 562 693 211 876 5 015 255 319 426
Revenue 352 442 636 971 – 1 909 724 2 253 637 200 481Profit for the year 587 27 503 – 331 473 249 997 8 012Other comprehensive income – – – – 208 477 –
Total comprehensive income for the year 587 27 503 – 331 473 458 474 8 012

29WBHO Audited Consolidated Financial Statements 2020
Russell Homes LimitedR’000
CatchuTrading
(Pty) LtdR’000
The Glen Residential
R’000
BPGCaulfield
Village Pty LtdR’000
Gigajoule International
GroupR’000
Edwin Construction
(Pty) LtdR’000
2019Non-current assets 1 293 3 810 – 1 568 734 2 395 692 64 301Current assets 284 009 631 223 1 214 709 38 860 1 759 326 280 396
Total assets 285 302 635 033 1 214 709 1 607 594 4 155 018 344 697
Shareholders’ equity 39 859 343 755 577 560 616 515 1 132 444 189 084Non-controlling interest – – – – 979 652 –Non-current liabilities 192 149 – 637 149 – 1 544 102 20 713Current liabilities 53 294 291 278 – 991 079 498 820 134 900
Total equity and liabilities 285 302 635 033 1 214 709 1 607 594 4 155 018 344 697
Revenue 393 619 – – – 2 535 815 335 709Profit/(loss) for the year 12 634 (1 269) – – 437 455 (4 195)Other comprehensive income – – – – (62 389) –
Total comprehensive income/(loss) for the year 12 634 (1 269) – – 375 066 (4 195)
The aggregate summary financial information for individually immaterial equity-accounted investees is as follows:
2020R’000
2019R’000
Net asset value 7 042 25 239(Loss)/profit for the year (624) 2 147Distributions received – 3 660
The reporting date for Gigajoule International and Gigajoule Power is 31 December. The operations of both companies are located in Mozambique.
2020R’000
2019R’000
6. LONG-TERM RECEIVABLESAt amortised cost:Mezzanine financing arrangements1 301 345 155 365Other long-term receivables 27 034 61 448Loans to employees for shares2 192 157 152 473Lease receivable3 17 471 –Consideration receivable4 16 810 24 219
554 817 393 505Less: Loss allowance (note 25) (1 803) (2 002) Less: Current portion (note 9) (269 416) (44 587)
283 598 346 916
1 Mezzanine financing arrangements are secured by one or more of the following: Third party guarantees, listed company shares or title to land and bear interest at prime linked rates plus 2%. Repayments are at terms agreed with each entity.
2 Loans to employees for shares are secured by the shares issued, bear interest at variable rates and are repayable between five and ten years (note 27).3 The sundry lease receivable relates to a property which has been sub-let in Australia by Probuild Constructions (Aust) Pty Ltd. The lease receivable is
presented at an amount equal to the net investment in the sublease. The corresponding lease liability relating to the head lease has been disclosed in note 3.
4 This amount of R17 million relates to consideration receivable in respect of a share buy-back by Edwin Construction (Pty) Ltd in 2017. The consideration has been discounted at 8,35%, bears no interest and is payable in five equal annual instalments, of which two remain.
The fair value of long-term receivables is disclosed in note 25.
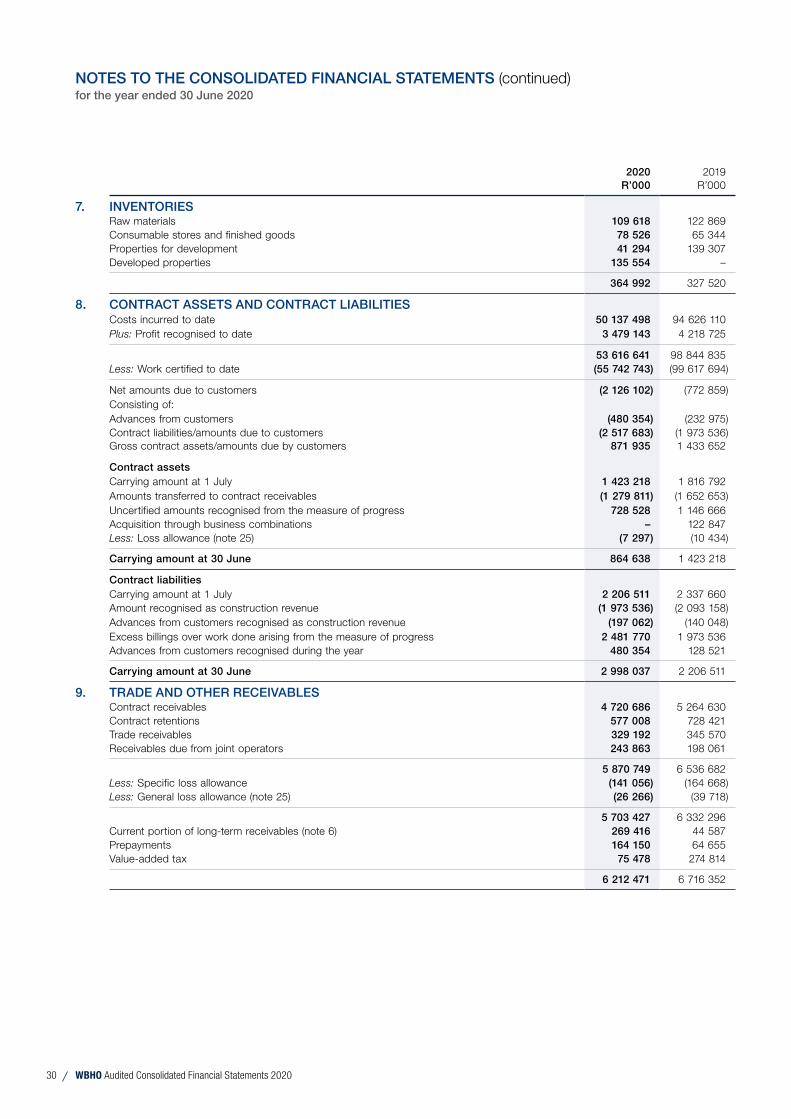
NOTES TO THE CONSOLIDATED FINANCIAL STATEMENTS (continued)for the year ended 30 June 2020
30 WBHO Audited Consolidated Financial Statements 2020
2020R’000
2019R’000
7. INVENTORIESRaw materials 109 618 122 869Consumable stores and finished goods 78 526 65 344Properties for development 41 294 139 307Developed properties 135 554 –
364 992 327 520
8. CONTRACT ASSETS AND CONTRACT LIABILITIESCosts incurred to date 50 137 498 94 626 110Plus: Profit recognised to date 3 479 143 4 218 725
53 616 641 98 844 835Less: Work certified to date (55 742 743) (99 617 694)
Net amounts due to customers (2 126 102) (772 859)Consisting of:Advances from customers (480 354) (232 975)Contract liabilities/amounts due to customers (2 517 683) (1 973 536)Gross contract assets/amounts due by customers 871 935 1 433 652
Contract assetsCarrying amount at 1 July 1 423 218 1 816 792Amounts transferred to contract receivables (1 279 811) (1 652 653)Uncertified amounts recognised from the measure of progress 728 528 1 146 666Acquisition through business combinations – 122 847Less: Loss allowance (note 25) (7 297) (10 434)
Carrying amount at 30 June 864 638 1 423 218
Contract liabilitiesCarrying amount at 1 July 2 206 511 2 337 660Amount recognised as construction revenue (1 973 536) (2 093 158)Advances from customers recognised as construction revenue (197 062) (140 048)Excess billings over work done arising from the measure of progress 2 481 770 1 973 536Advances from customers recognised during the year 480 354 128 521
Carrying amount at 30 June 2 998 037 2 206 511
9. TRADE AND OTHER RECEIVABLESContract receivables 4 720 686 5 264 630Contract retentions 577 008 728 421Trade receivables 329 192 345 570Receivables due from joint operators 243 863 198 061
5 870 749 6 536 682Less: Specific loss allowance (141 056) (164 668)Less: General loss allowance (note 25) (26 266) (39 718)
5 703 427 6 332 296Current portion of long-term receivables (note 6) 269 416 44 587Prepayments 164 150 64 655Value-added tax 75 478 274 814
6 212 471 6 716 352

31WBHO Audited Consolidated Financial Statements 2020
2020R’000
2019R’000
10. LONG-TERM LIABILITIESAt amortised cost:Secured
Lease liabilities (2019: Finance leases) (effective interest rates between 3,5% and 10,25%) 162 135 153 897Bank loans (effective interest rates between 3% and 5%) 112 349 –Other long-term borrowings 2 091 2 092
UnsecuredSettlement agreement liability 128 115 138 733
404 690 294 722Less: Current portion (note 13) (98 706) (101 558)
305 984 193 164
Maturity analysis of lease liabilities:Due within one year 81 163 82 266Due later than one year but within five years 90 710 78 881Less: Future finance costs (9 738) (7 250)
162 135 153 897
LEASE LIABILITY (2019: FINANCE LEASES)Instalment sale agreements are for periods up to 48 months and are secured by certain plant, vehicles and equipment (note 2).
BANK LOANSA loan agreement was entered into by the Group with Absa Bank Limited for an amount of R110 million to finance the development of a student accommodation building. The loan bears interest at rates linked to the prime lending rate in South Africa. Security provided on the loan includes:1. The registration of a Continuing Covering Mortgage Bond by the Group over the Group’s 50% undivided share in and to Erf 827,
Hatfield of an amount of R110 million and an additional amount to secure interest and costs, charges and disbursements due to the Bank if it exercises any right under the Mortgage Bond;
2. A cession of security by the Group of right, title and interest in and to its 50% undivided share in and to:– Leases and rentals in respect of the property;– Proceeds in respect of the sale or transfer of the property including, without limitation, any sale proceeds and expropriation
proceeds; and– Insurance policies and proceeds in respect of the insurance claims relating to the property.
SETTLEMENT AGREEMENT LIABILITYIn 2017, the Group signed a settlement agreement with the Government of South Africa in terms of which annual amounts of R22 million are payable to the Tirisono Trust over a period of 12 years. A discount rate of 8,7% was used in determining the present value.
The contractual maturity of long-term liabilities is disclosed in note 25.

NOTES TO THE CONSOLIDATED FINANCIAL STATEMENTS (continued)for the year ended 30 June 2020
32 WBHO Audited Consolidated Financial Statements 2020
2020R’000
2019R’000
11. DEFERRED TAXDeferred tax assetsThe deferred tax asset balance is reconciled as follows:At 1 July 903 657 667 779Adoption of IFRS 9 – 39 812Recognised in profit or loss (note 18) (331 328) 204 019Tax effects of other comprehensive income (49 994) –Transfer to/(from) deferred tax liability 173 868 (597)Exchange rate effects 37 380 (7 356)
At 30 June 733 583 903 657
Comprising of:Construction allowances Uncertified work and other construction temporary differences (433 998) (385 359) Prepayments (26 884) (7 751) Advances from customers 516 459 489 266Capital allowances (137 843) (151 530)Provisions 603 803 737 624Tax losses 212 046 221 407
Carrying amount at 30 June 733 583 903 657
Deferred tax liabilitiesThe deferred tax liability balance is reconciled as follows:At 1 July (174 131) (27 527)Acquisition through business combination – (1 116)Recognised in profit or loss (note 18) 302 560 (151 035)Transfer from deferred tax asset (173 868) 597Exchange rate effects 17 460 4 950
At 30 June (27 979) (174 131)
Comprising:Construction allowances Uncertified work and other construction temporary differences (6 026) (146 843) Prepayments (638) –Capital allowances (31 985) (42 999)Tax losses 3 227 11 870Provisions 7 443 3 841
Carrying amount at 30 June (27 979) (174 131)
Deferred tax assets have been recognised in respect of tax losses and temporary differences where, having reviewed the Groups financial projections, the directors are of the opinion that it is probable that these assets will be recovered.
Deferred tax assets have not been recognised on tax losses in subsidiaries amounting to R1,3 billion (2019: R156 million). In the current reporting period, deferred tax assets on tax losses of R122 million were derecognised, which resulted in a deferred tax expense of R36 million.
In 2019, R72,5 million of tax losses had a regulatory expiry period of ten years. This expired in the current year.
2020R’000
2019R’000
12. NON-CONTROLLING INTERESTS (NCI)Carrying amount of NCI Subsidiary: Principle place of business:Probuild Constructions (Aust) Pty Ltd Australia 68 056 58 759WBHO Infrastructure Pty Ltd Australia (54 423) 3 901Byrne Group Limited United Kingdom 85 452 62 211Russells Limited United Kingdom 90 952 122 671Individually immaterial subsidiaries 15 136 14 103
205 173 261 645

33WBHO Audited Consolidated Financial Statements 2020
The table below summarises the information relating to each of the Group’s subsidiaries that has a material NCI before any intra-group eliminations.
Probuild Constructions (Aust) Pty Ltd
WBHOInfrastructure
Pty Ltd
ByrneGroup
LimitedRussells Limited
2020Ownership interest held by NCI 12,1% 5,2% 20% 20%
R’000 R’000 R’000 R’000Summarised statement of financial positionNon-current assets 1 452 150 381 296 464 536 267 002Current assets 5 080 010 2 257 857 1 265 351 1 353 188
Total assets 6 532 160 2 639 153 1 729 887 1 620 190
Non-current liabilities (375 763) (125 350) (248 105) (16 924)Current liabilities (5 115 477) (2 163 479) (995 598) (961 642)
Total liabilities (5 491 240) (2 288 829) (1 243 703) (978 566)
Summarised statement of financial performance and other comprehensive incomeRevenue 17 659 827 6 996 778 3 672 197 2 779 939Profit/(loss) for the year (45 181) (1 062 229) 78 577 180 895
Total comprehensive (loss)/income (45 181) (1 062 229) 78 577 180 895
Profit/(loss) for the year attributable to NCI (5 476) (55 263) 15 715 28 885Dividends paid to NCI – – – 7 875Summarised statement of cash flowsCash flows from/(used in) operating activities 383 229 (719 591) 112 025 277 603Cash flows (used in)/from investing activities 40 111 (60 580) 2 606 8 955Cash flows (used in)/from financing activities (30 108) 770 278 (33 367) (27 406)
Net increase/(decrease) in cash and cash equivalents 393 232 (9 893) 81 264 259 152
2019Ownership interest held by NCI 12,5% 9,3% 20% 30%
R’000 R’000 R’000 R’000Summarised statement of financial positionNon-current assets 1 043 772 809 814 191 836 154 479Current assets 4 123 550 1 211 279 1 328 499 871 675
Total assets 5 167 322 2 021 093 1 520 335 1 026 154
Non-current liabilities (241 634) (709 005) – (1 146)Current liabilities (4 026 969) (1 083 769) (1 182 447) (616 104)
Total liabilities (4 268 603) (1 792 774) (1 182 447) (617 250)
Summarised statement of financial performance and other comprehensive incomeRevenue 16 941 174 4 772 280 3 725 409 1 934 746Profit/(loss) for the year 80 377 (398 645) 84 682 127 877
Total comprehensive income/(loss) 80 377 (398 645) 84 682 127 877
Profit/(loss) for the year attributable to NCI 10 023 (37 066) 16 936 38 363Dividends paid to NCI 9 252 – – 7 673Summarised statement of cash flowsCash flows from operating activities 163 204 64 405 403 272 239 751Cash flows (used in)/from investing activities (172 027) (43 522) (4 676) 6 165Cash flows (used in)/from financing activities (173 640) 213 491 (58 077) (12 391)
Net increase/(decrease) in cash and cash equivalents (182 463) 234 374 340 519 233 525
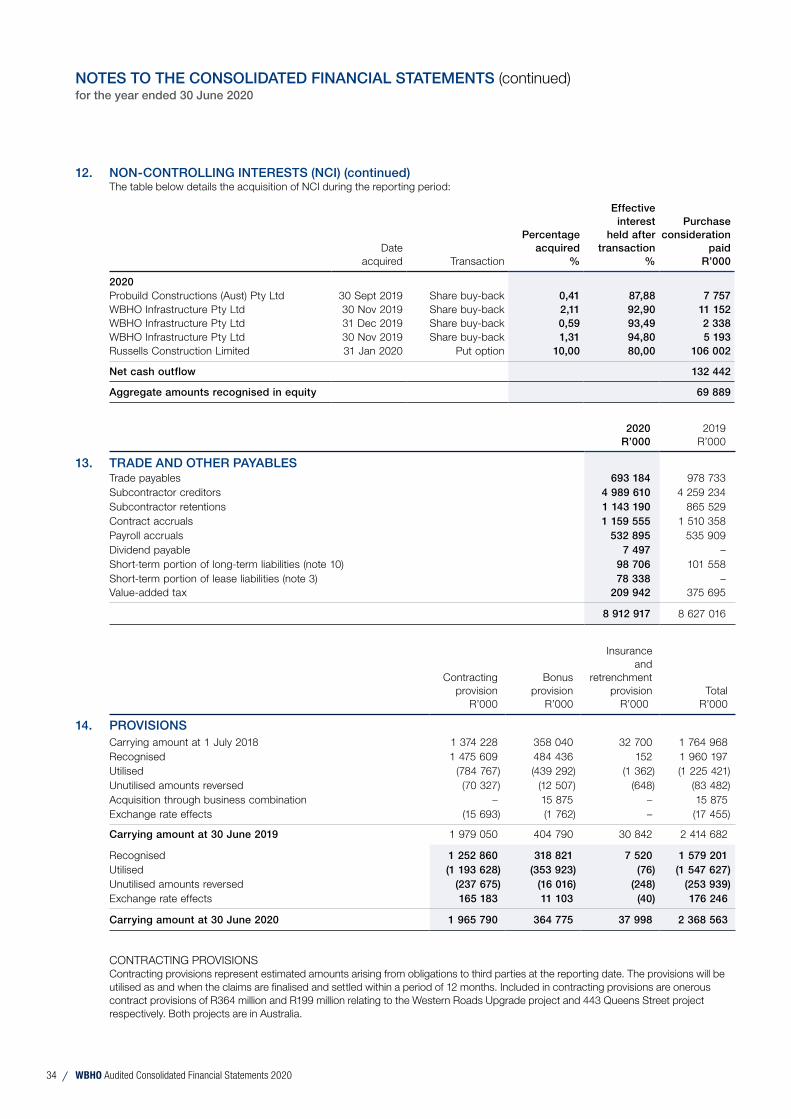
NOTES TO THE CONSOLIDATED FINANCIAL STATEMENTS (continued)for the year ended 30 June 2020
34 WBHO Audited Consolidated Financial Statements 2020
12. NON-CONTROLLING INTERESTS (NCI) (continued)The table below details the acquisition of NCI during the reporting period:
Date acquired Transaction
Percentage acquired
%
Effective interest
held after transaction
%
Purchase consideration
paidR’000
2020Probuild Constructions (Aust) Pty Ltd 30 Sept 2019 Share buy-back 0,41 87,88 7 757WBHO Infrastructure Pty Ltd 30 Nov 2019 Share buy-back 2,11 92,90 11 152WBHO Infrastructure Pty Ltd 31 Dec 2019 Share buy-back 0,59 93,49 2 338WBHO Infrastructure Pty Ltd 30 Nov 2019 Share buy-back 1,31 94,80 5 193Russells Construction Limited 31 Jan 2020 Put option 10,00 80,00 106 002
Net cash outflow 132 442
Aggregate amounts recognised in equity 69 889
2020R’000
2019R’000
13. TRADE AND OTHER PAYABLESTrade payables 693 184 978 733Subcontractor creditors 4 989 610 4 259 234Subcontractor retentions 1 143 190 865 529Contract accruals 1 159 555 1 510 358Payroll accruals 532 895 535 909Dividend payable 7 497 –Short-term portion of long-term liabilities (note 10) 98 706 101 558Short-term portion of lease liabilities (note 3) 78 338 –Value-added tax 209 942 375 695
8 912 917 8 627 016
Contracting provision
R’000
Bonus provision
R’000
Insuranceand
retrenchmentprovision
R’000Total
R’000
14. PROVISIONSCarrying amount at 1 July 2018 1 374 228 358 040 32 700 1 764 968Recognised 1 475 609 484 436 152 1 960 197Utilised (784 767) (439 292) (1 362) (1 225 421)Unutilised amounts reversed (70 327) (12 507) (648) (83 482)Acquisition through business combination – 15 875 – 15 875Exchange rate effects (15 693) (1 762) – (17 455)
Carrying amount at 30 June 2019 1 979 050 404 790 30 842 2 414 682
Recognised 1 252 860 318 821 7 520 1 579 201Utilised (1 193 628) (353 923) (76) (1 547 627)Unutilised amounts reversed (237 675) (16 016) (248) (253 939)Exchange rate effects 165 183 11 103 (40) 176 246
Carrying amount at 30 June 2020 1 965 790 364 775 37 998 2 368 563
CONTRACTING PROVISIONSContracting provisions represent estimated amounts arising from obligations to third parties at the reporting date. The provisions will be utilised as and when the claims are finalised and settled within a period of 12 months. Included in contracting provisions are onerous contract provisions of R364 million and R199 million relating to the Western Roads Upgrade project and 443 Queens Street project respectively. Both projects are in Australia.

35WBHO Audited Consolidated Financial Statements 2020
BONUS PROVISIONThe bonus provision arises from a constructive obligation to staff members, where an annual bonus based on the performance of the Group is calculated. The actual bonus is not guaranteed and must be approved by the Board of directors. The bonuses are finalised and settled within a period of twelve months.
INSURANCE AND RETRENCHMENT PROVISION The balance represents provisions for potential insurance premiums payable based on past claims history. The provisions are utilised within 12 months, once the claims for the current year are finalised. In the reporting period, the Group raised provisions for retrenchment costs in respect of identified employees. The provision is expected to be utilised in the next 12 months.
2020R’000
2019R’000
15. REVENUERecognised over time:Construction revenue 42 274 325 39 707 192Recognised at a point in time:Sale of construction materials 803 433 878 958Sale of properties 2 537 28 147
43 080 295 40 614 297
DISAGGREGATION OF REVENUEInformation in respect of the geographies and sectors from which revenue is recognised is disclosed in the table below:
South AfricaR’000
Rest of AfricaR’000
AustraliaR’000
UnitedKingdom
R’000Total
R’000
2020Construction revenue: Building and civil engineering 6 029 157 466 331 17 659 827 6 452 136 30 607 451 Roads, earthworks and infrastructure 2 743 422 1 926 675 6 996 777 – 11 666 874Sale of construction materials 768 912 34 521 – – 803 433Sale of properties 2 537 – – – 2 537
9 544 028 2 427 527 24 656 604 6 452 136 43 080 295
2019Construction revenue: Building and civil engineering 6 549 896 787 960 16 941 174 5 660 155 29 939 185 Roads, earthworks and infrastructure 3 422 317 1 573 410 4 772 280 – 9 768 007Sale of construction materials 878 958 – – – 878 958Sale of properties 4 728 – – 23 419 28 147
10 855 899 2 361 370 21 713 454 5 683 574 40 614 297
REMAINING TRANSACTION PRICE ALLOCATED TO UNSATISFIED PERFORMANCE OBLIGATIONS The following table discloses construction revenue expected to be recognised in the future related to performance obligations that are unsatisfied or partially unsatisfied at the reporting date.
2021R’000
2022R’000
2023R’000
TotalR’000
2020AfricaBuilding and civil engineering 5 295 704 431 713 130 193 5 857 610Roads and earthworks 3 063 891 1 088 578 370 468 4 522 937AustraliaBuilding 14 707 807 2 088 101 523 744 17 319 652Infrastructure 2 108 362 145 119 – 2 253 481United KingdomBuilding and civil engineering 4 660 057 747 021 – 5 407 078
29 835 821 4 500 532 1 024 405 35 360 758

NOTES TO THE CONSOLIDATED FINANCIAL STATEMENTS (continued)for the year ended 30 June 2020
36 WBHO Audited Consolidated Financial Statements 2020
15. REVENUE (continued) REMAINING TRANSACTION PRICE ALLOCATED TO UNSATISFIED PERFORMANCE OBLIGATIONS (continued)
The following table discloses construction revenue expected to be recognised in the future related to performance obligations that are unsatisfied or partially unsatisfied at the reporting date.
2020R’000
2021R’000
2022R’000
TotalR’000
2019AfricaBuilding and civil engineering 5 269 373 1 041 350 136 122 6 446 845Roads and earthworks 4 333 687 1 190 907 205 038 5 729 632AustraliaBuilding 13 039 762 7 667 130 1 010 038 21 716 930Infrastructure 5 174 822 424 493 – 5 599 315United KingdomBuilding and civil engineering 5 818 301 1 688 778 302 696 7 809 775
33 635 945 12 012 658 1 653 894 47 302 497
2020R’000
2019R’000
16. OPERATING (LOSS)/PROFITOperating (loss)/profit includes the following:Auditors’ remuneration 21 770 15 716Depreciation – property, plant and equipment (note 2) 250 388 283 289Depreciation – right-of-use assets (note 3) 75 865 –IAS 17 Operating lease rentals – 91 876Short-term lease expenses 25 526 –Low-value assets lease expenses 3 734 –Profit on disposal of property, plant and equipment 4 510 5 607
Net foreign exchange gains/(losses)Realised 22 825 16 001Unrealised 72 726 12 782
95 551 28 783
Short-term employee benefitsSalaries and wages 4 701 672 5 150 401Defined benefit contribution expenses 140 102 151 437Medical aid and other contributions 476 166 464 144
5 317 940 5 765 982
Other incomeRental income 9 896 –Insurance claims 24 571 16 078
34 467 16 078
17. FINANCE INCOME AND FINANCE COSTSFinance incomeCash and cash equivalents 149 065 147 400Loans to equity-accounted investees and mezzanine financing arrangements 49 081 45 265Staff loans and SARS interest 2 718 14 347
200 864 207 012
Finance costsBank loans 878 3 423Lease liabilities 22 638 8 217Settlement agreement liability 10 631 11 482Other 866 443
35 013 23 565

37WBHO Audited Consolidated Financial Statements 2020
2020R’000
2019R’000
18. INCOME TAX EXPENSE South African normal taxCurrent tax Current year 40 218 165 896 Prior year over provision (29 446) (46 469)Deferred tax (note 11) Current year 54 915 (20 903) Prior year under provision 12 199 47 278
77 886 145 802
Foreign tax (including withholding tax)Current tax Current year 137 095 119 497 Prior year under provision 21 286 13 313Deferred tax (note 11) Current year (63 596) (75 932) Prior year under/(over) provision 25 250 (3 427)
120 035 53 451
Income tax expense 197 921 199 253
Reconciliation of tax rate: % %South African normal tax rate 28,0 28,0Adjusted for:Capital and non-taxable items: Non-taxable capital gains 3,7 (4,3) Non-taxable share of profits from equity-accounted investees 14,2 (4,5) Unrealised gains and losses on translation of loans 3,2 (0,8)Non-deductible expenses: Capital expenditure (15,2) 7,1 Share-based payment expense (4,0) 1,9 Penalties (1,6) –Foreign tax rate differential 20,5 (4,6)Assessed losses utilised 7,4 (0,3)Prior year under/(over) provision (9,4) 1,4Foreign withholding taxes (6,6) 1,1Deferred tax assets not recognised in respect of losses (104,0) 1,6
Effective tax rate (63,8) 26,6
Estimated tax losses available for utilisation against future taxable income 730 560 808 391
Potential tax relief at current tax rates (note 11) 215 273 221 407
2020R’000
2019R’000
19. DIVIDEND PAIDFinal dividend in respect of the period ended 30 June 2019: 190 cents (30 June 2018: 325 cents) 109 072 184 100There was no interim dividend declared in either reporting period.

NOTES TO THE CONSOLIDATED FINANCIAL STATEMENTS (continued)for the year ended 30 June 2020
38 WBHO Audited Consolidated Financial Statements 2020
2020R’000
2019R’000
20. EARNINGS PER SHARE AND HEADLINE EARNINGS PER SHAREEarning attributable to equity shareholders (497 827) 498 528Weighted average number of shares (‘000)Shares in issue at the beginning of the year 53 171 53 200Allocated shares vested – 3Options vested 8 –Treasury shares acquired (92) (433)Performance shares vested 64 339
Weighted average ordinary shares in issue at the end of the year 53 151 53 109Dilutive effect of Akani shares allocated 11 9
Diluted weighted average number of shares 53 162 53 118
Earnings per share (cents) Basic (936,6) 938,7Diluted (936,4) 938,5
Headline earnings (R’000)Attributable earnings (497 827) 498 528Adjusted for:FCTR recycled through OCI 14 250 –Profit from the disposal of property, plant and equipment (4 510) (5 607)Non-controlling interests in the above transactions 150 826Tax effect of the above transactions (2 786) 1 460Equity-accounted investees:Profit from the disposal of property, plant and equipment (64) (75)Tax effect of the above transactions 18 21
(490 769) 495 153
Headline earnings per share (cents)Basic (923,3) 932,3Diluted (923,2) 932,2
21. GUARANTEES AND CONTINGENT LIABILITIESGuarantees issued for the due performance of contracts on behalf of:Subsidiaries 8 714 851 6 368 821Equity-accounted investees and Joint arrangements 1 366 569 2 496 568Third parties – 3 175
10 081 420 8 868 564
It is the opinion of the directors that the possibility of any loss is improbable and it is not anticipated that any material liabilities will arise.
CONTINGENT LIABILITIESCivil damages to the value of R143 million have been claimed from the City of Cape Town relating to the Cape Town Stadium arising from the investigation by the Competition Commission. The matter is in the early stages of litigation where the outcome cannot be reliably measured.
One matter has been referred to the Competition Tribunal and may result in future civil claims.
Exposures may arise from the normal course of business including potential contractual penalties associated with ongoing construction projects. There is significant uncertainty as to whether a future liability will arise in respect of these items. The amount of a liability, if any, that may arise cannot be measured reliably at this time. The directors are of the opinion that all known liabilities have been recognised and that adequate provision has been made.

39WBHO Audited Consolidated Financial Statements 2020
2020R’000
2019R’000
22. CAPITAL COMMITMENTSCapital commitments include expenditure relating to property, plant and equipment for which specific Board approval has been obtained.Authorised and contracted for 17 955 24 197Authorised but not yet contracted for 240 132 319 455
258 087 343 652
Expenditure on estimated commitments will occur within the next reporting period. Capital commitments will be funded from internal cash resources and existing facilities.
23. COMMITMENTS UNDER OPERATING LEASESThe minimum lease rentals to be paid under non-cancellable leases at the reporting date were as follows:Buildings, plant and equipment:Due within one year – 82 419Due later than one year but less than five years – 253 341Greater than five years – 117 384
– 453 144
Material operating lease commitments related to premises in the United Kingdom and Australia. The lease term for the Byrne Group Limited and Russells Limited, in the United Kingdom, expires on 31 July 2027 and 24 April 2031 respectively. The lease term for the Melbourne premises of Probuild Constructions (Aust) Pty Ltd expires on 31 March 2022. The lease term for the Perth premises of WBHO Infrastructure Pty Ltd expires on 31 December 2020. These leases were capitalised in the current reporting period in terms of IFRS 16 (note 30).
Operating lease commitments of R20,3 million were incorrectly excluded from the operating lease commitments disclosed by the Group in the previous reporting period. The misstatement had no material impact on the Group’s statement of financial position or statement of profit or loss.
2019R’000
RestatementR’000
2019 restated
R’000
Buildings, plant and equipment:Due within 1 year 82 419 16 612 99 031Due later than 1 year but less than 5 years 253 341 3 697 257 038Greater than 5 years 117 384 – 117 384
453 144 20 309 473 453

NOTES TO THE CONSOLIDATED FINANCIAL STATEMENTS (continued)for the year ended 30 June 2020
40 WBHO Audited Consolidated Financial Statements 2020
24. RELATED PARTIES24.1 IDENTIFICATION OF RELATED PARTIES
The Group has related party relationships with its subsidiaries (annexure 1), equity-accounted investees (note 5), joint operations (annexure 2) and directors and executive officers.
24.2 RELATED PARTY TRANSACTIONS AND BALANCESDuring the reporting period, group companies entered into various inter-group sales and purchase transactions in the ordinary course of business. These transactions are on terms no more favourable than those with third parties. Transactions and balances between group companies have, where appropriate, been eliminated on consolidation and are not disclosed.
Details of transactions and balances with related parties are set out below:
2020R’000
2019R’000
Amounts owing by related partiesAmounts owing by equity-accounted investees (note 5) 595 485 697 830Amounts owing by related parties (note 6) 16 810 24 219Amounts owing by joint operators (note 9) 243 863 198 061Amounts owing to related partiesAmounts owing to joint operators 13 681 27 970 The amounts owing to/by joint operators are unsecured, interest-free and have no fixed terms of repayment.Transactions with related partiesContracts with equity-accounted investees 1 576 010 1 443 328Dividends received from equity-accounted investees (note 5) 72 606 21 478
Directors’fees
R’000Salaries
R’000
Incentive bonuses
R’000
Retirement and medical
R’000
Other benefits
R’000
Totalemoluments
R’000
24.3 DIRECTORS’ EMOLUMENTS2020ExecutiveMS Wylie# – 479 – 205 136 820EL Nel+ – 2 113 3 918 660 382 7 073WP Neff* – 1 269 4 746 388 191 6 594CV Henwood – 2 135 3 940 633 449 7 157
– 5 996 12 604 1 886 1 158 21 644
Non-executiveSN Maziya 557 – – – – 557AJ Bester 598 – – – – 598RW Gardiner 840 – – – – 840KM Forbay 455 – – – – 455H Ntene 505 – – – – 505
2 955 – – – – 2 955
Total 2 955 5 996 12 604 1 886 1 158 24 599
2019ExecutiveMS Wylie – 1 158 3 042 524 346 5 070EL Nel – 2 115 4 505 629 407 7 656CV Henwood – 2 001 4 286 596 442 7 325
– 5 274 11 833 1 749 1 195 20 051
Non-executiveSN Maziya 819 – – – – 819AJ Bester 630 – – – – 630RW Gardiner 906 – – – – 906KM Forbay 484 – – – – 484H Ntene 556 – – – – 556
3 395 – – – – 3 395
Total 3 395 5 274 11 833 1 749 1 195 23 446

41WBHO Audited Consolidated Financial Statements 2020
24.4 DIRECTORS’ SHAREHOLDINGThe interests of directors and those of their families in the share capital of the Company are as follows:
2020 2019Number of ordinary shares (‘000) Direct Indirect Total Direct Indirect Total
MS Wylie# – – – – 522 522EL Nel+ 348 1 349 340 1 341WP Neff* 34 – 34 – – –CV Henwood 106 – 106 106 – 106SN Maziya^ – 242 242 – 240 240
488 243 731 446 763 1 209
# Retired on 20 November 2019.* Appointed 20 November 2019.+ CEO July 2019 – November 2019, Chairman December 2019 – June 2020.^ Indirect shares disclosed in the above table represent allocated shares in respect of the empowerment initiative of the Group and do not represent
the number of shares likely to vest upon fulfilment of the vesting conditions. The number of WBHO shares that will ultimately vest is dependent on the market value of the shares on the vesting date, based on a pre-determined threshold. Using the share price at 30 June 2020, the director would receive no shares in terms of the formula.
2020 2019
Long-term incentive scheme (‘000)
Share appreciation
rights Performance
shares Total
Share appreciation
rights Performance
shares Total
EL Nel 87 54 141 76 54 130WP Neff 65 44 109 – – –CV Henwood 84 53 137 71 50 121
236 151 387 147 104 251
SalariesR’000
Incentive bonuses
R’000
Retirement and medical
R’000
Other benefits
R’000
Totalemoluments
R’000
24.5 PRESCRIBED OFFICERS2020PJ Foley 6 397 3 600 1 398 – 11 395S Vally-Kara 1 274 800 337 215 2 626EA Mashishi 1 689 1 600 534 280 4 103SN Gumede 1 821 2 000 385 258 4 464AF de Necker# 1 133 4 125 349 181 5 788CA Jessop# 1 339 3 700 265 206 5 510
13 653 15 825 3 268 1 140 33 886
2019PJ Foley 6 343 3 750 2 515 1 231 13 839S Vally-Kara 1 196 800 320 217 2 533RM Smith^ 1 830 5 500 543 401 8 274EA Mashishi 1 584 2 000 499 282 4 365SN Gumede 1 712 1 800 361 237 4 110
12 665 13 850 4 238 2 368 33 121
# Appointed 1 December 2019.^ Retired 30 June 2019.

NOTES TO THE CONSOLIDATED FINANCIAL STATEMENTS (continued)for the year ended 30 June 2020
42 WBHO Audited Consolidated Financial Statements 2020
24. RELATED PARTIES (continued)24.6 PRESCRIBED OFFICERS’ SHAREHOLDING
The interests of prescribed officers and those of their families in the share capital of the Company are as follows:
2020 2019Number of ordinary shares (‘000) Direct Indirect Total Direct Indirect Total
PJ Foley 102 – 102 102 – 102S Vally-Kara 22 – 22 20 – 20RM Smith^ – – – 90 – 90EA Mashishi 18 – 18 37 – 37AF de Necker 48 – 48 – – –CA Jessop 32 16 48 – – –
222 16 238 249 – 249
2020 2019
Long-term incentive scheme (‘000)
Share appreciation
rights Performance
shares Total
Share appreciation
rights Performance
shares Total
PJ Foley 84 53 137 71 50 121S Vally-Kara 23 21 44 22 18 40RM Smith^ – – – 53 34 87EA Mashishi 56 36 92 37 26 63SN Gumede 13 13 26 6 6 12AF De Necker 62 42 104 – – –CA Jessop 62 42 104 – – –
300 207 507 189 134 323
The long-term incentives are part of the WBHO Share Plan, details of which are disclosed in note 27.
EA Mashishi has a 33% (2019: 33%) interest in Edwin Construction (Pty) Ltd.
There were no other transactions with directors or prescribed officers or entities in which directors or prescribed officers have a material interest. There have been no changes to directors’ shareholdings between the reporting date and the date of this report.
25. FINANCIAL INSTRUMENTS AND FINANCIAL RISK MANAGEMENT25.1 OVERVIEW
The risk management programme of the Group focuses on the unpredictability of financial markets and seeks to minimise potential adverse effects on financial performance.
The Group has exposure to the following risks arising from its use of financial instruments:• credit risk• market risk• liquidity risk
Information is presented on the Group’s exposure to each of the above risks, the objectives, policies and processes for measuring and managing risk and the management of capital. Further quantitative disclosures are included throughout these financial statements.
The Board have overall responsibility for the establishment and oversight of the risk management framework. Risk management policies are established to identify and analyse the risks faced by the Group, to set appropriate risk limits and controls, and to monitor adherence to limits. Risk management policies and systems are regularly reviewed to reflect changes in market conditions and the Group’s activities. Through its training and management standards and procedures, the Group aims to develop a disciplined and constructive control environment in which all employees understand their roles and obligations.
The Risk committee meets on a regular basis to review the management and implementation of risk strategies. The internal audit department undertakes both regular and ad hoc reviews of risk management controls and procedures, the results of which are reported to the Audit Committee. The treasury function monitors and manages liquidity risk on a day-to-day basis.
The Group’s strategy with regards to the management of the risk remains the same as in prior reporting periods and there have been no significant changes to the risk profile of the Group.

43WBHO Audited Consolidated Financial Statements 2020
A summary of financial instruments by category is disclosed in the table below:
Carrying amount
R’000
Financial liabilities
at amortised cost
R’000
Financial assets at
amortised cost
R’000
2020Advanced to equity-accounted investments 301 018 – 301 018Long-term receivables 283 598 – 283 598Contract assets 864 638 – 864 638Trade and other receivables 5 972 843 – 5 972 843Long-term liabilities (305 984) (305 984) –Contract liabilities (2 998 037) (2 998 037) –Trade and other payables (8 702 975) (8 702 975) –Cash and cash equivalents 7 599 344 – 7 599 344
3 014 445 (12 006 996) 15 021 441
2019Advanced to equity-accounted investments 140 281 – 140 281Long-term receivables 345 916 – 345 916Contract assets 1 423 218 – 1 423 218Trade and other receivables 6 333 453 – 6 333 453Long-term liabilities (193 164) (193 164) –Contract liabilities (1 973 535) (1 973 535) –Trade and other payables (8 251 321) (8 251 321) –Cash and cash equivalents 5 951 985 – 5 951 985
3 776 833 (10 418 020) 14 194 853
25.2 CREDIT RISKCredit risk is the risk of financial loss to the Group if a customer or counterparty to a financial instrument fails to meet its contractual obligations and arises principally from the Group’s exposure to long-term receivables, trade and other receivables.
ALLOWANCES FOR EXPECTED CREDIT LOSSES (ECL)The Group provides a loss allowance for estimated ECLs in respect of all financial assets held at amortised cost. The allowance comprises ECLs recognised in respect of the Group’s general portfolio of customers where the nature of those customers, the industries and geographies in which they operate, overdue amounts and any collateral held are considered. ECLs are also recognised in respect of counterparties to long-term receivables in which instance the financial position, payment history and overdue amounts are taken into consideration.
CONTRACT RECEIVABLES AND CONTRACT ASSETSThe Group’s exposure to credit risk is influenced by the individual characteristics of each customer and the inherent risk within the industry and country in which customers operate.
The Group either negotiates for or tenders upon the construction contracts to which it became a contractual party. As a result, the Group is able to evaluate the credit worthiness of prospective clients prior to the commencement of any project. Additionally, for all contracts other than those concluded with entities from within the public sector, the Group insists on receipt of a payment guarantee equal to a proportion of the contract sum. Any relaxation of this policy must be approved by the Credit committee. Where no guarantee has been obtained, the Group generally has a lien over the works.
ECL assessmentLifetime ECLs are recognised for all trade receivables and are measured on a collective basis using the simplified method.
Contract receivables exhibiting similar credit risks and behaviour are grouped together by geography and into the public and private sectors.
The Group retrospectively analyses the aging of its contract and other receivables as well as the rate of default and actual losses incurred over a 36 month period. This period represents the average lifespan of a contract including the defects liability period. From this analysis, the Group determines an historical probability of default (PD) and loss-given default (LGD). Macro-economic forecasts incorporating sovereign credit ratings, gross domestic product (GDP) growth, inflation rates, interest rates, any relevant exchange rate effects and debt-to-GDP ratios in respect of public sector entities, if applicable, are then evaluated for each geography to establish a forward-looking ECL. Judgement is required when assessing the future impact of these forecasts on the customer base of the Group.

NOTES TO THE CONSOLIDATED FINANCIAL STATEMENTS (continued)for the year ended 30 June 2020
44 WBHO Audited Consolidated Financial Statements 2020
25. FINANCIAL INSTRUMENTS AND FINANCIAL RISK MANAGEMENT (continued)25.2 CREDIT RISK (continued) CONTRACT RECEIVABLES AND CONTRACT ASSETS (continued) ECL assessment (continued)
The nature of construction projects undertaken by the Group usually constitute large capital expenditure by customers for which the necessary funding has either been obtained, or provided for, as part of their investment decision. For this reason, PDs and LGDs are historically low and in some cases zero. In Africa, the highest PDs and LGDs are usually experienced within the public and mining sectors. These are also the sectors from which the Group is least likely to obtain any collateral, however the risk of non-payment remains low.
Impact of COVID-19Despite the global lockdown restrictions imposed as a result of COVID-19, the Group did not experience any noticeable deterioration in the collection of receivables over the fourth quarter of the reporting period. The long-term impact on the liquidity and creditworthiness of the Group’s customer base is, however, significantly more uncertain.
LOANS TO EQUITY-ACCOUNTED INVESTEESThe Group is exposed to credit risk through loans advanced to certain entities in which it has a strategic interest. The Group mitigates these risks through assessment by the Credit committee of entities to whom advances are made. The Group owns an equity interest in these entities and is able to influence the decision making.
An amendment to IAS 28, where loans to equity-accounted investees may form part of the net investment in the investee, has been applied in the current year. ECLs on such loans have been derecognised as a result.
LONG-TERM RECEIVABLESThe Group is exposed to additional credit risk through loans advanced to certain entities and employees. The Group mitigates this risk firstly through careful deliberation by the Credit committee as to which entities loans are made available and secondly by obtaining sufficient security to be able to extinguish the debt in the event of default. Loans to employees are predominantly for shares sold or issued in terms of various share schemes and the shares are held as security over the loans advanced.
In determining the PDs and LGDs in respect of long-term receivables, the Group considers the geography and markets in which the counter-party operates as well as past payment history, historical financial information and any collateral held (including the liquidity thereof). Judgement is applied when assessing the potential impact of macro-economic forecasts on each individual credit risk profile.
CONTRACT RECEIVABLES AND CONTRACT ASSETSThe following table provides information about the exposure to credit risk and ECLs for trade receivables and contract assets at 30 June.
Contractreceivables
and retentions
R’000
Contract assetsR’000
TotalR’000
Specificloss
allowanceR’000
Lossallowance
on contract
receivablesand
retentionsR’000
Loss allowance
on contract assetsR’000
Total loss allowance
R’000
Net carrying amount
R’000
2020South Africa 1 106 424 326 875 1 433 299 66 031 12 926 6 069 85 026 1 348 273Rest of Africa 594 145 186 618 780 763 58 452 3 197 672 62 321 718 442
Total Africa 1 700 569 513 493 2 214 062 124 483 16 123 6 741 147 347 2 066 715
Australia 2 436 871 315 773 2 752 644 – 3 920 474 4 394 2 748 250United Kingdom 1 160 254 42 669 1 202 923 – 2 180 82 2 262 1 200 661
Total 5 297 694 871 935 6 169 629 124 483 22 223 7 297 154 003 6 015 626

45WBHO Audited Consolidated Financial Statements 2020
Contract receivables
and retentions
R’000
Contract assetsR’000
TotalR’000
Specific loss
allowanceR’000
Loss allowance
on contract receivables
and retentions
R’000
Loss allowance
on contract assetsR’000
Total loss allowance
R’000
Net carrying amount
R’000
2019South Africa 2 094 940 383 872 2 478 812 58 178 12 798 1 707 72 683 2 406 129 Rest of Africa 621 637 179 763 801 400 86 855 15 188 6 955 108 998 692 402
Total Africa 2 716 577 563 635 3 280 212 145 033 27 986 8 662 181 681 3 098 531Australia 1 999 506 795 842 2 795 348 – 4 301 1 616 5 917 2 789 431United Kingdom 1 276 968 74 175 1 351 143 11 231 2 671 156 14 058 1 337 085
Total 5 993 051 1 433 652 7 426 703 156 264 34 958 10 434 201 656 7 225 047
TRADE RECEIVABLESThe following table provides information about the exposure to credit risk and ECLs for trade receivables at 30 June:
Trade receivables
R’000
Specific loss
allowanceR’000
ECLR’000
Net carrying amount
R’000
2020AfricaSouth Africa 91 458 16 539 3 720 71 199Rest of Africa 111 962 34 93 111 835
Australia 153 582 – 230 153 352United Kingdom – – – –
357 002 16 573 4 043 336 386
2019AfricaSouth Africa 108 093 8 404 3 324 96 365Rest of Africa 11 253 – 388 10 865
Australia 188 366 – 810 187 556United Kingdom 24 619 – 238 24 381
332 331 8 404 4 760 319 167
The following table illustrates the ranges of the metrics utilised to determine the ECL for contract receivables, contract assets and sundry receivables by country:
PD%
LGD%
Historic ECL
%
Conversion to forward-
looking ECL %
FinalECL %
2020
Final ECL %
2019
South Africa (ranges between) 4,11-29,36 5,0-20,0 0,21-5,87 1,5-4,0 0,62-23,48 0,38Australia 0,0 0,0 0,0 0,15 0,15 0,20United Kingdom 0,0 0,0 0,0 0,19 0,19 0,21
Namibia 11,69 5,00 0,58 1,50 0,88 0,60Mozambique 0,13-5,30 5,00 0,2-1,25 1,5-4,0 0,31-2,5 6,77Ghana 0,42-9,79 2,5-5,0 0,01-0,33 1,0-5,0 0,02-0,49 2,67Zambia 3,63-8,8 5,00 0,4-6,3 4,00 1,27-2,51 3,78Guinea 11,83 5,00 0,59 5,00 2,96 1,67Zimbabwe 2,78 5,00 0,14 5,00 0,70 7,83Burkina Faso 1,81 5,00 0,09 5,00 0,14 1,88Lesotho 0,98 5,00 0,05 1,50 0,07 1,90Botswana 1,59 5,00 0,08 1,50 0,12 0,38
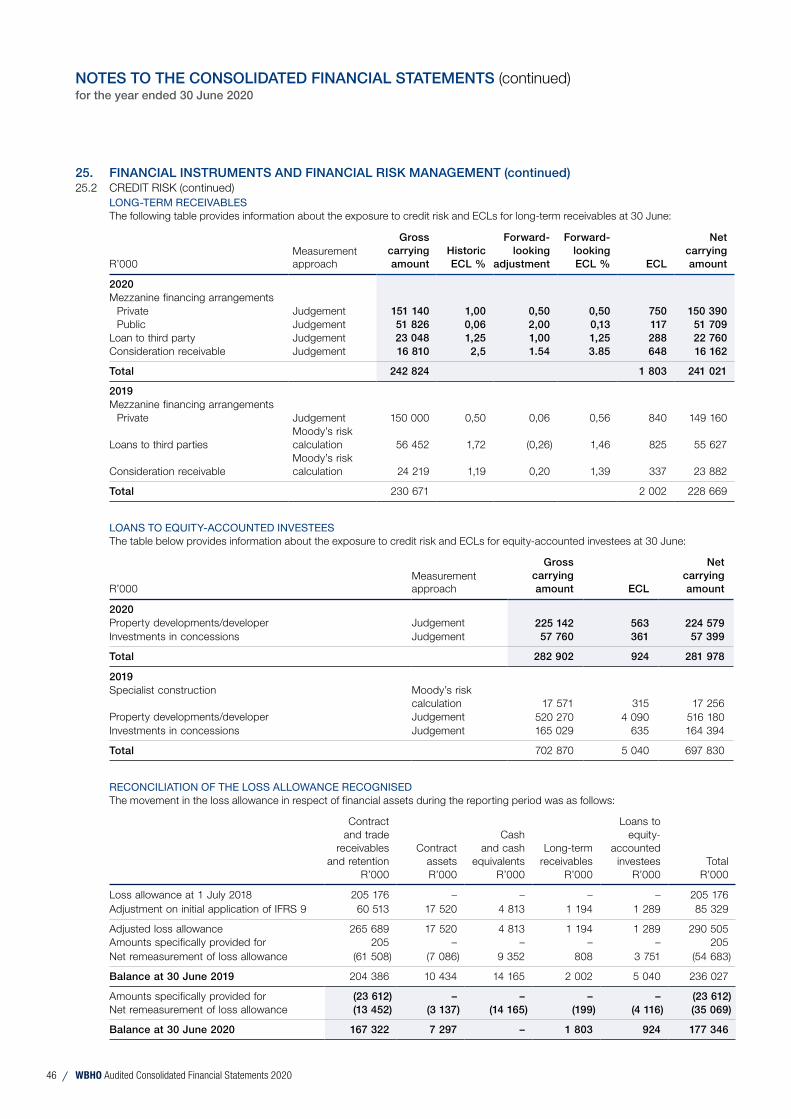
NOTES TO THE CONSOLIDATED FINANCIAL STATEMENTS (continued)for the year ended 30 June 2020
46 WBHO Audited Consolidated Financial Statements 2020
25. FINANCIAL INSTRUMENTS AND FINANCIAL RISK MANAGEMENT (continued)25.2 CREDIT RISK (continued) LONG-TERM RECEIVABLES
The following table provides information about the exposure to credit risk and ECLs for long-term receivables at 30 June:
R’000Measurement approach
Gross carrying
amountHistoric ECL %
Forward-looking
adjustment
Forward-looking ECL % ECL
Net carrying amount
2020Mezzanine financing arrangements
Private Judgement 151 140 1,00 0,50 0,50 750 150 390Public Judgement 51 826 0,06 2,00 0,13 117 51 709
Loan to third party Judgement 23 048 1,25 1,00 1,25 288 22 760Consideration receivable Judgement 16 810 2,5 1.54 3.85 648 16 162
Total 242 824 1 803 241 021
2019Mezzanine financing arrangements
Private Judgement 150 000 0,50 0,06 0,56 840 149 160
Loans to third partiesMoody’s risk calculation 56 452 1,72 (0,26) 1,46 825 55 627
Consideration receivableMoody’s risk calculation 24 219 1,19 0,20 1,39 337 23 882
Total 230 671 2 002 228 669
LOANS TO EQUITY-ACCOUNTED INVESTEESThe table below provides information about the exposure to credit risk and ECLs for equity-accounted investees at 30 June:
R’000Measurementapproach
Gross carrying amount ECL
Net carrying
amount
2020Property developments/developer Judgement 225 142 563 224 579Investments in concessions Judgement 57 760 361 57 399
Total 282 902 924 281 978
2019Specialist construction Moody’s risk
calculation 17 571 315 17 256Property developments/developer Judgement 520 270 4 090 516 180Investments in concessions Judgement 165 029 635 164 394
Total 702 870 5 040 697 830
RECONCILIATION OF THE LOSS ALLOWANCE RECOGNISEDThe movement in the loss allowance in respect of financial assets during the reporting period was as follows:
Contract and trade
receivables and retention
R’000
Contract assetsR’000
Cash and cash
equivalentsR’000
Long-term receivables
R’000
Loans to equity-
accounted investees
R’000Total
R’000
Loss allowance at 1 July 2018 205 176 – – – – 205 176Adjustment on initial application of IFRS 9 60 513 17 520 4 813 1 194 1 289 85 329
Adjusted loss allowance 265 689 17 520 4 813 1 194 1 289 290 505Amounts specifically provided for 205 – – – – 205Net remeasurement of loss allowance (61 508) (7 086) 9 352 808 3 751 (54 683)
Balance at 30 June 2019 204 386 10 434 14 165 2 002 5 040 236 027
Amounts specifically provided for (23 612) – – – – (23 612)Net remeasurement of loss allowance (13 452) (3 137) (14 165) (199) (4 116) (35 069)
Balance at 30 June 2020 167 322 7 297 – 1 803 924 177 346

47WBHO Audited Consolidated Financial Statements 2020
25.3 MARKET RISK (CURRENCY RISK) TRANSACTIONS IN A FOREIGN CURRENCY SETTLED IN THAT FOREIGN CURRENCY
Transactions with certain of the Group’s operations occur in various foreign currencies and consequently the Group is exposed to exchange rate fluctuations that have an impact on cash flows and financing activities. These transactions are entered into in the respective functional currencies of the individual operations and the Group mitigates this risk by settling the transactions with cash balances maintained in the various currencies utilised.
The Groups’ exposure to significant foreign denominated monetary assets and liabilities is as follows:
2020 2019US
Dollar’000
Australian Dollar
’000
BotswanaPula’000
UK Pound Sterling
’000
US Dollar’000
Australian Dollar
’000
BotswanaPula’000
UK Pound Sterling
’000
Trade and other receivables 19 303 235 634 90 143 43 319 21 355 222 087 131 540 70 260Cash and cash equivalents 40 372 301 969 91 917 62 110 60 479 268 817 97 676 45 561Trade and other payables (25 372) (473 205) (54 416) (92 144) (57 846) (485 796) (106 372) (80 537)
34 303 64 398 127 644 13 285 23 988 5 108 122 844 35 284
Closing rate 17.26 11.86 1.46 21.25 14,09 9,89 1,32 17,89Average rate 15.63 10.46 1.40 19.68 14,18 10,15 1,33 18,37
Total cash and cash equivalents held by foreign subsidiaries is R6,0 billion (2019: R4,5 billion).
SENSITIVITY ANALYSISA 10% weakening of the Rand against the following currencies at 30 June would affect, profit or loss in respect of the translation of the balances of the following monetary items by the amounts shown below. The analysis assumes that all other variables, in particular interest rates, remain constant and is applied to the gross exposure at the reporting date.
2020 2019US
Dollar’000
Australian Dollar
’000
BotswanaPula’000
UK Pound Sterling
’000
US Dollar’000
Australian Dollar
’000
BotswanaPula’000
UK Pound Sterling
’000
Trade and other receivables 1 930 23 563 9 014 4 332 2 136 22 209 13 154 7 026Cash and cash equivalents 4 037 30 197 9 192 6 211 6 048 26 882 9 768 4 556Trade and other payables (2 537) (47 321) (5 442) (9 214) (5 785) (48 580) (10 637) (8 054)
3 430 6 439 12 764 1 329 2 399 511 12 285 3 528
A 10% strengthening of the Rand against the above currencies at 30 June would have had the equal but opposite effect to the amount
shown above, on the basis that all other variables remain constant.
25.4 MARKET RISK (INTEREST RATE RISK)The Group has adopted a policy where exposure to interest rate risk is on a floating rate basis linked to market rates on interest-bearing bank deposits, borrowings and loans advanced.
At the reporting date the interest rate profile of the Group’s financial instruments was:
Interest-bearingCarrying amount
R’000
Variable rate
R’000
Fixed rate
R’000
Interest -free
R’000
2020Loans to equity-accounted investees 301 018 – 281 978 19 040Long-term receivables 283 598 271 297 7 996 4 305Trade and other receivables 5 972 843 260 602 8 815 5 703 426Long-term liabilities (305 984) (199 119) (106 865) –Trade and other payables (8 702 975) (155 794) (21 250) (8 525 931)Cash and cash equivalents 7 599 344 7 599 344 – –
5 147 844 7 776 330 170 674 (2 799 160)

NOTES TO THE CONSOLIDATED FINANCIAL STATEMENTS (continued)for the year ended 30 June 2020
48 WBHO Audited Consolidated Financial Statements 2020
25. FINANCIAL INSTRUMENTS AND FINANCIAL RISK MANAGEMENT (continued)25.4 MARKET RISK (INTEREST RATE RISK) (continued)
Interest-bearingCarrying amount
R’000
Variable rate
R’000
Fixed rate
R’000
Interest -free
R’000
2019Loans to equity-accounted investees 140 281 – 122 710 17 571Long-term receivables 345 916 321 151 15 404 9 361Trade and other receivables 6 376 883 – 44 587 6 332 296Long-term liabilities (193 164) (75 681) (117 483) –Trade and other payables (8 251 321) (80 308) (21 250) (8 149 763)Cash and cash equivalents 5 951 985 5 951 985 – –
4 370 580 6 117 147 43 968 (1 790 535)
SENSITIVITY ANALYSISAn increase of 50 basis points in interest rates at the reporting date would have increased or decreased profit for the following year by the amounts shown below. This analysis assumes that all other variables remain constant and is based on closing balances compounded monthly.
2020R’000
2019R’000
Long-term receivables 1 356 2 408Trade and other receivables 1 303 –Cash and cash equivalents 37 997 44 640Long-term liabilities (996) (568)Trade and other payables (779) (792)
38 882 45 688
A 50 basis points decrease in interest rates at 30 June would have had the equal but opposite effect to the amount shown above, on the basis that all other variables remain constant.
25.5 LIQUIDITY RISKLiquidity risk is the risk that the Group will not be able to meet its financial obligations as they fall due.
The Group’s approach to managing liquidity is to ensure, as far as possible, that it will have sufficient liquidity to meet its liabilities under both normal and stressed conditions, without incurring unacceptable losses or risking damage to the Group’s reputation.
Cash flow forecasting within the Group typically ensures that it has sufficient cash available, as well as lines of credit, to meet expected operational expenses including the servicing of financial obligations. The potential impacts of extreme circumstances that cannot reasonably be predicted such as major catastrophes like property damage, business interruption, public liability and political riot are covered by local and group short-term insurance.
The following are the remaining contractual maturities of the Group’s financial liabilities. The amounts are gross and undiscounted, and include contractual interest payments:
< 1 yearR’000
2 – 5 yearsR’000
> 5 yearsR’000
Liabilities measured at amortised cost 2020Bank loans 1 636 124 312 – Settlement agreement liability 21 250 85 000 63 750
22 886 209 312 63 750
2019Settlement agreement liability 21 250 85 000 85 000
21 250 85 000 85 000
The present value of these instruments is R239 million (2019: R293 million).
All other non-derivative liabilities measured at amortised cost are to be settled within 12 months.

49WBHO Audited Consolidated Financial Statements 2020
The contractual maturities of lease liabilities are disclosed in note 3 for leases relating to right-of-use assets and note 10 for leases relating to property, plant and equipment.
The Group expects to meet its other obligations from operating cash flows and proceeds of maturing financial assets, as well as from current cash reserves (note 29.3) currently held at the various financial institutions.
The Group does not at this point require or have any other structured financing facilities in place, apart from asset specific finance agreements (note 10).
26. CAPITAL MANAGEMENTTo provide returns for shareholders and benefits for other stakeholders and to maintain an optimal structure to reduce the cost of capital, the Group policy maintains an adequate capital base.
Capital comprises shareholders’ equity, including capital and reserves. In order to maintain or adjust the capital structure, the Group may adjust the amount of dividends paid to shareholders, return capital to shareholders, issue new shares or sell assets to reduce debt.
The amount of dividends paid by the Group is determined with reference to the liquidity and solvency of the Group giving consideration to budgets and forecasts.
The Group adopts a conservative approach when managing its statement of financial position, assuming low levels of debt and maintaining substantial cash balances. Given the cyclical and often unpredictable nature of the construction environment, this approach is appropriate in providing flexibility during challenging environments and in protecting shareholder value.
2020 2019
Debt/equity ratio (%) 12.0 2,7
This measure has been adjusted to represent the total capitalised interest-bearing liabilities as a percentage of average shareholders’ interest.
27. EMPLOYEE BENEFITS27.1 EQUITY-SETTLED SHARE-BASED PAYMENT THE WBHO SHARE PLAN Share Appreciation Rights (SAR)
Annual allocations determined by the Remuneration Committee are made to participants based on the fair market value of the shares on the allocation date. Rights are available for settlement subject to the achievement of the performance criteria at the vesting date (i.e. in equal thirds on the 3rd, 4th and 5th anniversaries, but need not be exercised until the 7th anniversary). On settlement, the value accruing to the participants is the full appreciation of the share price over the vesting period.
The performance target threshold comprises the average growth in headline earnings per share (HEPS) compared to the average CPI plus 3%, calculated annually in three-year cycles.
Performance Shares (PS)Performance shares are awarded annually to participants for no consideration. Vesting commences on the 3rd anniversary of the award to the extent that the Group has met the specified performance criteria. Being a full value share element without a strike price, the number of shares that vest depend on the performance of the Group over the three year period.
Performance criteria Weight Threshold Target vesting Stretch
Return on capital employed (ROCE) 50% 14% 16% 20%Adjusted ROCE (greater than and equal to 2016 to 2018 issue) 50% 14% 19% 23%Adjusted ROCE (greater than and equal to 2019 issue) 50% 14% 16% 20%Relative total shareholder return (TSR) 50% 7th position 5th position 2nd position
Actual performance against the criteria at 30 June 2019 (Offer 2016) and 30 June 2020 (remaining offers):
Offer 2016 performance
shares
Offer 2017 performance
shares
Offer 2018 performance
shares
Offer 2019 performance
shares
Return on capital employed 18,2% 9,3% 4,0% (4,4%)Relative total shareholder return 5th 2nd 2nd 3rd
In December 2019, 110 014 shares vested in respect of Offer 2016 (119 500 performance shares awarded). The award exceeded the threshold for ROCE and met the target for TSR. As a result 92% of the allocation vested.

NOTES TO THE CONSOLIDATED FINANCIAL STATEMENTS (continued)for the year ended 30 June 2020
50 WBHO Audited Consolidated Financial Statements 2020
27. EMPLOYEE BENEFITS (continued)27.1 EQUITY-SETTLED SHARE-BASED PAYMENT (continued) THE WBHO SHARE PLAN (continued) Performance Shares (PS) (continued)
Number of conditional
awards‘000
Issue date
Issue price
(cents)
Exercise price
(cents) Vesting period
Share-based
payment expense
Future expense
to be recognised
Performance shares2016 120 7/12/2016 14 747 – 3 years 3 043 – 2017 130 7/12/2017 14 676 – 3 years 5 027 2 0942018 147 12/12/2018 14 485 – 3 years 3 936 5 7392019 197 18/11/2019 14 328 – 3 years 2 593 10 743Share appreciation rights2014 137 16/03/2015 10 795 11 540 3 – 5 years – –2016 120 7/12/2016 14 747 14 747 3 – 5 years – –2017 154 7/12/2017 14 676 14 676 3 – 5 years – –2018 147 13/12/2018 14 485 14 485 4 – 5 years 1 760 2 2142019 205 18/11/2019 14 328 14 258 3 – 5 years – –
Total 16 359 20 790
In calculating the share-based payment expense, valuations were performed using the Binomial model. The probability of achieving the TSR performance condition has been measured by a Monte Carlo simulation.
The following assumptions were made in arriving at the share-based payment expense:
PS SARS
Volatility (%) (Volatility has been calculated using the historical WBHO share prices over the vesting periods) n/a 22,1 – 34,6 Risk-free rate (%) n/a 6,9 – 7,4 Dividend yield (%) 1,8 – 2,5 1,8 – 2,5 Attrition rate (%) 0,0 – 5,0 5,0
27.2 THE WBHO MANAGEMENT TRUSTThe trust is a structured entity through which shares are sold to employees with the aim of retaining existing talent within the Group. The trust issues these shares via either a loan or as options to qualifying employees. The share options are equity-settled and are valued using the Binomial model. The following estimates and assumptions were used in the calculation of the share-based payment expense:
Share options
2014
Share options
2016
Grant date share price 115,0 145,0Exercise price 83,1 110,4Volatility (%) (Volatility has been calculated using the historical WBHO share prices over the vesting periods) 23,4 25,0Risk-free rate (%) 7,5 8,5Dividend yield (%) 2,5 2,5Attrition rate (%) 5,0 5,0
27.3 AKANI INVESTMENT HOLDINGS (PTY) LTD AND THE BROAD-BASED EMPLOYEE SHARE INCENTIVE TRUST (BBE TRUST)The Company and trust are structured entities created to give effect to the Group’s Black Economic Empowerment initiative, aimed at sourcing strategic black partners and rewarding employees who have been in the service of the Group for more than five years.
The Akani scheme has a share price growth hurdle in addition to ten and five-year lock-in periods for black partners and employees respectively.
The hurdle rate is defined as being the nominal annual growth rate compounded annually. For the partners the rate is 8,33% and for the employees it is as agreed to by the Board at the time of each allocation of shares.
Over the lock-in periods the shares attract dividends. In respect of directors, one third of the dividend is paid out in cash and two-thirds are utilised to purchase WBHO shares. In respect of employees, the full dividend is utilised to purchase WBHO shares.

51WBHO Audited Consolidated Financial Statements 2020
In calculating the share-based payment expense applicable to the black partners and the BBE Trust it is necessary to estimate the number of shares that may vest at the end of the lock-in and allocation periods respectively. The following assumptions and judgements were used in arriving at the share-based payment expense:
BBE Trust
Black partners
Hurdle rate (%) Variable 8,3 Weighted average expected volatility (%) 24,0 24,0 Weighted average dividend yield (%) 2,7 2,7 Weighted average risk-free interest rate (%) 8,8 8,8 Vesting period (years) 5,0 10,0
The table below provides details of the long-term incentives awarded to employees other than directors and prescribed officers.
WBHO Management
TrustBlack
Partners Employees
Total shares/options allocated (‘000) 1 013 725 1 236Allocations/issues in the current year (‘000) – – 263Dividend shares purchased (‘000) n/a 5 21Vested in the current year (‘000) (10) – (47)Shares purchased (000) – – –Shares to be bought back (000) – – (298)Dividends shares transferred (‘000) – – –Shares available for future allocations (‘000) 2 267 – 380Share-based payment expense recognised (R’000) 14 355 – 13 273Future share-based payment expense (R’000) 20 568 – 31 155Liability recognised to date n/a n/a n/a
27.4 PROBUILD CONSTRUCTIONS (AUST) PTY LTD AND WBHO INFRASTRUCTURE PTY LTD SHARE INCENTIVE SCHEMESShares are acquired by management for full market value at the time of issue and as a result, no share-based payment expense is recognised. Employee loans are recognised for any consideration outstanding (note 6).
28. SEGMENT ANALYSISReportable segments reflect the operating management structure of the Group and are identified both geographically and by the key markets which they serve.
The segments are regularly reviewed by the Group’s chief operating decision maker, defined as the Executive Committee, in order to allocate resources and assess the performance of the segments.
The group has six reportable segments. The activities associated with each segment are noted below:
BUILDING AND CIVIL ENGINEERINGConstruction of retail shopping centres, commercial buildings, hotels, hospitals and residential apartments mostly for the private sector as well as civil engineering related infrastructure for the mining, industrial, energy and oil and gas sectors.
ROADS AND EARTHWORKSActivities include infrastructure and water and gas pipelines and other large infrastructure projects.
AUSTRALIAConstruction of retail, residential and commercial buildings for the private building sector as well as various engineering disciplines, servicing the road and mining sectors and telecommunications.
UNITED KINGDOMConstruction of retail, residential and commercial buildings for the private building sector and building refurbishments and fit-out projects.
PROPERTY DEVELOPMENTS Acquisition of land or the rights to land and the development of schemes with a view to build or sell.

NOTES TO THE CONSOLIDATED FINANCIAL STATEMENTS (continued)for the year ended 30 June 2020
52 WBHO Audited Consolidated Financial Statements 2020
CONSTRUCTION MATERIALSSales and manufacture of long-steel products.
None of the operating segments are aggregated and there are no additional segments to report separately.
Non-current assets by geographic segment are shown net of deferred tax.
Reportable segments
Building and civil
engineeringR’000
Roads and earthworks
R’000
Australia
R’000
UnitedKingdom
R’000
Propertydevelopments
R’000
Constructionmaterials
R’000Total
R’000
2020Revenue 6 495 486 4 979 575 24 656 604 6 452 136 2 537 713 000 43 299 338Inter-segment revenue – – – – – (219 043) (219 043)
Revenue – external customers 6 495 486 4 979 575 24 656 604 6 452 136 2 537 493 957 43 080 295
Operating profit/(loss) before non-trading items 142 397 236 859 (1 198 855) 301 991 510 (24 243) (541 341)Items regularly reported to the Executive committee:Depreciation 26 408 115 152 83 134 86 144 – 15 415 326 253Right-of-use assets capitalised – 6 075 82 766 291 660 – 39 374 419 875Capital expenditure 26 866 116 156 88 788 5 342 – 16 032 253 184
2019Revenue 7 337 856 5 294 683 21 713 454 5 683 574 4 727 976 067 41 010 361Inter-segment revenue – – – – – (396 064) (396 064)
Revenue – external customers 7 337 856 5 294 683 21 713 454 5 683 574 4 727 580 003 40 614 297
Operating profit before non-trading items 304 332 343 092 (335 247) 228 028 715 20 315 561 235Items regularly reported to the Executive committee:Depreciation 21 552 137 442 73 478 44 884 – 5 933 283 289Capital expenditure 37 062 236 547 81 685 13 223 – 5 743 374 260
Geographic segments2020
R’0002019
R’000
RevenueSouth Africa 9 544 028 10 855 899Rest of Africa 2 427 527 2 361 370Australia 24 656 604 21 713 454United Kingdom 6 452 136 5 683 574
43 080 295 40 614 297
Operating profit before non-trading itemsSouth Africa 201 736 475 036Rest of Africa 153 787 193 418Australia (1 198 855) (335 247)United Kingdom 301 991 228 028
(541 341) 561 235
Non-current assetsSouth Africa 1 639 377 1 861 997Rest of Africa 617 885 412 485Australia 1 404 427 1 199 930United Kingdom 1 273 906 798 982
4 935 595 4 273 394

53WBHO Audited Consolidated Financial Statements 2020
2020R’000
2019R’000
29. CASH FLOW INFORMATION29.1 CASH GENERATED FROM OPERATIONS
Operating (loss)/profit before non-trading items (541 341) 561 235Less: Settlement agreement expense (21 250) –Adjusted for non-cash items:Depreciation 326 253 283 289Decrease in loss allowance (42 170) (17 017)Movement in provisions (46 119) 611 440Profit from disposal of property, plant and equipment (4 510) (5 607)
Operating income before working capital changes (329 137) 1 433 340Working capital changes:Increase in inventories (29 543) (42 977)Decrease in contract assets 298 894 508 007Increase/(decrease) in contract liabilities 423 542 (131 150)Decrease/(Increase) in trade and other receivables 342 733 (319 701)Increase in trade and other payables 83 911 19 269
Cash generated from operations 790 400 1 466 788
29.2 INCOME TAXNet asset receivable at 1 July 152 053 105 169Current tax expense (169 153) (253 563)Provision for penalties (17 525) –Acquired through a business combination – (26 806)Net asset receivable at 30 June (136 813) (152 053)
Income tax paid (171 438) (327 253)
29.3 LEASE LIABILITIESLiabilities outstanding at 1 July 153 897 177 107Additions 550 277 151 026Finance costs 15 897 –Foreign currency effect 62 859 (3 273)Liabilities outstanding at 30 June (593 550) (153 897)
Lease liabilities paid 189 380 170 963
Restricted cash balances of R141,6 million (2019: R87,7 million) relate to monies held in trust on behalf of subcontractor retentions in Australia.
30. CHANGES IN ACCOUNTING POLICIES IFRS 16: LEASES
IFRS 16 was effective from 1 January 2019 and adopted by the Group on 1 July 2019.
IFRS 16 supersedes the previous standards relating to the accounting treatment of leases (IAS 17: Leases and IFRIC 4: Determining whether an arrangement contains a Lease). Under IAS 17, lessees were required to classify a lease as either a finance lease or an operating lease. Assets under a finance lease were capitalised as property, plant and equipment and a finance lease liability was recognised under current and non-current liabilities as appropriate. Leases classified as operating leases did not result in the recognition of the underlying asset as property, plant and equipment or a lease liability. The operating lease rentals were expensed through profit or loss on a straight-line basis over the period of the lease.
IFRS 16 does not distinguish between finance leases and operating leases in respect of lessees; instead a right-of-use assets and corresponding lease liability is recognised in respect of each lease, with the exception of those leases that qualify for the low value asset or short-term lease exemption.

NOTES TO THE CONSOLIDATED FINANCIAL STATEMENTS (continued)for the year ended 30 June 2020
54 WBHO Audited Consolidated Financial Statements 2020
30. CHANGES IN ACCOUNTING POLICIES (continued) IFRS 16: LEASES (continued)
The Group has adopted IFRS 16 using the modified retrospective approach and therefore, the comparative information has not been restated and continues to be reported under IAS 17 and IFRIC 4. The Group recognised right-of-use assets equal to the lease liabilities at 1 July 2019, adjusted for any prepaid or accrued lease payments relating to leases recognised in the statement of financial position as at 1 July 2019.
For contracts in place on 1 July 2019, the Group elected not to reassess whether a contract is, or contains a lease. The Group applied the following practical expedients on adoption of IFRS 16, as permitted by the standard:• the application of a single discount rate to a portfolio of leases with reasonably similar characteristics; • leases with remaining lease terms of less than 12 months at 1 July 2019 were accounted for as short-term leases;• the exclusion of initial direct costs from the measurement of right-of-use assets on 1 July 2019; and• the use of hindsight in determining the lease term if the contract contained options to extend or terminate the lease.
The Group’s incremental borrowing rate applied on 1 July 2019 is specific to each geographical region and is disclosed in the below table.
The Group sub-lets a property in Australia. Under IAS 17, the head lease and sub-lease contract were classified as operating leases. On transition to IFRS 16, an amount equal to the net investment in the sublease is derecognised from the right-of-use asset recognised in respect of the head lease, and a lease receivable is recognised instead. The Group assessed the classification of the sub-lease contract with reference to the right-of-use asset rather than the underlying asset, and concluded that it is a finance leases under IFRS 16.
The Group enters into leases in respect of buildings and vehicles which have been disclosed in note 3.
At transition date, the Group recognised right-of-use assets to the value of R407 million and lease liabilities of R422 million. On initial application, an amount of R4,5 million was recognised in retained earnings resulting from the difference of the lease receivable at its present value of R18 million and the lease liability of R13,5 million recognised on 1 July 2019, in respect of the sub-lease.
During the course of the audit, additional leases were identified which existed at transition date, but were not included in the interim financial statements of the Group. In addition, errors were identified in the adoption of IFRS 16 relating to the Australian business. As a result, the right-of-use assets and lease liabilities disclosed in the interim financial statements are different to the amounts disclosed in these financial statements. The differences are not considered to be material.
South AfricaRest of
Africa AustraliaUnited
Kingdom Total
Analysis of operating leases previously recognised under IAS 171 July 2019Number of leases 172 1 10 38 221Average remaining lease term (years) – buildings 1 3 2 9 15Average remaining lease term (years) – vehicles – – – 2 2 Incremental borrowing rate (%) 10,3% 14,7% 4,5% 3,5%Number of leases regarded as short-term or low-value assets 161 – 3 1 165 Undiscounted value of leases regarded as short-term leases (R’000) 19 924 – 2 301 63 22 288Undiscounted value of leases regarded as low-value assets leases (R’000) 7 545 – – – 7 545

55WBHO Audited Consolidated Financial Statements 2020
South AfricaR’000
Rest ofAfricaR’000
AustraliaR’000
United Kingdom
R’000Total
R’000
Operating lease commitments at 30 June 2019 40 339 3 381 101 067 308 357 453 144 Add: lease commitments not disclosed at 30 June 2019* 20 309 – – – 20 309
Restated operating lease commitments at 30 June 2019 60 648 3 381 101 067 308 357 473 453
Discounted lease commitments (excluding extension options) 49 200 – 66 192 289 076 404 468Add: Lease liabilities relating to extension options reasonably certain to be exercised 19 784 2 775 22 396 – 44 955 Less: recognition exemption for discounted short-term and low-value asset leases (26 049) – (2 274) (62) (28 385)
Lease liabilities recognised on 1 July 2019 42 935 2 775 86 314 289 014 421 038Lease liabilities at 30 June 2020 37 726 3 663 84 302 304 983 430 674 Less: Current portion (6 379) (1 698) (27 514) (42 747) (78 338)
Non-current portion 31 347 1 965 56 788 262 236 352 336
* Operating lease commitments of R20,3 million were erroneously excluded from the operating lease commitments disclosed by the Group in the prior reporting period. The misstatement had no material impact on the Group’s statement of financial position or statement of profit or loss.
The change in accounting policy affected the following line items in the statement of financial position at 1 July 2019:
At 30 June 2019R 000
IFRS 16 effectR 000
At 1 July 2019
R 000
ASSETSNon-current assetsLong-term receivables 346 253 14 571 360 824Right-of-use assets – 406 775 406 775Current assetsTrade and other receivables 6 716 352 1 610 6 717 962 Equity and liabilitiesRetained earnings 5 843 621 3 846 5 847 467Non-controlling interests 261 645 662 262 307Non-current liabilitiesLease liabilities 193 164 360 220 553 384Current liabilitiesTrade and other payables 8 627 016 58 228 8 685 244
The impact of IFRS 16 on the statement of financial performance and other comprehensive income for the year ended 30 June 2020 is as follows:
R’000
Depreciation of right-of-use assets (75 865)Income from sublease 4 371 Lease payments associated with the right-of-use assets 84 786
Impact on operating loss 13 292 Finance costs on lease liabilities (15 898)Finance income on lease receivables 743 Income tax expense (13)
Impact on loss for the year (1 876)

NOTES TO THE CONSOLIDATED FINANCIAL STATEMENTS (continued)for the year ended 30 June 2020
56 WBHO Audited Consolidated Financial Statements 2020
31. FINANCIAL IMPACT OF COVID-19 The following non-recoverable costs and expenses directly attributable to the COVID-19 pandemic were incurred during the year:
Building and Civil
engineeringR’000
Roads and earthworks
R’000
Construction materials
R’000Australia
R’000
United Kingdom
R’000Total
R’000
Payroll expenditure 89 007 89 788 3 225 25 652 25 015 232 687Other non-recoverable expenditure 17 852 44 836 929 1 254 17 590 82 461Direct COVID-19 related costs 6 971 12 623 404 19 944 9 683 49 625
113 830 147 247 4 558 46 850 52 288 364 773Provision for retrenchment 15 341 8 888 – –* 8 124 32 353
Total 129 171 156 135 4 558 46 850 60 412 397 126
* The Australian business incurred AU$4,7 million in retrenchment costs as a result of the delayed award of projects due to COVID-19. Existing balance sheet provisions were utilised against the expense.
A resurgence in COVID-19 infections in Australia and the UK in the first half of the new reporting period have resulted in stricter lockdown restrictions being implemented. Productivity was heavily impacted within the building business in Melbourne where a hard lockdown was implemented between 9 August 2020 and 27 September 2020, however productivity in the UK has been disrupted to a lesser extent as no projects have been suspended and subcontractors have remained on site.
32. GOING CONCERNWith such high levels of uncertainty within economic markets, it is exceptionally difficult to predict what the ultimate outcome of COVID-19 on the Group will be, however in assessing going concern the directors have considered the following information:• The extent of provisioning on onerous contracts and associated future cash outflows;• The 12 month budget to 30 June 2021 and the Group’s updated forecast in respect thereof at the date of these consolidated annual
financial statements;• The impact of COVID-19 on the secured order book; • New order intake between the end of the reporting period and the date of these consolidated annual financial statements;• Imminent project awards expected within three months of the date of these consolidated annual financial statements;• The number and availability of short- and mid-term projects in the forward-looking pipeline;• The effects of steps already taken to reduce the fixed-cost base of the Group;• The level of external debt;• Available financial facilities and existing cash reserves; and• 12 month rolling cash flow forecasts taking into account the expected funding of the Australian operations.
While the Group incurred substantial losses over the reporting period, cash generated from operations remained healthy amounting to R790 million compared to R1,5 billion generated in the comparative period. While it is anticipated that the overall liquidity of the Group will be constrained over the short-term, the substantial cash reserves at 30 June 2020 will allow the Group to adequately manage its liquidity position. The net tangible asset value (shareholders’ equity less goodwill) of the Group amounts to R4,6 billion.
Following the poor performance of the South African construction industry as a whole, the banking sector has sought to reduce its exposure. However, due to its balance sheet strength, low levels of external debt and healthy cash reserves, the Group has maintained its strong relationships and ongoing support from guarantee providers. The Group continues to operate within its facility limits and has access to asset finance facilities to fund capital expenditure where necessary. The debt-equity value of the Group at 30 June 2020 was 12%.
In respect of future work, a noticeable uptick in activity was visible in the first quarter of FY2021 and the Group has secured new projects to the value of R9,4 billion between the end of the reporting period and the date of these consolidated annual financial statements. Due to the long-term duration of construction projects, these awards provide the Group with sufficient work over the next 12 months. The right-sizing of the business implemented over the first quarter of the new financial year is considered appropriate for the volume of work-on-hand and anticipated awards. Nonetheless, capacity within each of the regions in which the Group operates will continue to be monitored and any required further right-sizing of the various divisions and businesses will be pro-actively implemented. While it is anticipated that the overall liquidity of the Group will be constrained over the short-term, the cash reserves of R7,6 billion will allow the Group to adequately manage its liquidity position.

57WBHO Audited Consolidated Financial Statements 2020
In respect of medium-term prospects, the South African, Australian and UK governments have all committed to widespread public infrastructure development as part of the economic stimulus packages aimed at relieving the devastating effects of COVID-19 on economies. The Roads and earthworks and Civil engineering divisions in South Africa and WBHO Infrastructure in Australia are well-positioned to participate in these stimulus packages. In the UK, the Byrne Group has been positioning itself for public infrastructure spend for some time and has developed good relationships with various EPC contractors bidding for work on the HS2 rail project. Russells-WBHO also gained entry onto its first public sector framework which comprises a framework of pre-tendered agreements with a range of suppliers from which public sector customers can purchase goods and services. The gas-related infrastructure project in Mozambique (the largest infrastructure project ever in Africa) as well the renewable energy sector and a number of large-scale public-private partnerships in South Africa also offer real prospects of future work.
Having given due consideration to the above information, the directors are satisfied that the Group has access to adequate resources to continue in operational existence for the foreseeable future. As such, the going concern basis has been applied in preparing the consolidated financial statements.
33. EVENTS AFTER THE REPORTING DATEOn 3 June 2020 the Group advised stakeholders of an unsolicited indicative, non-binding and conditional proposal from a major international construction and civil services company to acquire the Group’s interest in Probuild Constructions Pty Ltd (Probuild), the Australian building business.
The Group has received numerous unsolicited approaches for the Probuild over recent years.
The emerging increased size and complexity of projects in Australia presents a growing risk to the South African balance sheet to support the future of the Australian businesses. This prompted a decision to engage the latest unsolicited proposal.
At 30 June 2020, negotiations had not progressed sufficiently for the sale to be considered highly probable.
Subsequent to the end of the reporting period, principle agreement was reached on the majority of the key terms to be included in the transaction documents. While negotiations are materially advanced, the proposed transaction remains subject to the finalisation and execution of the binding transaction documentation as well as various counterparty, regulatory and shareholder approvals. Probuild management in Australia have been intimately involved in the proposed transaction and are committed to completing the necessary steps to reach finalisation.
The Board is not aware of any other matter or circumstance arising since the reporting date not otherwise dealt with in the consolidated financial statements, which significantly affects the financial position of the Group as at 30 June 2020 or the results of its operations or cash flows for the year then ended.

58 WBHO Audited Consolidated Financial Statements 2020
ANNEXURE 1: INVESTMENTS IN SUBSIDIARIESfor the year ended 30 June 2020
Effective holding
Country of Issued 2020 2019Incorporation capital % %
Held directlyWBHO Construction (Pty) Ltd South Africa R900 000 100 100WBHO Industrial Holdings (Pty) Ltd South Africa R1 100 100
Structured entitiesWBHO Management Trust South Africa – – WBHO Share Trust South Africa – – WBHO Broad-based Employee Share Incentive Trust South Africa – – Akani Investment Holdings (Pty) Ltd South Africa R34 936 31 31
Held indirectlyRoadspan Surfaces (Pty) Ltd South Africa R10 000 100 100St Francis Links (Pty) Ltd South Africa R100 80 80Capital Africa Steel (Pty) Ltd South Africa R235 861 100 100Tekfalt Binders (Pty) Ltd South Africa R100 100 60Balmoral Crushers (Pty) Ltd South Africa R120 100 100WBHO Construction Sierra Leone Limited Sierra Leone US$23 000 100 100WBHO Guinea (SA) Limited Guinea Fr100 000 000 100 100WBHO Mozambique Projectos Limitada Mozambique MZN10 000 000 100 100WBHO Namibia (Pty) Ltd Namibia N$1 100 100WBHO Construction Zambia Limited Zambia ZMW10 000 100 100Kalcon (Pty) Ltd Botswana P2 100 100WBHO Ghana (Pty) Ltd Ghana $500 000 100 100WBHO Australia Pty Ltd Australia AU$166 348 944 100 100WBHO Infrastructure Pty Ltd Australia AU$22 402 349 94,8 90,7Monaco Hickey Pty Ltd Australia AU$6 000 000 70,3 70,0Probuild Constructions (Aust) Pty Ltd Australia AU$48 862 421 87,9 87,5WBHO UK Limited England GBP100 100 100Byrne Group Limited England GBP2 137 400 80 80Russells Limited England GBP750 80 70
Investments in insignificant subsidiaries are not disclosed.

59WBHO Audited Consolidated Financial Statements 2020
Investments in significant non-statutory entitiesCountry of operation
2020%
2019%
Kusile Civils Joint Venture South Africa 50,0 50,0WBHO/Tiber 144 Oxford St Joint Venture South Africa 50,0 50,0WBHO/Gateway Joint Venture South Africa 90,0 90,0Umhlanga Arch Joint Venture South Africa 90,0 90,0WBHO/Thekwane Joint Venture South Africa 70,0 70,0Oceans Joint Venture South Africa 70,0 70,0Masibuyisane Joint Venture South Africa 75,0 75,0WBHO/Motheo Joint Venture South Africa 62,0 62,0Sisonke Joint Venture South Africa 70,0 70,0Watt Street Interchange Joint Venture South Africa 80,0 80,0Mdubane Joint Venture South Africa 60,0 60,0WBHO ATM Development Joint Venture South Africa 50,0 50,0Jewel City Joint Venture South Africa 50,0 50,0WBHO LKT Joint Venture South Africa 92,5 –WBHO/Orapa FRD Joint Venture Botswana 70,0 70,0WBHO/LSP Joint Venture Lesotho 60,0 60,0WBHO/AGT Joint Venture Swaziland 50,0 50,0
All joint operations listed above are engaged in construction activities.
ANNEXURE 2: INTERESTS IN JOINT OPERATIONSfor the year ended 30 June 2020

60 WBHO Audited Consolidated Financial Statements 2020
Shareholder spreadNumber of
shareholdings %Number of
shares %
1 – 1 000 shares 2 425 72,69 546 824 0,911 001 – 10 000 shares 558 16,73 1 955 990 3,2710 001 – 100 000 shares 278 8,33 9 418 096 15,73100 001 – 1 000 000 shares 65 1,95 21 828 798 36,451 000 001 shares and over 10 0,30 26 140 806 43,64
Total 3 336 100,00 59 890 514 100,00
Distribution of shareholdersBanks/brokers 88 2,64 9 941 606 16,60Close corporations 16 0,48 9 366 0,02Empowerment 4 0,12 3 667 770 6,12Endowment funds 20 0,60 115 037 0,19Individuals 2 331 69,87 2 951 257 4,93Insurance companies 43 1,29 3 935 465 6,57Investment companies 4 0,12 1 070 003 1,79Medical schemes 21 0,63 195 270 0,33Mutual funds 189 5,67 15 528 004 25,93Other corporations 19 0,57 16 238 0,03Private companies 48 1,44 310 954 0,52Public Companies 2 0,06 283 0,00Retirement funds 258 7,73 16 456 821 27,48Share trusts 3 0,09 3 643 634 6,08Treasury stock 1 0,03 187 870 0,31Trusts 289 8,66 1 860 936 3,10
Total 3 336 100,00 59 890 514 100,00
Public/non-public shareholdersNon-public shareholders 14 0,42 17 168 290 28,67
Directors and associates 5 0,15 383 232 0,64Strategic holders holding more than 10% 1 0,03 9 285 784 15,52Empowerment vehicles 4 0,12 3 667 770 6,12WBHO share and management trusts 3 0,09 3 643 634 6,08Treasury stock 1 0,03 187 870 0,31
Public shareholders 3 322 99,58 42 722 224 71,33
Total 3 336 100,00 59 890 514 100,00
Beneficial shareholders holding 3% or moreGovernment Employees Pension Fund 11 000 316 18,37Allan Gray (Pty) Ltd 4 301 979 7,18Old Mutual 8 587 220 14,34Akani Investment Holdings (Pty) Ltd 3 667 770 6,12WBHO Management Trust 3 601 259 6,01Dimensional Fund Advisors 1 974 215 3,30
Total 33 132 759 55,32
Geographical breakdownSouth Africa 3 196 95,80 47 884 147 79,95United States of America and Canada 26 0,78 7 521 360 12,56United Kingdom 38 1,14 1 596 963 2,67Rest of Europe 18 0,54 839 496 1,40Rest of the world 58 1,74 2 048 548 3,42
Total 3 336 100,00 59 890 514 100,00
ANNEXURE 3: SHAREHOLDERS’ ANALYSISfor the year ended 30 June 2020

NOTES

A WBHO Audited Consolidated Financial Statements 2020
WWW.WBHO.CO.ZA